

It is uncontroversial that good political representation is crucial for the functioning of democracy. But how do citizens want to be represented in politics? A growing body of literature investigates citizens’ preferences regarding representation (e.g., Costa Reference Costa2021; Wolak Reference Wolak2017; Arnesen, Duell, and Johannesson Reference Arnesen, Duell and Johannesson2019; Harden Reference Harden2015; Bengtsson and Wass Reference Bengtsson and Wass2010; Barker and Carman Reference Barker and Carman2012). It aims to understand how citizens relate to well-known conceptions of representation that have been used in empirical work, such as substantive and descriptive representation (Pitkin Reference Pitkin1967) or delegate versus trustee representation (e.g., Eulau et al. Reference Eulau, Wahlke, Buchanan and Ferguson1959).
However, recent work in political theory suggests that conventional ways of conceptualizing representation may conceal important complexities and miss crucial additional dimensions of representation (see Mansbridge Reference Mansbridge2003; Rehfeld Reference Rehfeld2009; Saward Reference Saward2010; Wolkenstein and Wratil Reference Wolkenstein and Wratil2021). This means that citizens’ preferences for representation might also be more complex and multidimensional than we assume. For instance, voters might not only value that a representative has the same substantive policy positions or the same gender as themselves. They may also value the degree to which there is a direct electoral relationship between them and their representatives or the degree to which their representatives act as individuals, rather than members of a party, to cite just two examples (Wolkenstein and Wratil Reference Wolkenstein and Wratil2021).
If we accept a multidimensional view of representation, then our current understanding of citizens’ preferences towards representation is likely to miss important parts of the picture. Much existing work only considers citizens’ preferences regarding one or two dimensions of representation (e.g., Bowler Reference Bowler2017; Carman Reference Carman2007; Rosset, Giger, and Bernauer Reference Rosset, Giger and Bernauer2017), and where more dimensions are considered (e.g., Wolak Reference Wolak2017; Harden Reference Harden2015; Bengtsson and Was, Reference Bengtsson and Wass2010; Bøggild Reference Bøggild2020), it usually remains unclear which dimensions matter most to citizens (but see Costa Reference Costa2021). Yet if citizens’ preferences are potentially multidimensional, it is crucial to understand which dimensions are more important to them, relative to others. It is crucial for predicting how citizens might assess trade-offs in finding good representatives. For instance, is the better representative one elected in another district who shares your policy views on a given issue, or one that does not share your views but is elected in the constituency in which you live?
In this article, we make four contributions. First, we provide a theoretical case, based on the constructivist turn in representation (Saward Reference Saward2010; Disch Reference Disch2021), for why citizens’ views on representation should play a greater role in research on political representation. Second, integrating theoretical and empirical literatures, we present a conceptual framework for studying representation preferences that distinguishes six key conceptions of representation: substantive representation, descriptive representation, surrogation, justification, personalization, and responsiveness. To our knowledge, two of them—surrogation and justification—have never been addressed in the literature on citizens’ representation preferences. Third, we present two original measurement instruments: 1) a new set of item batteries that allows us to measure citizens’ preferences on each of the dimensions, and 2) a novel paired-comparison conjoint survey experiment that allows us to assess the relative importance of the six dimensions for citizens’ evaluations of their political representatives. Fourth, we field these instruments to survey respondents from three major Western democracies with different representation-affecting institutional features—the United States, the United Kingdom, and Germany. We therefore provide one of the first studies looking at citizens’ preferences on various dimensions of representation across national contexts, while cross-national work has mostly focused on one dimension only (e.g., Bowler Reference Bowler2017; Rosset, Giger, and Bernauer Reference Rosset, Giger and Bernauer2017).
Our findings have important implications for the empirical study of political representation. First, compared to the other dimensions of representation, descriptive representation plays a relatively limited role in citizens’ evaluations of representatives, being only the fourth most important of the six dimensions. However, members of historically marginalized groups value descriptively congruent representatives more, making the dimension rank in third place among people with ethnic/racial minority or migratory background. Second, personalization—understood as representatives’ relative independence from their party—matters a great deal to citizens, implying that researchers should explore the appeal of this conception in greater depth in the future. Third, citizens are mostly indifferent about whether they are represented by someone from their own electoral district, but they do care about being represented by a member of their preferred party. This suggests that if scholars want to understand how citizens assess representation, they should pay more attention to non-electoral relationships between voters, their chosen representatives, and parties. Many citizens may see someone as their representative whom they never had a chance to vote for. Fourth, once we conceptually separate responsiveness qua representatives’ sensitivity to the threat of electoral sanctions from substantive representation qua representatives’ propensity to advance their constituents’ policy preferences, it emerges that it is substantive representation and not responsiveness that voters deem relevant. This suggests that we should critically reflect on the great attention that representation scholars usually pay to electoral accountability and “rational anticipation” (e.g., Erikson, MacKuen, and Stimson Reference Erikson, MacKuen and Stimson2002; Mansbridge Reference Mansbridge2003). Finally, citizens’ representation preferences vary by important covariates such as age, ethnicity/race, and trust, inviting scholars to study how different groups want to be represented differently and why.
Why Study Representation Preferences?
There are several good reasons for studying citizens’ representation preferences. For one, if we as political scientists are committed to taking seriously what our fellow citizens think—if we believe, as Sabl (Reference Sabl2015, 355) puts it, that “what ordinary people value is worth a provisional respect”—then we should also have an interest in exploring how citizens want to be represented by elected politicians. A more specific theoretical argument is available, too. This is inspired by the innovative new “constructivist” theories of political representation (major statements are found in Disch Reference Disch2021; Saward Reference Saward2010).
Unlike conventional theories of representation, constructivism foregrounds the performative and creative aspects of political representation. As Saward (Reference Saward, Castiglione and Pollak2019, 271) puts it, constructivism assumes that “representation’s political presence arises primarily by virtue of its being done—practiced, performed, claimed. Representative roles and relations gain a presence in our politics because … actors make claims to speak for others.” For constructivists, it is not elections that bring representative relationships into existence, but a “claim” by an actor to speak on behalf of a particular group. Importantly, the addressees of such claims are also thought to play an active role in co-constituting representative relationships. Indeed, for constructivists, “[a]udiences accepting (or rejecting or contesting or ignoring) representative claims is a crucial part of the dynamics of political representation” (Saward Reference Saward2010, 27).
For many constructivists, moreover, the legitimacy of representation hinges on whether a political actor’s “claim” to speak for a particular constituency is accepted, rather than, say, rejected or ignored, by that constituency (Montanaro Reference Montanaro, Castiglione and Pollak2019, 193-94; Saward Reference Saward2010, 146). Indeed, some argue that “[g]iven the burdens of judgment and the extraordinarily difficult epistemological issues involved in forging independent criteria of legitimacy” (Saward Reference Saward2010, 146), this is the most democratic way of ascertaining whether a representative relationship is legitimate (also see Wolkenstein Reference Wolkenstein2024, 283-6). As Saward (Reference Saward, Castiglione and Pollak2019, 288) suggests,
[d]emocracy, whatever else it may require, is based on popular power or control, so in principle evident acceptance of representative claims by the relevant constituency is the key, with no necessary or decisive place for independent criteria of, for example, what might make for a good representative. … Evidence of an accepted or authorized claim to representation can be taken, contingently, as an example of democratic representation.
Such acceptance will only be forthcoming, however, when what politicians say and do resonates with citizens’ normative expectations about political representation, that is, how they want their representatives to present themselves and act in public. Note that conventional “selection models” of representation make similar assumptions, conjecturing that citizens seek out “good representative types” by using various personal characteristics as cues for how well politicians might represent them (see Fearon Reference Fearon, Przeworski, Stokes and Manin1999, 59; Mansbridge Reference Mansbridge2009, 381).
If this is correct, then studying how citizens would like to be represented by political actors promises to teach us a lot about why and when claims to representation may be viewed as legitimate. Indeed, as Wass and Nemčok (Reference Wass and Nemčok2020) put it, a sound understanding of citizens’ expectations of representatives and whether representatives fulfill these expectations “is important knowledge for those interested in the legitimacy of democratic processes” (333) more generally. If we treat representation as a relationship that is co-constituted by citizens and politicians, then it could even be argued that the representation preferences of citizens should influence which aspects of representation we empirically study. After all, if certain aspects are relatively unimportant to citizens, studying them will not tell us much about the legitimacy of representation.
Existing Work on Representation Preferences
Thus far, the literature on citizens’ representation preferences only makes up a small subset of the overall literature on representation (e.g., see Arnesen, Duell, and Johannesson Reference Arnesen, Duell and Johannesson2019; Wolak Reference Wolak2017; Campbell et al. Reference Campbell, Cowley, Vivyan and Wagner2019; Costa Reference Costa2021; Harden Reference Harden2015; McMurray and Parsons Reference McMurray and Parsons1965; Vivyan and Wagner Reference Vivyan and Wagner2016; Bowler Reference Bowler2017; Méndez-Lago and Martínez Reference Méndez-Lago and Martínez2002; Carman Reference Carman2006; Rosset, Giger, and Bernauer Reference Rosset, Giger and Bernauer2017; Bøggild Reference Bøggild2020; Wass and Nemčok Reference Wass and Nemčok2020). The question most often addressed in this literature is arguably whether citizens prefer either the trustee or delegate model of representation. While trustee representatives follow their own judgments, and thus are less responsive to the demands of citizens, delegates defer to their constituents’ views and are responsive to them. Most studies have found that voters prefer aspects of the delegate over the trustee model (Carman Reference Carman2006, Reference Carman2007; Barker and Carman Reference Barker and Carman2012; McMurray and Parsons Reference McMurray and Parsons1965; Rosset, Giger, and Bernauer Reference Rosset, Giger and Bernauer2017; Davidson Reference Davidson1970; Bowler Reference Bowler2017; Wolak Reference Wolak2017; Dassonneville et al. Reference Dassonneville, Blais, Sevi and Daoust2021).Footnote 1 Some work has pitted “partisan representation” as a third model against trustee and delegate representation, demonstrating that citizens prefer both delegates and trustees over partisan representatives, who resolutely follow the party line rather than their own views or the views of their constituency (Bøggild Reference Bøggild2020). Recent studies suggest that the public generally dislikes representatives who loyally toe the party line (e.g., Campbell et al. Reference Campbell, Cowley, Vivyan and Wagner2019; Carson et al. Reference Carson, Koger, Lebo and Young2010).
A second major theme in the literature on citizens’ representation preferences is whether citizens want representatives to focus their work on their district (e.g. through pork-barrel politics or constituency service) versus on national policy issues. The findings are mixed and probably depend to some extent on question wordings and research designs. While Lapinski et al. (Reference Lapinski, Levendusky, Winneg and Jamieson2016) find evidence that citizens most value legislators who represent them on “salient national issues,” Vivyan and Wagner (Reference Vivyan and Wagner2016) report that legislators who balance their efforts between national and constituency-level work gather the most citizen support on average. Doherty (Reference Doherty2013) even demonstrates that when evaluating concrete instances of legislators’ behavior, citizens actually prefer a district focus over a national focus (see also Wolak Reference Wolak2017). Preferences over the focus of representation also vary considerably by individual-level characteristics: those in economic need, with lower education, and ethnic minorities (Harden Reference Harden2015; Griffin and Flavin Reference Griffin and Flavin2011; Lapinski et al. Reference Lapinski, Levendusky, Winneg and Jamieson2016) as well as respondents with a local as opposed to cosmopolitan orientation (Vivyan and Wagner Reference Vivyan and Wagner2016) tend to prefer a district focus over a national focus.
While the literature on representation preferences has made important contributions, it also has limitations. First, many studies use conceptualizations of representation that are considered misleading or outdated by representation theorists. Take the literature on preferences for delegate versus trustee representation. Theorists have widely rejected this distinction. Rehfeld (Reference Rehfeld2009), for example, argues that three more fundamental distinctions in representation are conflated in these models: 1) whether representatives are sensitive to electoral sanctions; 2) whether they pursue the good of a group (e.g., their district) or of society as a whole; and 3) whether they rely on others’ (e.g., their constituents) or their own judgments. This also means that multiple other forms of representation are conceivable, above and beyond trustee and delegate representation (e.g. representatives who aim for the good of society but are motivated by a desire to get re-elected by their constituency), and research on representation preferences should take these forms seriously.
The literature on preferences over national versus district representation could also benefit from engaging more closely with representation theory. One key insight of recent theoretical contributions is that representation and electoral accountability may sometimes come apart (e.g., Mansbridge Reference Mansbridge2003; Saward Reference Saward2010). Representatives may represent individuals or groups from other districts that stand in no electoral relationship with them. This is relevant to the national versus district distinction, because a representative who focuses on national issues thereby also needs to focus on constituents who did not elect them (e.g., constituents residing in other districts). Asking citizens only about their preferences regarding their local MP thus risks missing something important. The theoretical framework we present in the next section integrates these insights.
A second limitation of existing work on citizens’ representation preferences is that the focus is typically on only one or two dimensions of representation (but see Harden Reference Harden2015; Wolak Reference Wolak2017). Much work implicitly restricts citizens’ representation preferences to the substantive aspects of representatives’ behavior, such as their policy positions or the constituency service they perform (see e.g., Vivyan and Wagner Reference Vivyan and Wagner2016; Lapinski et al. Reference Lapinski, Levendusky, Winneg and Jamieson2016; Griffin and Flavin Reference Griffin and Flavin2011). In contrast, other relevant aspects of representation—for instance, whether representatives resemble citizens on descriptive characteristics, how they speak about things, or whether they present themselves as rebels who defy the party line—are rarely addressed. Recent work has tried to address some of these aspects (Campbell et al. Reference Campbell, Cowley, Vivyan and Wagner2019; Costa Reference Costa2021; Arnesen, Duell, and Johannesson Reference Arnesen, Duell and Johannesson2019; Bøggild Reference Bøggild2020; Harden Reference Harden2015), but our knowledge about citizens’ preferences regarding alternative dimensions of representation is still rather limited. To address this, we employ a multidimensional understanding of representation, distinguishing six different dimensions.
Third and relatedly, existing work has rarely assessed the relative importance of different dimensions of representation to citizens. Many studies focus only on a single dimension of representation or pit two models of representation against each other (e.g., delegate versus trustee). Some research helpfully covers preferences on several dimensions, identifying individual or majority preferences on each (e.g., policy versus service focus, pork-barrel versus fair-share allocation), but their relative importance to citizens is not tested (e.g., Wolak Reference Wolak2017; Harden Reference Harden2015; Bengtsson and Wass Reference Bengtsson and Wass2010). Only some recent studies address that issue. Costa (Reference Costa2021) uses conjoint experiments to compare the relative importance of three dimensions of representation, showing that affective partisan rhetoric is less important to citizens’ representation preferences than policy congruence or constituency service. Arnesen, Duell, and Johannesson (Reference Arnesen, Duell and Johannesson2019) show that voters focus more on whether political candidates have particular policy positions they like rather than what descriptive characteristics they share with them.
Bracketing the relative importance of different dimensions of representation is problematic for two reasons. First, when preferences on each dimension are measured independently (e.g., with different survey items), respondents may simply draw inferences about other dimensions and let them shape their response. For instance, if they are asked whether they like representatives who follow their own judgment, they might also assume that such representatives are unresponsive, which they could dislike. Consequently, they may disapprove of representatives who are following their own judgment because of the unobserved confounder—the mental link to representatives’ assumed lack of responsiveness. This leads to biased estimates of citizens’ preferences.
Second, understanding how important different dimensions of representation are to citizens is crucial for the normative conclusions we draw from our findings. For example, the finding that citizens prefer delegates over trustees has vastly different implications depending on how important this distinction is to citizens. If this is what they care most about, then perhaps politicians should try to act more like delegates, and political scientists should study the workings of delegate representation. Yet if citizens actually care most about whether representatives share descriptive characteristics with them (e.g., age, gender), then practitioners and scientists should devote more attention to descriptive aspects of representation than the delegate-trustee dichotomy. To overcome this limitation of the literature, we use a conjoint experiment to directly compare the average relative importance of different dimensions of representation.
Conceptualizing Six Dimensions of Representation
We focus on six different dimensions of representation that figure prominently in contemporary theoretical research on representation. The first two, substantive and descriptive representation, which were initially defined by Pitkin (Reference Pitkin1967), are possibly the most widely used conceptions of representation in empirical scholarship (see Wolkenstein and Wratil Reference Wolkenstein and Wratil2021, 864-5). The latter four conceptions of representation—surrogation, justification, personalization, and responsiveness—are derived from Wolkenstein and Wratil’s (Reference Wolkenstein and Wratil2021) recent attempt to translate the theoretical insights of leading representation theorists (esp. Mansbridge Reference Mansbridge2003; Rehfeld Reference Rehfeld2009; Saward Reference Saward2010) into operationalizable conceptions of representation. Consistent with both the theoretical literature on which we build and our empirical interest in individual citizens’ representation preferences, all of these dimensions of representation are conceptualized with individual constituent-representative relationships in mind. They are not addressed to representation at the collective level, which is typically conceived in terms of a congruence between policy and average public opinion. However, as we will explain more later, representation at the individual level is linked to collective-level representation.
We start with substantive representation, focusing on what we consider the conceptual core of Pitkin’s (Reference Pitkin1967) original definition: representation as “acting in the interest of the represented” (209). In our reading, substantive representation thus defined does not contain any stipulation about the mechanisms that lead representatives to act in accordance with the interest—or better—preferences (we avoid the controversial assumption of objective interests) of the represented. This contrasts with many popular conceptualizations of substantive representation, which conceptually link substantive representation to electoral mechanisms: representatives are thought to act in line with what constituents want in order to forestall electoral sanctions—think of the classic “delegate” conception of representation or what Mansbridge (Reference Mansbridge2003) calls “promissory representation.” Pitkin does not make this link; given that she (1967, 209) envisions representatives to “act independently” on the basis of their own “discretion and judgment,” it seems in fact that she leaves room for varying levels of substantive representation, as well as assuming that substantive representation can occur without the threat of electoral sanction (on this, also see Fearon Reference Fearon, Przeworski, Stokes and Manin1999; Mansbridge Reference Mansbridge2009).
This makes good sense. After all, representatives might do what their constituents want for reasons other than wanting to be re-elected (e.g., because they are intrinsically motivated to follow their constituents’ preferences, Mansbridge Reference Mansbridge2003 dubs this “gyroscopic” representation), or they might substantively represent certain people who cannot vote for (and hence sanction) them because they reside in a different electoral district (what we call surrogation).Footnote 2 So, here is what we are empirically interested in: we seek to study how important it is for citizens that their representatives advance their policy preferences, irrespective of the mechanism(s)—electoral or not—that lead to representatives advancing an individual’s policy preferences.
We stress again that our individual-level conception of substantive representation is different from how substantive representation is often conceptualized in collective-level studies. These latter studies tend to conceptualize substantive representation in terms of policy responsiveness to average public opinion (e.g., Soroka and Wlezien Reference Soroka and Wlezien2010; Wlezien Reference Wlezien2017). At the level that we are interested in, this conceptualization of substantive representation does not make much sense, since an individual citizen’s policy preferences may well diverge from public opinion at the aggregate level. Suppose I individually prefer policy P1, but the majority of the public endorses policy P2. Suppose further that the government or majority of elected representatives are responsive to average public opinion and implement policy P2. In this case, I would not be substantively represented by the government or majority of elected representatives, although there is substantive representation as defined in the collective-level literature. In fact, I would only be substantively represented if politicians were not responsive to average public opinion. Thus, substantive representation at the individual level is not the same as substantive representation at the collective level, and we only seek to study the individual level.
The second traditional conception of representation that we focus on, descriptive representation, has also typically been linked to the work of Pitkin. For Pitkin (Reference Pitkin1967, 60), descriptive representation occurs when “a representative body is distinguished by an accurate correspondence or resemblance to what it represents.” At the individual level, the notion of descriptive representation is usually employed to describe the extent to which single representatives “look” or “are” like their constituents with respect to gender, race, class, etc. With this in mind, we want to assess how important it is for citizens that representatives actually resemble them, with a particular focus on the extent to which demands for descriptive representation vary across different groups of citizens.
Leading theorists have highlighted the importance of additional conceptions of political representation, beyond those of descriptive and substantive representation (see espescially Mansbridge Reference Mansbridge2003; Rehfeld Reference Rehfeld2009; Saward Reference Saward2010). Building on the groundwork of Wolkenstein and Wratil (Reference Wolkenstein and Wratil2021), we investigate citizens’ preferences regarding the following four additional dimensions.
First, surrogation was defined by Mansbridge (Reference Mansbridge2003, 522) as “representation by a representative with whom one has no electoral relationship—that is, a representative in another district.” In addition to Mansbridge’s notion of territorial surrogation, where the surrogate representative is the representative of a different electoral district, we also conceptualize partisan surrogation, which occurs when a constituent expects representation from a representative of a party for whom she did not vote. For instance, during the U.S. presidential campaign in 2020, Joe Biden appealed to such expectations of partisan surrogation, reaching out to Republican voters: “I’m running as a Democrat, but I will be an American president. Whether you voted for me or against me, I will represent you” (on Twitter, October 2, 2020). We seek to examine how important it is to citizens that they have direct electoral relationships with their representatives, considering both territorial and partisan surrogation.
Second, justification is defined as the degree to which representatives, when justifying their actions, refer to the good of the whole citizenry versus particularistic goods of some societal group(s). Justification, as understood here, is therefore about a specific contrast regarding how representatives justify, rather than about whether they justify/explain their decisions at all (e.g., Esaiasson, Gilljam, and Persson Reference Esaiasson, Gilljam and Persson2017, Reference Esaiasson, Gilljam, Persson, Narud and Esaiasson2013). This contrast tracks widely shared normative concerns in political theory and is derived from Rehfeld’s (Reference Rehfeld2009) distinction between pluralist (aiming for the good of a group) and republican (aiming for the public good) aims of representatives. According to Rehfeld, this is one of the three central distinctions underlying trustee and delegate models of representation, with the trustee aiming for the good of the whole and the delegate aiming for the good of a part. Wolkenstein and Wratil (Reference Wolkenstein and Wratil2021) reconceptualize this distinction in terms of political justification, focusing on the claims of representatives about whose good they aim to serve with their actions and policies. With regard to citizens’ attitudes, our primary concern is with studying whether citizens want representatives to explain in public speech how their policies and decisions affect and benefit society as a whole, or whether they would rather like to see them explain how their policies and decisions affect and benefit the particular socio-economic, ethnic, age, gender, etc. groups that citizens identify with.
Third, personalization refers to the extent to which representatives and constituents regard representatives as individual persons versus agents of their party. Strong forms of personalization involve representatives emancipating themselves from their party. They might present themselves as capable of making the right decisions individually, and without guidance from the party—or as resolute followers of their constituents, who are ready to go against the party line (Mansbridge Reference Mansbridge2009, 381). The key issue we want to shed light on is whether citizens prefer the “representative-as-party-member,” who acts in accordance with the party platform or the commands of their party leader—or conversely find more appealing the “representative-as-individual” who presents themself as an “independent leader,” “spokesperson of her constituents,” or even “party rebel.”
Fourth, responsiveness captures what we call, with Rehfeld (Reference Rehfeld2009), the degree to which representatives are sensitive to electoral sanctions. Though linked to substantive representation (at least in democracies), this is a distinctive aspect of representation. It is not about whether representatives follow the views of their constituents per se, but about whether they do so in order to forestall electoral sanctions. Recall that sanction-sensitivity thus understood is often assumed to be the primary mechanism that ensures that representatives act in line with the substantive policy preferences of their constituents. But since we separate substantive representation’s conceptual core from assumptions about incentive-generating mechanisms, we also study separately citizens’ attitudes about sanction-sensitivity. Specifically, we want to investigate whether citizens prefer representatives who evidently care about being re-elected (e.g., by stating it or changing course under electoral pressure) versus representatives who are unfazed by the threat of being unelected (e.g., because they prioritize “what they think is right” over short-term electoral success or failure).
As with all other dimensions of representation that we focus on, responsiveness is pitched at the level of individual representative-constituent relationships, not at the collective level, where (as mentioned earlier) “responsiveness” is often conceptualized as policy responsiveness to average public opinion. Notice, however, that there is a connection between our understanding of responsiveness and public opinion at the collective level. Effective electoral sanctioning requires that a critical mass of citizens votes in a particular way; an individual vote usually has little impact on the result. Thus, a real threat of being electorally sanctioned—to which a representative could be sensitive—only exists when public opinion at large (and not an individual constituent) finds the representative’s record wanting. Our conception of responsiveness also has an elective affinity with another key concept in the literature, namely electoral accountability. Yet while the literature on electoral accountability focuses more on whether citizens (can) hold representatives accountable in elections (e.g., Manin, Przeworski, and Stokes Reference Manin, Przeworski and Stokes1999), our concern is with how representatives behave, or should behave, in the eyes of citizens. This is exactly what Rehfeld seeks to capture by conceptualizing sanction-sensitivity as an attribute of individual representatives. For this reason, we do not use the term electoral accountability, but stick with Rehfeld’s terminology.
Two final points. First, our six dimensions of representation are thought to capture different aspects of a single unified concept of representation. This means that several—possibly even all—six dimensions can be embodied in a single action (or a string of closely connected actions) performed by a representative. Think, for example, of a “rebellious” representative who votes against their own party on a particular bill B. In virtue of voting in this way, the representative exhibits a high level of personalization. At the same time, the representative substantively represents citizens with the same policy preference (i.e., against B), while not necessarily representing all of those citizens descriptively because that policy preference is mostly held by women and the representative happens to be a man. Downstream, the representative may further use a republican justification to justify their vote on social media, and this justification may resonate more with women than with men. Likewise, the representative may have voted against B because they are responsive, that is, sensitive to electoral sanctions, and the constituents in their district are against B as well. And women who feel represented by the representative may live outside of the representative’s district, receiving surrogate representation. All of the dimensions are present in this example; they simply capture different aspects of it.
Second, analytically distinguishing the six dimensions does not imply that we do not expect correlations between them, or that they cannot be empirically correlated in how representatives behave or in what citizens want from representatives. For instance, Wolkenstein and Wratil (Reference Wolkenstein and Wratil2021, 872) note that highly responsive representatives may also aim for more personalization, emancipating themselves from their party to portray themselves as spokepersons of their constituents. Similarly, citizens’ preferences on the different dimensions may be correlated. The only assumption we make here is that the dimensions are analytically separable at the theoretical level.
Research Design
Our central research questions are then: How do citizens want to be represented on each of the six dimensions of representation? And what dimensions matter more to them, relative to others, when forming their preferences about whether someone represents them?
To answer the first question, we develop and validate six new item batteries that measure citizens’ individual-level preferences on the six aforementioned dimensions of representation. This allows us to explore, on each dimension, which kind of representation the majority of citizens prefers and how preferences for representation are related to standard socio-demographic and political covariates. Note however that we do not know a priori whether citizens have coherent preferences on all our dimensions of representation at all, since they are derived from theory rather than from citizens’ own conceptions of representation. We return to this issue later.
To answer the second question, we use a paired conjoint experiment (Hainmueller, Hopkins, and Yamamoto Reference Hainmueller, Hopkins and Yamamoto2014),Footnote 3 in which respondents consider two hypothetical politicians—whose profiles vary along the six dimensions of representation—and select the one that they think would “better represent [them] in politics.” We use the distribution of responses to these comparisons to infer the importance of each dimension for determining the probability that a politician is selected as a representative. This of course means that our measures of importance are relative. That is, we cannot determine whether dimensions matter or not in any “absolute” sense, but only how important they are when compared to each other (i.e., when all are present and no others are present).
Item Batteries
While the conjoint experiment allows us to determine the relative importance of different dimensions for citizens’ aggregated choices of the preferred representative, it does not straightforwardly identify either the majority preference or individual-level preferences over representation (see, e.g., Abramson, Koçak, and Magazinnik Reference Abramson, Koçak and Magazinnik2022). Hence, to explore what the majority of citizens prefers on each dimension of representation and how individual-level preferences are associated with key covariates, we design six batteries of survey items, each measuring preferences on one dimension of representation. Our goal in developing these items was to create a set of attitude statements that jointly cover the full theoretical breadth of the representation dimensions discussed earlier. To aid respondents’ understanding, each battery begins with a short statement summarizing the content of the relevant dimension, followed by a common prompt: “Thinking about what you would want from someone who acts and speaks for you in politics. Do you agree or disagree …” Each battery then consists of between three and five items that respondents rate on a five-point agree-disagree scale.
For instance, our surrogation battery (in the United Kingdom) asks respondents to indicate the extent to which they agree with the idea that the person who acts and speaks for them in politics “needs to be the MP for your constituency,” “needs to be the person you voted for,” or “needs to be from the party you voted for.” Similarly, our substantive representation battery asks respondents to indicate whether they agree that their representative should “promote the policy views that I hold,” “speak in favour of the views and opinions that I hold on different political issues,” “promote policies that would benefit me, even on issues I am unfamiliar with,” and “raise issues that are important to me.” We present the English-language versions of all item batteries as well as details on their development in online appendix section A.
Conjoint Experimental Design
Our conjoint experiment consists of five choice tasks in which respondents consider vignette descriptions of two politicians and select who they believe better represents them in politics. After a short introduction, our respondents are asked to choose between pairs of hypothetical politicians by answering the question, “Which of these politicians do you think would better represent you in politics?” Each politician is characterized by six short sentences that correspond to the six dimensions of representation. We randomly vary the content of these sentences to manipulate the type of representation each politician offers on each dimension:
-
• Substantive representation: We provide information on the politician’s position on a single political issue in a binary format (“supports” or “opposes” the policy). For each country, we selected six political issues that are a current feature of political debate, and which include both low and high salience topics (refer to online appendix section B, “Substantive,” for the set of issues). We also solicit respondents’ binary position on each of these issues pre-treatment. Our measure of substantive representation is defined by the combination of respondents’ issue positions and the positions of the hypothetical politicians. That is, we measure a hypothetical politician substantively representing a respondent when they share the same position on the issue that features in the conjoint comparison.
-
• Descriptive representation: We provide information on two descriptive characteristics of the politician. We always include the gender of the two politicians in a comparison, but the second characteristic is chosen at random from ethnicity (migratory background in Germany), sexual orientation, or social class. Respondents’ characteristics on these dimensions of descriptive representation are surveyed pretreatment. Again, our measure of descriptive representation is based on the combination of respondent and politician characteristics: a politician is more descriptively representative of a respondent the more descriptive characteristics they have in common (we provide more detail later and in online appendix section G).
-
• Surrogation: We provide information on the politician’s party affiliation as well as the electoral tier/district in which they were elected. Information on the party of the politician, in conjunction with the partisanship of the respondent (measured pretreatment) allows us to operationalize the concept of partisan surrogation, while information about the district in which the politician was elected allows us to operationalize the idea of territorial surrogation.
-
• Justification: We provide a statement about whether a politician more regularly engages in either pluralist or republican justification. The central challenge in operationalizing pluralist justification is that the number of possible groups whose good can be invoked is large and could also vary between countries. We tackle this problem by saying that the representative justifies by referring to the good of “people like you” or a generic category of “particular groups.” The aim is to make people think of groups they identify with (“people like you”) or other groups that they can readily think of (“particular groups”).Footnote 4
-
• Personalization: We provide a statement about how frequently the politician acts (votes, speaks, etc.) against or in line with their party.
-
• Responsiveness: We provide a quote by the politician that either emphasizes or rejects sensitivity to electoral sanctions.
At the respondent level, we randomize the order (top to bottom) of the six sentences. At the level of the choice task, we randomly draw the second descriptive characteristic as well as one political issue such that both politicians in a given comparison are characterized by information on the same descriptive attributes and their positions on the same issue. At the profile level (each politician), we randomly draw the attribute levels.Footnote 5 In general, our attribute levels reflect binary contrasts (e.g., high versus low surrogation, high versus low personalization). However, we deviate from this structure for some dimensions (i.e., descriptive representation, where there are more than two ethnicities) and dimension-country combinations (e.g., territorial surrogation in Germany due to the two electoral tiers) to better reflect reality. For the personalization, responsiveness, and justification dimensions we use three to four different text implementations of each attribute level (e.g., three texts that indicate “high” and three that indicate “low” levels of personalization) to guard against the possibility that any finding may be due to particular word usage in a single text implementation (Blumenau and Lauderdale Reference Blumenau and Lauderdale2022; Fong and Grimmer Reference Fong and Grimmer2023).
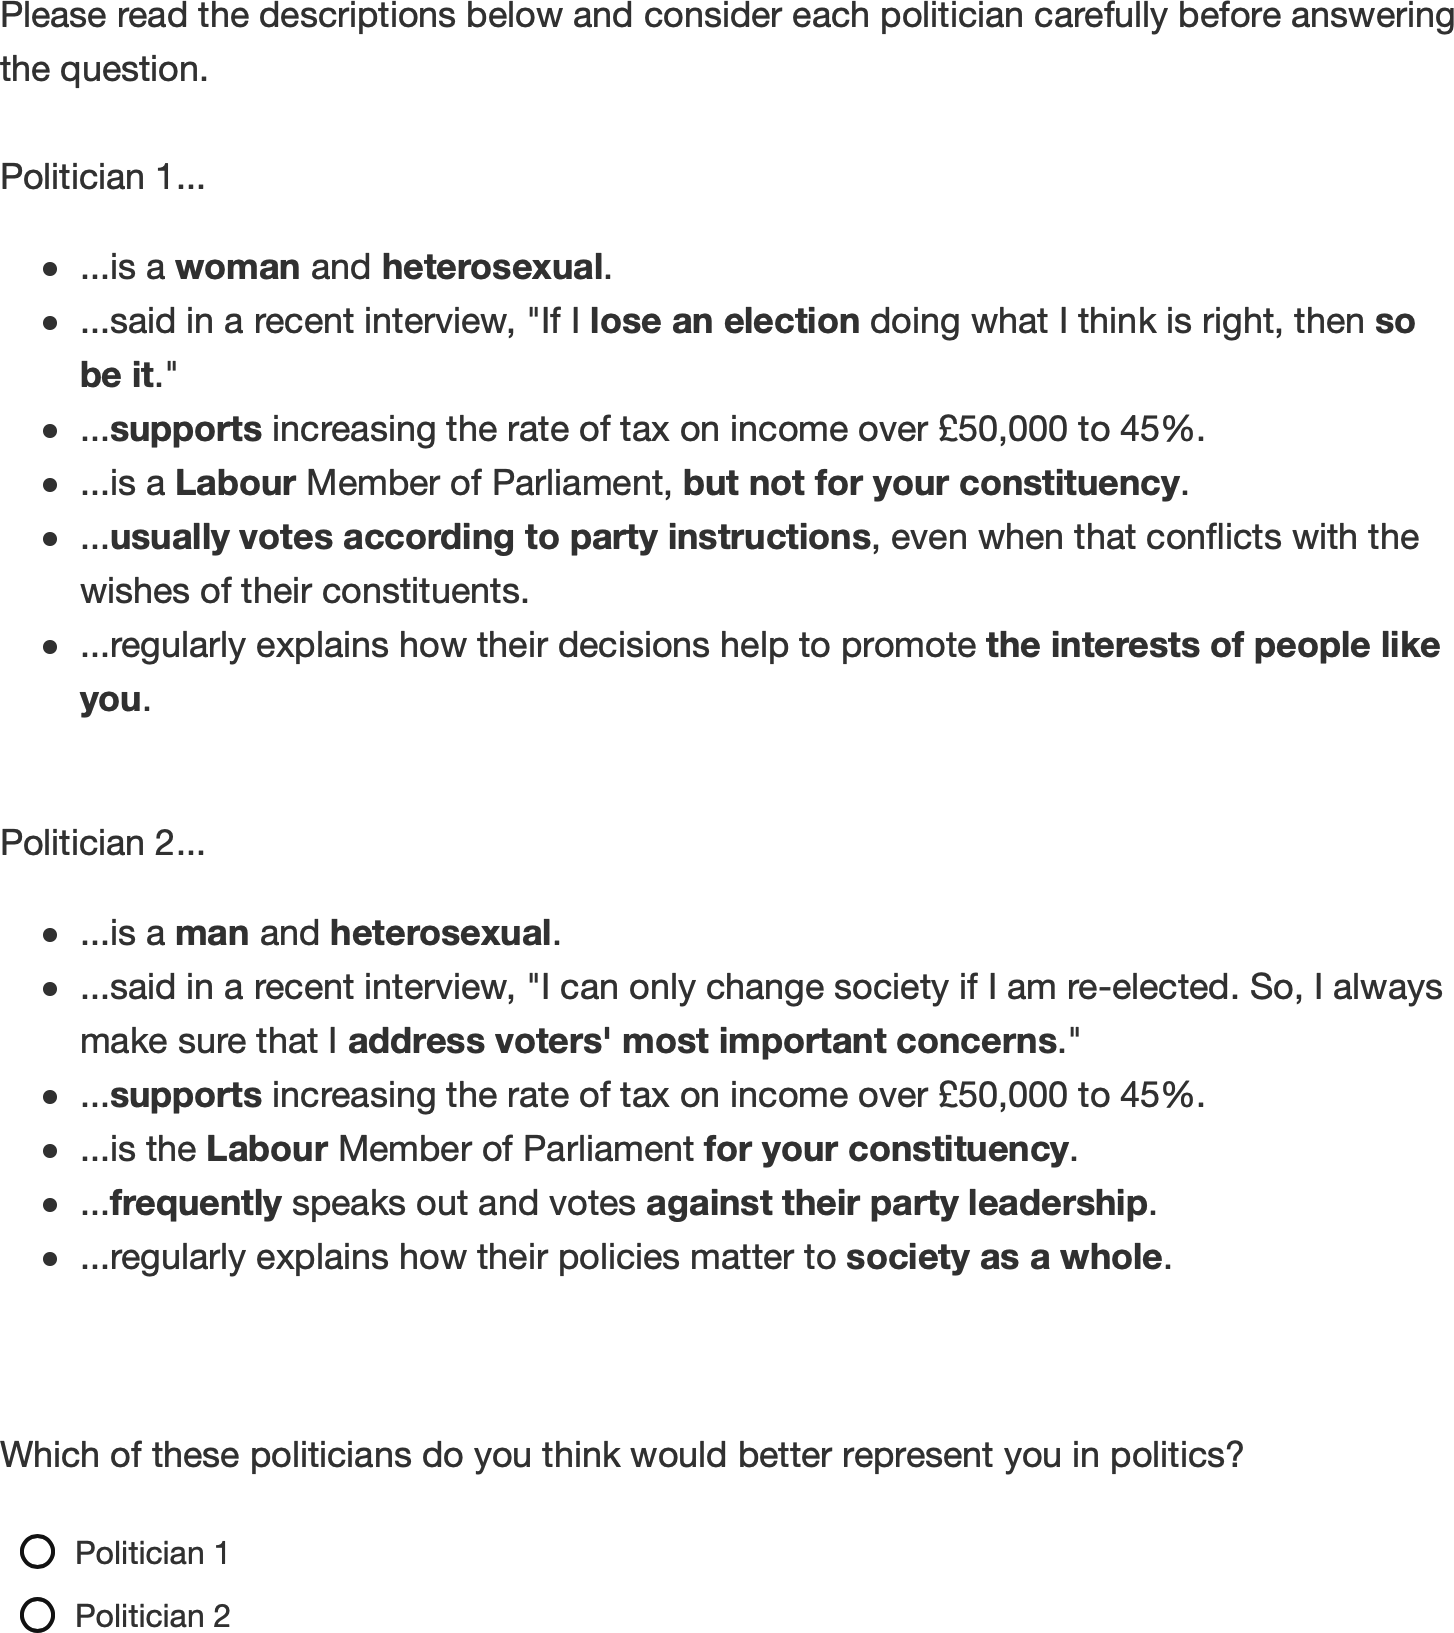
In online appendix section B, we provide all of the different text implementations for each attribute level. In figure 1, we provide an example of one comparison seen by respondents in our experiment.
Example comparison of politicians from conjoint experiment
Case Selection, Samples, and Implementation
We fielded these instruments in bespoke online surveys on nationally representative samples in Germany, the United Kingdom, and the United States. In terms of country case selection, we wanted to focus on the most studied political systems in mainstream representation research. In online appendix section N, we provide an analysis of a random sample of quantitative articles on representation published in seven leading political science journals with regard to the countries these studies cover; this reveals that the United States, Germany, and the United Kingdom are the most studied systems by representation scholars. Moreover, this selection also allows us to explore whether the relative importance of representation dimensions (especially of surrogation) is significantly different between systems with majoritarian (United States, United Kingdom) as opposed to largely proportional (Germany) representation. The choice of Germany is advantageous in this regard, as it is a mixed system with a single-member district tier whose disproportionality is compensated in clearance with the proportional tier, leading to a largely proportional vote-seat relationship. This allows us to sustain territorial surrogation by a politician elected in a single-member district as an attribute in our conjoint design across all three countries. Many other systems with largely proportional representation in outcomes rely on multi-member rather than single-member districts.
In each country, we aimed for samples of 2500+ respondents using nationally representative quotas for gender, age, education, and region. All respondents were recruited through the survey company Lucid, were 18+ years of age, and were eligible to vote in their countries’ respective national elections to the lower house of parliament (to the U.S. House of Representatives, the U.K. House of Commons, and the German Bundestag). The responses were collected between May 21 and September 5, 2021. We implemented a straightforward attention check that asks respondents to tick a particular response in one of the batteries on representation preferences. In all analyses shown, we exclude people who fail this attention check and apply survey raking weights to the remaining responses to render them nationally representative (also correcting for some quotas that were not fully filled). In line with Alvarez et al. (Reference Alvarez, Atkeson, Levin and Li2019) we find that younger people and those with lower education more often fail the attention check. Our final analysis samples consist of 2,049 individuals in Germany, 2,204 in the United Kingdom, and 2,178 in the United States.Footnote 6 We present results using the full sample of respondents (including the attention check fails) and without post-stratification weights in online appendix section L.
Before completing the item batteries or the conjoint tasks, we also asked respondents questions that allow us to measure political and socio-demographic covariates, respondents’ policy preferences on the series of six policy issues, their political placement on a left-right (United Kingdom and Germany) or conservative-liberal (United States) scale, their level of political interest, trust in Members of Parliament (United Kingdom and Germany) or Congress (United States), and satisfaction with democracy. We also included a need-for-cognition battery, which was shown at the end of the survey.
All of our core analyses were preregistered with the Center for Open Science’s OSF Registry (Wratil et al., Reference Wratil, Blumenau and Wolkenstein2021) and we implement them here as described in our pre-analysis plan (unless indicated otherwise).
What Kind of Representation Do People Prefer?
In this section, we use descriptive results from our item batteries measuring individual-level preferences to identify what kind of representation the majority of citizens want on each dimension and how preferences vary by socio-demographic and political covariates. In the appendix, we extensively validate our item batteries. First, we use exploratory factor analyses to show that most of the items that are supposed to measure the same construct do load together empirically on a common factor and that we are able to capture preferences towards distinct dimensions of representation (for details, refer to online appendix section D). Second, we report good test score reliabilities for four of our six dimensions, with some lower consistency for our item batteries on personalization and responsiveness (refer to online appendix section E). The descriptive results for citizens’ preferences on personalization and responsiveness presented in this section should therefore be interpreted with some caution. Essentially, we cannot be sure that citizens hold coherent preferences regarding our conceptualization of these dimensions. Third, we show that respondents’ choices on the item batteries predict their choices in the conjoint experiment (refer to online appendix section K). For instance, comparing respondents with a preference against versus for personalization in the batteries, those who want more party independence also value more strongly a party-independent representative in the conjoint than others do. While results are stronger on some dimensions than others, they cross-validate our two instruments and provide some basic evidence of predictive validity of our item batteries.
Majority Preferences
To ascertain what the majority of citizens prefers on a dimension of representation, we calculate each respondent’s average answer to the items in a battery, reverse-coding items that were negatively formulated. “Strongly disagree” with a conception of representation is coded as “1” and “Strongly agree” as “5”, so that “3” represents the indifferent middle category of “Neither agree nor disagree.” For example, if a respondent’s average response for the personalization items is less than 3, they tend to prefer party loyalty over independence, while they prefer the party rebel over the loyalist if their average is above 3.Footnote 7
We plot kernel densities of the average preferences of citizens on each dimension and for each country in figure 2. Most evidently, this figure reveals how similar preference distributions on our batteries are across countries, as the densities in each column have a similar shape. Perhaps the most noteworthy difference is that there are more citizens in Germany who have little aversion or even a preference for surrogation than in the two other countries. This may well be reflective of the German electoral system, in which territorially-defined electoral accountability relationships are less salient due to the proportional tier and the option for representatives to run in both tiers.
Densities of preferences on each dimension
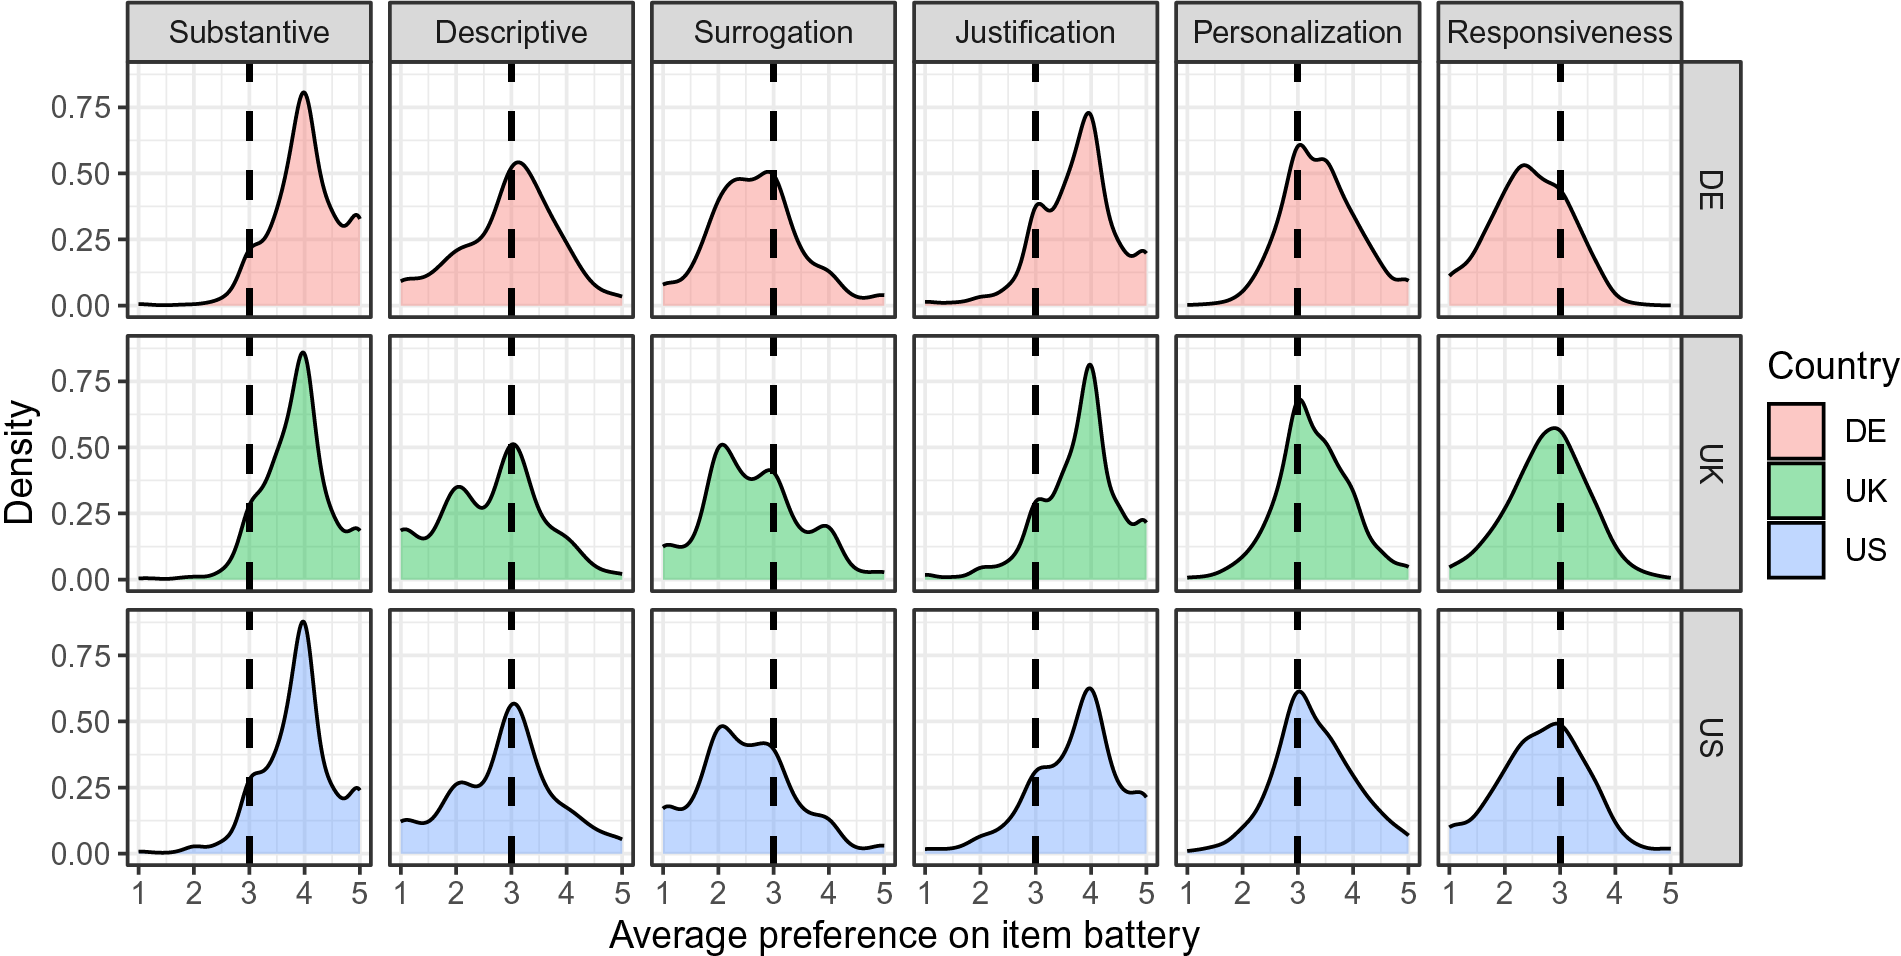
In terms of majority preferences, we can clearly observe that a majority of people want substantive representation as opposed to a representative who acts incongruent with their policy wishes. Depending on the country, 87%–90% are on the side of preferring substantive representation. In contrast, citizens are much more split on descriptive representation, even if clear-cut views (i.e., towards the ends of the scales) are rare. In each country, a majority tends to not want the representative to resemble them personally on descriptive characteristics. This majority is 54% of voters in Germany and up to 72% in the United Kingdom. On surrogation, there is a clear aversion towards representation by politicians elected in other districts or from parties one did not vote for, with 76%–81% preferring representation with electoral relationships when given the choice.
On justification, we find a very clear majority preference for republican justification (from 77% in the United States to 83% in the United Kingdom). Regarding personalization, the figure shows some more mass towards party independence, with 54% preferring the independence in the United States and up to 62% in Germany. Finally, and perhaps surprisingly, we find that between 71% (United Kingdom) and 83% (Germany) of citizens want their representatives to be unresponsive to electoral sanctions. When separating responsiveness from substantive representation, it is clearly substantive representation that people like—not representatives’ sensitivity to re-election incentives.
Correlates of Representation Preferences
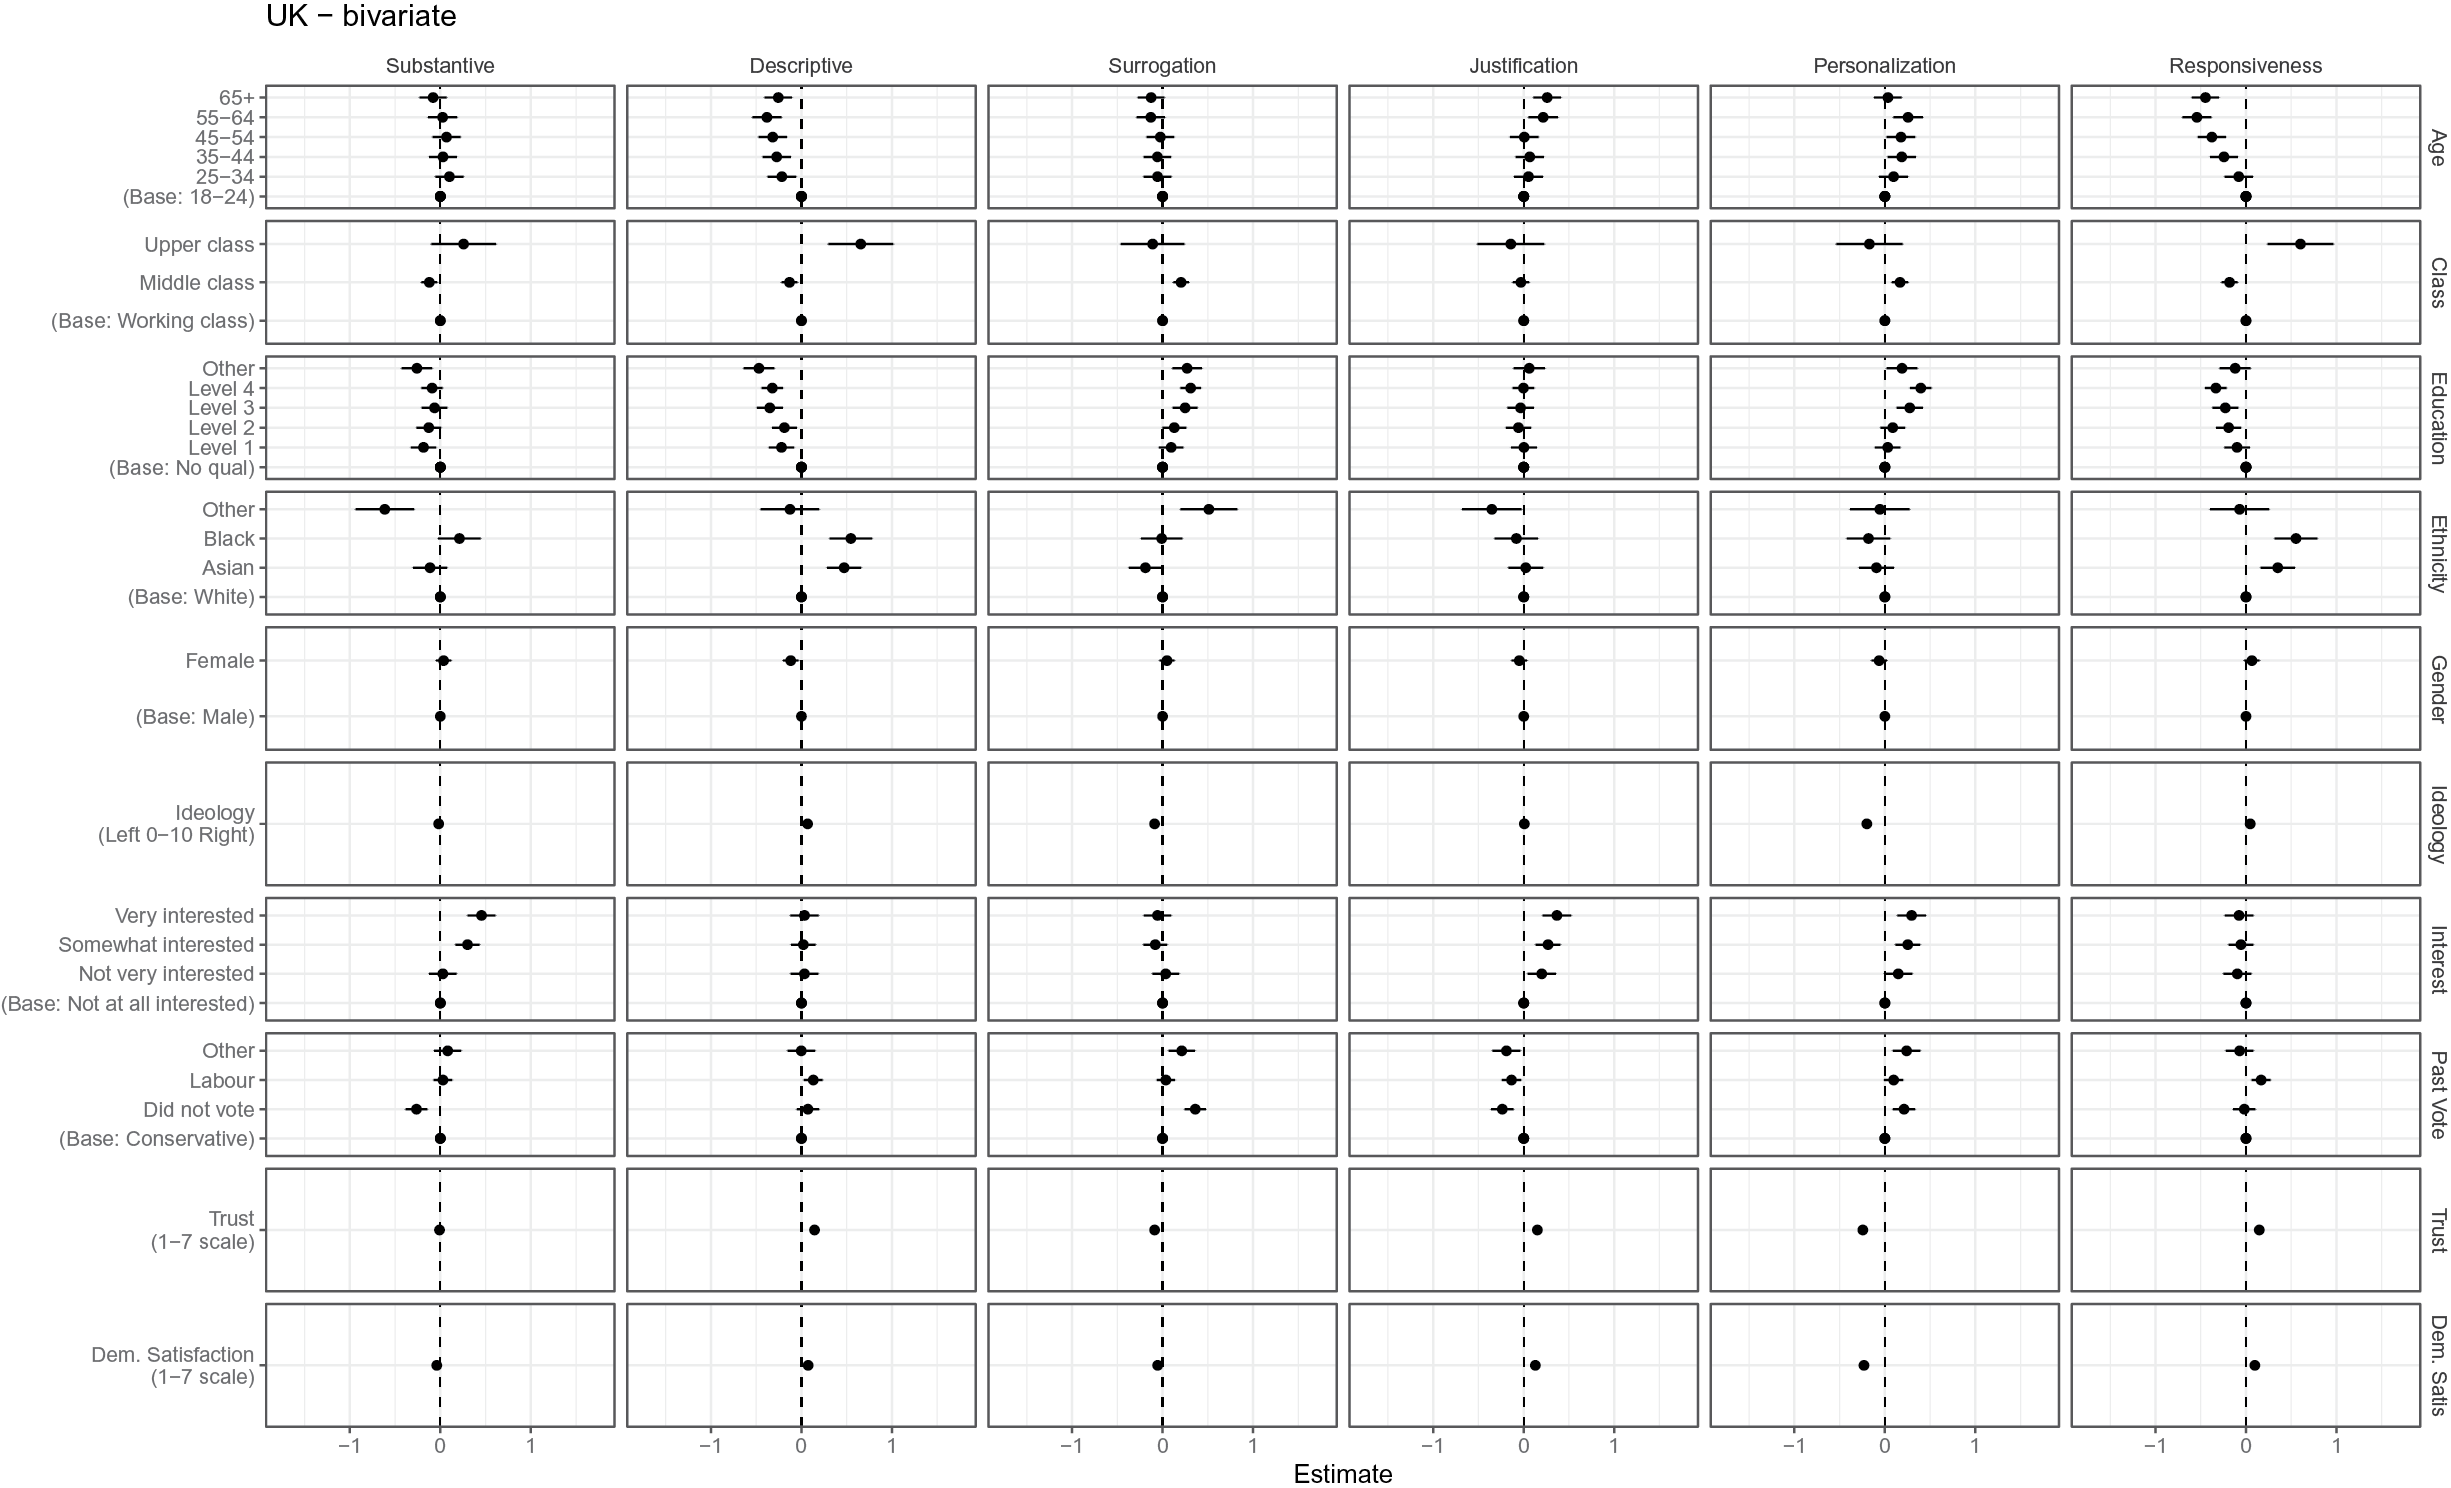
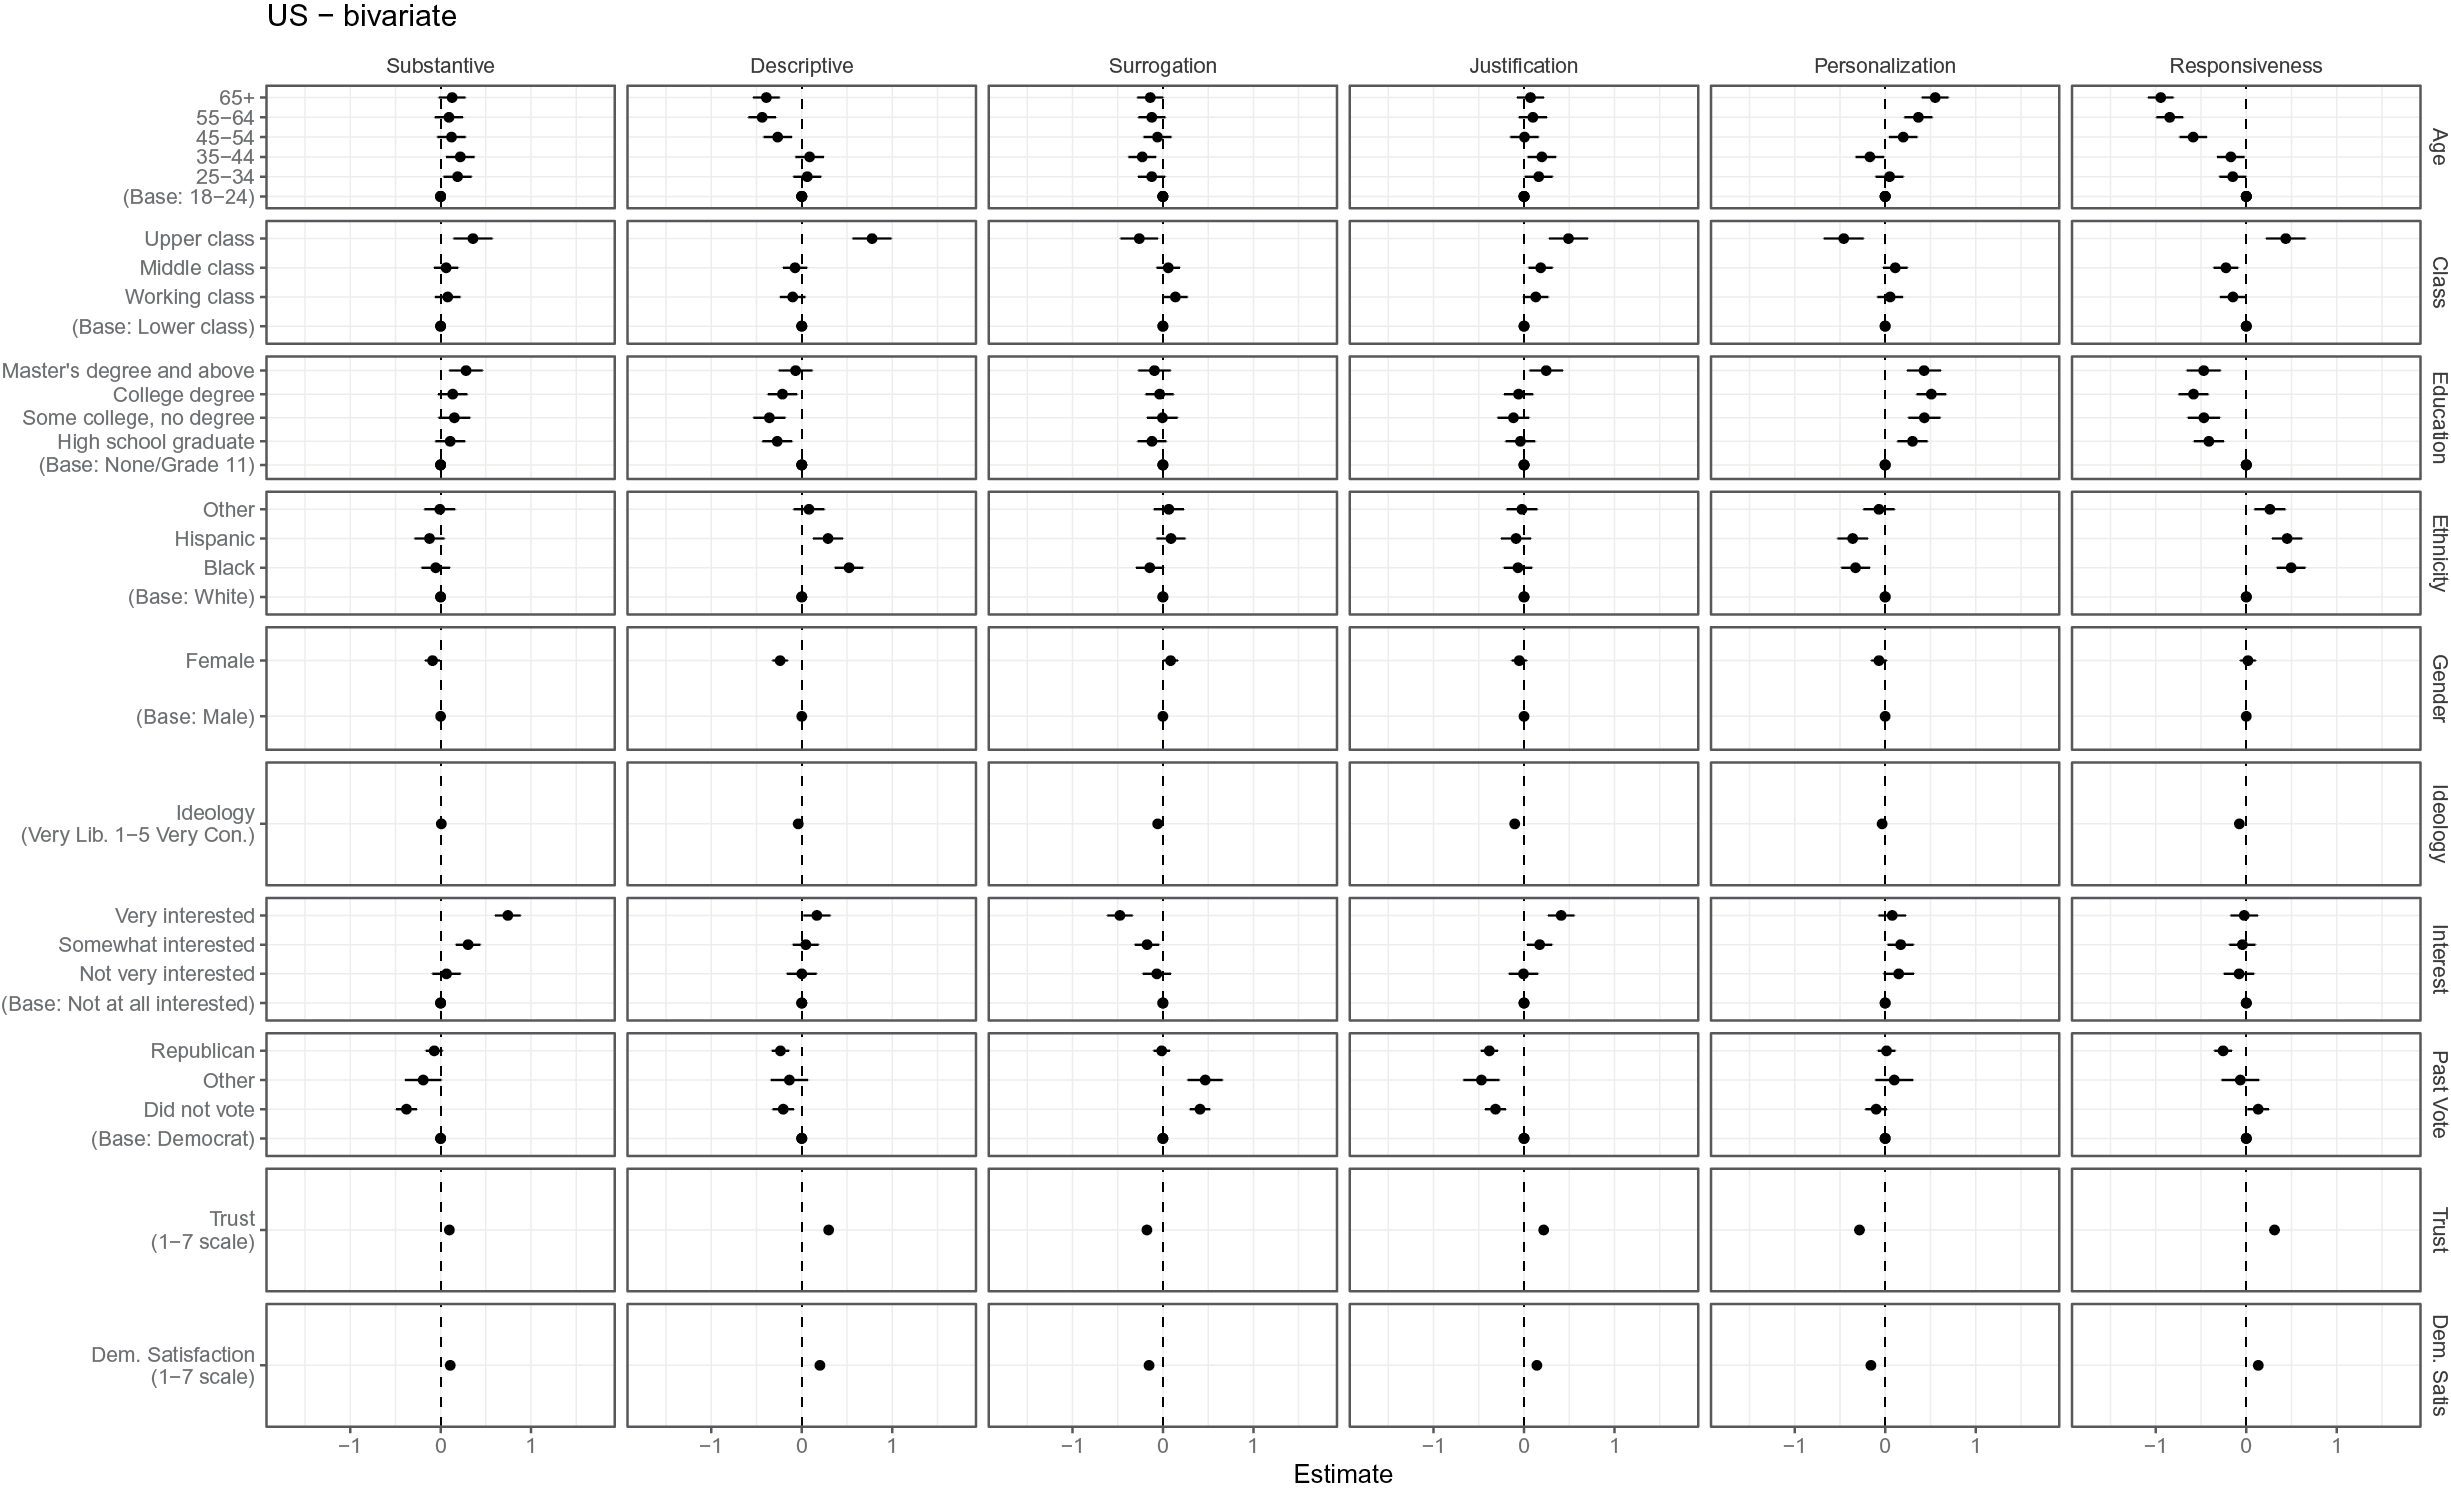
The item batteries also allow us to investigate the individual-level covariates of representation preferences. Here, we use factor scores from a set of exploratory factor analyses as our individual-level measures of representation preferences. For each item battery, we estimate a single latent factor based on the polychoric correlation matrix of our items, and use the estimated factor scores for each respondent as our dependent variable in the following analyses.Footnote 8 Figures 3, 4, and 5 present estimates from a series of bivariate regression models, in which we regress the factor scores on single covariates that are plausibly related to people’s representation preferences.Footnote 9 In these plots, each panel represents a separate regression model, where columns indicate the dependent variable, rows indicate the covariate of interest, and the y-axis indicates the levels of the relevant covariate. The x-axis gives the effect of the relevant covariate, either as a standardized regression coefficient for continuous covariates such as “Ideology”, “Trust”, and “Democratic Satisfaction,” or as the difference between the relevant covariate level and a baseline category.
Correlates of factor scores: U.K. sample
Correlates of factor scores: U.S. sample
Correlates of factor scores: German sample
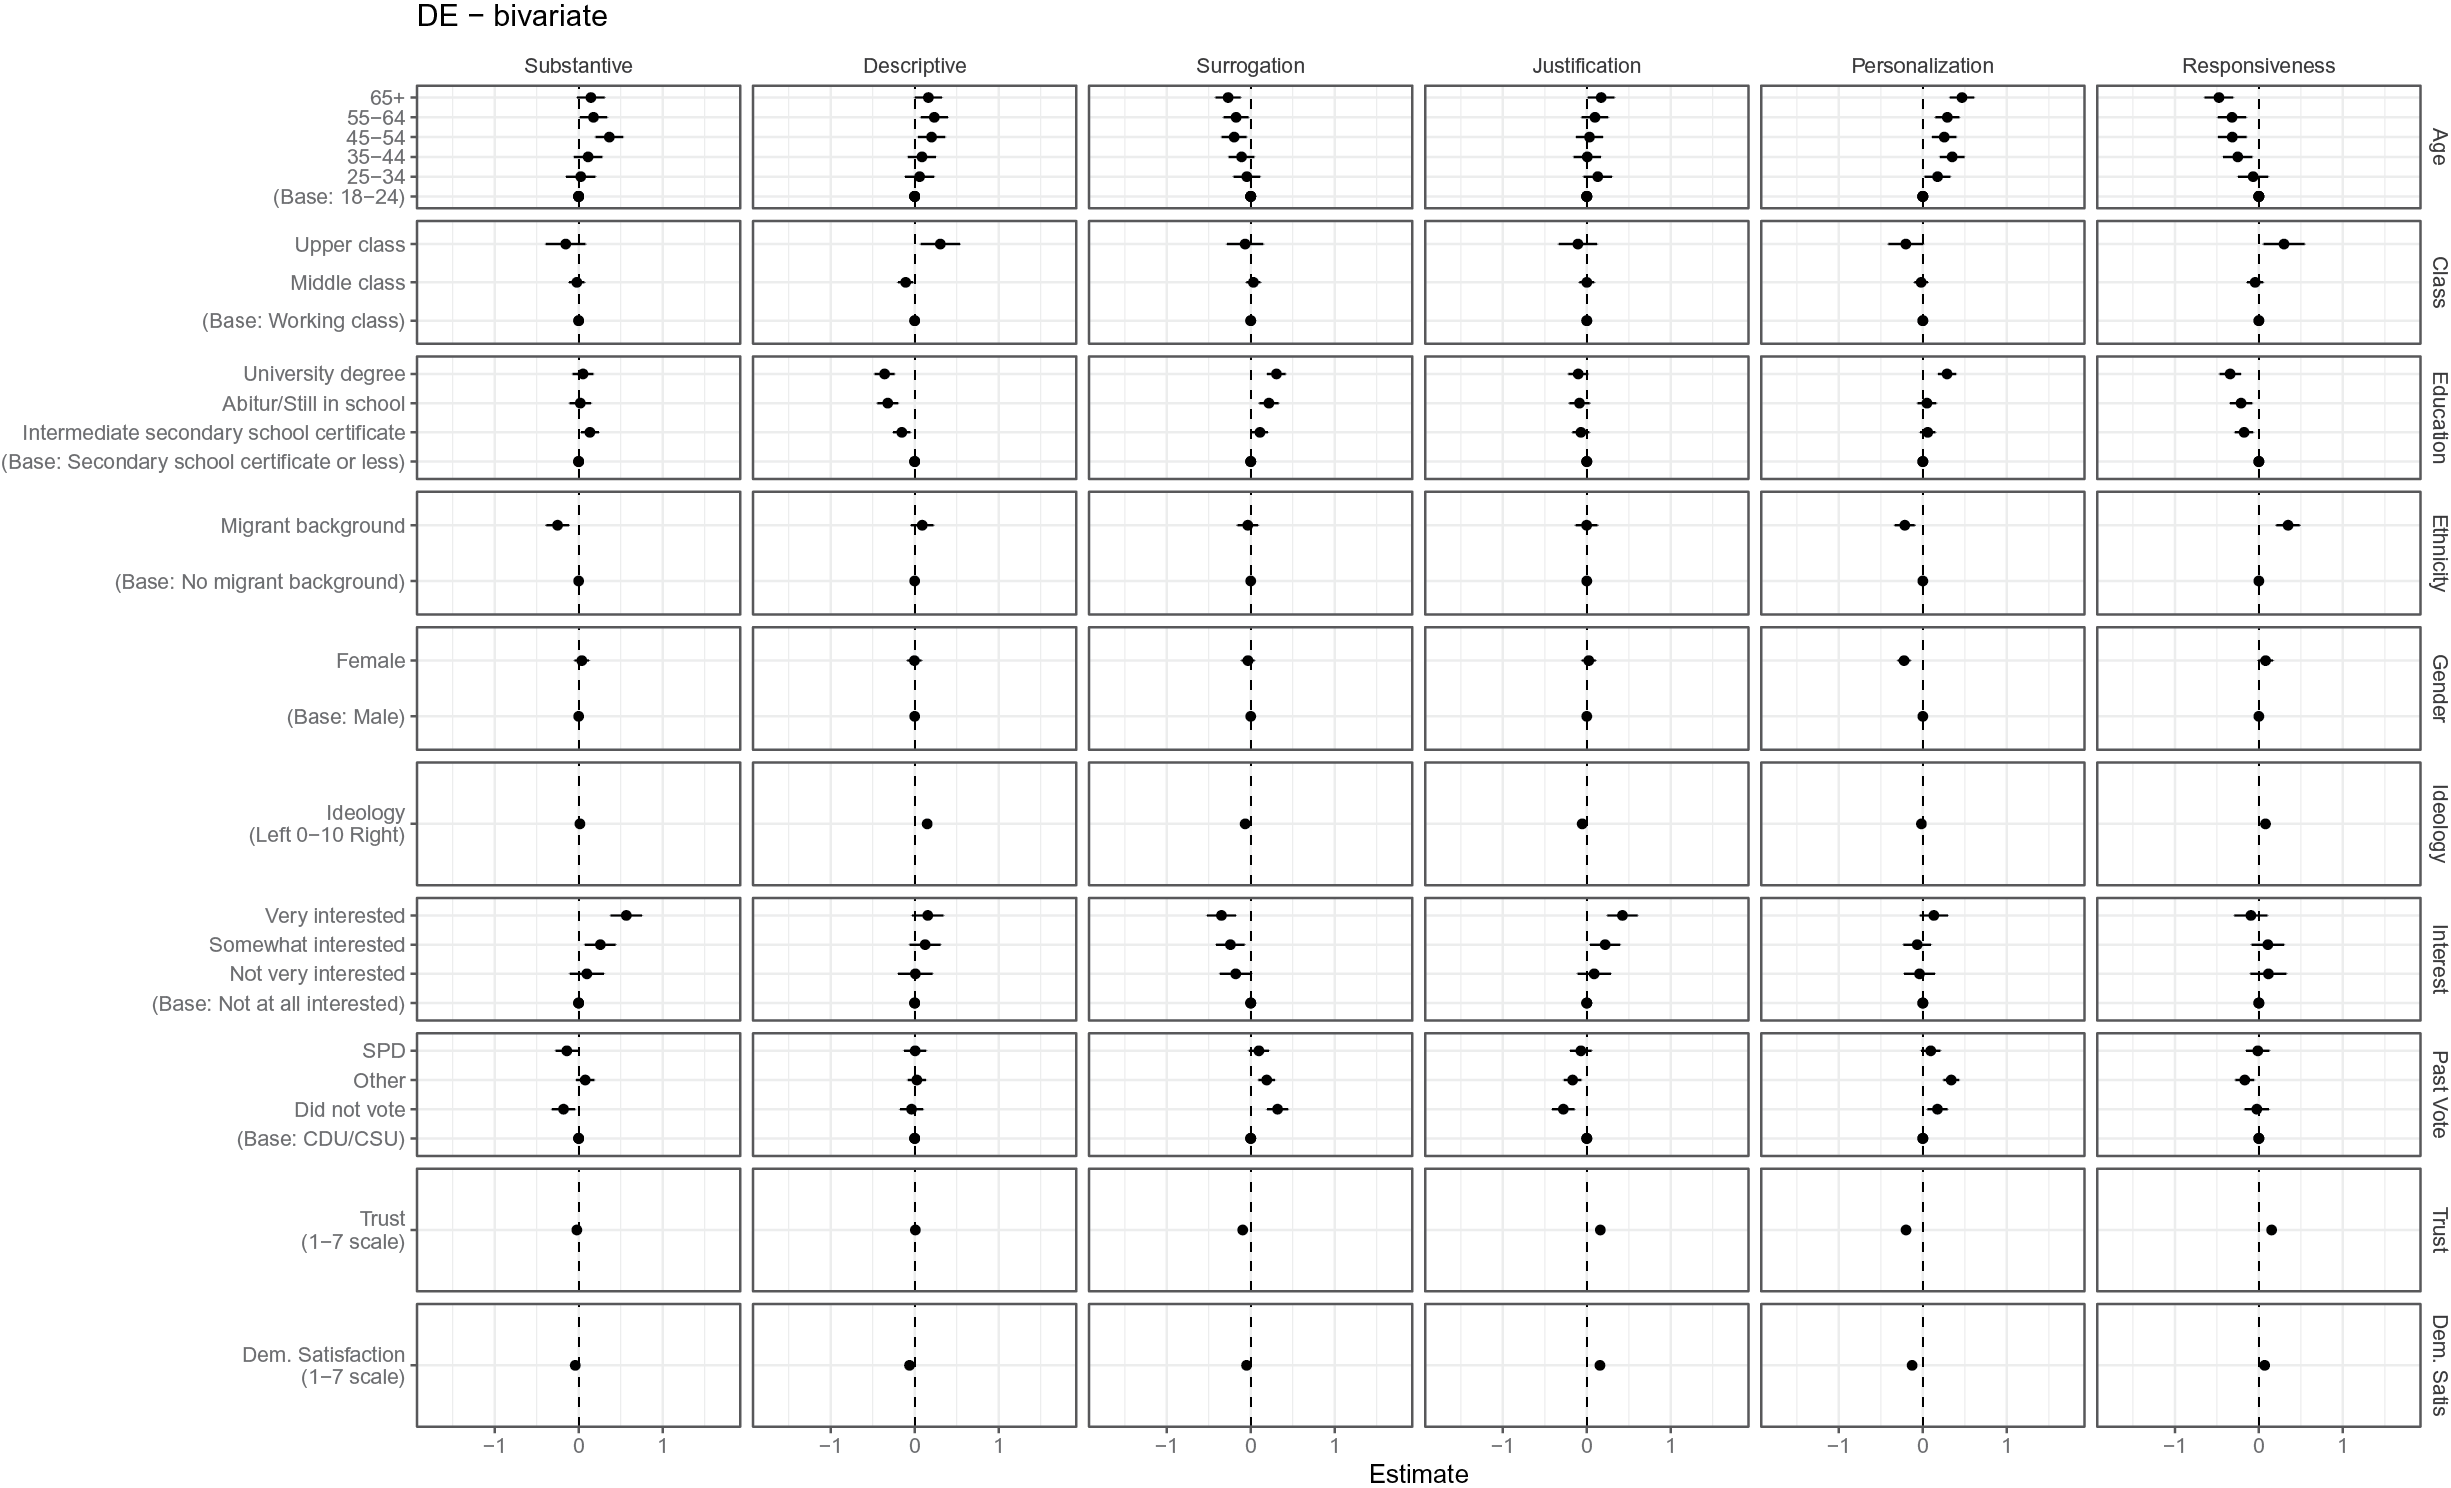
Several patterns emerge from these analyses that are noteworthy. First, we find that there is a pronounced relationship between ethnicity (in the United Kingdom) and race (in the United States) and citizens’ demands for descriptive representation. Compared to white people, both Black and Asian respondents in the United Kingdom and Black and Hispanic respondents in the United States are significantly more likely to favor representatives who share some of their own descriptive characteristics. We do not ask German respondents to provide details of their own ethnicity, but we also find German respondents with a migratory background are slightly more in favor of greater descriptive representation than those without such a background, but this result is not statistically significant.
Second, across all three countries, demands for personalized representation and for responsiveness correlate with respondent age. Older respondents want their representatives to differentiate themselves more from their political parties and be less concerned about electoral sanctions, while younger respondents favor representatives who act more in accordance with their party platforms and spend effort on securing their re-election. However, one concern is that our batteries on these two dimensions have relatively low consistency. Hence, citizens may not have coherent preferences on these dimensions or conceptualize them significantly differently than we do.
Third, there is an especially clear relationship between levels of political interest and demand for substantive representation. While it is unsurprising that respondents who have greater interest in politics are more likely to favor representatives who advance policies of which they approve, the consistency of this relationship across the three countries in our sample is striking. We also find that more politically-engaged respondents are also more likely to be in favor of representatives who provide republican, rather than pluralist, justifications.
Fourth, we also find that there is a negative relationship between satisfaction with democracy and demand for personalized representation in all three of the countries in our data. One explanation for this relationship is that those citizens who are dissatisfied with democracy are also likely to be opposed to the partisan institutions that are often the most visible actors in democratic politics, and therefore are more likely to favour representatives who find ways to distinguish themselves from their parties.
Which Dimensions of Representation Matter Most to Voters?
We now describe the analysis strategy and report the results for our conjoint experiment, which aims to measure the relative importance of the different dimensions of representation to voters’ judgements about which types of politicians better represent them in politics.
Analysis Strategy
We operationalize the relative importance of a particular dimension of representation to voters as the (absolute) size of the average marginal component effect (AMCE) of the dimension’s attributes (Hainmueller, Hopkins, and Yamamoto Reference Hainmueller, Hopkins and Yamamoto2014). The AMCE can be interpreted as the causal effect of a specific attribute value on the probability of a respondent choosing a politician compared to a baseline value of that attribute, marginalizing over all respondents and the values of all other attributes. The AMCE is a useful measure of aggregate relative “importance” of a dimension of representation to citizens, as it effectively tells us how much politicians’ probability to be seen as the better representative compared to random alternative representatives is affected by the relevant dimension. If the AMCE(s) on a dimension are small, this implies that by adopting different behaviors on this dimension, representatives cannot change much how many citizens would see them as the better representative. In contrast, dimensions with large AMCEs may move the choices of many citizens. It is important to note, however, that large AMCEs do not necessarily imply that a majority of citizens prefers a certain behavior on a dimension over another, since AMCEs average over the direction and intensity of preferences (Abramson, Koçak, and Magazinnik Reference Abramson, Koçak and Magazinnik2022). Representatives may increase their probability to be the preferred representative by a few percentage points when speaking in more “republican” terms in cases where a small fraction of the electorate strongly prefers republican over pluralist justification, always choosing the republican representative. However, the majority may still weakly prefer pluralist over republican justification.Footnote 10
In online appendix section H, we describe how we stack the data and identify the AMCEs through an OLS model. We also describe in detail how our attributes relating to substantive and descriptive representation as well as partisan surrogation are defined by combinations of the politician’s and the respondent’s characteristics (e.g., do they share the same policy position? Do they have the same gender? Is the politician from the party the respondent voted for?). Note that we use standard errors clustered on the respondent level in all conjoint analyses to account for the non-independence of the choices of each respondent.Footnote 11
Conjoint Analysis Results
We plot the AMCEs of all our attributes for each country in figure 6. This figure demonstrates that the most important dimension—in our comparison of six dimensions—for whether people think that someone represents them in politics is substantive representation. A politician who shares the respondent’s view on a policy issue is between 13 and 20 percentage points (depending on the country) more likely to be selected as the better representative than a politician who does not share the respondent’s view. The next two most important dimensions are partisan surrogation and personalization. Citizens are clearly more likely to see a politician from their favored party as their representative than a politician from another party. Politicians from parties other than the one the respondent voted for are between 11 and 15 percentage points less likely to be selected as the better representative compared to politicians from the respondent’s party. Citizens choices are also influenced by whether the politician is party-independent, with loyalist politicians having much lower selection probabilities. On average, politicians with high personalization are approximately 8–11 percentage points more likely to be selected as representatives compared to politicians who toe the party line.
Average Marginal Component Effects
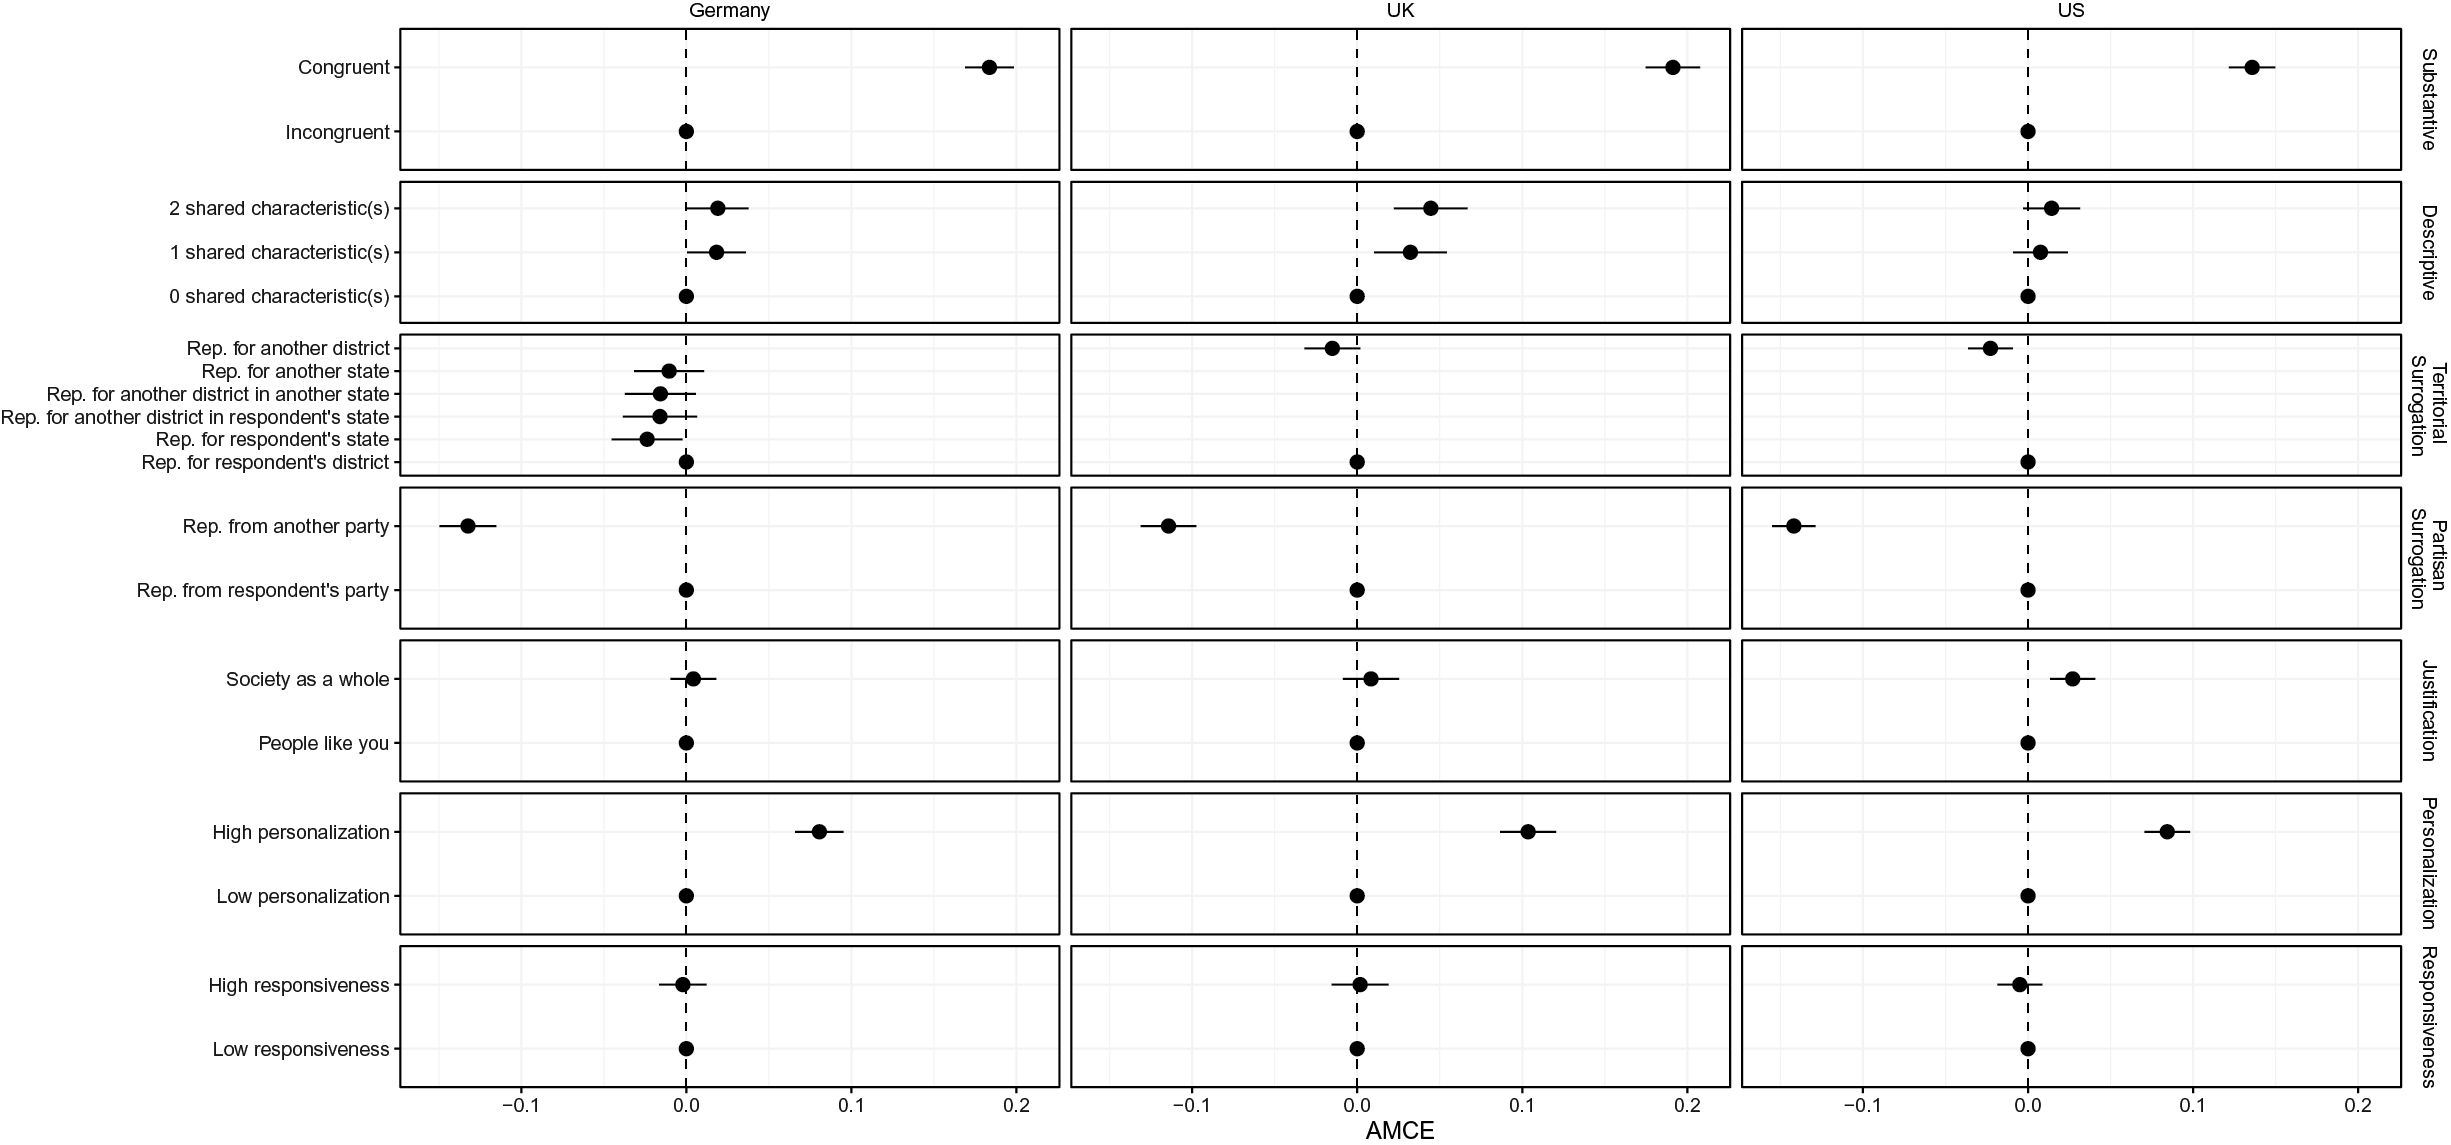
In contrast, we find much smaller and more mixed effects for the other dimensions of representation. Descriptive representation only makes a small difference in the United Kingdom and Germany but has essentially no effect on citizens’ aggregate choices in the United States.Footnote 12 The magnitude of the effect of descriptive congruence is also reasonably modest, at least when averaging across all voters. In the United Kingdom, where we see the largest effects on this dimension, respondents who share both descriptive characteristics with a hypothetical politician are nearly 5 percentage points more likely to select that politician as their representative than a politician with whom they share no characteristics. Territorial surrogation is a small liability in the United States and the United Kingdom, but the pattern is less clear in Germany, while pointing in the same direction. Republican justification is a small asset in the United States but plays no role in the United Kingdom or in Germany. Finally, responsiveness makes no difference whatsoever in any of our countries. On average, across all voters, politicians cannot increase their appeal as representatives by promising that their behaviour will be (un)responsive to electoral sanctions.
In online appendix section J, we present a series of conditional AMCE estimates for each of the dimensions. First, we investigate key interaction effects between the dimensions. We show that there is no difference in the relative importance of the other dimensions of representation conditional on whether a politician shares the policy preference of a respondent, i.e. provides substantive representation. We also show that there are only negligible differences in the AMCEs depending on whether the representative is from the party a respondent voted for.
Second, we demonstrate that the importance of substantive representation is moderated by self-reported salience that respondents ascribe to an issue. In particular, we show that when an issue is highly salient to a respondent, a politician offering substantive representation on that issue increases their selection probability by between 16 and 24 percentage points depending on the country, whereas on low salience issues the effect of substantive representation is between 13 and 16 percentage points.
Third, and importantly, we investigate heterogeneity in the effects of descriptive representation across different groups of voters and show that—although descriptive representation has only modest relative importance across all voters—shared descriptive characteristics are more important for voters of historically marginalized groups. For voters of color (in the United Kingdom and the United States), descriptive congruence increases the probability of selection by between 4 and 10 percentage points, whereas the effects for white voters are half the size. Similarly, for voters from migrant backgrounds in Germany, the effect of descriptive representation is nearly 7 percentage points, whereas it is just 1 percentage point for voters from non-migrant backgrounds. The picture is similar for gender, where descriptive congruence increases the probability of selection among female but not male voters (especially, in the United Kingdom and the United States). However, we find no evidence of conditional effects by voter sexuality. Despite this relatively higher importance of descriptive representation for historically marginalized groups, the dimension is still only the fourth most important for them (like for the public at large), except for people with racial/ethnic minority or migratory background, who rank it in third place. For them, it is about as important as personalization.
Our conjoint results also allow us to contrast the preferences of people on each dimension we elicited through the item batteries with the relative importance of these dimensions in the conjoint. First, we saw that a large majority of people in all countries prefer strong over weak substantive representation and this dimension is also important to them when deciding trade-offs between the dimensions in the conjoint. Second, with regard to personalization, people were relatively split between preferring party independence or loyalty, with only small majorities preferring rebellious politicians. However, the conjoint shows that party rebels are more likely than loyalists to be selected as good representatives. This suggests that the group of people supporting party independence care more intensely about personalization than those who favor loyalist representatives. Third, while a large majority generally does not prefer representatives to be surrogates from other districts or parties, the conjoint reveals that this aversion is only important with regard to partisan surrogation. Politicians from the respondent’s party that have been elected in other districts only have a marginally lower probability of being seen as a good representative (e.g., 1-3 percentage points) than district representatives. Fourth, in comparison to the other dimensions, descriptive representation is only the fourth most important dimension, but clearly plays a larger—still not a top—role in the selection decisions of certain groups. Fifth, despite large majorities preferring republican over pluralist justification, this dimension is of relatively little importance when citizens select between different hypothetical representatives. Finally, the majority of citizens do not want their representatives to be sensitive to electoral sanctions, but on average people do not care about this aspect of representation when they have to assess trade-offs between the dimensions.
Implications for the Study of Representation
Our results have important implications for how we should study representation empirically, and how we should think about it theoretically. First, while much recent work on representation has addressed the question of descriptive representation (notably the descriptive representation of women, e.g., Wängnerud Reference Wängnerud2009; Betz, Fortunato, and O’Brien Reference Betz, Fortunato and O’Brien2021), we find that, in the aggregate, citizens put comparatively little weight on this dimension. It is primarily historically marginalized groups, in particular ethnic/racial minorties and people with migratory background, who care more about it. These results challenge previous findings that ethnic majority groups (e.g., whites in the United States) also significantly care about descriptive representation (Gay Reference Gay2002; Harden Reference Harden2015), while simultaneously underlining that descriptive congruence is valued by historically marginalized groups (e.g., Bengtsson and Wass Reference Bengtsson and Wass2010; Schildkraut Reference Schildkraut2013). Crucially, our results also show that for marginalized groups descriptive representation can be more than simply a cue for substantive representation (as some have argued it is for voters at large, see Arnesen, Duell, and Johannesson Reference Arnesen, Duell and Johannesson2019), since our conjoint design controls for substantive representation and four other dimensions of representation (see also Hayes and Hibbing Reference Hayes and Hibbing2017).
Our results on descriptive representation therefore suggest that a research agenda that takes the citizens’ perspective more seriously should devote genuine attention to the descriptive representation of women, ethnic minorities and potentially further groups. At the same time, our results show that descriptive representation is not a great representational concern of the public at large. This contrasts with findings that descriptive representation positively affects outcomes such as perceived decision legitimacy and fairness (e.g., Arnesen and Peters Reference Arnesen and Peters2018; Clayton, O’Brien, and Piscopo Reference Clayton, O’Brien and Piscopo2019; Hayes and Hibbing Reference Hayes and Hibbing2017), democratic process evaluations (e.g., Karp and Banducci Reference Karp and Banducci2008), or political efficacy (e.g., Stauffer Reference Stauffer2021) in the general electorate.
Second, we find that citizens generally strongly care about whether a representative toes or defies the party line—what we call personalization. The majority prefers party independence, but citizens are divided here. These findings underline the relevance of recent work on personalization (e.g., Slapin et al. Reference Slapin, Kirkland, Lazzaro, Leslie and O’Grady2018; Campbell et al. Reference Campbell, Cowley, Vivyan and Wagner2019; Bøggild Reference Bøggild2020; Carson et al. Reference Carson, Koger, Lebo and Young2010; Kam Reference Kam2009) and suggest devoting more attention to this dimension of representation. For instance, there still exists little work on how exactly representatives try to “personalize” their communications and self-presentations (e.g., during campaigns), and how citizens react to them.
Third, our results on surrogation show that while most citizens prefer a representative from their territorial district, they ascribe relatively little importance to this dimension when considered alongside other dimensions of representation. Many citizens are ready to see someone as their representative who was not elected in their constituency or state. In turn, citizens clearly oppose partisan surrogation and put a great deal of weight on the party of their representative when choosing between politicians. This finding is relevant to many standard quantitative research designs that elicit state or district opinion and relate them to the behavior of the local elected representative—who will for a large fraction of citizens not be from the party they voted for. These designs are bracketing surrogate relationships that likely make up a substantial share of the representative relationships that matter to citizens. Paying more attention to these non-electoral representative relationships should be a priority in future research. The same goes for potentially conflicting preferences on the dimension of partisan surrogation: note that citizens’ aversion to the latter conflicts with our results on personalization, since it suggests that the representative with the highest support is someone from one’s preferred party who still defies the party line (refer to figure A4 in online appendix section J). Citizens seem to value the party label while also wanting their politician to resist strong party discipline, but we do not know why.
Fourth, we show that the familiar finding that citizens prefer delegate-style representation over trustee representation may actually be due to confounding based on conceptual conflation. Once we break up delegate representation into substantive representation, responsiveness to voters’ electoral sanctions, and pluralist justification style, we can see that it is substantive representation and not the responsiveness to electoral sanctions that matters to voters. Moreover, majorities in all countries actually prefer a representative who does not focus upon their re-election prospects at the next election (see also Bøggild Reference Bøggild2016). The fact that our battery items on responsiveness have lower consistency may even underline that citizens hold no strong, coherent preferences towards this conception of representation. This suggests that the extensive treatment of substantive representation in the empirical literature is justified. Yet it is doubtful that more attention should be devoted to understanding how politicians forestall electoral sanctions (e.g., Stimson, MacKuen, and Erikson Reference Stimson, MacKuen and Erikson1995; Erikson, MacKuen, and Stimson Reference Erikson, MacKuen and Stimson2002; Canes-Wrone and Shotts Reference Canes-Wrone and Shotts2004).
Finally, our results show that representation preferences vary by key socio-demographic and political variables at the individual level, but are rather uniform across countries. This suggests that a research agenda starting from the citizens’ perspective must devote considerable attention to how different groups want to be represented. This promises to usefully inform both theory and empirics.
Conclusion
If we accept, in line with the constructivist turn in political representation, that representation is a relationship between citizens and politicians that is shaped by both sides, then citizens’ preferences regarding representation should be a key concern for political scientists. Moving beyond existing accounts of citizens’ representation preferences, our study sought to find out what citizens want from political representatives. Starting from a conceptual framework that incorporates recent innovations in political theory, we used a novel conjoint experiment and survey item batteries to measure the relative importance of different dimensions of representation to citizens as well as to identify majority preferences, preference distributions, and correlates of preferences on the respective dimensions. Preferences on two of these dimensions (justification, surrogation) have never been examined before.
Our work has several limitations. First, while our focus here is on measuring and describing citizens’ preferences for multidimensional representation, a logical next step is deriving theoretical hypotheses that explain these preferences and empirically testing them. Partially, this exercise can draw on existing work on citizens’ representation preferences that has identified key explanatory factors (e.g., economic position, education, ethnicity) as well as on work on related attitudes (e.g., the relationship between populist and democratic attitudes, see Zaslove and Meijers Reference Zaslove and Meijers2023). However, some theoretical groundwork will still be needed, especially on “new” dimensions such as justification and surrogation, and on how preferences between the dimensions are connected (e.g., some preference configurations may occur more often in certain individuals). We view deductive, explanatory accounts of multidimensional representation preferences as a key avenue for future research that could even draw on our replication data to test hypotheses.
Second, we focus on general preferences towards representation that are largely uncontextualized and unconstrained. Our empirical instruments ask people how representatives should be or behave without providing much context (e.g., what consequences their behavior could have) and without imposing any resource, time, or other constraints that exist in reality (e.g., representatives who represent across districts may spend less time on their own district). Clearly, providing more context and modelling constraints may change citizens’ preferences and future work should investigate to what extent and in what directions. In part, this could also be based on work that first engages with the representative side and asks legislators what forms of representation they deem possible (e.g., in elite-level survey experiments), identifying the set of constraints representatives face. Nevertheless, we believe our focus on citizens’ general tendencies regarding the different dimensions is important, as citizens may often not be aware of constraints or all relevant contextual factors when they evaluate representation in reality. Hence, contrasting our results with how representatives usually (can) act in reality, may provide key insights as to why many citizens are disaffected with how representation works in their country (e.g., they may like independent rebel politicians, but systems with strong parties may sanction rebellion; also see Wass and Nemčok Reference Wass and Nemčok2020).
Third, future survey experiments on preferences for multidimensional representation could address specific limitations of our design. On one hand, our design is not suited to unpack potential mediation relationships between the dimensions (e.g., a potential effect of responsiveness could be mediated by substantive representation). Such mediation could be investigated with amended designs, varying, for instance, the number of representation dimensions included in the choice tasks (Acharya, Blackwell, and Sen Reference Acharya, Blackwell and Sen2018). On the other hand, our operationalization of the justification dimension, in particular, is relatively narrow. For pluralist justification, we circumvent the mentioning of concrete, specific groups, since the number of groups that can be used by representatives to justify their behavior in pluralist terms is vast and may vary between countries. This could be tackled in the future. Moreover, one could also incorporate other understandings of justification in amended designs (e.g., see the more general understanding in Esaiasson, Gilljam, and Perrson Reference Esaiasson, Gilljam and Persson2017, Reference Esaiasson, Gilljam, Persson, Narud and Esaiasson2013).
Fourth, while our approach derives the dimensions of representation from political theory, thereby widening the set of dimensions usually considered in empirical research, this may still be limiting. A full constructivist approach that views representation as an interactive relationship between citizens and politicians should arguably pay more attention to how citizens make sense of and conceptualize representation in the first place. We think that—as of now—we cannot exclude the possibility that citizens may care about other aspects of representation not captured in the six dimensions or conceptualize the dimensions differently. The low consistency of our preference scales on personalization and responsiveness could be interpreted as a hint to this possibility. Hence, future complementary work could adopt a much more inductive approach to explore citizens’ understanding of representation that abstains from administering researcher-derived conceptualizations of representation (e.g., through open-ended questions or qualitative interviews).
There are several broader takeaways of our article. First and foremost, we suggest new directions for the study of political representation. Our results show that the focus of much of the current work in the field of quantitative representation research contrasts with the representational demands of citizens. A research agenda that is more strongly informed by citizens’ preferences for representation would pay more attention to surrogate representation across districts and investigate the role of the party as a key enabler of this form of representation; it would explore the extent to which demands for descriptive representation are conditional on group identity; and it would reduce the attention paid to electoral sanctioning, which appears to be largely irrelevant to voters. Expanding representation research in these directions promises to provide us with new insights about how legitimate representation really is today.
Second, the research presented in this article also has some more immediate takeaways for political practitioners, notably elected representatives themselves. Consider, in particular, our findings regarding surrogate representation. These suggest that elected representatives, especially so in countries with majoritarian electoral systems, should be more aware that constituents from other districts may expect or demand being represented by them as well. Although trying to represent those citizens does not in any straightforward way lead to more votes, it can increase the overall legitimacy of representation, in that it expands the circle of those whose representational demands are satisfied (see Mansbridge Reference Mansbridge2003, 522-24).
Another practical implication has to do with citizens’ rather ambivalent attitudes on how representatives should relate to their party: citizens appear to want representatives to be partisans (of their preferred party, of course), yet they also tend to want representatives to act independently of their party. The best way for elected political representatives to handle these conflicting demands may be to be more explicit about their specific role(s) within the party and, indeed, about the need for the party to function as an effective vehicle for realizing a broader political agenda. The alternative to this—strategically presenting oneself as an independent agent who “rebels” against the party leadership—has its drawbacks for the functioning of representative democracy. It may not only destabilize parties internally (e.g., Rahat and Kenig Reference Rahat and Kenig2018), but may also further increase public distrust in the party as a political form. This may put the long-term success of the party at risk, which cannot be in the interest of citizens, either. In this light, representatives would do well to achieve a balance between meeting citizens’ personalization demands and keeping the party sufficiently cohesive and functional.
Supplementary material
To view supplementary material for this article, please visit http://doi.org/10.1017/S1537592724001373.
Acknowledgments
The authors are indebted to many colleagues who have provided excellent comments on this project, including Rodwan Abouharb, Stefanie Bailer, Lucy Barnes, Michael Bechtel, Matthew Bergman, Inken von Borzyskowski, Rikki Dean, Laurenz Ennser-Jedenastik, Peter Esaiasson, Christina Gahn, Lotte Hargrave, Helene Helboe Pedersen, Daniel Höhmann, Lena Huber, Uwe Jun, Markus Kollberg, Ann-Kristin Kölln, Werner Krause, Ben Lauderdale, Jeanne Marlier, Stefan Marschall, Theres Matthieß, Paolo Morini, Wolfgang Müller, Tom O’Grady, Miguel Pereira, Meg Russel, Tanja Schüberl, Katerina Tertytchnaya, Asa von Schoultz, Manuel Wagner, Markus Wagner, Mirko Wegemann, Thomas Winzen, Reto Wüest, and Thomas Zittel. Previous versions of this work were presented in seminars at University College London, the University of Trier, the University of Vienna, the University of Düsseldorf, the Center for Comparative and International Studies in Zurich, and The Mannheim Center for European Social Research, as well as at the “Representation and Citizens’ Political Beliefs and Behaviors” workshop at the University of Basel in 2023 and the annual meetings of the European Political Science Association in 2021 and the European Consortium for Political Research in 2022. We thank Laura Pfisterer for her excellent research assistance on this project. The authors acknowledge generous financial support by the Department of Political Science at Aarhus University (provided to Fabio Wolkenstein). Co-funded by the European Union (ERC, MULTIREP, 101076033). Views and opinions expressed are however those of the author(s) only and do not necessarily reflect those of the European Union or the European Research Council. Neither the European Union nor the granting authority can be held responsible for them.


 Open access