

1. Introduction
Insoluble microparticles (hereafter, microparticles) in polar ice cores are predominantly dust transported over long distances from terrestrial regions to the polar ice sheets and have been analyzed as a proxy for terrestrial environmental changes in ice core studies (e.g. Petit and others, Reference Petit, Briat and Royer1981, Reference Petit1999; Thompson and Mosley-Thompson, Reference Thompson and Mosley-Thompson1981; Fujii and others, Reference Fujii, Kohno, Matoba, Motoyama and Watanabe2003; Lambert and others, Reference Lambert2008). These microparticles have been analyzed since the first ice core studies (Marshall, Reference Marshall, Wexler, Rubin and Caskey1963; Hamilton and Langway, Reference Hamilton and Langway1967). Methods for measuring microparticle concentrations in snow and ice samples from glaciers and polar ice sheets at the National Institute of Polar Research (NIPR) have been improved, including improvements in sample pretreatment, device operation and sample storage (Fujii and others, Reference Fujii, Kohno, Matoba, Motoyama and Watanabe2003; Miyake and others, Reference Miyake, Hirabayashi, Ryu Uemura, Goto-Azuma and Motoyama2009, Reference Miyake2014).
In our laboratory, counting and size analysis of microparticles in snow and ice-core samples are carried out using a laser particle counter (Model-211; Met One Inc., Grand Pass, OR, USA), which is a type of light-scattering liquid-borne particle counter (LSLPC), and a Coulter counter (Multisizer 4e; Beckman Coulter, Brea, CA, USA). As determined by using polystyrene latex suspensions (the smallest particle size detectable: 0.505 μm; Polysciences Inc., Tokyo, Japan) and considering the background noise, the detection minima of the two devices in our laboratory are both 0.52 μm and measurement accuracies are both within ±10% (repeatability, <5%). For details, please refer to Ohata and others (Reference Ohata, Moteki, Schwarz, Fahey and Kondo2013) and Mori and others (Reference Mori2016). Techniques based on light scattering and the Coulter principle are commonly used to measure microparticles in snow and ice-core samples (e.g. Fujii and others, Reference Fujii, Kohno, Matoba, Motoyama and Watanabe2003; Lambert and others, Reference Lambert2008). The laser particle counter uses infrared laser light from a semiconductor laser diode. The size of the microparticles is determined from the intensity of scattered light, whereas the number of microparticles is determined by the number of pulses of scattered light (Fujii and others, Reference Fujii, Kohno, Matoba, Motoyama and Watanabe2003). A Coulter counter measures changes in electrical conductance as microparticles suspended in an electrolyte pass through a small orifice, enabling high measurement accuracy for volume, size and concentration (counts). The technology was developed to count blood cells (e.g. Vembadi and others, Reference Vembadi, Menachery and Qasaimeh2019) and is currently used to count bacteria, prokaryotic cells and other cell types (e.g. Kulp and others, Reference Kulp2004; Vembadi and others, Reference Vembadi, Menachery and Qasaimeh2019). It is also widely used to measure particles in snow and ice-core samples. In addition, Coulter counter measurements do not depend on the surface morphology, internal structure, refractive index or color of microparticles, unlike optical measurement methods.
In chemical and microparticle analyses of snow and ice samples, a sample is melted, dispensed into different bottles, and then kept frozen or refrigerated until analyses. Despite some differences among laboratories, the general technique is widely used. At NIPR, melted water samples for microparticle measurements are placed in a 30 mL glass bottle and refrigerated at 4°C, a common refrigeration condition. The storage period can be as long as several weeks due to methodological and practical limitations such as machine availability and the need for repeated measurements. This storage protocol is based on a study by Miyake and others (Reference Miyake2014), who compared various procedures for preservation and microparticle analyses. They found that melted water samples from the Dome Fuji ice core (Antarctica) stored in a glass bottle and refrigerated for 1 year showed no obvious change in microparticle concentration measured using a laser particle counter. Storage in a freezer resulted in increases in dust concentrations of 9.3–141.7% (average, 64.3%; n = 9). The authors assumed that the inner wall of the storage bottles was the source of microparticles.
However, we recently found that even melted ice-core samples stored in a refrigerator sometimes show increases in microparticle concentration (unpublished). Increases typically begin a few weeks after preservation and could be clearly detected using a Coulter counter but not a laser particle counter. These increases are dominated by particles of ~0.6–1.0 μm, consistent with the size of biological particles such as bacteria, which are typically on the order of ~0.3–1.0 μm (Després and others, Reference Després2012; Pumkaeo and Iwahashi, Reference Pumkaeo and Iwahashi2020). There is now abundant evidence that snow and ice contain viable microorganisms (e.g. Xiang and others, Reference Xiang, Yao, An, Xu and Wang2005; Chuvochina and others, Reference Chuvochina2011; Brown and Jumpponen, Reference Brown and Jumpponen2019; Krug and others, Reference Krug, Erlacher, Markut, Berg and Cernava2020). Thus, we attributed the observed particle increase to a small number of microorganisms remaining dormant as spores in snow and ice until samples are melted and growth resumes (so-called germination). Improvements in the current method for the long-term preservation of samples for microparticle measurements aimed at the inhibition of microbial growth are therefore required.
For the preservation of environmental water samples, inhibitors such as mercury (II) chloride, sodium azide and formaldehyde are typically added to prevent alterations of the samples by microorganisms (e.g. Knauer and others, Reference Knauer, Karl, Martini and Hunter1984; Eljarrat, Reference Eljarrat and Janusz2012). However, these chemicals require some degree of expertise and large experimental facilities, including a fume hood, for handling. In addition, waste liquid disposal is costly and careful handling is required to avoid contamination, alterations or losses of microparticles.
We therefore focused on sterilization using ultraviolet (UV) irradiation as an inexpensive and simple method. Germicidal irradiation has been applied to various objects, including systems for ultrapure water cleaning, water purification, disinfection of wastewater and even ice borehole disinfection for clean access to Subglacial Lake Ellsworth (Kawabata and Harada, Reference Kawabata and Harada1952; USEPA, 1996; Keen and Brito, Reference Keen and Brito2014). This physical method for sterilization renders microorganisms inactive, without requiring expertise, by simply irradiating water samples with UV light for a certain time period. UV radiation covers the wavelength range of 100–380 nm. DNA and RNA absorb light in the ultraviolet C (UVC) range (i.e. 100–280 nm). When microorganisms are exposed to UVC light, nucleic acids become damaged, inhibiting cell replication. Wavelengths from 250 to 280 nm have the greatest germicidal effects (e.g. Beck and others, Reference Beck2017).
This treatment has yet to be applied to melted snow and ice from glaciers or ice-core samples. Therefore, the effects of UV application on the number of microparticles and/or other characteristics of melted snow/ice are unclear. For example, some organic particles might be destroyed by UV treatment. Organic compounds may act like ‘glue’ for mineral particles (e.g. Angst and others, Reference Angst2019). Soil particles are often held together by various organic substances and aggregate particles transported by winds have also been found in glacier ice (e.g. Oyabu and others, Reference Oyabu2015; Dong and others, Reference Dong2018). This destruction of organic matter would increase the microparticle count. The purposes of this study were (1) to confirm the effect of UV disinfection and investigate its influence on the number and size distribution of microparticles in melted snow and ice samples, (2) to evaluate temporal variation in the size distribution of microparticles, reflecting the activity of microorganisms, in untreated samples, and (3) to compare the use of LSLPC and Coulter counter for analyses of biological particles in samples.
2. Study area and methods
In this study, we used surface snow collected at the St6 site on Glacier No. 31 (62°36′N, 140°51′E; 2120 m a.s.l.) in the Suntar-Khayata Range, eastern Siberia, Russia from July to August 2013. The St6 point was located near the terminus of the glacier. Multiple snow samples were collected. In addition to samples at St6, snow samples were collected at different elevations along the glacier for analyses of chemical components and microparticles. Details of the glacier based on observations in the 2013 summer season have been reported by Nakazawa and others (Reference Nakazawa2015) and Shirakawa and others (Reference Shirakawa2016). The samples were placed in sterilized plastic bags, stored in a cooler box, and brought to Japan in their frozen state. The internal temperature of the box was maintained at ~−40°C until shipping. The temperature was increased to 5°C in Japan. Samples were then kept in a cold room at −30°C until use. A sample from one plastic bag was used for experiments on temporal variation in the microparticle concentration and size distribution. When this sample was exhausted, a sample from another plastic bag was used to compare different methods of counting microparticles. Both samples were prepared and treated in the same way.
The snow was melted once at room temperature and divided into two portions immediately after melting. One fraction was set aside for another analysis, and the other fraction was refrozen immediately and refrigerated at −30°C until used for analysis. The storage period was ~5 years. The procedures for sample preparation are shown in Figure 1. The melted water sample was divided into two 500 mL glass beakers for UV germicidal irradiation and an untreated control. A quartz glass beaker was used for UV germicidal irradiation because quartz glass transmits more than 80% of UV at a wavelength of 254 nm, whereas borosilicate glass, which is commonly used for glassware such as Pyrex beakers, blocks short-wavelength radiation below 280 nm (e.g. Shih and others, Reference Shih, Hsu, Wu, Lin and Sun2013; Gross and others, Reference Gross, Stangl, Hoenes, Sift and Hessling2015; Nürnberg and others, Reference Nürnberg, Kühn and Rollmann2016). To target and disable microorganisms, UV disinfection treatment (hereinafter, ‘UV treatment’) was performed under UV light at 254 nm for 1 h using a UV Crosslinker (CL-1000, 254 nm; UVP, Upland, CA, USA) placed on a class-100 clean bench. The cumulative radiation dose applied was 21.8 J cm−2. The germicidal irradiation required for 99.9% inactivation of various microorganisms in various sample types (e.g. culture medium, seawater, groundwater and distilled water) is typically estimated to be a few to a few hundred millijoules per centimeter squared (Kawabata and Harada, Reference Kawabata and Harada1952; Hirata, Reference Hirata2008). Although pure water does not absorb UV down to 190 nm (e.g. Smith and Burgess, Reference Smith and Burgess1997; Yarita and others, Reference Yarita, Nakajima, Shimada, Kinugasa and Shibukawa2005), various types of water absorb germicidal radiation. The water thicknesses (depth) that attenuate germicidal radiation by one-tenth (10%) are 0.53 m for tap water and 0.54 m for seawater (Yamanaka and others, Reference Yamanaka, Morita, Horaguchi, Yamayoshi and Sugiura2003). In this study, the water depth in the beaker was ~0.1 m. Therefore, a UV radiation dose of 21.8 J cm−2 should be sufficient for inactivation, even when loss (attenuation) in the water sample is considered.
Flow diagram showing the procedures for sample preparation.
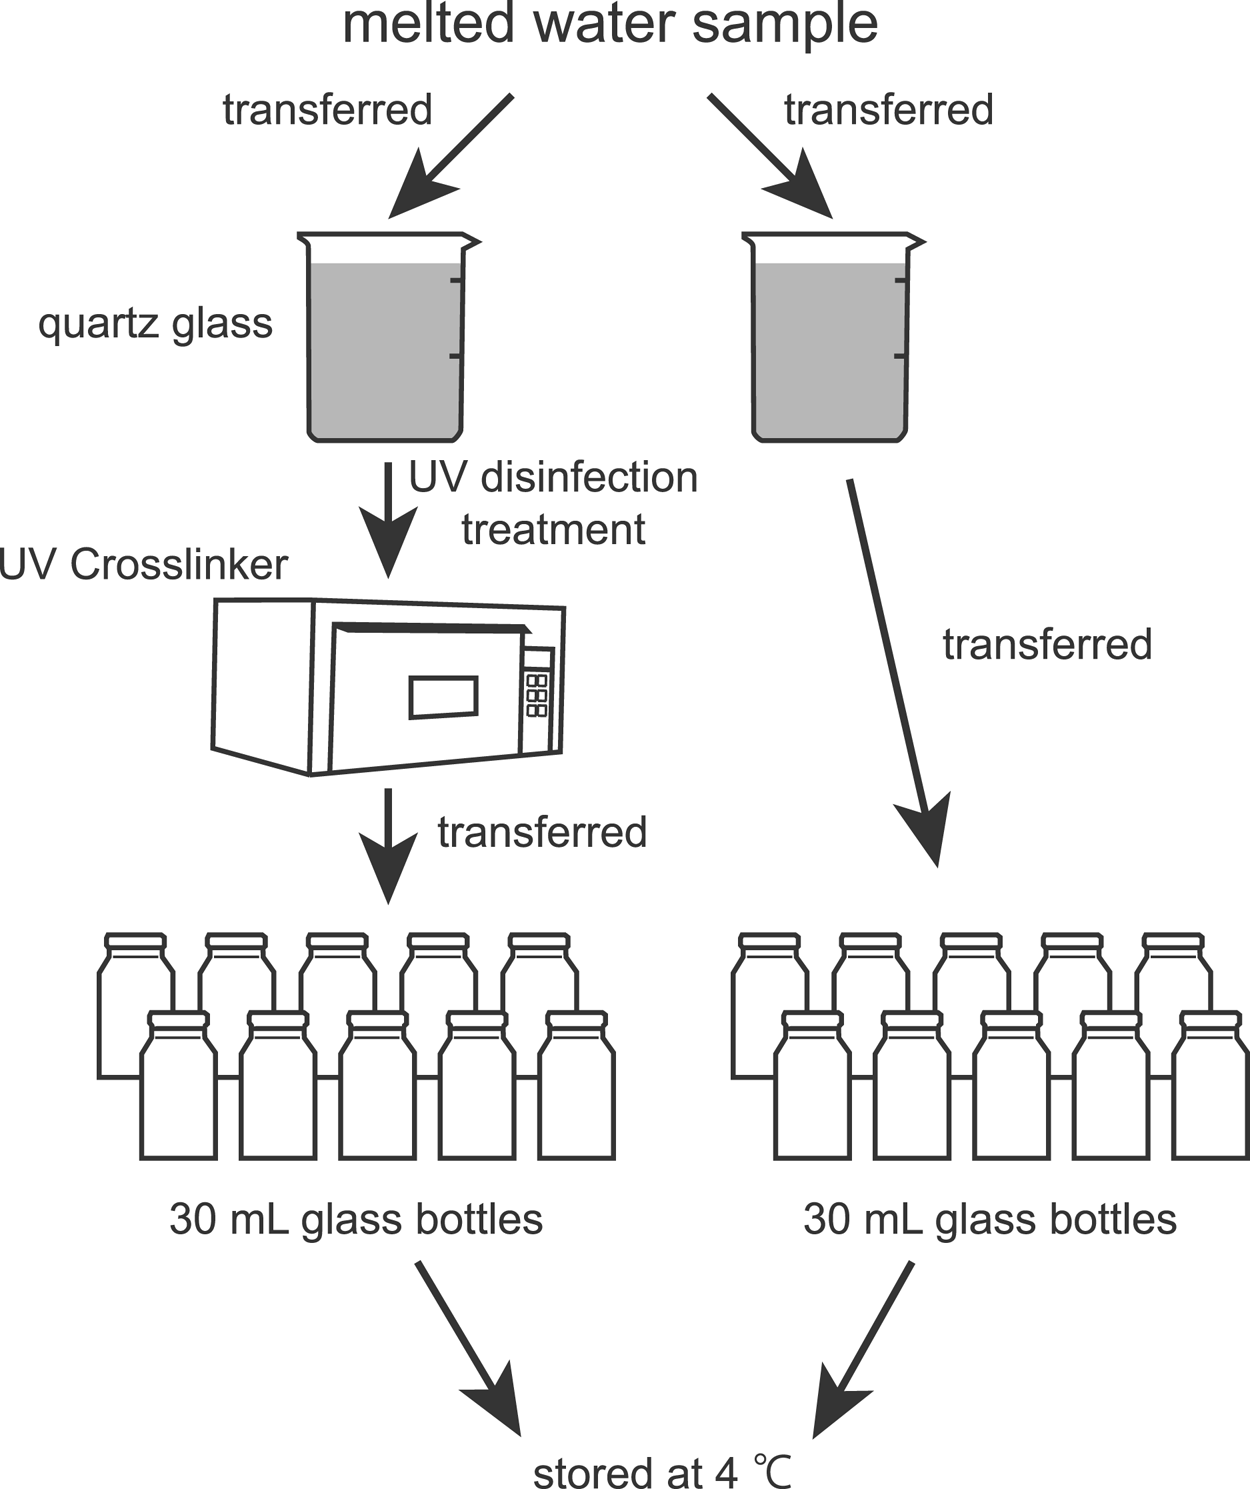
After UV treatment, water in each beaker was transferred into multiple glass bottles of 30 mL at a clean bench and then stored in a refrigerator at 4°C until measurements of the microparticle concentration and size distribution using the Coulter counter (Multisizer 4) and the laser particle counter (Model-211). The UV-treated and untreated water samples in the glass bottles were used for measurements every several days for detailed and efficient observations. To prevent microbial contamination in the water samples during measurements, the remaining water in the bottle was not reused; instead, water in an unopened bottle was used. Additionally, water samples in two bottles from each of the two treatment conditions were measured each time, with very few exceptions.
Temporal variation in microparticle concentration and size distribution was evaluated for 53 d, at which point the sample bottles were exhausted. For the sample series without UV treatment, the measurements were continued until 127 d using the remaining water from sample bottles used for measurements on day 47. A separate experiment was performed over 27 d for a comparison of the Coulter counter and the laser particle counter.
To directly detect the growth of microorganisms in the liquid samples, the untreated water samples on day 40 and UV-treated water samples on day 48 were evaluated using a viable particle counter (XL-10BT2 and XL-28A1; RION Co. Ltd., Tokyo, Japan), which enabled counts of both biological and non-biological particles in real-time. The water samples remaining after the Coulter counter measurement on day 34 were sent to RION Co. Ltd and were measured on the corresponding days (days 40 and 48, respectively). The method for particle detection was the same as that for LSLPCs. When a part of the light hits a particle, various phenomena, such as absorption, refraction or reflection, occur. Information about the number of particles and their sizes is obtained from the scattered light intensity and information about the number of biological particles is obtained from the fluorescent light detector. Most biological particles have a substance (such as riboflavin) that emits fluorescence (Aubin, Reference Aubin1979). The viable particle counter detects the autofluorescence of a biological particle in sample liquid by irradiating the sample at wavelengths 254 and 185 nm. The principles of the equipment are described by Naramura and others (Reference Naramura, Ide, Sekimoto and Takesawa2013).
We did not measure concentrations of dissolved organic matter, a potential nutrient source for microorganisms, because this was beyond the scope of the present study.
3. Results and discussion
3.1 Changes in the microparticle concentration
In an analysis of temporal variation using the Coulter counter, the microparticle concentration in samples without UV treatment showed an increasing trend (Fig. 2). The concentrations started to increase gradually from 7 d, except for the sample on day 53, which had an equal concentration to that on day 0. Because the sample bottles were exhausted on day 53, we continued to examine microparticle concentrations using the remaining water from sample bottles used for measurements on day 47. The remaining water was refrigerated, except during the measurements. The concentrations continued to increase, even on days 60 and 127. Therefore, refrigeration storage at 4°C does not prevent alterations in microparticles in the samples.
Temporal variation in microparticle concentrations in melted water samples in the UV-treated and untreated groups measured using the Coulter counter. Particles of 0.52–12.0 μm were counted over 53 d for UV-treated samples and 127 d for untreated samples. For days 60 and 127, the remaining water after the measurement on day 47 was used for continued examination of microparticle concentrations. Water samples in two bottles from each of the two treatment conditions were measured at each time point. A regression line fitting data for untreated samples is drawn.

No obvious increase in microparticle concentration was observed in samples subjected to UV treatment (Fig. 2). The concentrations were maintained at the same level for 53 d. Therefore, UV irradiation for 1 h prevented the growth of microorganisms in melted water samples for at least 53 d, demonstrating a long-term effect. However, the optimal UV irradiation conditions may depend on the sample type. These results confirm that UV treatment is an effective approach for the long-term storage of samples for microparticle measurement in a refrigerator.
UV treatment did not change the microparticle concentration. The microparticle concentrations in the UV-treated samples on day 0 were 1.8 × 10⁵ and 1.9 × 10⁵ mL−1. At later timepoints, the concentrations were in the range of 1.5 × 10⁵ to 1.7 × 10⁵ mL−1. Similarly, both untreated samples had concentrations of 2.0 × 10⁵ mL−1 on day 0. On day 7, before changes were observed, concentrations were 1.8 × 10⁵ and 1.9 × 10⁵ mL−1. Although UV treatment increased the water temperature by 7.3°C, it did not have substantial effects on the dissolution of microparticles. Based on this comparison of UV-treated and untreated samples, we concluded that the microparticle concentration was not substantially altered by UV treatment.
3.2 Changes in the microparticle size distribution
We investigated the influence of UV disinfection on the size distribution of microparticles in the samples. Figure 3 shows the microparticle size distribution for untreated samples on day 0 (indicating the initial distribution of microparticles) and UV-treated samples on days 0 and 53 measured using the Coulter counter. The microparticle size distributions for the UV-treated samples remained identical to the initial state over 53 d. Therefore, UV treatment does not alter the microparticle size distribution or the microparticle concentration.
Microparticle size distribution for untreated samples on day 0 and UV-treated samples on days 0 and 53 measured using the Coulter counter. Water samples in two bottles were measured, except on day 53.

The untreated samples showed temporal variation in microparticle size distribution, as summarized in Figure 4. Particles of 0.7–1.2 μm with a peak at 0.90 μm appeared on day 14. The peak size of new particles changed to 0.74 μm on day 20. On day 34, the peak disappeared and the frequency of particles of <0.63 μm increased. On day 60, particles of <~0.6 μm further increased. Detected particles had an initial peak size of 0.90 μm, with a shift to smaller sizes over time and a simultaneous increase in concentration.
Microparticle size distribution for untreated samples on days 0, 14, 20, 34 and 60 measured using the Coulter counter. Inset shows distributions of particle sizes in the range of 0.52–1.50 μm. Only data from the indicated dates are included in order to improve the visualization of trends.

The observed temporal variation may reflect the growth, decomposition/fragmentation and succession of microorganisms in the water samples. Detected particles were 0.7–1.2 μm, consistent with the size on the order of ~0.3–1.0 μm (Després and others, Reference Després2012; Pumkaeo and Iwahashi, Reference Pumkaeo and Iwahashi2020), further suggesting that the microorganisms were likely bacteria. The growth of microorganisms was initially detected on day 14. The decomposition of microorganisms results in size fragmentation, contributing to an increase in small particles in the water sample. This is consistent with the observed shift in the peak size from 0.90 μm on day 14 to 0.74 μm on day 20, with an increase in the concentration of particles of <0.63 μm. This could also be explained by a decrease in size for adaptation to aquatic environmental changes (Chien and others, Reference Chien, Hill and Levin2012) and/or the growth of other species with smaller sizes. The size decrease beginning on day 14 likely reflects a change in the structure of the microbial community and the growth of relatively small bacteria (microbial community succession). Moreover, environmental changes (nutrient limitation and changes in population density) might have resulted in a shift in the original species to smaller sizes, contributing to an increase in small particles. In summary, the peak of microbial population growth was reached between days 14 and 20. The subsequent increase in small particles of <~0.6 μm can be explained by decomposition into fragments (which a particularly high rate of increase for particles of 0.55 μm), microbial community succession and size changes within species.
The disaggregation of cell aggregates is unlikely to explain the decrease in 0.7–1.2 μm particles and the increase in small particles. This process has been reported in Microcystis species, which typically form colonies. However, when Microcystis colonies are isolated from natural field sites and cultured in artificial media, they consistently disaggregate into single cells (Reynolds and others, Reference Reynolds, Jaworski, Cmiech and Leedale1981). The formation of Microcystis colonies or aggregates is thought to be a response to various environmental stresses (Wang and others, Reference Wang, Zhang, Shen, Xie and Yu2015). A drastic aquatic environmental change is unlikely in our samples. In addition, particles of <~0.6 μm continued to increase after the disappearance of 0.7–1.2 μm particles.
The adsorption of cells on the bottle surface (and possible biofilm formation) is also an unlikely explanation for the decrease in particles of 0.7–1.2 μm. In an ill-fed aquatic environment, bacteria readily form colonies on surfaces, although they can live in the suspended condition (Yasuda, Reference Yasuda1996). After adherence to a surface, bacteria sometimes form biofilms. However, colony formation typically requires a remarkable change in the aquatic environment. We did not measure dissolved organic matter concentrations and thus could not consider temporal changes in nutrients. However, the temperature was kept constant and the water in the bottles remained visually clear with no detectable changes on the inner wall surface throughout the experimental period. Thus, bacterial colony formation is unlikely and it is difficult to attribute the decrease in particle numbers to the adsorption of cells on the bottle surface.
3.3 Measurement with a viable particle counter
Measurement with a viable particle counter confirmed that microbial growth occurred in only the untreated samples. Figure 5 shows the distribution of biological particles from each sample based on changes in scattered light intensity. In particular, a higher intensity indicates a larger particle size and a higher fluorescence intensity shows higher biological activity. The equipment detects a particle as biological when the fluorescence intensity exceeds the threshold voltage of 68 mV. Biological particles were more abundant in the untreated sample than in the UV-treated sample, indicating that microbial growth in the liquid sample was directly observed.
Scatter diagram showing the intensity of light scattering and fluorescence intensity for detected biological particles in the untreated (a–b) and UV-treated (c–d) samples measured using the viable particle counter. Only fluorescent particles that exceeded the threshold voltage of 68 mV are plotted as biological particles. Particle sizes of 0.5, 1.0 and 2.0 μm were determined by a light-scattering intensity equivalent to the size of standard particles of polystyrene latex beads. For the measurement, 100 μL of each sample was used.

The biological particles were mostly <0.5–0.6 μm, which was smaller than the size obtained using the Coulter counter (Fig. 5 and Table 1). When measured using the viable particle counter, the initial peak of microbial growth had already passed and decomposition into fragments and microorganism community succession were predominant (as described in Section 3.2). Because the equipment is designed to detect biological particles containing riboflavin, the particles detected seemed to be intact cells. In untreated samples, 46% of particles were <0.5 μm (Table 1) and 74–76% were <1.0 μm. However, as shown in Figure 5, particles of ~0.5–0.6 μm were dominant within the 0.5–1.0 μm bin. Additionally, particles of <0.5 μm were 30.9–43.0 times more frequent in untreated samples than in UV-treated samples, showing the highest rate of increase among bins (Table 1). Thus, microbial growth seemed to be detected mainly as particles of <0.5–0.6 μm. The differences in size distributions between the Coulter counter and laser particle counter can likely be explained by the high water content of biological particles. Naramura and others (Reference Naramura, Ide, Sekimoto and Takesawa2013) have reported that biological particle sizes are underestimated using an LSLPC because the refractive index of these particles is close to that of water. Therefore, actual sizes should be evaluated based on values determined using the Coulter counter.
Biological particle concentration (particles mL−1) in each size bin for the untreated (a–b) and UV-treated (c–d) samples

Samples a, b, c and d correspond to those shown in Figure 5.
3.4 Difference in biological particle detection between the Coulter counter and LSLPC
There was a clear difference in the detection of biological particles in samples between the Coulter counter and LSLPC. We measured microparticle concentrations in untreated samples using the laser particle counter, an LSLPC and the Coulter counter. The UV-treated samples were measured using the Coulter counter only (Fig. 6). We collected multiple samples from the sampling site. Samples used in this analysis differed from those described in Section 3.1. Thus, there were marginal differences in concentrations between these analyses. Using the Coulter counter, the untreated samples showed a gradual increase in concentrations after 5 d and the UV-treated samples maintained the initial concentration throughout the experimental period, similar to the trends described in Section 3.1. The particle size distributions for untreated samples were the same as those for UV-treated samples during the first 5 d (Fig. 7). Then, on day 14, there was an increase in the concentration of particles with diameters of ⩽1.2 μm, with a peak at 0.70 μm. As described in Section 3.2, the initial microbial population growth had reached a peak and decomposition into fragments and microorganism succession had begun before this time point. Initial microbial population growth reached a peak between days 5 and 14. In contrast, the samples measured using the laser particle counter showed no remarkable changes in concentration, even after 27 d, showing an equal concentration to that of untreated samples obtained using the Coulter counter (Fig. 6).
Temporal variation in microparticle concentrations in UV-treated and untreated melted water samples. The UV-treated samples were measured using only the Coulter counter (CC). The untreated samples were measured using the CC and the laser particle counter (LPC). Particles with sizes of 0.52–12.0 μm were counted using both instruments. The experimental periods were 20 d for the UV-treated samples and 27 d for the untreated samples.

Microparticle size distribution within the range of 0.52–1.5 μm for untreated samples on days 0, 3, 5 and 14 measured using the Coulter counter. Water samples in two bottles were measured at each time point, except on day 3 and are shown with solid and broken lines of the same color.

This difference in detection between the Coulter counter and the laser particle counter can be explained by a difference in the measurement principle. LSLPCs tend to underestimate biological particle sizes because the refractive index is similar to that of water, as mentioned in Section 3.3. Given that the detection limit of the laser particle counter is 0.52 μm, it is possible that some biological particles could not be detected. The Coulter counter, based on the Coulter principle, measures the changes in electrical conductance as particles suspended in an electrolyte pass through a small orifice. The technology is unaffected by the refractive index. Therefore, for the measurement of samples containing biological particles using the LSLPC, it is important to consider the underestimation of sizes and, in some cases, the possibility of non-detection.
4. Conclusion
UV disinfection was evaluated for the long-term storage of melted snow and ice samples from glaciers in a refrigerator. An increase in the microparticle concentration in samples has been observed after ~1–2 weeks of storage in a refrigerator, suggesting that improved methods for preservation while inhibiting microbial growth are needed. In this study, samples of surface snow obtained from the terminus of the No. 31 Glacier in the Suntar-Khayata Range, eastern Siberia, Russia, were used to analyze the effects of UV treatment.
The microparticle concentration increased over time in untreated samples but not in UV-treated samples over a period of 53 d. Microparticle size distributions were also not affected by UV treatment. These findings indicated that germicidal irradiation of melted water samples is beneficial for the long-term storage of samples in a refrigerator for microparticle measurements.
A detailed analysis of the microparticle size distribution for untreated samples indicated that particles of 0.7–1.2 μm appeared within the first 7–14 d, providing evidence for microbial growth. Subsequently, the particles shifted to a smaller size and a higher concentration, suggesting that decomposition into fragments and the succession of microorganisms occurred. Measurements using the viable particle counter confirmed the occurrence of biological particles in untreated samples.
Furthermore, LSLPCs and Coulter counters are widely utilized to measure microparticle concentrations in snow and ice samples. In a comparative analysis, biological particles were more difficult to detect using LSLPC compared with the Coulter counter.
This study focused on the sterilization of melted water samples. To ensure the effect and to promote wide use of UV disinfection, the snow and ice-core samples with different concentrations of microorganisms from different glaciers are needed to be examined and to achieve results.
Cryoconite, which is found on glacier surfaces (e.g. Takeuchi and others, Reference Takeuchi, Kohshima and Seko2001, Reference Takeuchi, Nagatsuka, Uetake and Shimada2014), is a mixture and/or aggregate of biotic and abiotic particles, including black carbon, mineral dust, organic matter, snow algae and cyanobacteria (e.g. Takeuchi and others, Reference Takeuchi, Kohshima and Seko2001, Reference Takeuchi, Nishiyama and Li2010). Because it is characterized by abundant microorganisms and complex inner structures, further studies are needed to determine whether the UV disinfection method in this study is effective for the analysis of microparticle concentrations from refrigerated samples containing cryoconite.
Acknowledgements
We wish to thank all individuals who generously assisted with the study. We also thank H. Okumura and K. Fukuda of the National Institute of Polar Research for help with the microparticle analysis, T. Sakuma and T. Minakami at RION Co. Ltd. for providing data obtained using the viable particle counter, and four reviewers for valuable comments and criticisms. This work was supported by the Green Network of Excellence (GRENE) Arctic Climate Change Research Project of the Ministry of Education, Culture, Sports, Science and Technology in Japan, the ‘Systematic Analysis for Global Environmental Change and Life on Earth’ research project of the Transdisciplinary Research Integration Center, the Arctic Challenge for Sustainability (ArCS) Project (program grant No. JPMXD1300000000), and JSPS KAKENHI grant Nos. JP18H04140 and JP20H049840, and was partially funded by the Arctic Challenge for Sustainability II (ArCS II) (program grant No. JPMXD1420318865), the Environment Research and Technology Development Funds (JPMEERF20202003) of the Environmental Restoration and Conservation Agency of Japan, and the National Institute of Polar Research (NIPR) through Project Research (KP305).


 Open access