


Impact statements
Climate change and anthropogenic activity, combined with an expanding population, have exacerbated the drinking water scarcity problem in emerging, underdeveloped and densely populated nations such as India. Hence, desalination of seawater seems to be critical in avoiding further worst-case scenarios. However, the lack of sufficient funds, limited fossil fuel supply and the associated environmental impacts impede the rapid adoption of fossil-fuel-powered commercial large-scale desalination facilities in underdeveloped countries. As a result, in this research work, the feasibility of seawater desalination using a modified basin solar still was investigated, and the primary findings were reported. The modified basin solar still utilized low-cost tools like internal mirrors, gravel and black ink to efficiently produce desalinated water. The cost of producing desalinated water using the modified basin solar still was less than the cost of drinking water produced and supplied by the Indian Railways. Moreover, the ability to mitigate a significant amount of CO2 emissions by cutting off fossil fuel consumption indicated the modified basin solar still to be environment-friendly. These findings confirmed the modified solar still to be more beneficial in developing economies for alleviating water scarcity and achieving the UN Sustainable Goal (SDG 6 Clean Water and Sanitation).
Introduction
Ensuring safe and reliable access to potable water remains a top priority in every nation. Of the water that is globally available, just 3.0% is freshwater, while the remaining 97.0% is saline (Shivhare et al., Reference Shivhare, Samsher and Kumar2024). Many areas around the globe, especially arid and semi-arid regions, experience severe water scarcity throughout the year (UNEP, 2016). It is suspected that by the end of the current decade, water availability will fall below 500 m3 per capita in many regions (De Waal et al., Reference De Waal, Stuti, Andrea and Edoardo2023). It is also anticipated that the world’s freshwater demand will rise significantly by the year 2050 (Gude, Reference Gude2021). Groundwater accounts for nearly 99% of the world’s available liquid freshwater reserves and is a primary source of drinking water and irrigation in many rural areas. However, this resource is heavily mismanaged, undervalued and polluted and, in many regions, has been seriously depleted by overabstraction, leading to irreversible consequences, including water scarcity (United Nations, 2022). The excessive use of clean water for agricultural and cattle-rearing purposes (Guo et al., Reference Guo, Xingpo and Qichen2024) has also contributed significantly to a decrease in freshwater availability (Khan et al., Reference Khan, Khursheed, Atiya, Mohammad, Mohd, Ahmed and Utkarsh2024). Furthermore, a biased distribution system for water supply has increased the burden on the poor. To combat rising water stress, water supply systems around the globe must be resilient to the uncertainties of future climate conditions and population growth. Given this, the desalination process, which converts non-potable sources such as seawater and brackish water into drinkable water, has emerged as a strong substitute to traditional drinking water sources (Al-Rimmawi, Reference Al-Rimmawi2012; Hendrickson et al., Reference Hendrickson, Mashor and Lina2023).
Literature review
Desalination technologies such as reverse osmosis (RO) (Ankoliya et al., Reference Ankoliya, Anurag, Manish, Vivek and Jatin2023), electrodialysis (ED) (Cong, Reference Cong2018), multieffect distillation (MED) (Chandra et al., Reference Chandra, Anurag and Jatin2023) and multistage flash (MSF) distillation account for 98% to 100% of the desalination sector in the Gulf Cooperation Council (GCC) countries. By 2020, the GCC countries’ desalinated water production capacity was estimated to be 19.16 million m3/d, with MSF and RO accounting for the majority. The GCC countries account for 32% of global desalination capacity and contribute to 55% of global brine disposal. Furthermore, CO2 emissions from MSF, MED and RO desalination plants in GCC countries range from 5.6 to 25.0, 4.4 to 17.6 and 1.8 to 2.8 kg per m3 of desalinated water produced, respectively (Moossa et al., Reference Moossa, Trivedi, Saleem and Zaidi2022). To counteract emissions, environmental implications and energy costs, GCC countries proposed renewable energy to cover at least 10% of their desalination sector energy requirements by 2035 (Moossa et al., Reference Moossa, Trivedi, Saleem and Zaidi2022).
Conventional large-scale desalination systems’ long-term viability in low-income and developing regions is called into doubt due to their reliance on fossil fuels and the related high operating and maintenance expenses (Alawad et al., Reference Alawad, Mansour, Al-Sulaiman and Rehman2023). Solar energy seems like an interesting way to power large-scale desalination systems. However, this approach faces market hurdles due to the uncertainties surrounding government subsidies (Goosen et al., Reference Goosen, Mahmoudi, Alyousef and Ghaffour2023). The capacity of solo solar-thermal-energy-based desalination facilities in various locations of the world ranges from 0.1 to 6,000 m3/d, which is extremely modest in contrast to the capacity of a commercial fossil-fuel-powered desalination plant (Ghaffour et al., Reference Ghaffour, Bundschuh, Mahmoudi and Goosen2015). In recent decades, there has been extensive research on the use of solar energy for desalination via solar stills (Quteishat and Abu-Arabi, Reference Quteishat and Abu-Arabi2004).
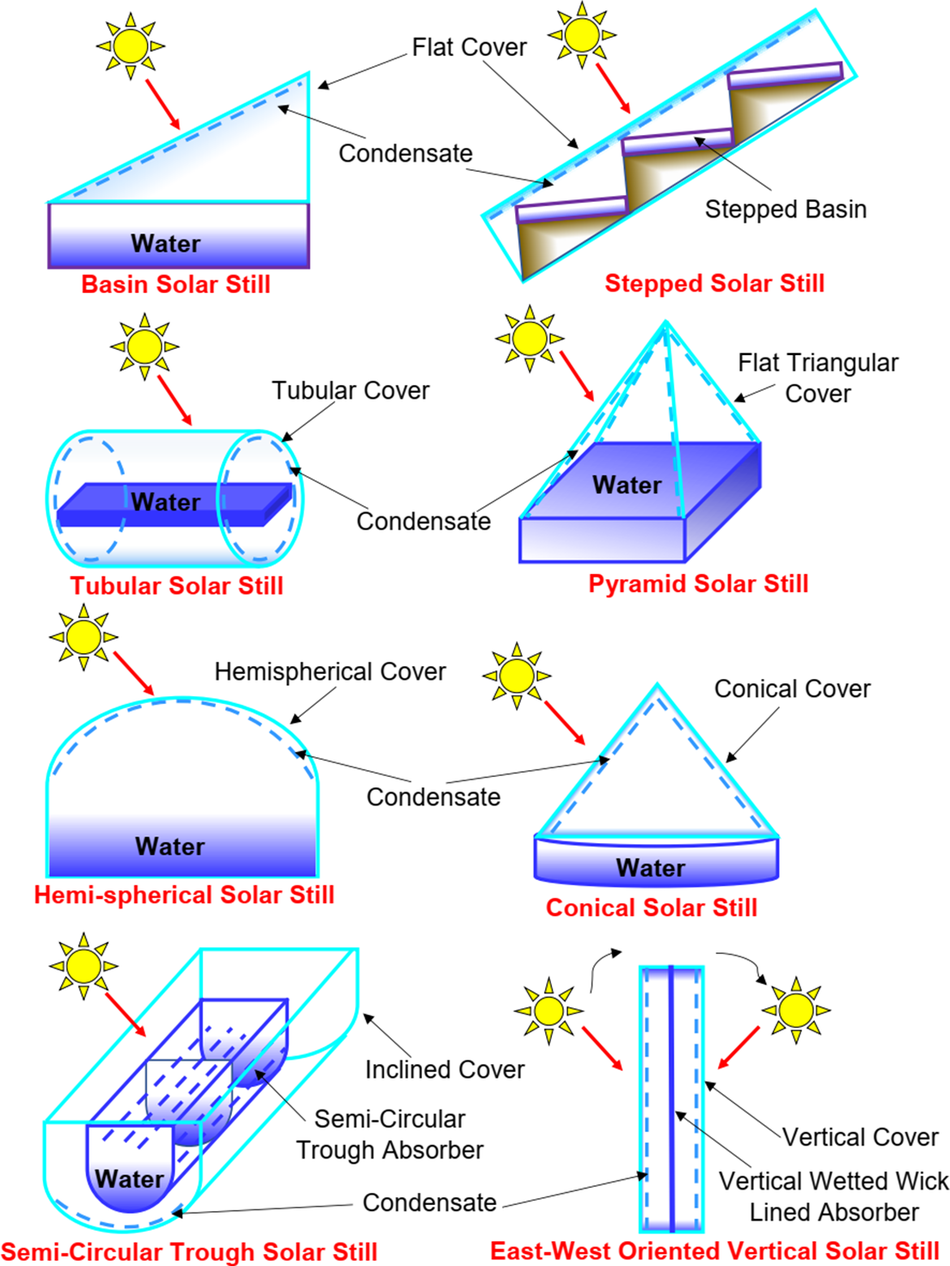
Solar stills are inexpensive and easy to build and operate, but may require a large area due to their low water productivity (Sharon and Reddy, Reference Sharon and Reddy2012), and they are suitable for water production if the water demand is less than 100 m3/d (Al-Karaghouli and Kazmerski, Reference Al-Karaghouli and Kazmerski2013). Water production costs for solar stills, commercial large-scale thermal plants and small-capacity RO desalination facilities range from 1.3 to 6.5 USD/m3 (Ghaffour et al., Reference Ghaffour, Bundschuh, Mahmoudi and Goosen2015), 0.56 to 8.0 USD/m3 and 0.56 to 12.99 USD/m3, respectively (Al-Karaghouli and Kazmerski, Reference Al-Karaghouli and Kazmerski2013). Various researchers around the globe have developed and investigated basin type, inclined wick type, stepped type, tubular type, pyramid type, vertical type, hemispherical type, conical type and semicircular trough type solar still configurations, which are shown in Figure 1 (Younis et al., Reference Younis, Hussein, Attia, Aljibori, Kolsi, Togun, Ali, Abderrahmane, Subkrajang and Jirawattanapanit2022). Basin solar still is the simplest arrangement to construct and maintain and does not require specialist expertise or high-tech materials for production, making it ideal for low-income and isolated populations (Mashaly and Alazba, Reference Mashaly and Alazba2018).
Different configurations of solar stills.

Various techniques such as the adoption of reflectors (both internal and external, concentrate and redirect solar radiation over the basin liner of the still), addition of pigments (to improve solar radiation absorption), incorporation of fins (to increase surface area), energy storage materials (to store excess solar energy and utilize the same in non-sunny hours), condensing cover cooling (to reduce condensing surface temperature), use of solar collectors (to preheat the feed water), incorporation of additional condensers (to increase surface area of condensation) and reuse of latent heat of evaporation by incorporating multiple effects have been adopted to enhance the desalinated water yield of basin solar stills. The addition of fins to the basin liner increased the desalinated water productivity by 48% and 15% in summer and winter seasons, respectively (Srivastava and Agrawal, Reference Srivastava and Agrawal2013). Flat reflectors/mirrors are inexpensive and can be easily integrated into solar stills in a variety of ways. Internal mirrors increased the yield by 18% in summer and 83% in winter, but external mirrors increased the yield by 19% in summer and 30% in winter (Omara et al., Reference Omara, Kabeel and Abdullah2017). Incorporating phase change materials increased the yield by 25% to 67% (Kasaeian et al., Reference Kasaeian, Nazari, Masoumi, Shabestari, Jadidi, Fereidooni and Bidhendi2024). The use of black dye increased the yield by approximately 29% (Rajvanshi, Reference Rajvanshi1981). Pebbles and clay balls have been used as inexpensive, sensible heat energy storage materials in solar stills (Arunkumar et al., Reference Arunkumar, Wang, Rufuss, Dekenberger and Kabeel2020). The yield of a solar still using ball salt as a sensible energy storage medium was approximately 69% higher than that of a conventional basin solar still (Samuel et al., Reference Samuel, Nagarajan, Sathyamurthy, El-Agouz and Kannan2016). Deshmukh and Thombre (Reference Deshmukh and Thombre2017) found that using sand and servo-thermo medium oil as sensible storage materials increased nocturnal yield but decreased diurnal yield. The optimal heat capacity of the sensible storage medium was also estimated to be 8 ± 15 kJ/K per m2 of basin area.
According to the literature cited above, the use of mirrors, dyes and readily available natural sensible heat storage materials has dramatically enhanced the desalination water productivity of solar stills. Internal mirrors reflect and redirect the incident solar radiation onto the basin liner, preventing heat loss through the side walls and so improving evaporation. Sensible heat energy storage materials store surplus incident solar radiation energy, which is then used for water evaporation, especially during low-solar-irradiation hours. The inclusion of black ink aids in the effective absorption of incident solar radiation while also reducing/preventing radiation reflection by the non-black colour energy storage materials. The combination of these three to improve the performance of a single system has not been explored or published in the literature, leaving a research gap. As a result, in this work, the combined impact of internal mirrors, black ink and gravel on the performance of a basin solar still was experimentally investigated, verified and reported under the climatic condition of Visakhapatnam, India, to evaluate their appropriateness for sustainable desalination. Furthermore, the economic and environmental impacts of the modified basin solar still system have been assessed. Section “Materials and methods” describes the experimental setup, the methodology used for experimentation, characterization, and economics and environmental impact assessment. Section “Results and discussion” provides a detailed discussion on weather conditions as well as the techno-enviro-economic aspects of the investigated solar still cases. Section “Scalability of solar stills” discusses how the modified solar still can be scaled for large scale application. Section “Contribution to the United Nations Sustainable Development Goals” discusses how the modified solar still contributes to the United Nations (UN) Sustainable Development Goals (SDGs). Section “Limitations and scope for future work” lists the work’s limitations as well as the scope for future works. The major findings of this investigation along with the suggestions for improving the modified solar still’s public acceptability are presented in Section “Conclusion”.
Materials and methods
Experimental system description
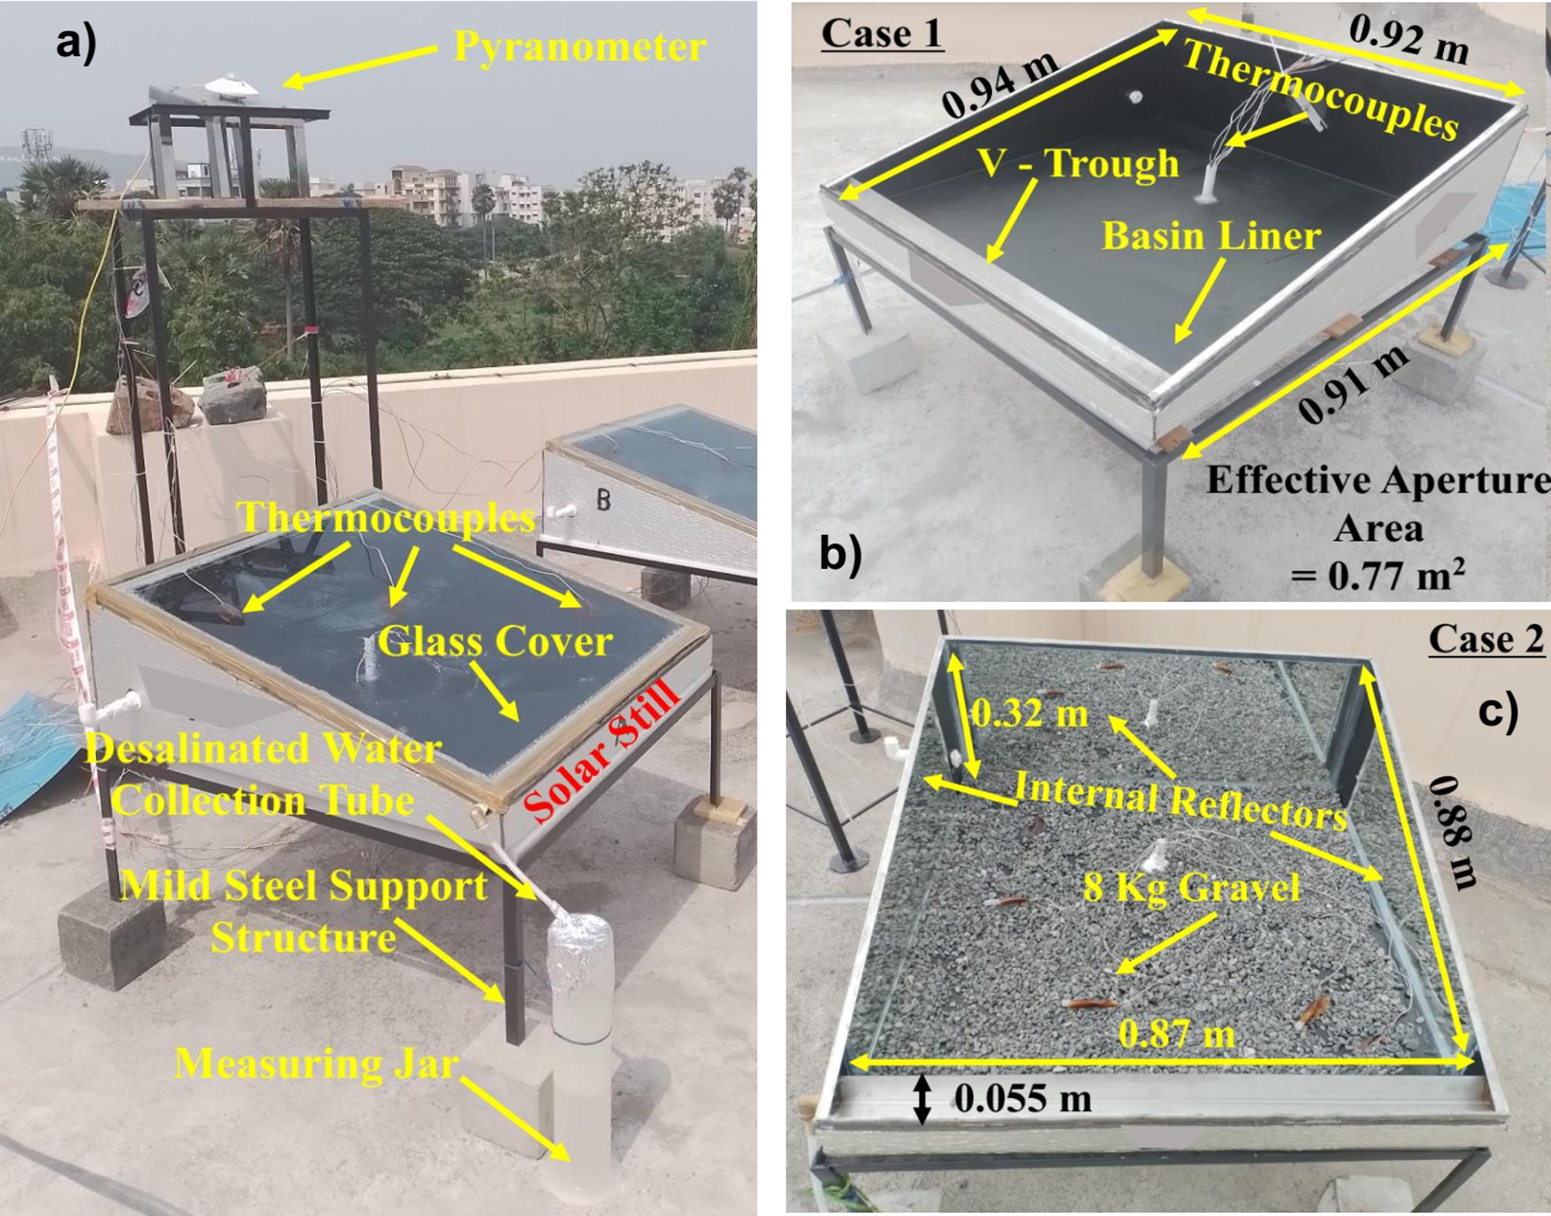
The photographs of the experimental basin solar still setup utilized are displayed in Figure 2a–c. This setup is capable of meeting the drinking water requirements of an adult (2 to 3 L/d). The basin solar still was fabricated using a 1.0-mm-thick stainless-steel sheet to avoid corrosion. The length and breadth of the solar still’s base were about 0.92 and 0.91 m, respectively. Tempered glass cover of length, breadth and thickness of 0.935, 0.910, and 0.004 m, respectively, was used to cover the basin and facilitate condensation of vapours. The development process of the basin solar still is discussed in Section S1 of the Supplementary Material. The basin solar still thus developed was kept facing due south over a mild steel stand of 0.355 m height. This developed setup is shown in Figure 2b, and it was used as the experimental configuration for Case 1. A detailed investigation on Case 1 configuration has been carried out earlier and presented in (Sharon et al., Reference Sharon, Prasad, Gowtham, Gopal and Aswin2025). For Case 2 configuration (Figure 2c), internal reflectors were pasted against the inner back and two side walls of the still using silicone paste, and 8 kg gravel was loaded into the basin. The gravel was spread as a single layer over the base of the basin, as shown in Figure 2c. The specific heat capacity of the gravel was about 1,000 J/kg-K (IESVE, 2025). The mass of gravel was limited to 8 kg in this work, by considering the weight-carrying capacity of the still and uniform spread ability over the basin. However, the optimum heat capacity of sensible energy material in the solar still was recommended as 8 to 15 KJ/K per m2 (Deshmukh and Thombre, Reference Deshmukh and Thombre2017). Case 3 configuration was arrived by adding ordinary rubber stamp black ink to the feed water (400 ppm per litre of feed water) in Case 2 configuration.
(a) Photograph of the experimental solar desalination setup (b) Photograph indicating components of the reference basin solar still (Case 1) (c) Photograph indicating components of the modified basin solar still (Case 2).

Experimental methodology
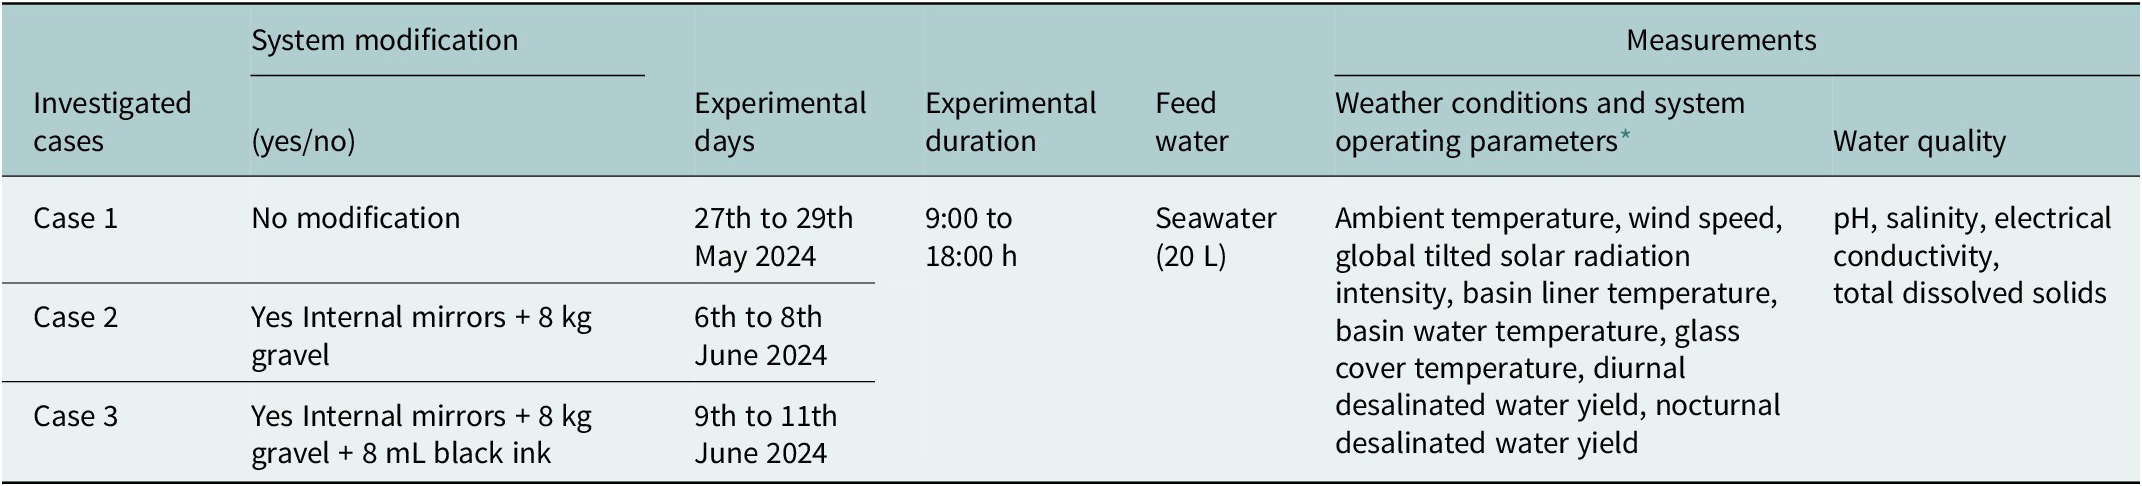
The experiments were conducted during the months of May and June 2024 on the terrace of the Indian Institute of Petroleum and Energy (IIPE) in Visakhapatnam (17.68°N, 83.22°E), Andhra Pradesh, India. Seawater for these experiments was collected from Ramakrishna (R.K.) Beach, which was only 1.5 km from the experimental site. The gravel used in the experiment was acquired locally. 40 mL black rubber stamp ink (Camlin brand) was purchased from a local stationery shop in Visakhapatnam. The experimental plan formulated for this research work is summarized in Table 1. Every day, experiments were performed from morning 9:00 to evening 18:00 h, with an initial volume of 20 L of seawater in the still. Throughout the experiment, essential weather conditions (ambient temperature, wind speed and global tilted solar radiation intensity) and solar still operational parameters (glass cover, basin water, basin liner temperature and desalinated water production rate) were measured every fifteen minutes. The desalinated water yield was measured manually using a graduated cylinder. The temperature of solar still components was automatically measured using K-type thermocouples at three separate locations for each component and logged on a desktop computer using the Keysight datalogger. Global solar radiation intensity was automatically measured using a pyranometer and logged on a desktop computer using “Smart Explorer” software. Ambient temperature and wind speed were measured manually with a handheld digital anemometer. Seawater quality was evaluated at Gayatri Environ Labs, Visakhapatnam, while desalinated water quality was evaluated with a portable aquatic water quality meter.
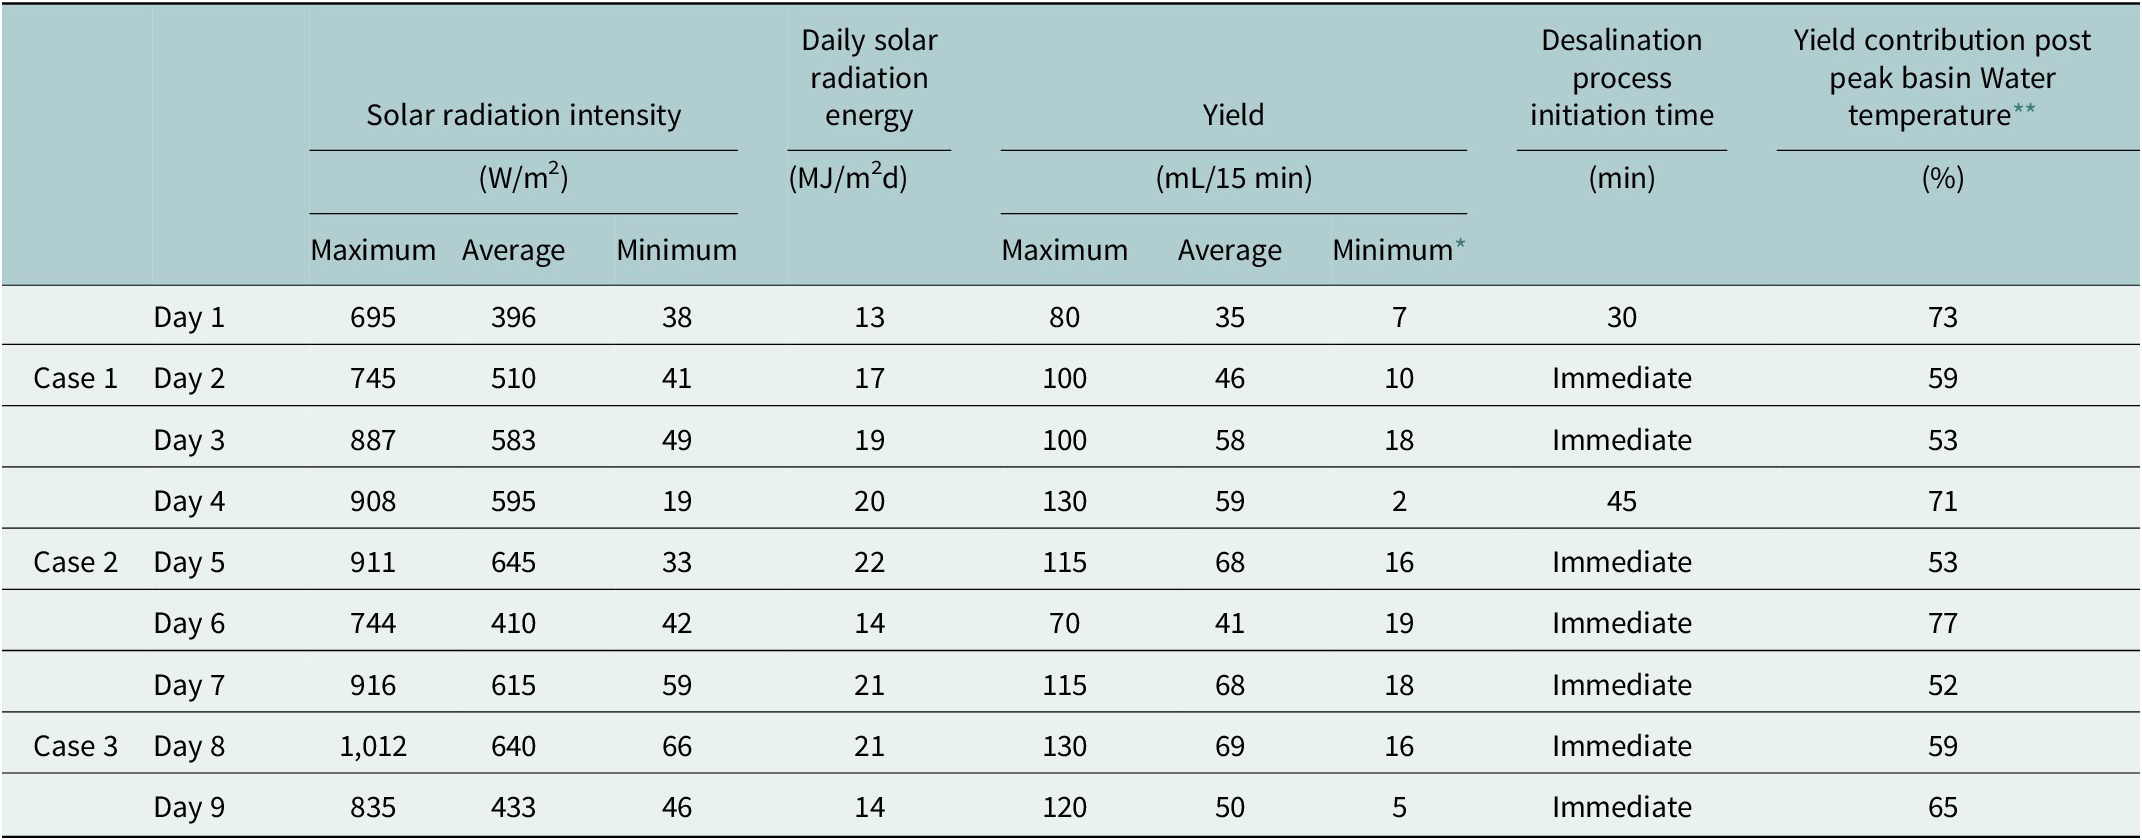
Details of the experimental plan formulated for this research work

* Nocturnal yield was measured just before sunrise of the next day, while others are measured every 15 min once within the experimental window.
Solar still performance assessment and characterization
In this research work, the performance of the investigated basin solar still was evaluated using daily thermal efficiency. This is mathematically represented in Eqn. 1. Daily thermal efficiency is defined as the ratio of thermal energy needed to produce desalinated water over a given day to daily solar irradiance over the basin solar still’s aperture (Sharon et al., Reference Sharon, Prasad, Gowtham, Gopal and Aswin2025):
 $$ {\eta}_{th}=\frac{\sum \limits_{9:00h}^{18:00h}\left(\overset{\cdotp }{m_d}\times {h}_{fg}\right)\Delta t+\sum \limits_{18:00h}^{\mathrm{Next}\;\mathrm{day}\;\mathrm{Sunrise}}\left(\overset{\cdotp }{m_n}\times {h}_{fg}\right)\Delta t}{\sum \limits_{9:00h}^{18:00h}\left({I}_t\times {A}_a\right)\Delta t} $$
The still’s characteristic curves were obtained by evaluating the instantaneous thermal efficiency and instantaneous thermal loss efficiency. Plotting instantaneous thermal efficiency against the ratio of the instant temperature difference between basin water and ambient temperature to the instant incident solar radiation intensity provides insight into the solar still’s performance behavior and deviation from ideal performance (Tiwari and Noor, Reference Tiwari and Noor1996). The characteristic curve constructed based on instantaneous thermal efficiency typically has a linear profile with a positive slope (Tiwari and Noor, Reference Tiwari and Noor1996) and is expressed in Eqn (2):
 $$ {\eta}_{ith}={F}^{\prime }{U}_{eff}\left(\frac{T_{bw(t)}-{T}_{a(t)}}{I_t}\right)+{F}^{\prime }{\left(\alpha \tau \right)}_{eff} $$
The instantaneous thermal loss efficiency of the basin solar still is defined as the ratio of energy consumed to raise the basin water temperature at a given instant to the incident solar radiation energy at that same instant (Tiwari and Noor, Reference Tiwari and Noor1996; Dev and Tiwari, Reference Dev and Tiwari2009), and it is mathematically expressed in Eqn (3). Instantaneous thermal loss efficiency plotted against the ratio of instant temperature difference between basin water and ambient temperature to instant incident solar radiation intensity aids in understanding the impact of basin water heat capacity on solar still performance (Tiwari and Noor, Reference Tiwari and Noor1996). Eqn (4) expresses the characteristic curve based on instantaneous thermal loss efficiency, which usually has a linear profile with a negative slope (Tiwari and Noor, Reference Tiwari and Noor1996; Dev and Tiwari, Reference Dev and Tiwari2009):
 $$ {\eta}_{iL}=\frac{M_{bw}{c}_{bw}\left({T}_{bw(t)}-{T}_{bw\left(t-\Delta t\right)}\right)}{I_t} $$
 $$ {\eta}_{iL}=-{F}_L^{\prime }{U}_L\left(\frac{T_{bw(t)}-{T}_{a(t)}}{I_t}\right)+{F}_L^{\prime}\alpha $$
Instrumentation and uncertainty analysis
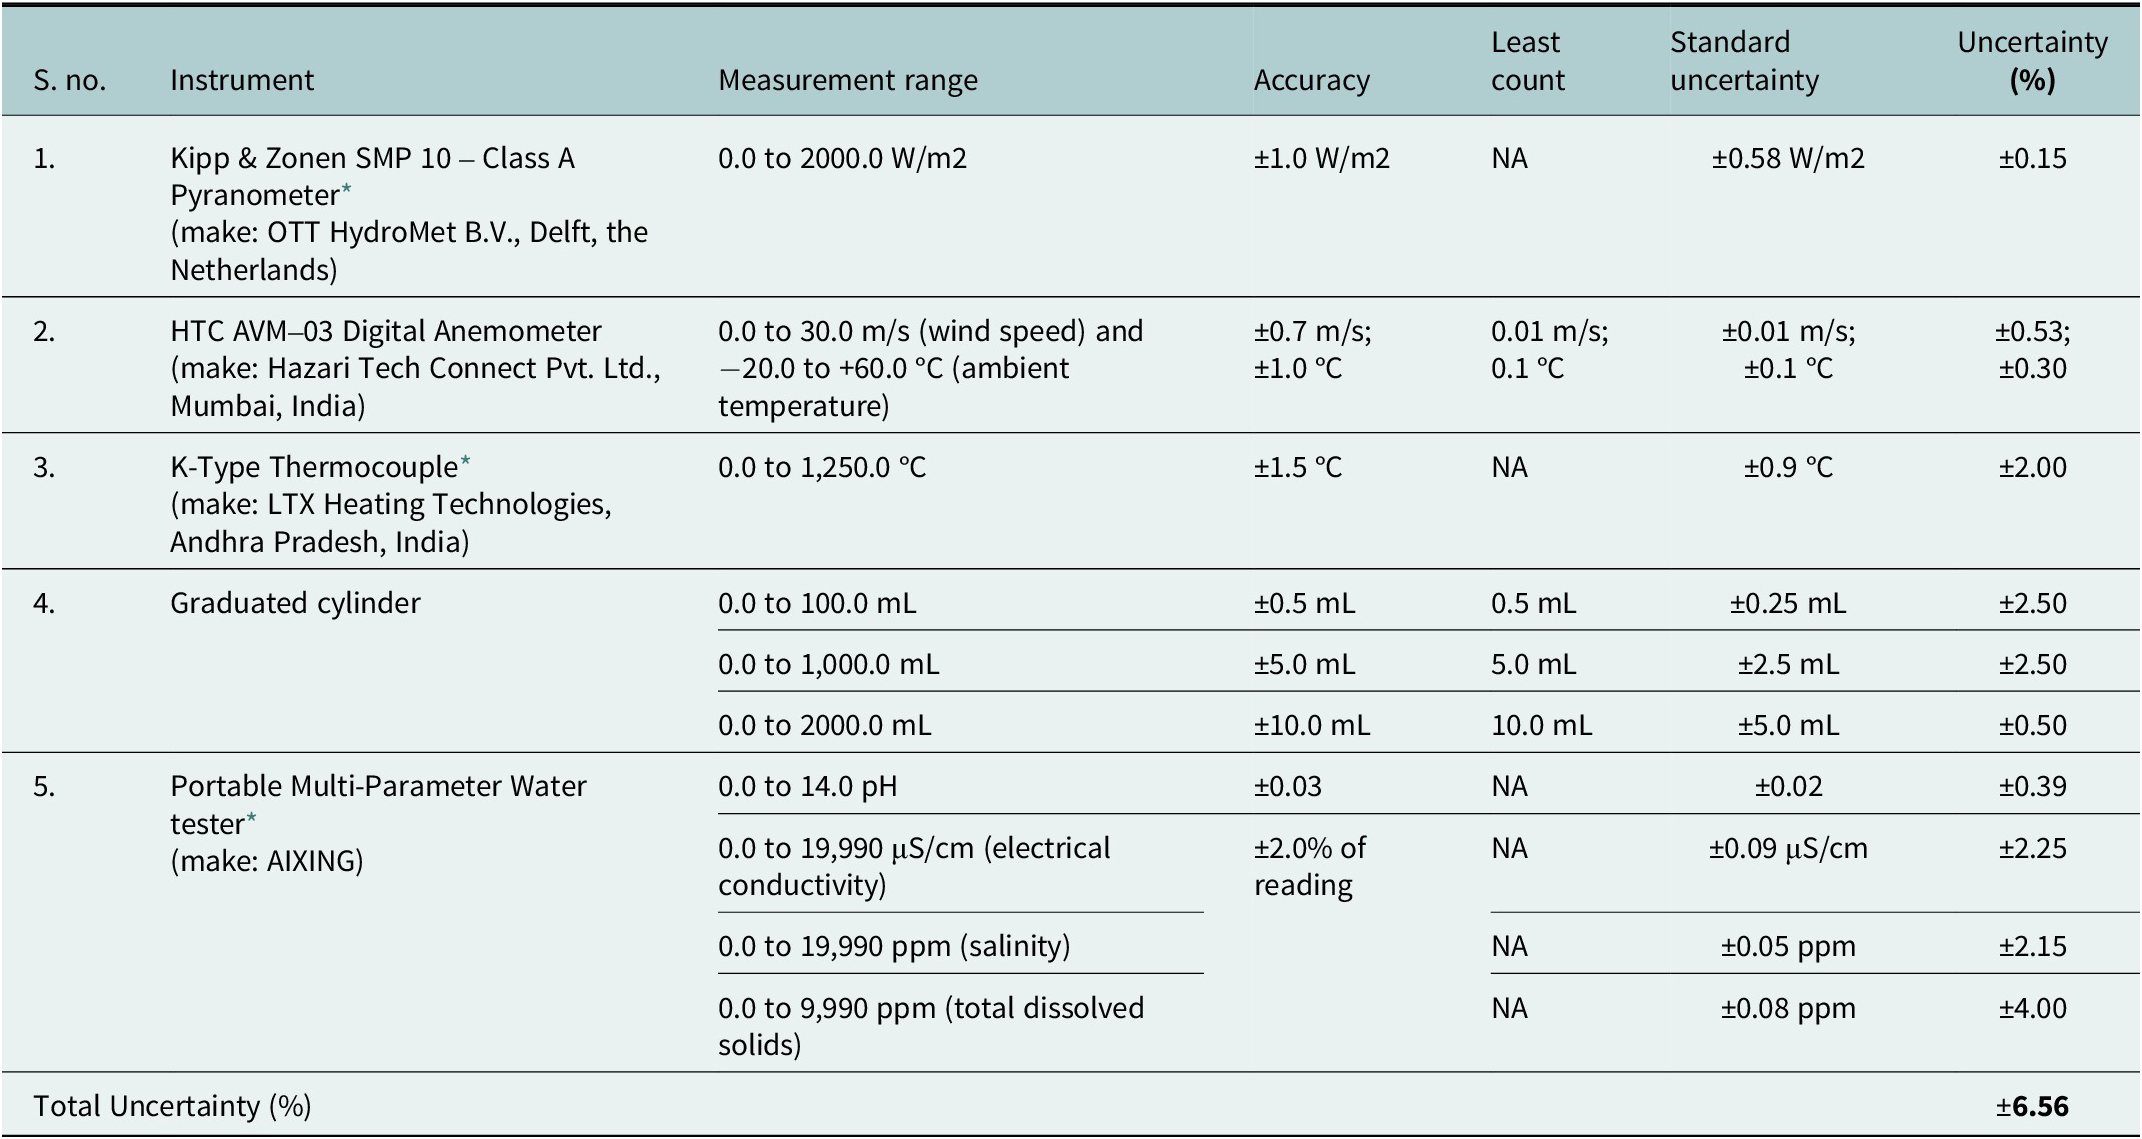
Table 2 lists the instruments used in the experiments, as well as their accuracy and uncertainty levels. Measurements include error; therefore, all measurements must be accompanied by their uncertainty. The reliability of the results is justified by uncertainty (Farrance and Frenkel, Reference Farrance and Frenkel2012). The standard uncertainty of analogue and digital measuring instruments was evaluated as follows (Elavarasan et al., Reference Elavarasan, Nadarajah, Pugazhendhi and Gangatharan2024):
 $$ {\mathrm{U}}_{\mathrm{analog}}=\pm \frac{\mathrm{Least}\ \mathrm{Count}}{2} $$
 $$ {\mathrm{U}}_{\mathrm{digital}}=\pm \mathrm{Least}\ \mathrm{Count} $$
The uncertainty (%) associated with the measuring instruments was evaluated as follows (Shalaby et al., Reference Shalaby, El-Bialy and El-Sebaii2016):
 $$ \mathrm{Uncertainty}\left(\%\right)={\displaystyle \begin{array}{l}\frac{\mathrm{Standard}\ \mathrm{Uncertainty}\ \mathrm{of}\ \mathrm{the}\ \mathrm{Instrument}}{\mathrm{Minimum}\ \mathrm{of}\ \mathrm{the}\ \mathrm{Measured}\ \mathrm{Daily}\ \mathrm{Average}\ \mathrm{Value}}\times 100\end{array}} $$
The total uncertainty (%) of the experiment was evaluated as follows (Ramzy et al., Reference Ramzy, Abdelaziz, Alswat, Kabeel, Al-Nagdy and Abdelgaleel2025):
 $$ \mathrm{Total}\ \mathrm{Uncertainty}\;\left(\%\right)=\sqrt{\sum {\left(\mathrm{Uncertainty}\;\left(\%\right)\;\mathrm{of}\;\mathrm{all}\;\mathrm{the}\ \mathrm{instruments}\right)}^2} $$
The total uncertainty associated with the experiments in this study was about 6.56%. The uncertainty in estimating the solar still’s efficiency was evaluated using the daily average data (Farrance and Frenkel, Reference Farrance and Frenkel2012; Shalaby et al., Reference Shalaby, El-Bialy and El-Sebaii2016), which was estimated to be approximately ±0.11%.
 $$ U\left({\eta}_{th}\right)={\eta}_{th}\sqrt{\left[\frac{{\left(U\left({M}_d\right)\right)}^2}{{\left({M}_d\right)}^2}+\frac{{\left(U\left({I}_d\right)\right)}^2}{{\left({I}_d\right)}^2}\right]} $$
 $$ U\left({\eta}_{th}\right)=\pm \left(38.7\%\right)\sqrt{\left[\frac{(5.59)^2}{(2246)^2}+\frac{(0.58)^2}{(536)^2}\right]}=\pm 0.11\% $$
List of instruments used along with their accuracy and maximum error percentage

* For measuring instruments with no least count provided by the supplier/manufacturer, the standard uncertainty was evaluated as follows (Harrison, Reference Harrison2014a, Reference Harrison2014b):
 $$ {\mathrm{U}}_{\mathrm{analog}}=\pm \frac{\mathrm{accuracy}}{\sqrt{6}};{\mathrm{U}}_{\mathrm{digital}}=\pm \frac{\mathrm{accuracy}}{\sqrt{3}} $$
Solar still economics assessment
The economics of the investigated solar still cases were evaluated by estimating the cost per litre, production per USD invested and finance payback time. The total capital cost of solar still includes both direct and indirect capital costs (Hota et al., Reference Hota, Hada, Keske and Diaz2022). The cost of the solar still, 8 kg gravel, mirror and black ink was 191, 0.28, 6.98 and 0.47 USD, respectively. The direct capital cost of Case 3 includes the cost of solar still, 8 kg of gravel, mirror and black ink, whereas the direct capital cost of Case 1 simply includes the cost of the simple basin solar still. In Case 2, the direct cost estimate includes the cost of the solar still, 8 kg of gravel and mirror. Indirect costs account for roughly 30% of direct capital cost (Hota et al., Reference Hota, Hada, Keske and Diaz2022). Annual maintenance and operation costs were around 1.5% of the total capital cost (Hota et al., Reference Hota, Hada, Keske and Diaz2022). Desalinated water post-treatment cost was approximately 2.73% of the total capital cost (SWCC, 2023). Salvage value was around 15.0% of the useful material cost of the solar still (Hilarydoss et al., Reference Hilarydoss, Nishant and Nahak2024).
The total capital cost was estimated as follows:
 $$ \mathrm{CC}=\mathrm{DC}+\mathrm{IDC} $$
The total cost associated with the investigated solar stills over their lifetime was estimated as follows:
 $$ \mathrm{TCLT}={\displaystyle \begin{array}{l}\mathrm{CC}+\left(1.5\%\mathrm{of}\;\mathrm{CC}\times \mathrm{LT}\right)+\left(2.73\%\mathrm{of}\;\mathrm{CC}\times \mathrm{LT}\right)\\ {}-\hskip2px \left(15\%\mathrm{of}\;\mathrm{UMC}\right)\end{array}} $$
Cost per litre of desalinated water produced is the ratio of the solar still’s total cost over its lifetime to the amount of desalinated water expected to be produced.
 $$ \mathrm{CPL}=\frac{\mathrm{TCLT}}{{\mathrm{M}}_{\mathrm{Y}}\times \mathrm{LT}} $$
The quantity of desalinated water produced per USD invested in the solar still was estimated as the inverse of cost per litre (Sharon and Reddy, Reference Sharon and Reddy2015):
 $$ \mathrm{PPD}=\frac{1}{\mathrm{CPL}} $$
The finance payback time of the solar still is the ratio of total cost of the still during its lifetime to the revenue that could be generated by selling the still’s desalinated water. This parameter specifies the time required to recover the investment made in the still.
 $$ \mathrm{FPBT}=\frac{\mathrm{TCLT}}{{\mathrm{M}}_{\mathrm{Y}}\times {\mathrm{S}}_{\mathrm{P}}} $$
Purified drinking water is sold at Indian Railways kiosks for 5 to 8 INR/L (0.058 to 0.093 USD/L) (Indianrailways, 2023). Stainless steel desalination systems can have a life period of more than 50 years (Sommariva et al., Reference Sommariva, Hogg and Callister2001). In this study, the solar still’s life was expected to be 5 to 25 years.
Solar still environmental impact assessment
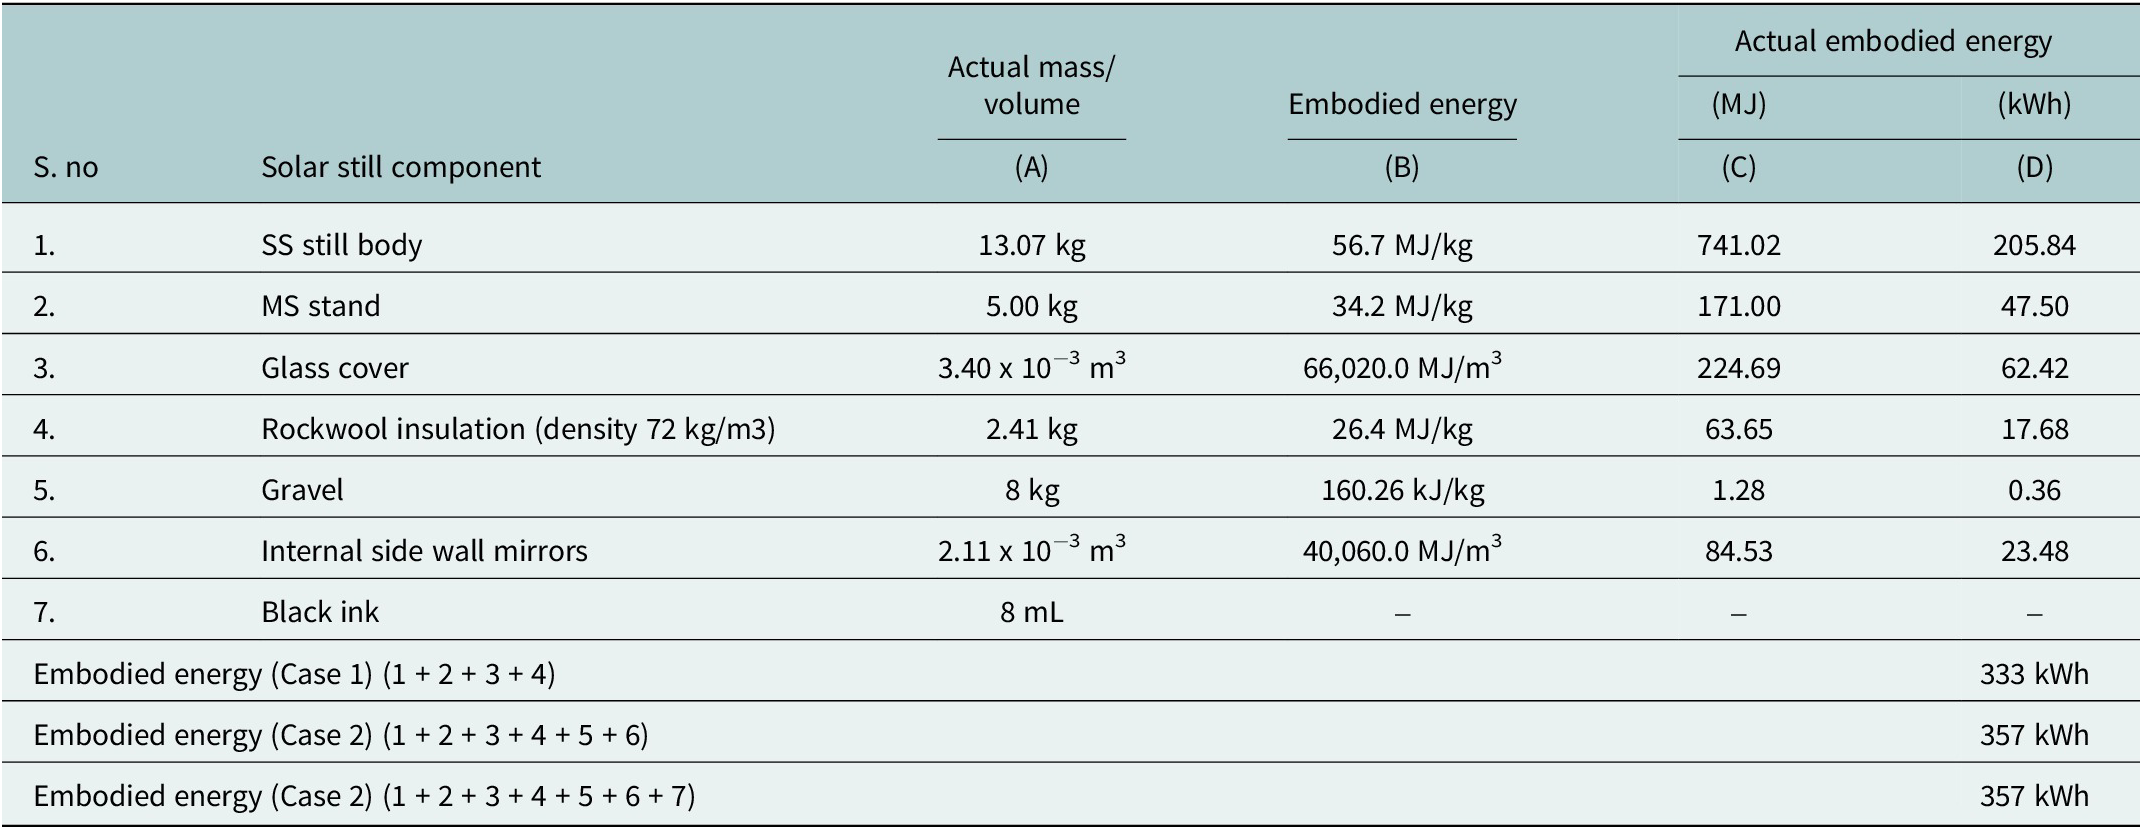
The use of solar energy for desalination facilitates the diminution of harmful greenhouse gas emissions, making the process cleaner and more environmentally friendly (Alawad et al., Reference Alawad, Mansour, Al-Sulaiman and Rehman2023). The environmental impact of each basin solar still case considered in this work was assessed by evaluating the embodied energy payback time (EPBT), net carbon dioxide (CO2) emission diminution potential (NCED-Potential) and specific CO2 emissions. Embodied energy is the energy expended on system development, from ore extraction to final processing into a finished product (Asdrubali et al., Reference Asdrubali, Ferracuti, Lambardi, Guattari, Evangelisti and Grazieschi2017). Table 3 presents the embodied energy evaluation for the various investigated still cases. The embodied energy of the simple solar still in Case 1 was 333 kWh. The embodied energy of gravel and mirror was approximately 160 kJ/kg (WGTN, 2025) and 40,060 MJ/m3 (WGTN, 2025), respectively. The embodied energy of the black ink used was almost negligible as only 8 mL (400 ppm per litre of seawater) was utilized. As a result, the embodied energy of the solar stills in Cases 2 and 3 was approximately 357 kWh.
Embodied energy estimation of various cases of solar still configurations (Sharon et al., Reference Sharon, Reddy, Krithika and Philip2017; WGTN, 2025)

C = A x B; D = C x 1000/3600; embodied energy of black ink is not available, and very limited quantity is used; hence, it is neglected for calculation in this investigation.
The embodied energy payback time (EPBT) is the time needed to gain back embodied energy. It is the ratio of the still’s embodied energy to its annual useful energy consumption for water desalination (Shatar et al., Reference Shatar, Sabri, Salleh and Ani2023):
 $$ \mathrm{EPBT}=\frac{{\mathrm{EE}}_{still}}{\sum \limits_{i=1}^{i=``\mathrm{n}"\mathrm{clear}\ \mathrm{days}\ \mathrm{in}\;\mathrm{a}\;\mathrm{year}}\frac{M_{d(i)}\times {h}_{fg}}{3600}} $$
The net CO2 emission diminution potential was evaluated by Eqn (1 6). Solar stills avoid using conventional grid electricity for seawater desalination, thereby diminishing CO2 emissions.
 $$ \mathrm{NCED}-\mathrm{Potential}={\displaystyle \begin{array}{l}\Big[\Big(\left(\sum \limits_{i=1}^{i=``\mathrm{n}"\mathrm{clear}\ \mathrm{days}\ \mathrm{in}\;\mathrm{a}\;\mathrm{year}}\frac{M_{d(i)}\times {h}_{fg}}{3600}\right)\times LT\Big)\\ {}-{EE}_{still}\Big]\times {\mathrm{CO}}_2\hskip0.32em \mathrm{Emission}\ \mathrm{Intensity}\mathrm{a}\mathrm{t}\hskip0.4em \mathrm{site}\end{array}} $$
Specific CO2 emission (SCE) is the potential CO2 emission by the solar still for every one litre of desalinated water produced over its lifetime and is evaluated by Eqn (17):
 $$ \mathrm{SCE}=\frac{{\mathrm{EE}}_{\mathrm{still}}\times {\mathrm{CO}}_2\;\mathrm{Emission}\ \mathrm{Intensity}\;\mathrm{a}\mathrm{t}\hskip0.4em \mathrm{Site}}{\left(\sum \limits_{i=1}^{i=``\mathrm{n}"\mathrm{clear}\ \mathrm{days}\ \mathrm{in}\;\mathrm{a}\;\mathrm{year}}{M}_{d(i)}\right)\times LT} $$
The CO2 emission intensity from coal-based power plants in India is about 0.95 kg/kWh (Mittal et al., Reference Mittal, Sharma and Singh2012).
Results and discussions
Weather condition in the experimental site
The ambient temperature and wind speed data recorded during experimental days at the experimental site are tabulated in Table S1 and Table S2 of the Supplementary Material. The experimental days in Case 1 appeared slightly warmer than the experimental days in Cases 2 and 3. On experimental days in Case 1, the average ambient temperature ranged between 35 and 36 °C. Similarly, on experimental days in Cases 2 and 3, the daily average ambient temperature ranged from 33 to 34 °C. The daily average wind speed on experimental days in Cases 1, 2 and 3 ranged from 2 to 3 m/s, 2 to 3 m/s and 3 to 4 m/s, respectively. The solar radiation potential on experimental days in Cases 1, 2 and 3 ranged from 13 to 19 MJ/m2d, 14 to 22 MJ/m2d and 14 to 21 MJ/m2d, respectively, indicating that these days were a mix of cloudy and clear days. The hourly variation in solar radiation intensity on experimental days along with detailed description is presented in the next section.
Instantaneous temperature and hourly yield of solar still
Figure 3 through Figure 5 depict the instantaneous temperature variation of basin water, basin liner, glass cover as well as the instantaneous desalinated water yield and solar radiation intensity, on experimental days in Cases 1, 2 and 3. On all the experimental days, the glass cover temperature was lower than basin water and basin liner temperature due to the combination of low heat capacity and immediate heat loss to the ambient via radiation and convection. The low heat capacity of glass cover (5,700 J/K) favoured an immediate rise in temperature during early hours of the experimental days for all the investigated cases, but it was more evident in Case 2 and Case 3 (both cases have a higher basin heat capacity (91,740 J/K) due to the presence of 8 kg gravel in addition to 20 kg basin water). However, due to its low solar absorptivity, low heat capacity and rapid heat loss to the ambient, the glass cover temperature gradually dropped below that of the basin water and basin liner temperature. Reduced glass cover temperature is essential for favouring enhanced condensation of the generated water vapour over its inner surface.
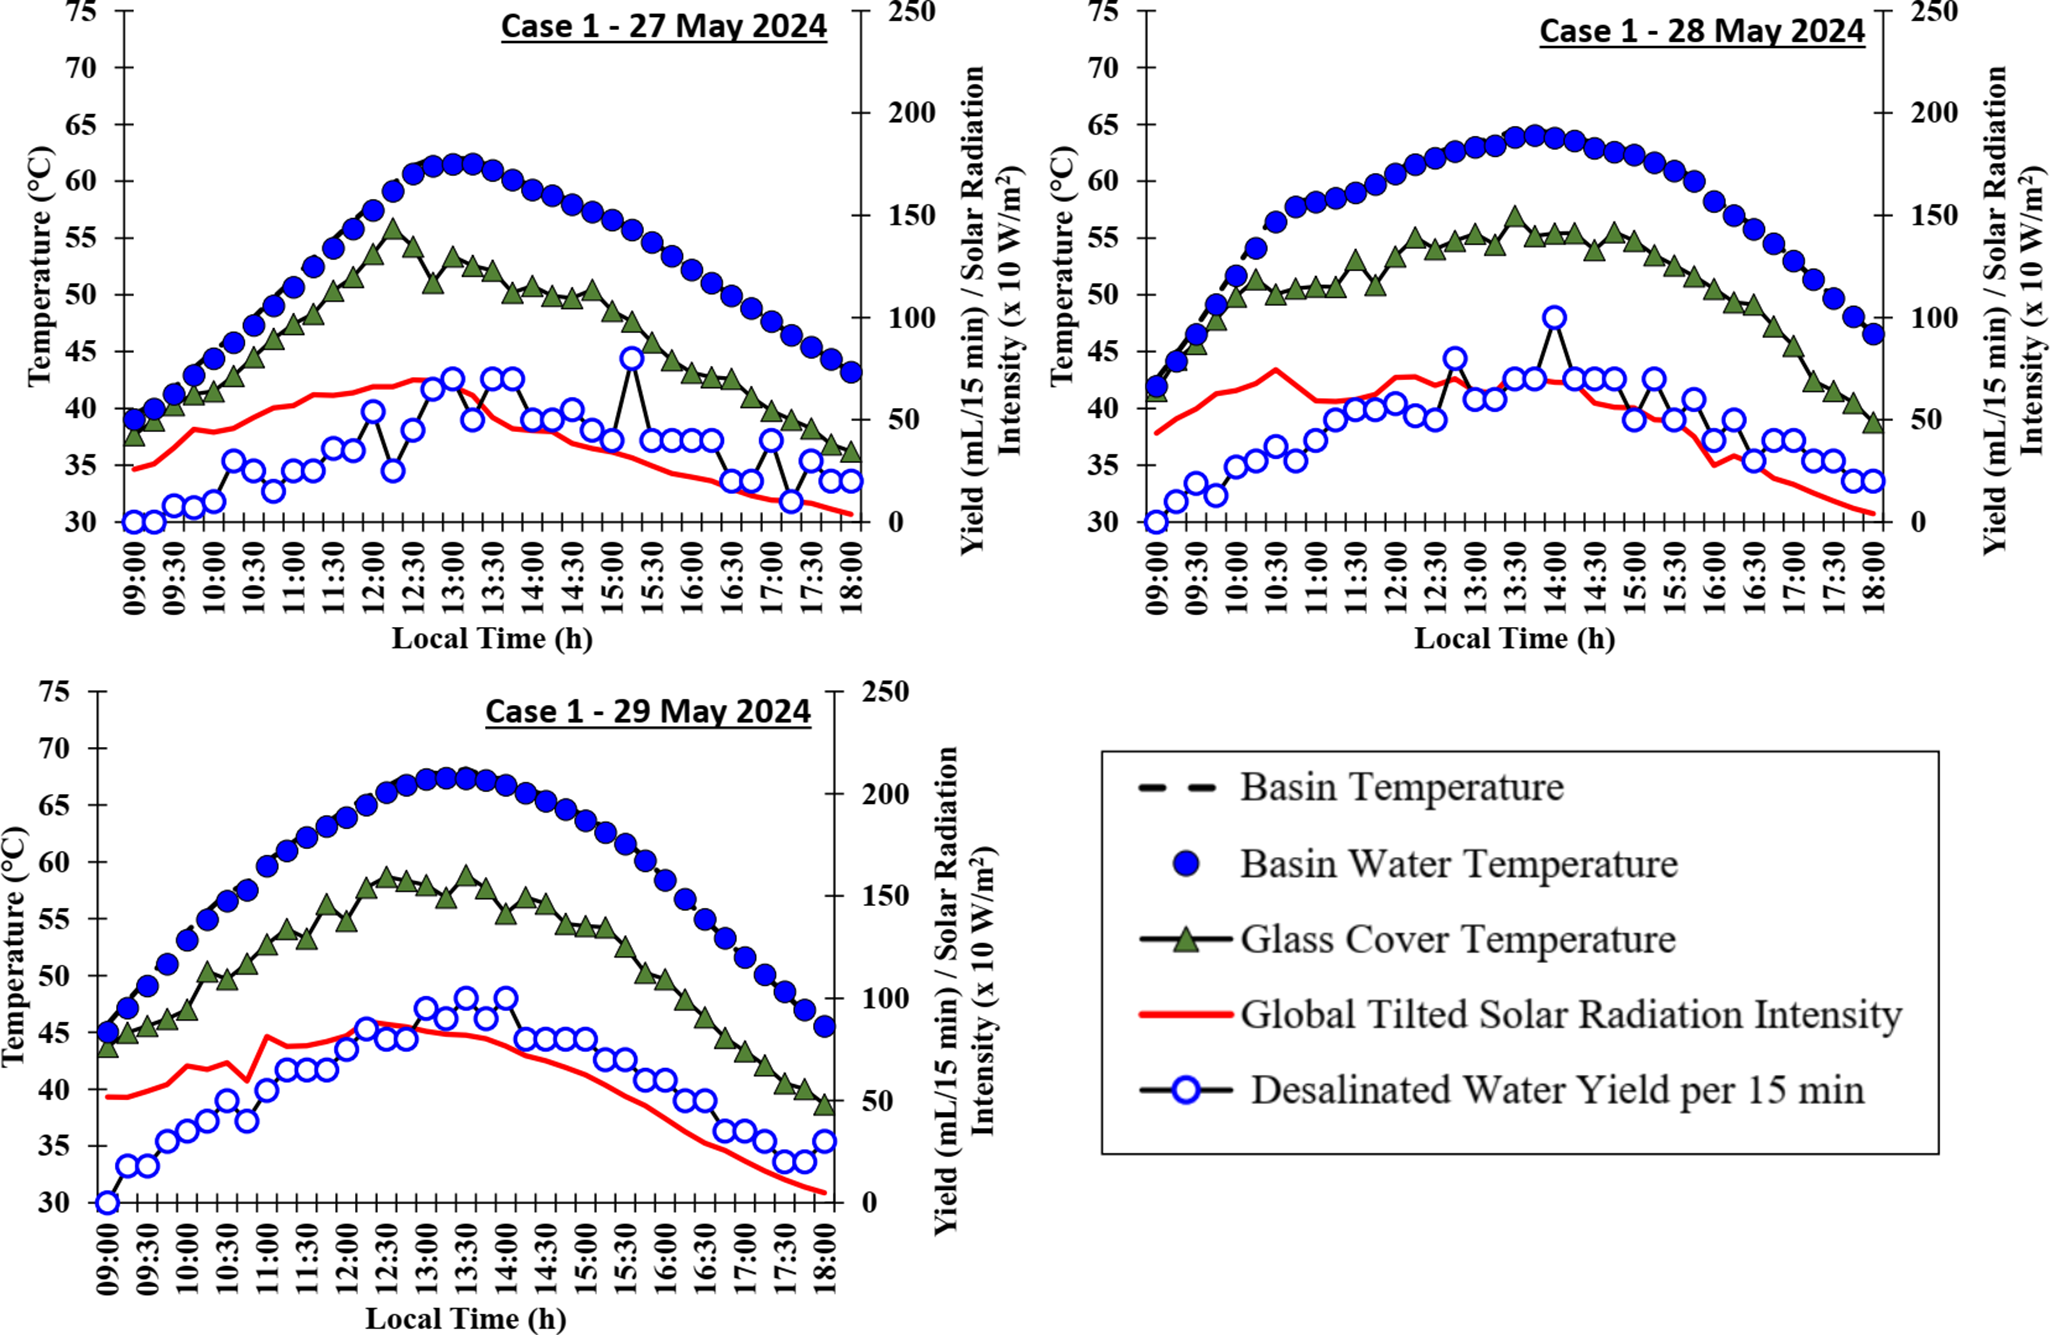
Variation of solar radiation intensity, desalinated water yield and solar still component temperature on experimental days in Case 1. (Sharon et al., Reference Sharon, Prasad, Gowtham, Gopal and Aswin2025).

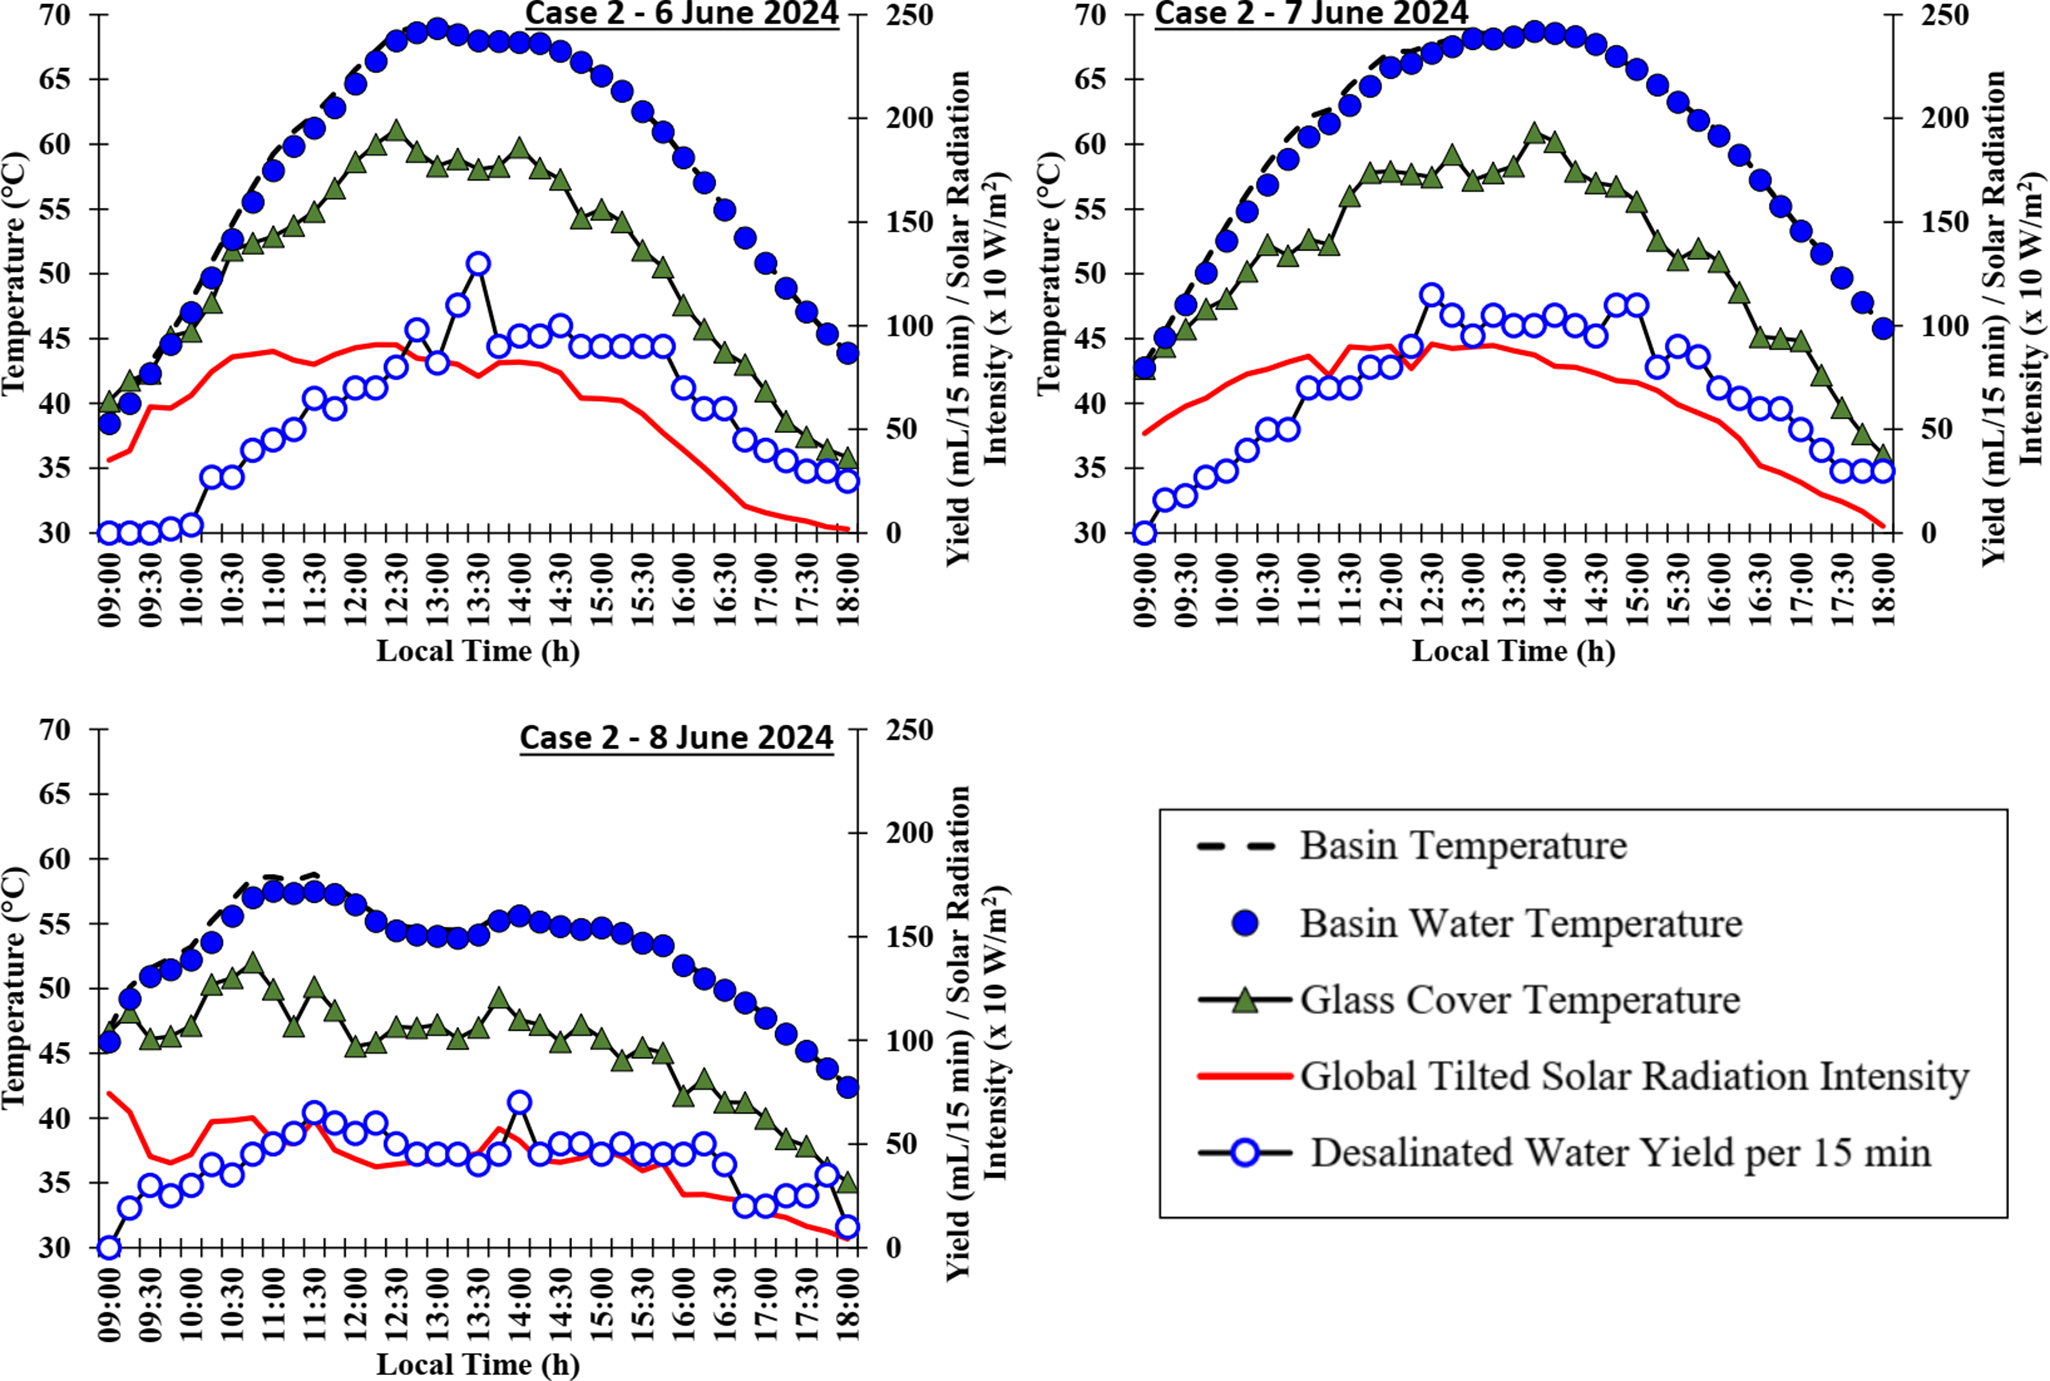
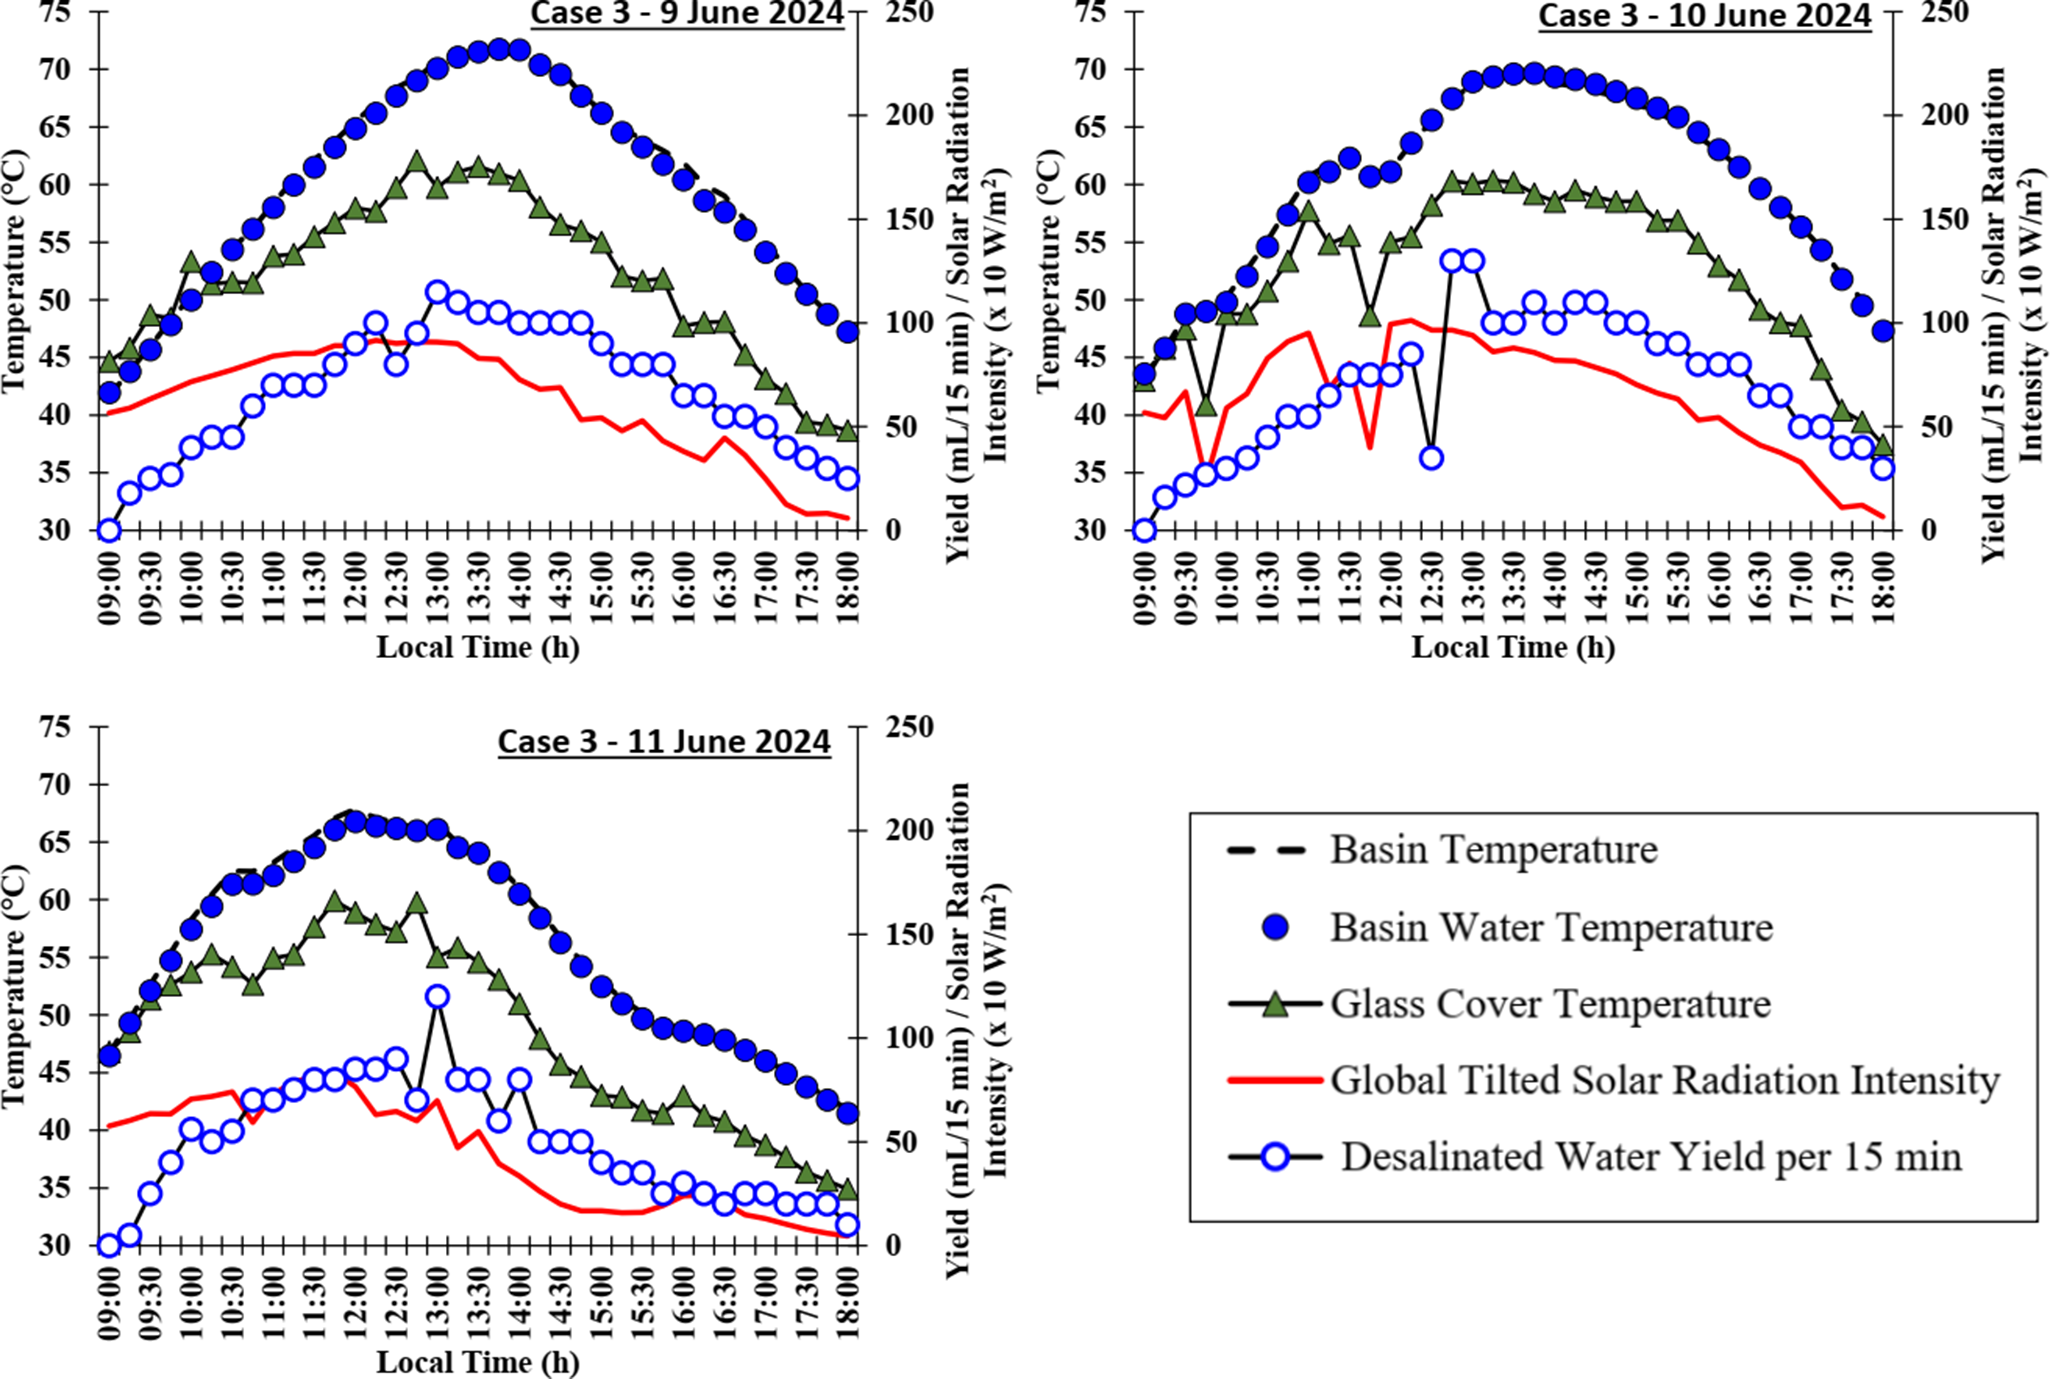
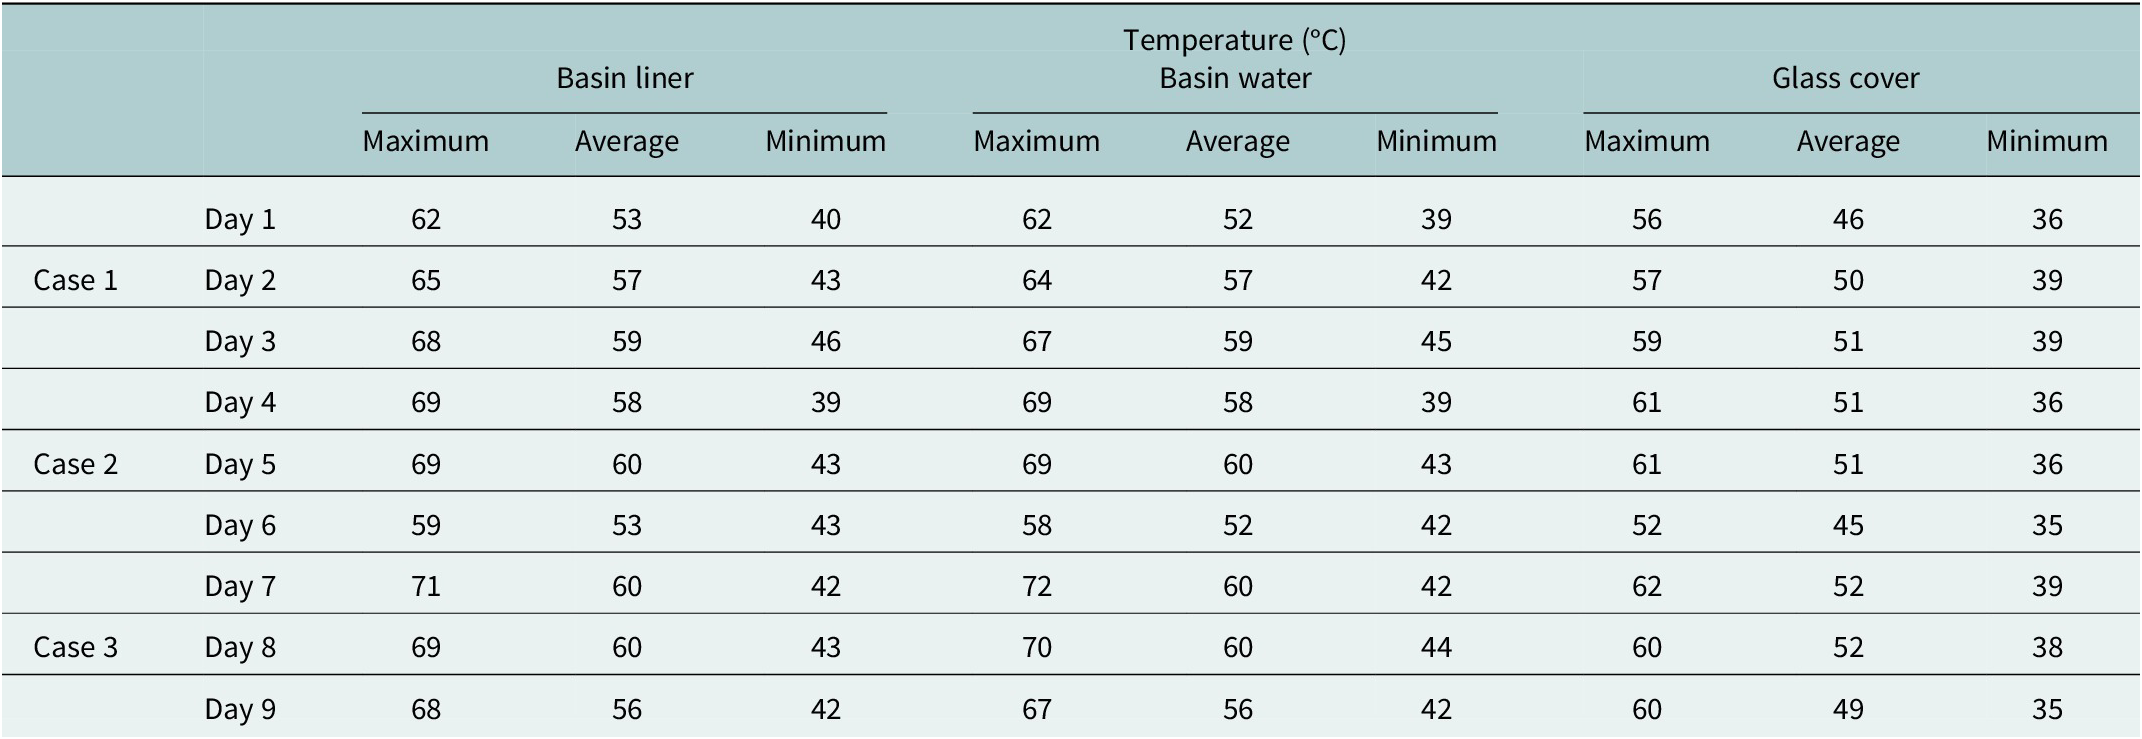
On all the experimental days in Case 1, the basin liner and basin water temperature were closer to each other (Figure 3). In Case 2 (Figure 4), the basin liner temperature was slightly higher than the basin water temperature, especially during the morning hours. This observation could be attributed to the enhanced thermal inertia (heat capacity) effect caused by the addition of 8 kg gravel to the basin. The blackened basin liner warmed up first, followed by the gravel layer, and the basin water, to which the heat energy was convected from both basin liner and gravel layer. Figure 5 shows that in Case 3, the addition of black ink promoted consistent heating of the basin liner, gravel layer and basin water, bringing their temperatures closer to each other.
Variation of solar radiation intensity, desalinated water yield and solar still component temperature on experimental days in Case 2.

Variation of solar radiation intensity, desalinated water yield and solar still component temperature on experimental days in Case 3.

Solar radiation energy on Day 1 through Day 9 was around 13, 17, 19, 20, 22, 14, 21, 21 and 14 MJ/m2d, respectively. Desalinated water production does not begin immediately during the experiment’s starting periods in Cases 1 and 2. On Day 1 (the first day in Case 1) (Figure 3), desalinated water production began 30 min after the initial exposure to solar irradiation. Similarly, on Day 4 (the first day in Case 2) (Figure 4), the generation of desalinated water began 45 min after the initial exposure to solar radiation. These observations highlight the impact of heat capacity in the required basin water warming up period to initiate evaporation. Moreover, it was obvious in Case 1 and Case 2 experimental periods (Figure 3 and 4) that peak/maximum desalinated water production occurred significantly after peak/maximum solar irradiation on the corresponding experimental days, thereby justifying the impact of heat capacity. However, throughout the experimental days on Case 3 (Figure 5), the start of desalinated water production began immediately upon exposure to solar radiation. This could be attributed to the presence of black ink in basin water, which has helped in enhancing the absorption of incident solar radiation by the basin water, resulting in improved evaporation and offsetting the high heat capacity impact offered by both basin water and gravel. This could also be justified by the shorter time delay between the occurrence of peak solar irradiation and peak desalinated water production rate on experimental days in Case 3.
Tables 4 and 5 present the major experimental observations. It was evident that the desalination process began immediately in Case 3, while Cases 1 and 2 required some warm-up before the first run. The daily average desalinated water yield was highest in Case 3, followed by Case 2 and Case 1. The average desalinated water yield observed in Case 3 under solar radiation energy of 21 MJ/m2d (Day 8) was around 69 mL/15 min, which was greater than the average yield observed in Case 2 on a similar day with a solar energy of 22 MJ/m2d (Day 5). It was interesting to notice that the desalinated water yield contribution beyond the peak basin water temperature period was greater than 50% in all the investigated cases, with larger values reported on cloudy days. In Case 3, the observed contribution beyond peak basin water temperature was modest compared to other investigated cases, indicating greater evaporation during sunny periods and poor energy storage for evaporation in post-sunny periods. The average basin water and basin liner temperature were closer to each other for all the investigated cases. High operating temperature was observed in Case 3, justifying the effective ability of black ink in absorbing incident solar radiation. Hence, it could be understood that techniques that favour more solar irradiation absorption may improve operating temperature and evaporation rates in the solar still.
Compilation of solar radiation intensity data, yield, desalination process initiation time and post peak temperature yield percentage

* Excluding zero.
** It also includes nocturnal yield.
Compilation of solar still component temperature data on experimental days

Daily performance comparison of investigated solar still cases
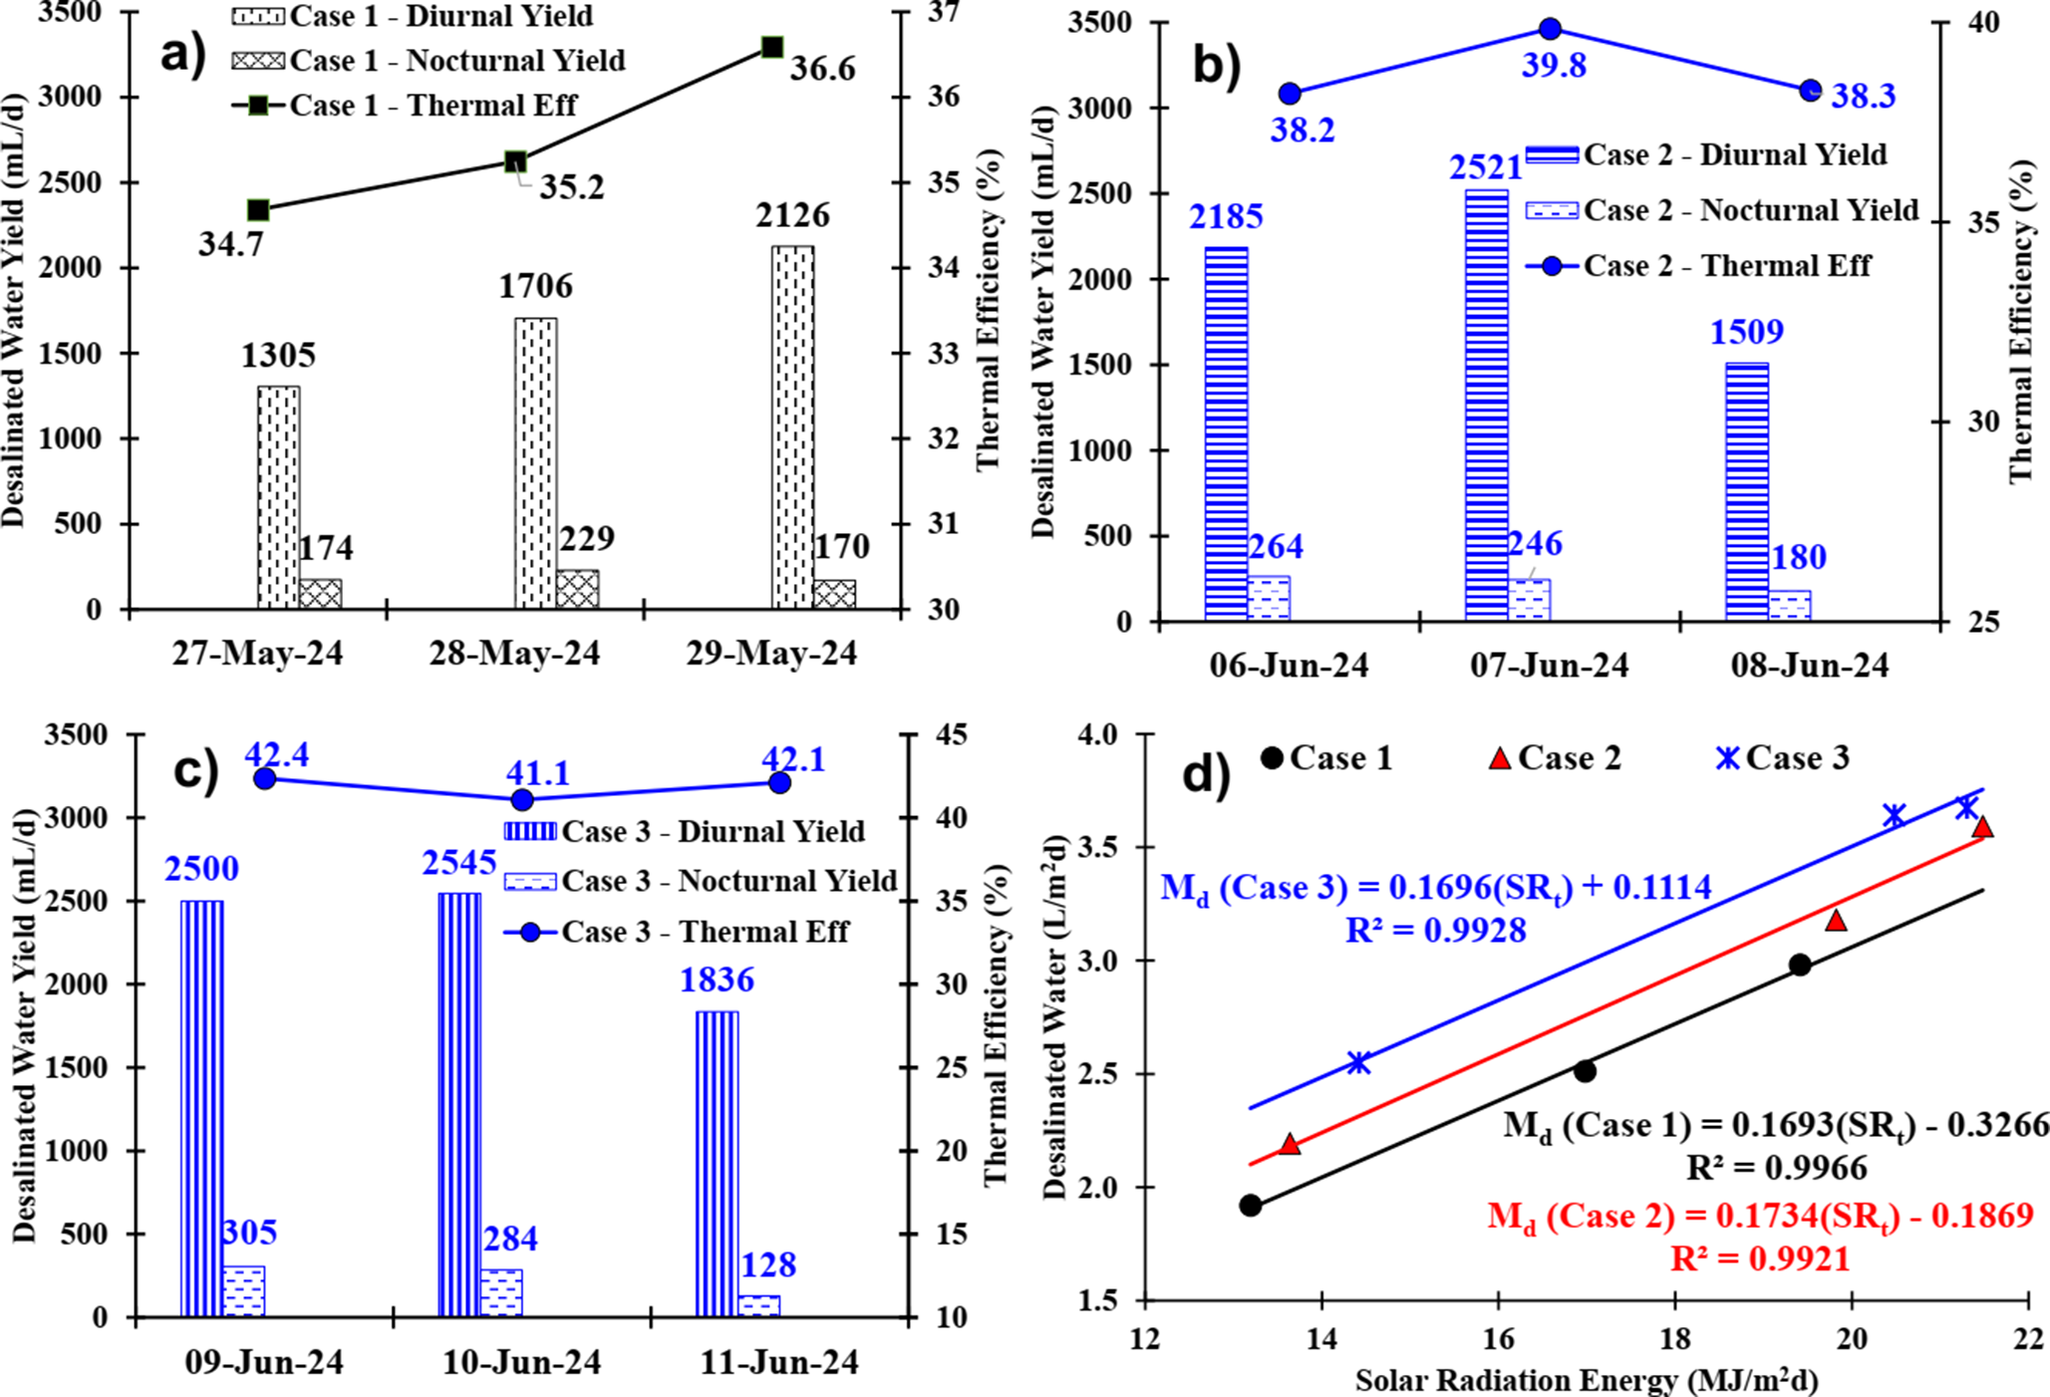
Figure 6a–c depicts the daily diurnal and nocturnal desalinated water yield from the investigated solar still cases. The term “diurnal yield” refers to the amount of desalinated water collected during daylight hours. Because of the low ambient temperature after sunset, the warm unevaporated water left in the solar basin continues to evaporate, producing additional desalinated water. The total amount of desalinated water produced between sunset and daybreak the next day was recorded as “nocturnal yield.” The summation of diurnal and nocturnal yield is called cumulative daily yield. Case 3 demonstrated the highest diurnal and cumulative desalinated water yield production, followed by Case 2 and Case 1. The cumulative yield in Case 1, Case 2 and Case 3 was around 1.5 to 2.3 L/d, 1.7 to 2.8 L/d and 2.0 to 3.0 L/d, respectively. The daily thermal efficiency observed in Case 1, Case 2 and Case 3 ranged from 35% to 37%, 38% to 40% and 41% to 42%, respectively. The standard deviation observed for yield among the experimental days on Case 1, Case 2 and Case 3 was about ±0.33, ±0.45 and ± 0.40 L, respectively. Similarly, the standard deviation observed for thermal efficiency among the experimental days on Case 1, Case 2 and Case 3 was about ±0.80%, ±0.74% and ± 0.56%, respectively.
Diurnal yield, nocturnal yield and thermal efficiency of the solar still under (a) Case 1, (b) Case 2 and (c) Case 3. (d) Variation of daily desalinated water yield of the solar still with solar radiation energy under various cases.

Figure 6d Depicts the variation of daily cumulative yield with solar energy. Cumulative yield enhanced linearly with an increase in incident solar radiation energy. The curve fitting equation produced by linear regression (Figure 6d) showed that the cumulative yield observed in Case 2 and Case 3 was about 7% to 10% and 14% to 23% greater than that of Case 1 under similar solar energy input. Incorporating mirrors + gravel in Case 2 and adding black ink in Case 3 boosted solar energy reaching the basin water, getting absorbed and stored, leading to better yield and thermal efficiency when compared with Case 1. Moreover, the modifications were identified to be highly beneficial during days with low solar radiation energy potential.
The nocturnal yield in Cases 1, 2 and 3 ranged from 7% to 12%, 9% to 11% and 7% to 11% of the daily cumulative yield, respectively. It is worth noting that the proportion of nocturnal yield to daily cumulative yield was higher in Case 1 on days with low solar energy (27th and 28th May 2024). Due to the inability of the incident low solar energy to induce immediate enhanced evaporation during sunshine hours, a portion of it gets stored as sensible heat energy in basin water. This stored sensible heat energy might be the reason for significant water evaporation after sunset hours on days with low solar energy in Case 1. On days with high solar energy, the nocturnal yield portion in the daily cumulative yield was slightly lower in Case 1 and Case 2, and it could be attributed to the improved water evaporation during sunshine hours, resulting in low basin water energy availability for enhanced evaporation after sunset. The nocturnal yield contribution to the daily cumulative yield in Case 3 was higher on days with high solar energy, implying that added black ink helps the gravel to store energy effectively due to its relatively high absorptivity.
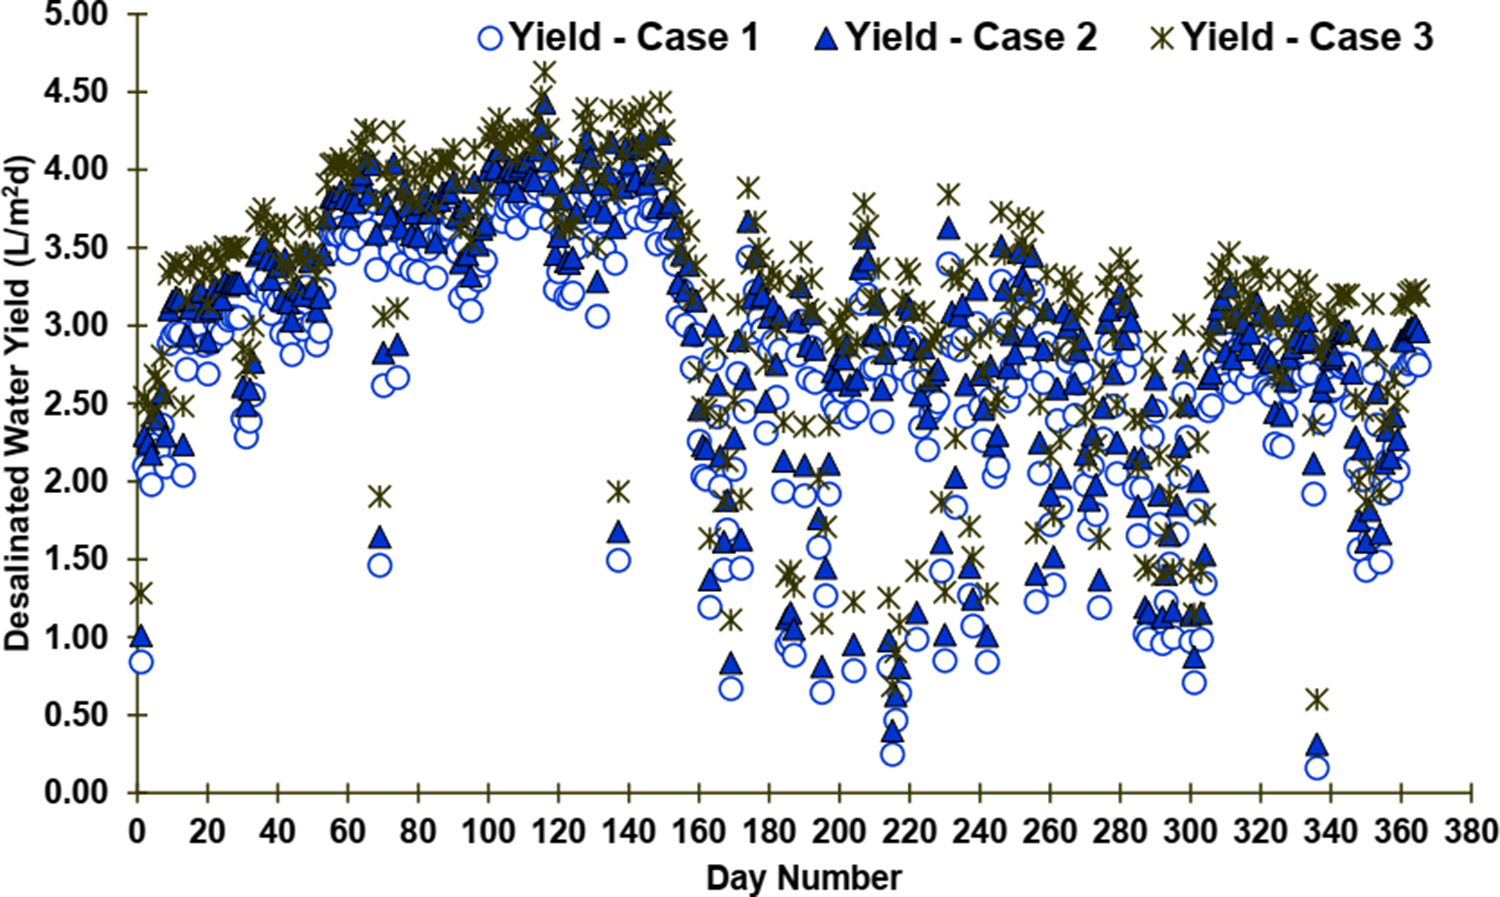
The daily solar energy potential in the experimental site (Visakhapatnam) was accessed from the PVGIS database (PVGIS, 2025) and was used to predict the daily desalinated water production of the solar still for the investigated three cases using the correlations developed earlier ( Figure 6d). Solar radiation intensity, water quality, dust and salt deposition have an impact on solar still yield. The impact of water quality, dust and salt deposition can be eliminated by changing the feed water in the basin once a week and cleaning the glass cover every day. Hence, solar radiation intensity will be the dominating factor in determining the yield of the properly maintained solar still. The daily solar radiation potential of Visakhapatnam ranged from 3 to 27 MJ/m2d (Figure S1 of the Supplementary Material) with an annual potential of around 6,547 MJ/m2. The predicted day-wise desalinated water production of the solar still is presented graphically in Figure 7. The solar still can produce more desalinated water on days with higher solar energy potential, as shown in Figure 7 and Figure S1. The days with very low solar radiation potential may not facilitate the solar still to produce the required quantity of drinking water. Hence, oversizing seems necessary to have an uninterrupted drinking water supply from solar stills. The annual desalinated water production of the solar still in Case 1, Case 2 and Case 3 was about 989, 1,067 and 1,151 L/m2 year, respectively. Annual desalinated water production in Case 2 and Case 3 was approximately 8% and 16% higher than in Case 1. The predicted annual yield was utilized for the economic and environmental aspects analysis of the investigated solar still cases.
Year-round predicted desalinated water production of the investigated solar still cases in Visakhapatnam.

Characterization of investigated solar still cases
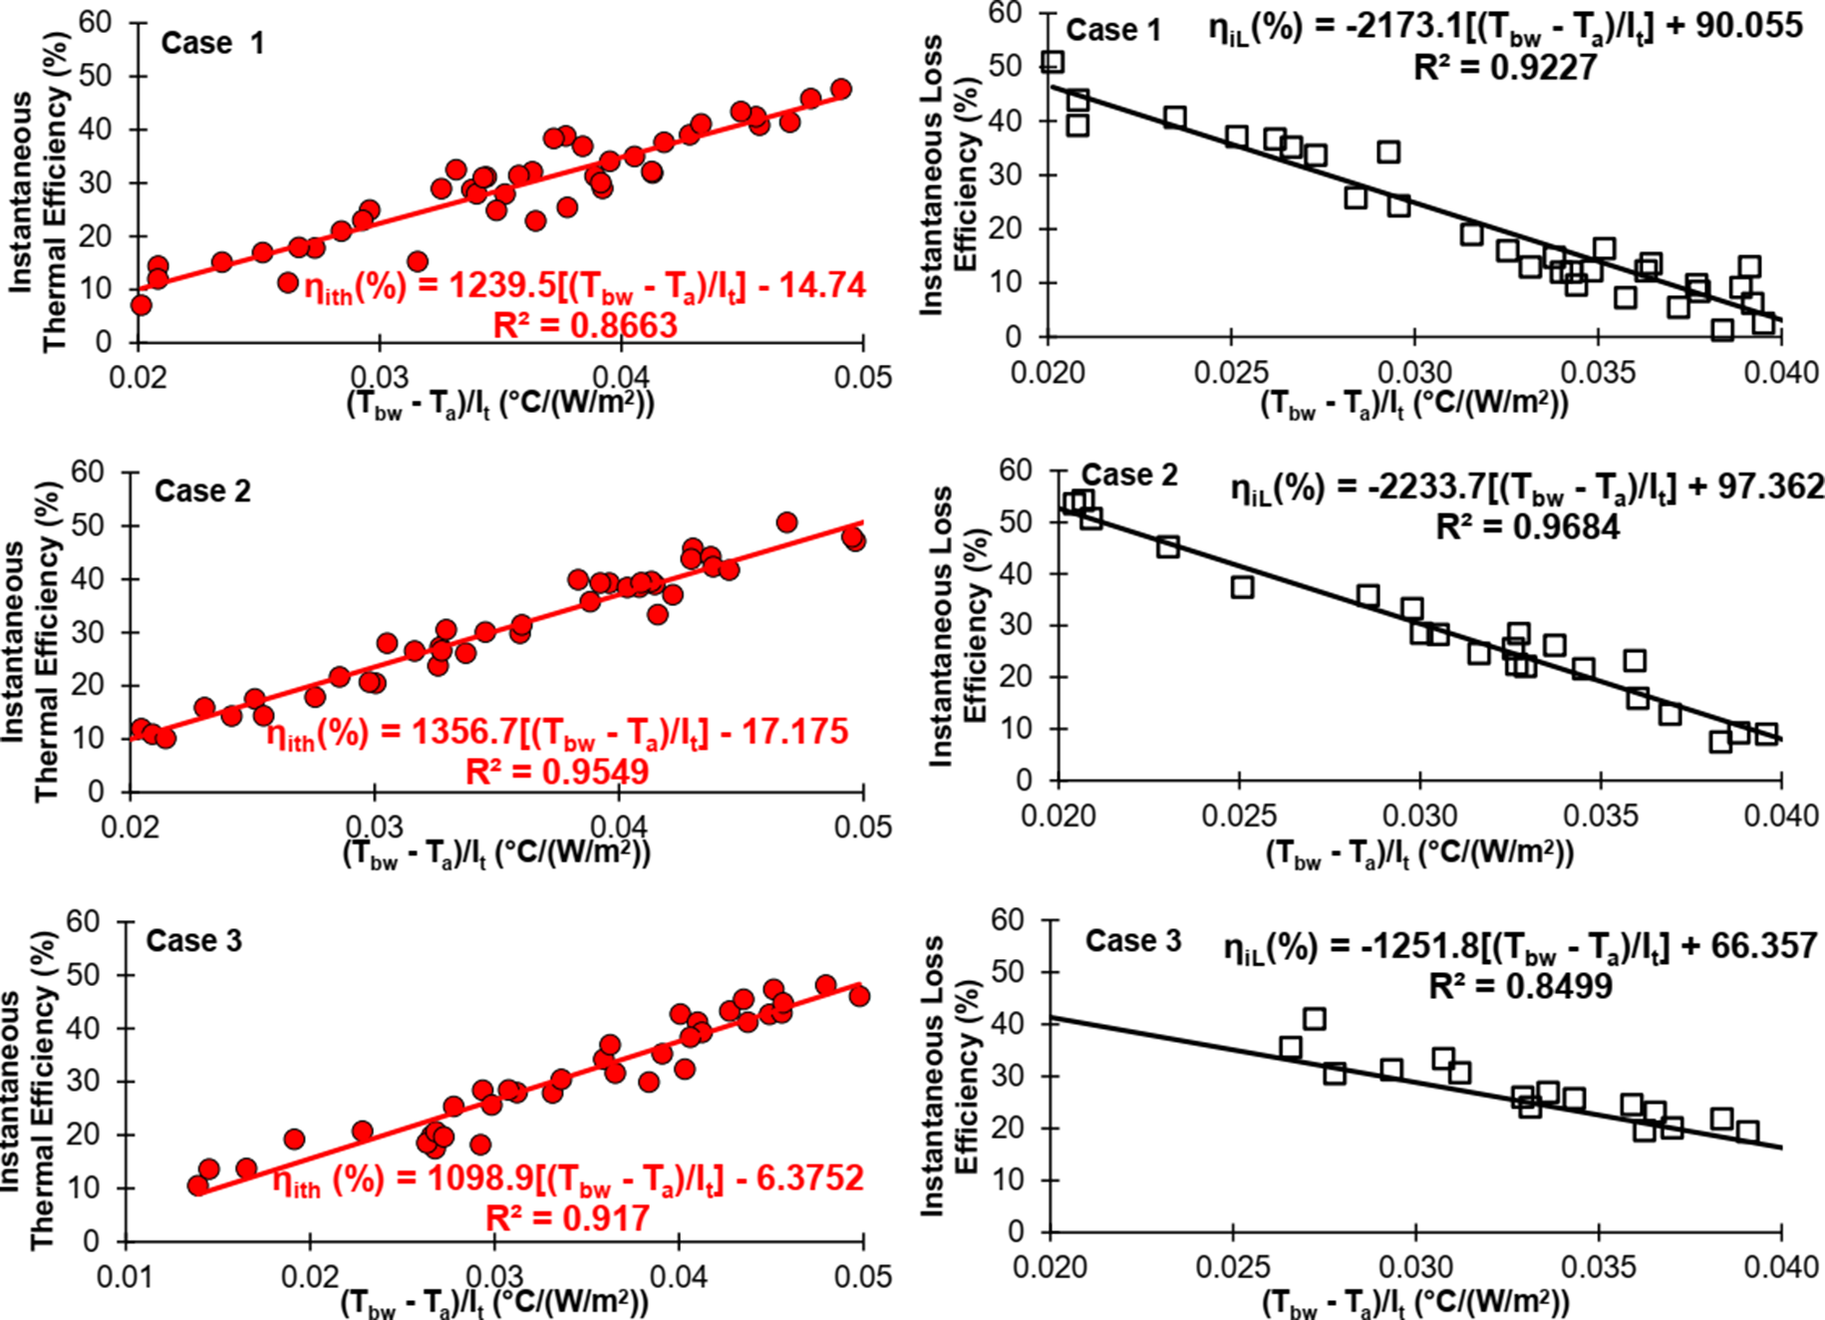
Characteristic curves were constructed using the experimental basin water temperature, ambient temperature and desalinated water yield measured during effective sunshine periods ranging from 9:15 to 15:30 h. Effective sunshine periods were chosen to avoid exaggerated thermal efficiency and negative loss efficiency values (Dev and Tiwari, Reference Dev and Tiwari2009). Moreover, the sum of thermal and loss efficiency should never surpass 60% at any instant, and if any, those data points should be excluded (Dev and Tiwari, Reference Dev and Tiwari2009). The instantaneous thermal and loss efficiency of the solar still investigated under various cases was plotted against $ \frac{\left({T}_{bw}-{T}_a\right)}{I_t} $
and shown in Figure 8. The characteristic curves based on instantaneous thermal and loss efficiency showed a positive and negative slope, respectively, indicating increased evaporative heat transfer and decreased heat loss to the ambient with increasing magnitudes of
$ \frac{\left({T}_{bw}-{T}_a\right)}{I_t} $
and shown in Figure 8. The characteristic curves based on instantaneous thermal and loss efficiency showed a positive and negative slope, respectively, indicating increased evaporative heat transfer and decreased heat loss to the ambient with increasing magnitudes of $ \frac{\left({T}_{bw}-{T}_a\right)}{I_t} $
.
$ \frac{\left({T}_{bw}-{T}_a\right)}{I_t} $
.
Characteristic curves of the solar still in Case 1, Case 2 and Case 3 operation scenarios.

The instantaneous thermal efficiency equation has a negative intercept for all the three cases, indicating high heat capacity associated with the solar still (Tiwari and Noor, Reference Tiwari and Noor1996). High basin water heat capacity indicates a high energy input required to initiate evaporation. Equating the instantaneous thermal efficiency characteristic equation to zero yielded the threshold solar radiation intensity required to initiate desalinated water production. The negative intercept values noticed in Case 1, Case 2 and Case 3 were 14.74, 17.18 and 6.38, respectively. These values clearly show that the addition of gravel increased the heat capacity of the still, minimizing quick evaporation. However, the addition of black ink helped to offset the increased heat capacity, allowing for a faster start of evaporation. This observation supported Case 3 as a better option for operating the system on cloudy days or in regions with low solar energy potential.
Water quality aspects
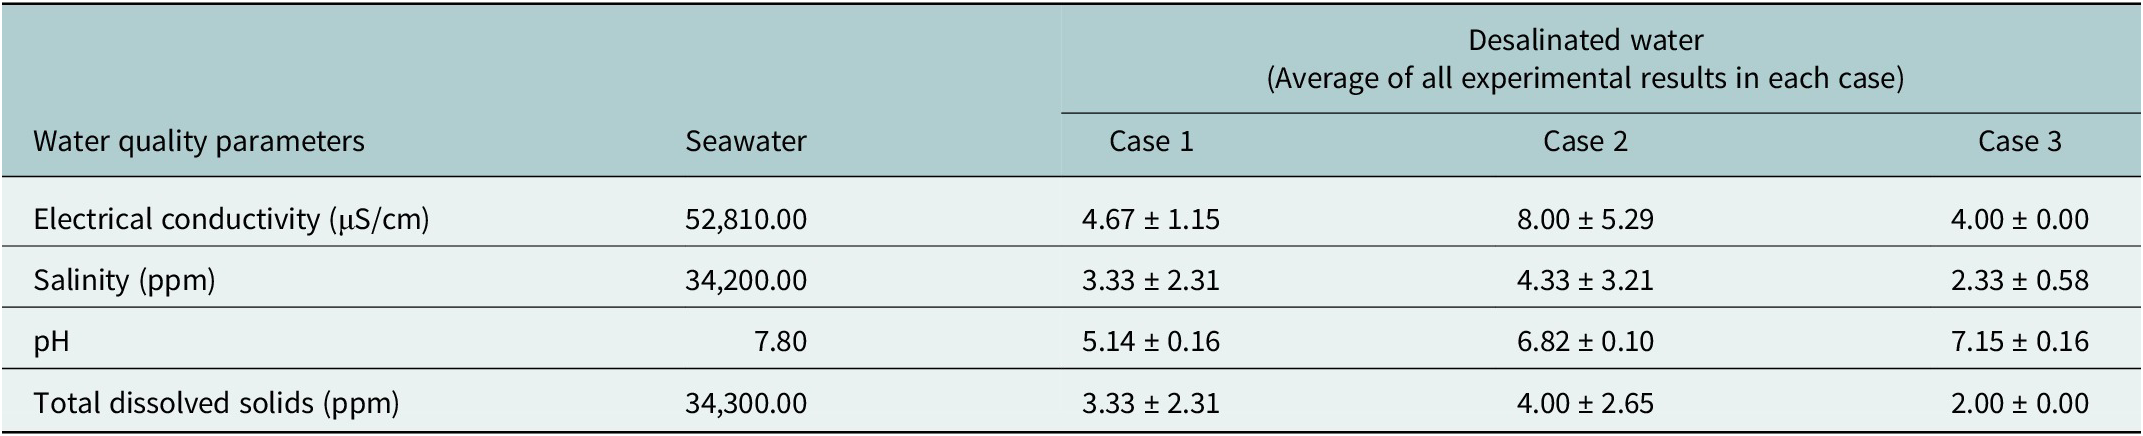
The water quality test results of feed seawater and desalinated water are tabulated in Table 6. Desalinated water obtained in all the three cases had a lower ion concentration than the feed seawater as evidenced by its very low electrical conductivity values (Flendrig et al., Reference Flendrig, Shah, Subrahmaniam and Ramakrishnan2009). The desalinated water produced in the solar still contains about nearly 99.99% less salt and total dissolved solids than seawater. Desalinated water showed a pH value ranging between 5.14 to 7.15, which was lower than that of seawater, and this drop could be linked to the removal of OH− ions caused by the combination of CO2 in the solar still’s air with evaporating water to generate H3O+ (Flendrig et al., Reference Flendrig, Shah, Subrahmaniam and Ramakrishnan2009). Moreover, from visual observation, the desalinated water appears to be very transparent, indicating no black ink carries over with the generated water vapour. As per Indian drinking water standards, the permissible total dissolved solids in drinking water is 500 ppm (BIS, 2012). In all cases, the desalinated water produced by the solar still had a very low total dissolved solids, indicating it was of very high quality and highlighting the need for the addition of essential minerals before supplying it for human consumption (WHO, 2003). The effective removal of salt and ions from seawater by the solar still makes it an effective tool for supplying clean drinking water to underprivileged communities in developing and underdeveloped nations.
Seawater and desalinated water quality analysis results

Economics of investigated solar still configurations
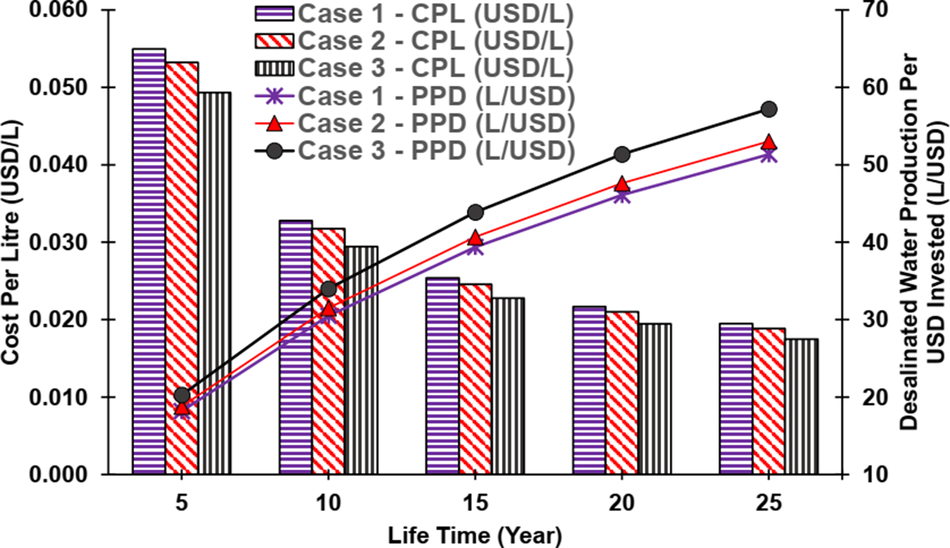
The impact of solar still configurations and their lifetime on desalinated water production cost and quantity of desalinated water produced per USD invested on them is shown in Figure 9. Under similar lifetime, the solar still configuration in Case 2 and Case 3 had nearly 3% and 10% lower desalinated water production cost per litre than Case 1, respectively. The desalinated water production cost per litre for all the three investigated cases dropped by 40%, 23%, 15% and 10% with each five-year increase in lifetime from 5 to 10 years, 10 to 15 years, 15 to 20 years and 20 to 25 years, respectively. The desalinated water production cost using a solar still with 10-year lifetime was around 33, 32 and 29 USD/m3 in Cases 1, 2 and 3, respectively. The desalinated water production cost using a solar still with 25-year lifetime was projected to be around 19, 18 and 17 USD/m3, respectively, in Cases 1, 2 and 3, respectively. The quantity of desalinated water produced per USD invested in Cases 1, 2 and 3 ranged from 18 to 51, 19 to 53 and 20 to 57 L/USD, respectively, during a lifetime of 5 to 25 years. The simple economics analysis resulted in the Case 3 scenario being more economical, emphasizing that the still’s lifetime had a significant impact on its economics.
Variation of desalinated water production cost per litre and quantity of desalinated water production per USD invested in the investigated solar still cases.

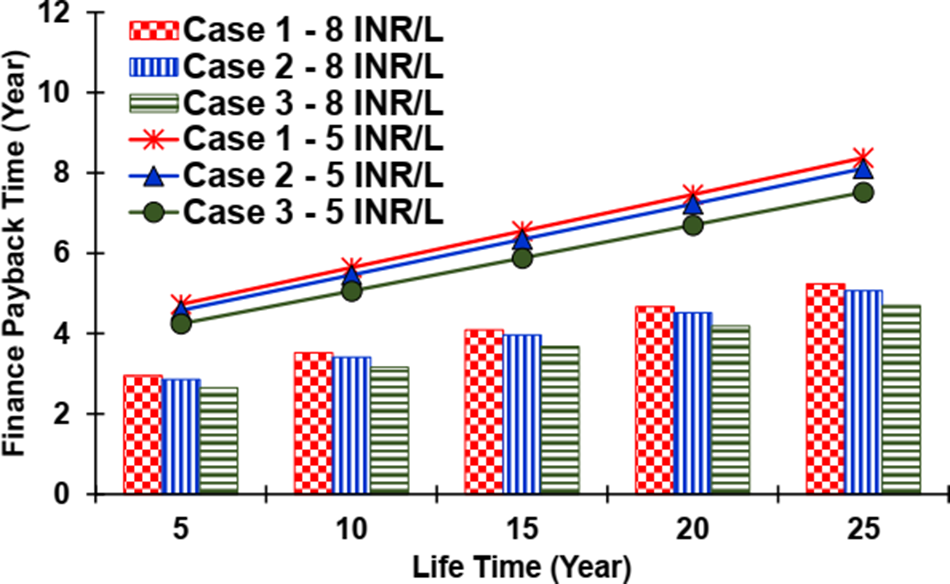
The finance payback time of the investigated solar still cases is expressed graphically in Figure 10. The finance payback time increased by 19%, 16%, 14% and 12% as the solar still’s lifetime increased from 5 to 10 years, 10 to 15 years, 15 to 20 years and 20 to 25 years, respectively, due to the consideration of annual maintenance and post-treatment costs. The finance payback time seemed to be 60% higher for all investigated solar still cases, with a decline in desalinated water selling price from 8 to 5 INR/L (0.093 to 0.058 USD/L). The finance payback time in Cases 2 and 3 was approximately 3% and 10% lower than that in Case 1, respectively, for both the considered selling price scenarios, regardless of lifetime. The lower desalinated water production cost and finance payback time make the solar still more economically viable for adoption in Indian coastal climatic conditions, especially in Case 3.
Variation of finance payback time of the investigated solar still cases with lifetime and selling price of desalinated water (1 USD = 86 INR).

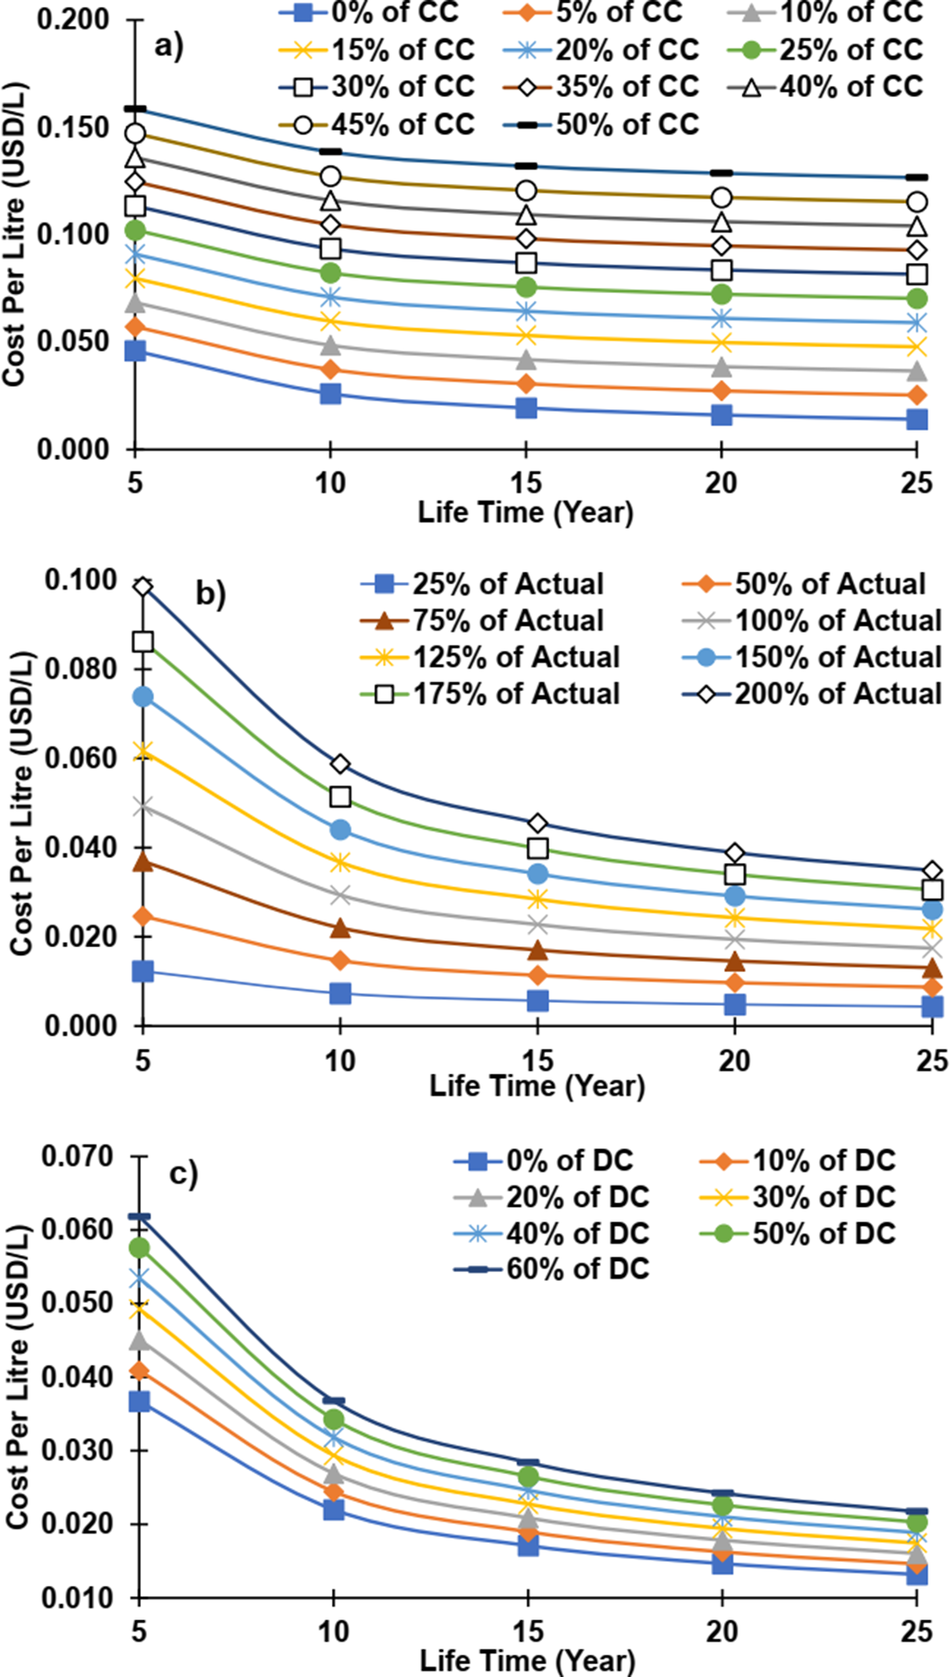
The impact of maintenance, direct and indirect costs on the desalinated water production cost of a modified basin solar still (Case 3) is graphically represented in Figure 11. The maintenance cost, direct cost and indirect cost were varied from 0% to 50% of the capital cost, 25% to 200% of the actual direct cost and 0% to 60% of the actual direct cost, respectively, in this investigation. The evaluated desalinated water production costs were found to be directly proportional to the associated maintenance, direct costs and indirect costs. However, it is worth noting that the cost of desalinated water production remains the same over a 15-year lifetime for all the considered maintenance and direct costs (Figure 11a,b). In the case of indirect costs, the cost of producing desalinated water was found to stabilize after 20 years (Figure 11c). The indirect cost, which includes tax and insurance price, can be eliminated if the still is fabricated locally and used for household purposes, lowering the desalinated water production cost from 17 to 13 USD/m3. Cutting off direct costs seems to lower water production costs by 75% (i.e. from 17 to 4 USD/m3), indicating the positive aspects of government subsidies. Maintenance costs are crucial since they are determined by the installation site, feed water characteristics and labour availability, in addition to the attributes of the material used for still development. Dust deposition and salt accumulation over time will significantly affect water production rate, maintenance and water production costs. Increasing the maintenance cost from 0% to 5% of the capital cost raised water production costs by 24% and 79% over a 5- and 25-year lifetime, respectively. However, the maintenance costs can be avoided if household members can clean the glass cover themselves every morning before sunrise and drain the unevaporated brine at least once a week.
Impact of (a) maintenance cost, (b) direct cost and (c) indirect cost on cost per litre of desalinated water produced by the synergized basin solar still (Case 3) under varying lifetime.

Comparison of modified basin solar still with other desalination and household clean water supply technologies
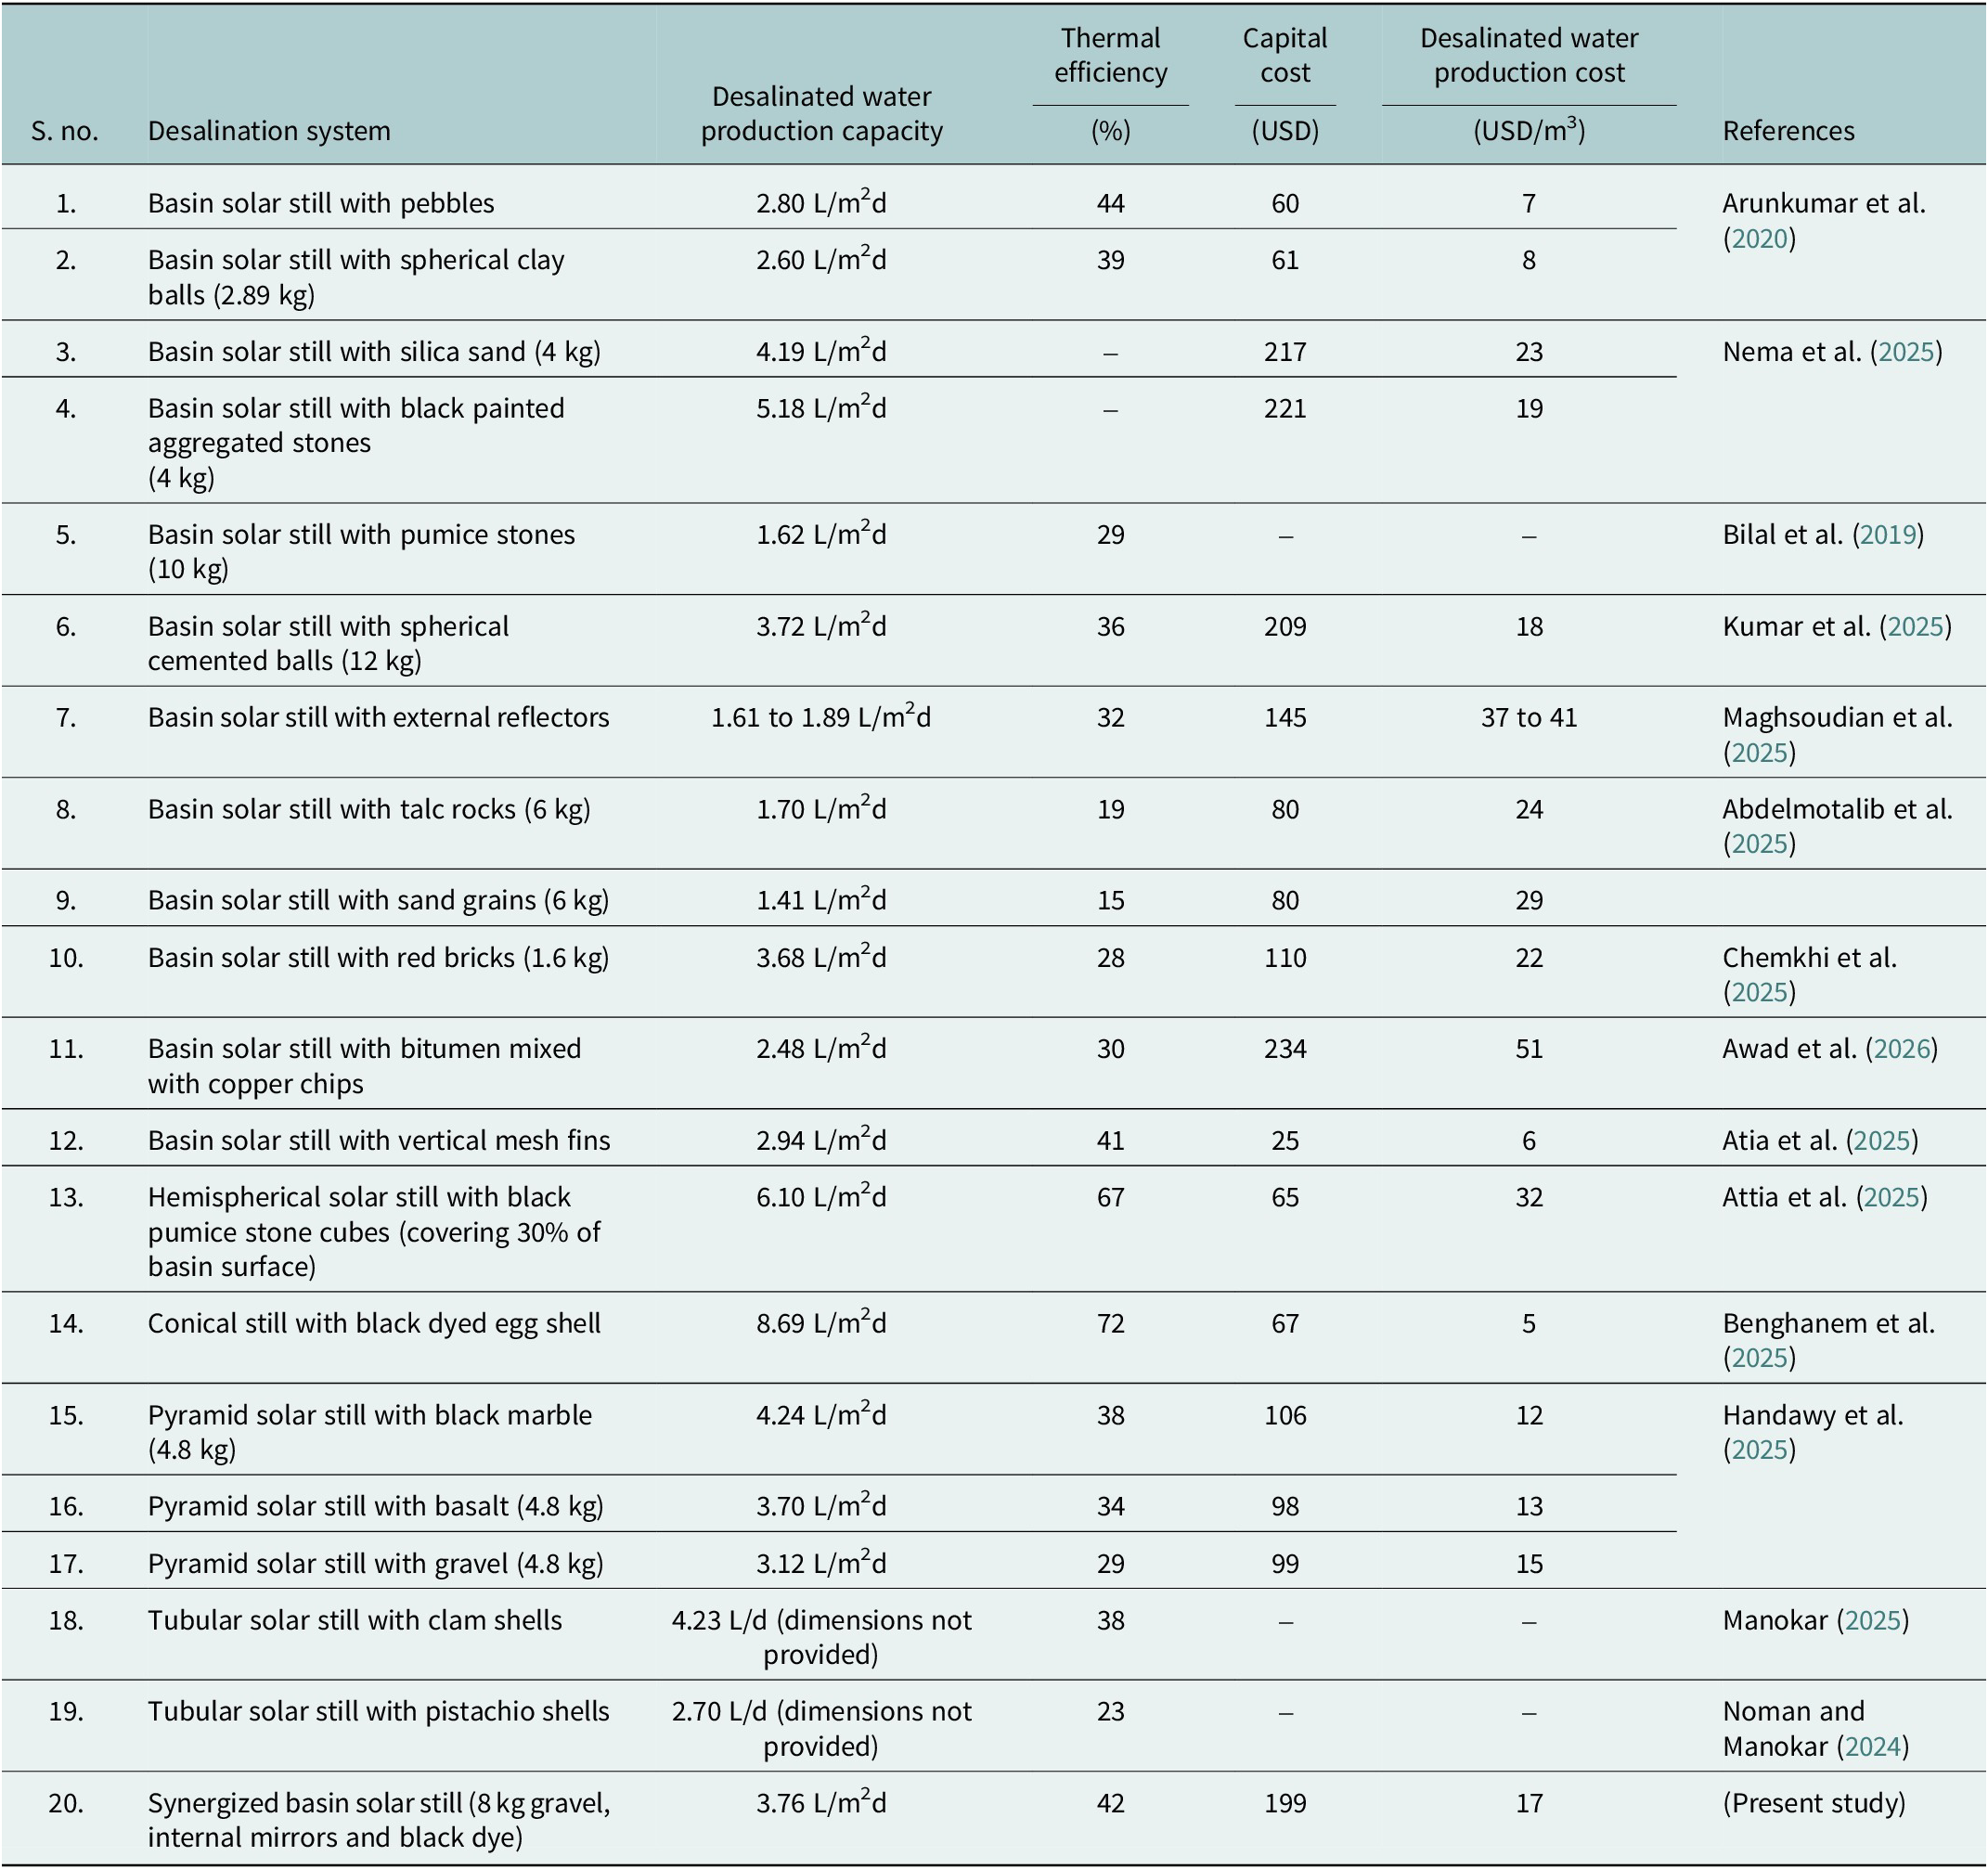
The comparison of performance and economic aspects of the modified solar still with various solar still configurations is tabulated in Table 7. The desalinated water productivity of the modified still was greater than most of the basin and pyramid solar still configurations with energy storage materials by about 1% to 167% and 2% to 21%, respectively. However, it lags behind the hemispherical and conical solar still with energy storage materials by 62% and 131%, respectively. The comparison of solar stills in terms of thermal efficiency is appropriate, and the magnitude will provide a clear picture of the still’s performance. The modified solar still had a thermal efficiency of 42%, which was higher than the tubular solar still with clam shells and pistachio shells, pyramid solar still with black marble, basalt and gravel and simple basin solar still with clay balls, pumice stones, cemented balls, sand grains, red bricks and bitumen mixed with copper chips. This improved performance may be ascribed to the combination of internal reflectors, gravel and black dye.
Performance and economics comparison of various solar stills

The modified still has a greater capital cost than the majority of the other listed solar stills due to the use of stainless steel for fabrication, which has the added benefit of long operating lifetime. Hence, comparison in terms of production cost per m3 or litre of desalinated water can be an effective way. The modified still’s desalinated water production cost (17.0 USD/m3) was cheaper than the majority of basin solar still and hemispherical solar still configurations with energy storage materials, which ranged from 18.0 to 51.0 USD/m3 and 32.0 USD/m3, respectively. The conical still with blackened egg shell has the lowest water production cost of 5.0 USD/m3, followed by the solar still with vertical wire mesh, pebbles and pyramid solar still with energy storage materials (12.0 to 15.0 USD/m3). The modified still uses mirror, gravel and black dye (black ink), which are easily available in most of the locations and occupy only 4% of the fabricated still’s capital cost (191 USD). The ideal reason for lower desalinated water production costs in any of the stills is either a low capital cost, high desalinated water production rate or a combination of the two.
Commercial MSF (528,000 m3/d), MED (few m3/d), VC (1,000 m3/d) and RO (few to 320,000 m3/d) desalination plants have desalinated water production costs ranging from 1.75, 2.0 to 8.0, 2.0 to 2.6 and 0.66 to 12.99 USD/m3, respectively (Al-Karaghouli and Kazmerski, Reference Al-Karaghouli and Kazmerski2013). It can be seen that the modified solar still seem to be uneconomical when compared to the existing abovementioned commercial technologies. However, it should be remembered that the establishment of these commercial systems requires a large initial investment as well as relatively significant operating cost, which may hinder their installation in water-starved low economies. In contrast, community-scale solar still desalination plants (10,000 m2 solar still) have been shown to offer desalinated water at a reasonable cost comparable to commercial desalination plants (AAWS, 2014; Hota et al., Reference Hota, Hada, Keske and Diaz2022; Hilarydoss et al., Reference Hilarydoss, Nishant and Nahak2024).
The traditional household clean drinking water supply options, namely filtration, chlorination and boiling, are effective in killing, removing or deactivating the microbes in drinking water but are ineffective at making saline or seawater potable. Governments encourage rainwater harvesting to improve the groundwater table, and it has also served as a low-cost or free drinking water supply in many regions. However, it is season dependent and does not provide a long-term solution for addressing drinking water demand in arid and dry regions. Tanker water supply is widely adopted in cities but not expanded to remote and rural regions in most countries due to the reasonable costs involved. Moreover, tanker water needs further treatment like boiling or filtration to make it truly potable. Solar stills, on the other hand, can desalinate seawater to produce good-quality potable water at the point of need. Hence, the modified solar still can be considered a suitable option for potable water supply at the household level in water-starved small-scale remote, rural and coastal off-grid communities.
Environmental impact of investigated solar still cases
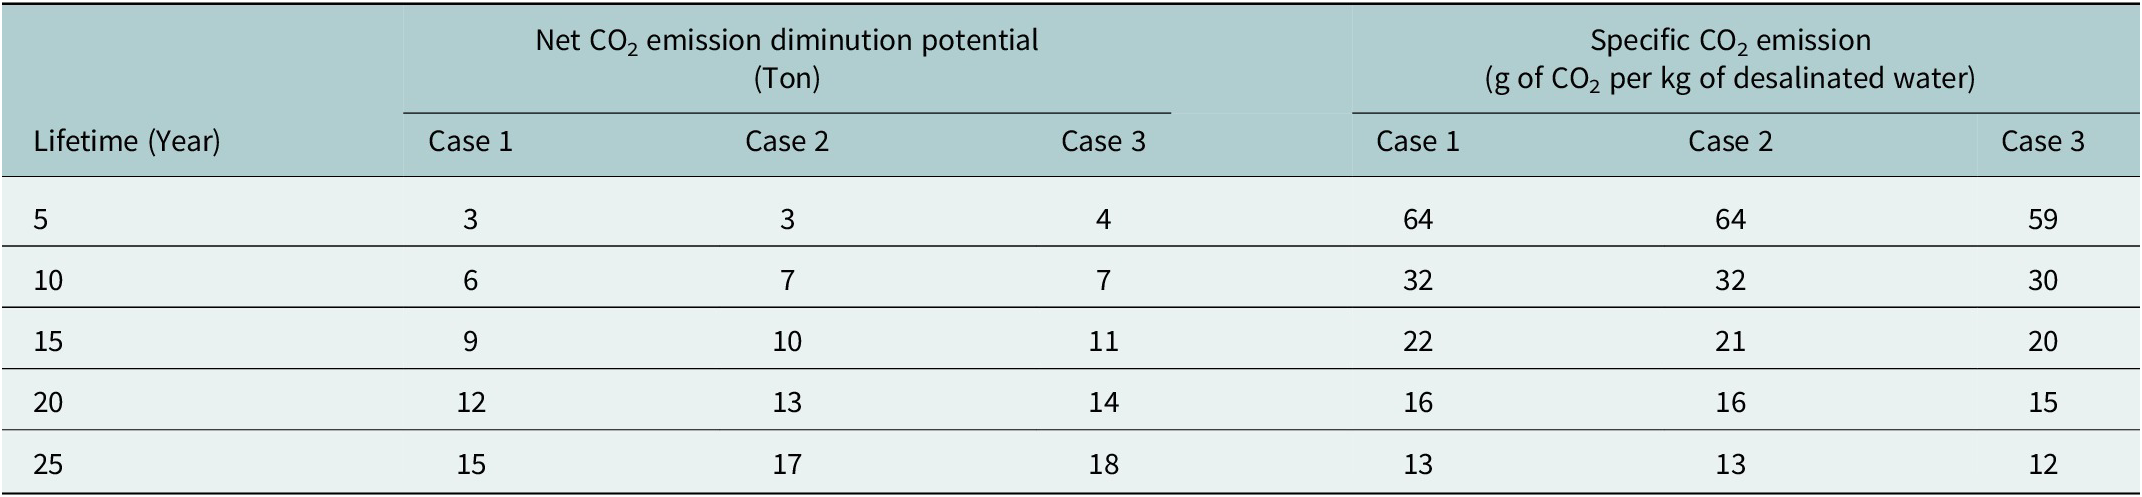
The energy payback time of solar stills in Cases 1, 2 and 3 was estimated to be around six months. The net CO2 emission diminution potential in Cases 1, 2 and 3, along with their associated specific CO2 emission per kg of desalinated water produced, is tabulated in Table 8. The emission diminution potential was the highest in Case 3 followed by Case 2 and Case 1, respectively. The high emission diminution potential and low specific CO2 emission per kg of desalinated water produced in Case 3 were due to its ability to produce relatively more desalinated water than in Cases 2 and 1, thereby offsetting more fossil fuel that could be used for desalination. Similarly, the higher lifetime has a positive impact on emission diminution potential due to the still’s ability to produce more cumulative desalinated water over time. The stainless steel solar still can easily last for more than 10 years with a net CO2 emission diminution potential of at least 7, 7 and 6 tons in Case 3, Case 2 and Case 1, respectively. Specific CO2 emissions associated with the still in Cases 1, 2 and 3 were approximately 32, 32 and 30 g of CO2 per kg of desalinated water produced, respectively.
Environmental impacts of investigated solar still cases

Scalability of solar stills
A basin solar still plant of 5,000 L/d capacity installed in 1979 at a village in Gujarat, India, to supply drinking water has successfully operated at a thermal efficiency of approximately 21.7% to 33.7% (Natu et al., Reference Natu, Goghari and Gomkale1979). A multiwick solar still with a capacity 70 L/d was found to operate satisfactorily continuously for one year in Delhi, India (Tiwari, Reference Tiwari1984). Aqua-Aero Watersystems B.V., a Dutch firm, developed and installed inflatable solar still with an area 650 m2 and a water production capacity 1,000 to 1,250 L/d in various regions of India and Africa to address drinking water demands (AAWS, 2014). Hota et al. (Reference Hota, Hada, Keske and Diaz2022) found that a 10,000 m2 solar still plant could address the drinking water needs of a small community in California, USA, for 7.71 USD/m3, making this more cost-effective than a solar PV-driven RO system. A community-scale solar still of 3.0 m3/d capacity has a water production cost of about 9 to 10 USD/m3 in Somalia (Hilarydoss et al., Reference Hilarydoss, Nishant and Nahak2024). Under the climatic conditions of Central American and Caribbean sites, a family-scale basin solar still with a capacity of 75 L/d produces desalinated water at a cost of 20 to 61 USD/m3 (Sharon et al., Reference Sharon, Prasad, Gowtham, Gopal and Aswin2025). The modified solar still investigated in the present study is capable of meeting the daily drinking water requirements of an adult. The still is scalable as per requirements to meet the drinking water demands of a family or a community, which can be verified through the above-discussed literature. This can be done by increasing the still area and or increasing the number of stills. The desalinated water productivity of the still can be further improved by waste heat energy adoption, use of solar thermal collectors and use of additional stages for recovering and reusing the latent heat for further water evaporation, making them suitable for large-scale applications.
Contribution to the United Nations Sustainable Development Goals
Solar energy technologies have an immense role in ratifying sustainable development (Maka and Alabid, Reference Maka and Alabid2022). Solar concentrating power technologies have been shown to directly contribute to the UN SDGs, specifically, SDG 7 (Affordable and Clean Energy), SDG 9 (Industry, Innovation and Infrastructure), SDG 11 (Sustainable Cities and Communities) and SDG 12 (Responsible Consumption and Production) (Yousef et al., Reference Yousef, Obaideen, Almallahi, Alajmi, Radwan, Al-Shihabi and Elgendi2024). The Mohammed bin Rashid Al Maktoum (MBR) Solar Park, at Seih Al Dahal, Dubai, which includes solar photovoltaics and concentrated solar thermal power generation systems, has been identified as contributing to SDG 15 (Life on Land) in addition to the previously mentioned goals (Obaideen et al., Reference Obaideen, AlMallahi, Alami, Ramadan, Abdelkareem, Shehata and Olabi2021). The modified solar still proposed and investigated for seawater desalination in this work can diversify freshwater supply sources and be fabricated with locally available materials in underdeveloped countries. Moreover, non-skilled communities may install, operate and maintain it with ease. These advantages make it one of the climate-resilient water supply options. Moreover, it can contribute to the UN SDG 6 (Clean Water and Sanitation) by helping to achieve the UN SDG 6 targets, namely Target 6.1 (safe and affordable drinking water), Target 6.3 (improve water quality, wastewater treatment and reuse), Target 6.4 (increase water-use efficiency and ensure freshwater supplies), Target 6.7 (expand water and sanitation support to developing countries) and Target 6.8 (support local engagement in water and sanitation management) (Globalgoals, 2025).
Limitations and scope for future work
The present work’s limitations include a number of experimental days (3 days each case), the use of a fixed water quantity (20 L) and the use of unoptimized gravel mass (8 kg). Future work can focus on overcoming these limitations by optimizing the gravel mass and feed water quantity, as well as conducting long-term year-round experiments to better understand the operational and maintenance issues in real field applications. Moreover, the development of a suitable thermodynamic model will aid in assessing the techno-enviro-economics of the modified solar still in various sites with different climatic conditions.
Conclusion
Experimental investigation on the modified basin solar still was successfully carried out, and the findings have been reported in detail. Incorporating internal reflectors, 8 kg gravel and 8 mL black ink in 20 L basin water improved the desalinated water productivity by 14.0 to 23.0% as compared to the conventional basin solar still. The modified basin solar still can generate 1,151 L of desalinated water per m2 in Visakhapatnam, India. The desalinated water produced has around 99.9% low salt concentration than the feed seawater. The cost of desalinated water dropped by about 10% to 40% for every five-year increase in the still’s lifetime. The modified basin solar still can produce 20 to 57 L of desalinated water per USD invested in it and has a finance payback time of about 3 to 5 years. Moreover, the CO2 emission potential and specific CO2 emission were about 18 tons and 12 g of CO2 per kg of desalinated water, respectively, for a lifetime of 25 years. The modified solar still can contribute to the UN SDGs, namely SDG 6 as well as the SDG targets 6.1, 6.3, 6.4, 6.7 and 6.8. Good performance, low-cost water production and significant decarbonization potential indicate the modified basin solar still to be a suitable sustainable desalination system for both household and small-scale decentralized water supply in underprivileged communities in off-grid coastal regions. Public acceptance of the modified solar still can be gained by demonstrating real-time pilot-scale plants and enhancing campaigns relating this technology to sustainability and water scarcity eradication.
Open peer review
To view the open peer review materials for this article, please visit http://doi.org/10.1017/wat.2026.10016.
Supplementary material
The supplementary material for this article can be found at http://doi.org/10.1017/wat.2026.10016.
Data availability statement
The data that support the findings of this study are available on request from the corresponding author [H. Sharon].
Acknowledgements
The authors thank the Cambridge Prisms: Water journal for inviting the corresponding author H. Sharon to submit an article and providing full APC waiver the for the submission.
Author contribution
Conceptualization: H.S.; Data Analysis: H.S., L.G., M.P.; Manuscript Preparation: H.S.,L.G.; Experimentation: H.S., L.G.; Formal Analysis: H.S., L.G.; Funding Acquisition: H.S.; Manuscript Preparation, Review and Editing: H.S.; Methodology: H.S.
Financial support
This research work was supported by the Science and Engineering Research Board (SERB), Department of Science and Technology (DST), Government of India, through Start-Up-Research Grant (SRG) (Grant Number: SRG/2023/000017); and the Institute Research Grant (IRG) (Grant Number: IIPE/DORD/IRG/027) of the Indian Institute of Petroleum and Energy (IIPE), Visakhapatnam, India.
Competing interests
The authors declare that there is no conflict of interest. The authors declare that they have no known competing financial interests or personal relationships that could have appeared to influence the work reported in this paper.
Nomenclature


 Open access
Comments
To
The Editorial Board
Cambridge Prisms: Water Journal
Dear Editorial Board Members,
Please find enclosed the research work titled: “Exploring the Performance, Water Quality and Enviro-Economic Aspects of Basin Solar Still Desalting Seawater with the Aid of Internal Reflectors, Gravel and Black Ink” to be submitted as an original revised article to your esteemed “Cambridge Prisms: Water Journal” for consideration of publication. The revised research work has been approved by all the authors and has never been published, or under consideration for publication elsewhere. The authors declare that there is no conflict of interest and no ethics have been violated in this work. The authors thank the journal team for inviting us to submit an article.
Sustainable production of potable water is one of the important goals set by the United Nations for 2030 to achieve a sustainable global community. In this work, the techno-enviro-economic aspects of solar still desalination system in three cases have been analyzed and reported in detail. The results of the work seem encouraging and justifies the potential of sustainable solar desalination in addressing water scarcity. Moreover, the work will be useful to researchers, policy makers, renewable energy advocates who are enthusiastic in addressing water scarcity in a sustainable way. The article has been explained in a detailed way.
The corresponding author acknowledges “Start-Up Research Grant” funding from the Science and Engineering Research Board (SERB), Department of Science and Technology (DST), Government of India (Grant No: SRG/2023/000017) and “Institute Research Grant” (Grant No: IIPE/DORD/IRG/027) from the Indian Institute of Petroleum and Energy, Visakhapatnam, India.
We hope that the editorial board will agree with the interest of the study. We are looking forward for your positive response.
Yours Sincerely,
H. Sharon
Assistant Professor
Indian Institute of Petroleum and Energy Visakhapatnam
Andhra Pradesh, India
Email: sharon.mec@iipe.ac.in; hsharon1987@gmail.com