


1. Introduction
Researchers use TwitterFootnote 1 data to explain a broad array of political phenomena. A substantial share of these political science studies involves the analysis of tweets that may contain subjects like violence, racism, or other controversial content (e.g., Keller et al. Reference Keller, Schoch, Stier and Yang2020; Kim Reference Kim2023; Mitts Reference Mitts2019), which I refer to as sensitive content. The replicationFootnote 2 of findings based on sensitive content is hampered by Twitter’s policy that prohibits sharing tweets instead of tweet IDs only and the resulting inability to crawl tweets that have been removed from the platform.Footnote 3 This becomes particularly problematic for sensitive content as these tweets lead to potential bias due to nonrandom patterns of tweet removal.
Why should researchers take a deeper look at these nonrandom removal patterns? Social science research relies on replicable datasets as the recent replication crisis in social sciences underlines (e.g., Dreber and Johannesson Reference Dreber and Johannesson2019; Key Reference Key2016; King Reference King2003; Laitin and Reich Reference Laitin and Reich2017). The discipline can confidently build upon and trust findings only if platforms like Twitter offer a representative, stable, and end-to-end replicable data source. The ability to fulfill these requirements may be hampered by the platform’s limitations: it prohibits crawling removed tweets and restricts publishing them along with academic papers.
Existing insightful studies on how tweets are removed are based on rather general datasets focusing on random or issue-related samples. Some find no alarming patterns for replicability (Pfeffer et al. Reference Pfeffer, Mooseder, Lasser, Hammer, Stritzel and Garcia2023; Zubiaga Reference Zubiaga2018). However, recent research on datasets yielded from the 1% Streaming Twitter API shows that emotionally charged or potentially controversial datasets behave differently than nonsensitive datasets (Elmas Reference Elmas2023). As sensitive datasets belong to very frequently studied Twitter content by political scientists, it is crucial to elaborate on how the removals of tweets impact research findings and datasets.
To investigate potential nonrandom removal patterns of tweets and how these affect replicating journal articles, I first conduct a systematic study of Twitter papers published in seven top political science journals. A high share of papers are based on sensitive content, and political scientists need a unified way to share their Twitter replication data. Recrawling the content of both nonsensitive and sensitive datasets implies that tweets belonging to the latter category are removed at a noticeably higher rate. To show the impact of these nonrandom removal patterns on sensitive dataset findings, I attempt to replicate central findings reported in a recent Political Science Research and Methods article by Kim (Reference Kim2023). The availability of only less than 20% compared to the original number of tweets suggests that such an incomplete sensitive dataset compromises both descriptive and statistical findings. To understand why tweets become unavailable, it helps aggregating whether the platform or the user is in charge of these tweet removals. The platform is largely responsible for over half of all tweet removal decisions in the case study dataset. However, the other half originates from direct user actions: Users can remove an individual tweet, protect their account to make tweets only visible to their followers, or deactivate their account.
Especially when using social media data, researchers should focus on two important questions: What are the reasons that previously available observations might become unavailable later, and what are the implications for replicating studies that rely on them?
This paper first emphasizes the high relevance of Twitter research to political science, particularly regarding sensitive datasets. Second, it raises awareness of how Twitter hampers replicable research and how this affects actual research findings. Disentangling underlying mechanisms of this data foundation allows for a more critical and evidence-driven process when deciding which data sources to leverage in political science studies. The article contributes to both existing threads of literature by taking a rather practical-oriented point of view, which is particularly valuable for scientists studying social media platforms. In light of the dynamic changes in these platforms, I draw attention to the challenges of replicating social media studies. The paper formulates potential solutions for accessing social media data in the post-API era to tackle these challenges, giving a perspective for making future social media research replicable.
2. From Replication Crisis to the Persistence of Twitter Data
Publishing replicable research is a fundamental pillar of science. Authors, as well as journals within political science and beyond, continuously work on the revision of policy standards, adding the replication of data and code to publications (Key Reference Key2016; King Reference King1995, Reference King2003; Laitin and Reich Reference Laitin and Reich2017). However, while these revisions address the ongoing replication crisis in the social sciences, they cannot solve it. I argue that a major reason is the need for more knowledge and awareness about datasets researchers use in their studies.
While code availability is essential to replicate findings, underlying data forms the deepest research layer. Diverse data sources, like surveys, experiments, and social media, can be subject to biases, errors, and methodological issues. This means that researchers must make complex decisions and assumptions influencing the data collection process. In the worst case, these decisions lead to inconsistent results due to incomplete replication data. The interaction between authors and journals is one opportunity to elaborate ways of circumventing replication issues (Laitin and Reich Reference Laitin and Reich2017). However, especially proprietary datasets, that is, limited access to original data and important ethical data privacy concerns further complicate the replication process.
Commercial social media platforms—Twitter in particular—are prominent drivers for studies leading to proprietary datasets. While there are many platforms, 39.70% of social media researchers use Twitter as a data source for their projects (Hemphill, Hedstrom, and Leonard Reference Hemphill, Hedstrom and Leonard2021). The frequent use of Twitter data by social scientists is related to the platform, presenting an ideal combination of size, international reach, and—compared with other social media platforms—good data accessibility making it the preferred platform for social media research (Steinert-Threlkeld Reference Steinert-Threlkeld2018). Another aspect is that in 2020 Twitter rebuilt its API (Twitter 2020) to allow access to its full tweet archive for academic purposes, which, however, got suspended in its known form in June 2023.
On the one hand, researchers tremendously benefited from the suspended API, and developing solutions that allow researchers to continue working on Twitter studies is important as data from this platform is part of much insightful research. On the other hand, the platform’s policies bound scientists. The major technical limitation is the inability to crawl removed tweets by their unique identifier. Researchers cannot replicate findings based on the complete set of tweets as it is only allowed to publish the ID of a tweet but not its textual content—leading to unavailable tweets when trying to recrawl tweet IDs.Footnote 4
The attrition rate as an established metric for unavailable tweets helps to understand the process of and its impact on representational aspects of a dataset (Almuhimedi et al. Reference Almuhimedi, Wilson, Liu, Sadeh and Acquisti2013; Elmas Reference Elmas2023; Hai and Fu Reference Hai and Fu2015; Noonan Reference Noonan2022; Pfeffer et al. Reference Pfeffer, Mooseder, Lasser, Hammer, Stritzel and Garcia2023; Zubiaga Reference Zubiaga2018). While studies are analyzing the attrition rate, unfortunately, many of the datasets studied represent Twitter as a whole but do not distinguish between specific issue domains and sentiment types of tweets that are of high interest in political science. Other work on different issue domains focuses on rather general keyword-generated datasets between 2012 and 2016. Recollected datasets are still representative to a large extent in terms of their textual content but are not stable on metadata (Zubiaga Reference Zubiaga2018). Metadata involves further descriptive information about a tweet or user, such as the number of likes or retweets. However, as metadata can be published without violating the policies of Twitter, at least this aspect should play only a minor role in replication issues.
Previous studies argue that even though the recrawling ratio of tweets may drop below 70%, the content of tweets in their datasets is still representative. However, looking at the sentiment of tweets might explain the underlying mechanism of tweet removals more comprehensively. This is important as sentiment and other latent text features are crucial for many projects. Recrawled controversial datasets show considerable differences from the original ones in various metrics relevant to political scientists (Elmas Reference Elmas2023). These include shifts in political orientation, trending topics, and harmful content. The difference between the share of collectible tweets at a later time and the original dataset is even larger for controversial datasets in particular. The reason that a tweet in a sensitive dataset is not available for recollection anymore is mainly due to account and tweet suspensions initiated by Twitter itself (e.g., due to violating policies) which holds specifically for controversial datasets (Elmas Reference Elmas2023). These indicators for sensitive datasets suggest that one has to assume nonrandom removal patterns leading to incomplete replication datasets and, thus, inconsistent findings.
An emerging body of research examines extreme sentiment expressed in tweets (e.g., Alrababah et al. Reference Alrababah, Marble, Mousa and Siegel2021; Kim Reference Kim2023; Muchlinski et al. Reference Muchlinski, Yang, Birch, Macdonald and Ounis2021). However, it remains unclear how Twitter researchers address the subsequent issue of replicability in their replication archives. Furthermore, no prior studies have investigated the implications of replicating the findings of published political science studies and real-world datasets that focus on sensitive content. It is necessary to measure tweet attrition more fine-grained when judging replicability of studies containing sensitive datasets.
3. Tweet Sharing and Mortality in Political Science Studies
How do researchers share Twitter data? In this section, I outline both how researchers share their Twitter datasets and examine nonrandom deletion patterns dependent on whether a dataset is sensitive or nonsensitive.
3.1. How the Discipline Shares Tweets
In some cases, researchers may be allowed to release the entire dataset (e.g., Twitter itself offers a selection of publicly available datasets), but in others, restrictions imposed by national laws and social media platforms—such as the right to be forgotten—try to prevent this. In the light of this, researchers handle the data-sharing process in various ways. Moreover, different requirements, replication policies, university restrictions through the Institutional Review Board, and journal integrity checks lead to manifold decisions during the data-sharing process.
I conduct an empirical analysis crawling all 151 papers that mention the keyword “Twitter” published between January 2015 and September 2022 in seven major political science journals AJPS, APSR, BJPS, JOP, PA, PolComm, and PSRM.Footnote 5 I keep only those that systematically analyze the content of tweets, as the textual content is the most problematic part of a typical Twitter dataset to share. Finally, I annotate the remaining dataset of 50 papers with additional information on the topic of the Twitter dataset.
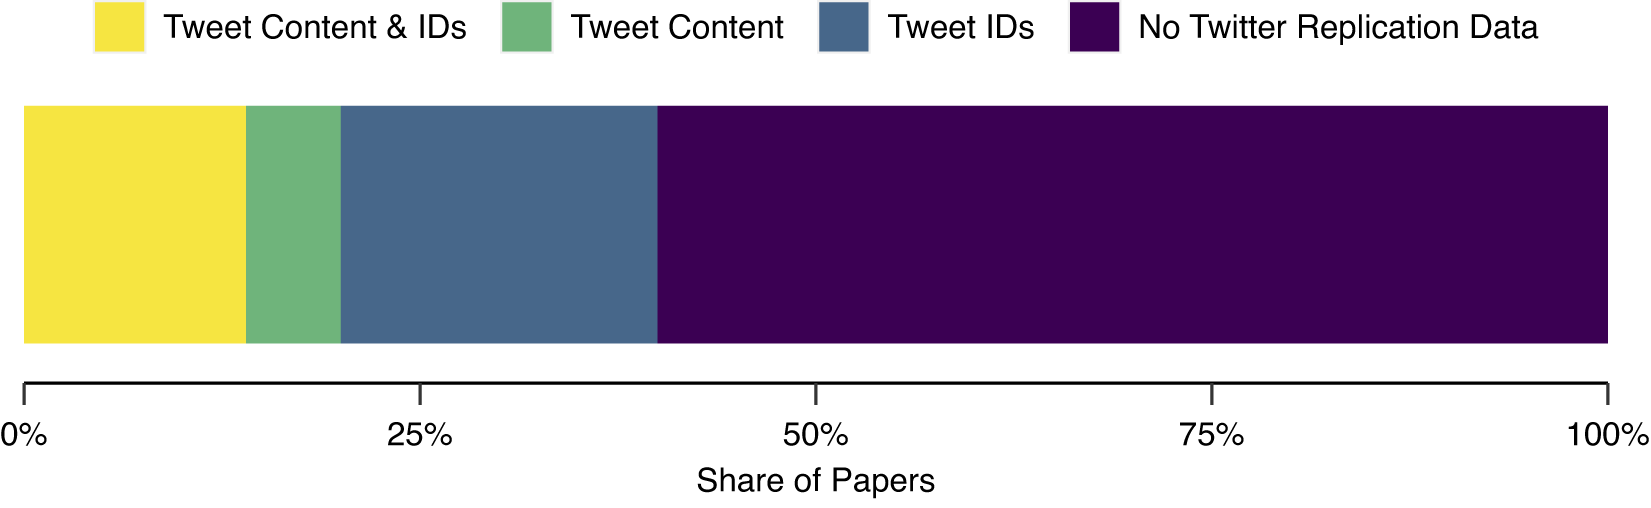
Of these papers, 30.00% study sensitive Twitter content.Footnote 6 Figure 1 shows that in general, less than half of all papers publish either tweet IDs, the content of the tweets, or both. A proportion of 20.00% of the replication archives contains tweet IDs only, which I assume, in many cases, might be insufficient for successful end-to-end replication. Furthermore, a high percentage of papers (60.00%) share neither tweet IDs nor content, which makes a replication impossible. Surprisingly, almost a fourth share the raw textual content of tweets which technically would violate Twitter policies but is beneficial for the end-to-end replicability of Twitter research. However, this is the only way of replicating Twitter studies without paying the current fees for using the Twitter API and recrawling still available tweets from their IDs.
Different ways of how political scientists share Twitter datasets in replication archives among all 50 papers analyzing the content of tweets in seven major political science journals.
3.2. Nonrandom Deletion Patterns of Sensitive Datasets
Previous studies show that one should expect differences in the availability of tweets when looking at sensitive and nonsensitive datasets in isolation. The overall substantial share of 30.00% of sensitive Twitter datasets suggests that there are enough replication datasets to study available tweets in both dataset types. To analyze the decay of tweets dependent on the dataset type, I can rely on the fraction of replication archives sharing at least their tweet IDs. The literature overview results in 16 papersFootnote 7 sharing tweet IDs. Ten of these papers work with nonsensitive datasets, representing 28.57% of all datasets annotated as nonsensitive. In contrast, six papers utilize sensitive datasets, comprising 40.00% of all datasets classified as sensitive.
Figure 2 depicts the proportion of accessible tweets of these papers.Footnote 8 Indeed, the descriptive analysis shows clear differences between both types of tweets. In a random sample of 10,000 tweets per dataset, an average of 78.34% of nonsensitive dataset tweets remains accessible, starkly contrasting to only 36.02% in sensitive datasets.Footnote 9 Within Twitter replication datasets, it appears that datasets marked as sensitive have a higher chance of mortality.
Availability rate of a random sample of up to 10,000 tweets from each of the 16 sensitive and nonsensitive paper datasets which shared at least their tweet IDs. Retrieving all tweets was attempted in cases where the original dataset contained fewer than 10,000 tweets. Temporão et al. (Reference Temporão, Kerckhove, van Der Linden, Dufresne and Hendrickx2018) shared user IDs instead of tweet IDs, as the authors crawled all users’ tweets. Thus, I checked the availability of these user accounts instead of tweets. Data was recrawled on May 17, 2023.
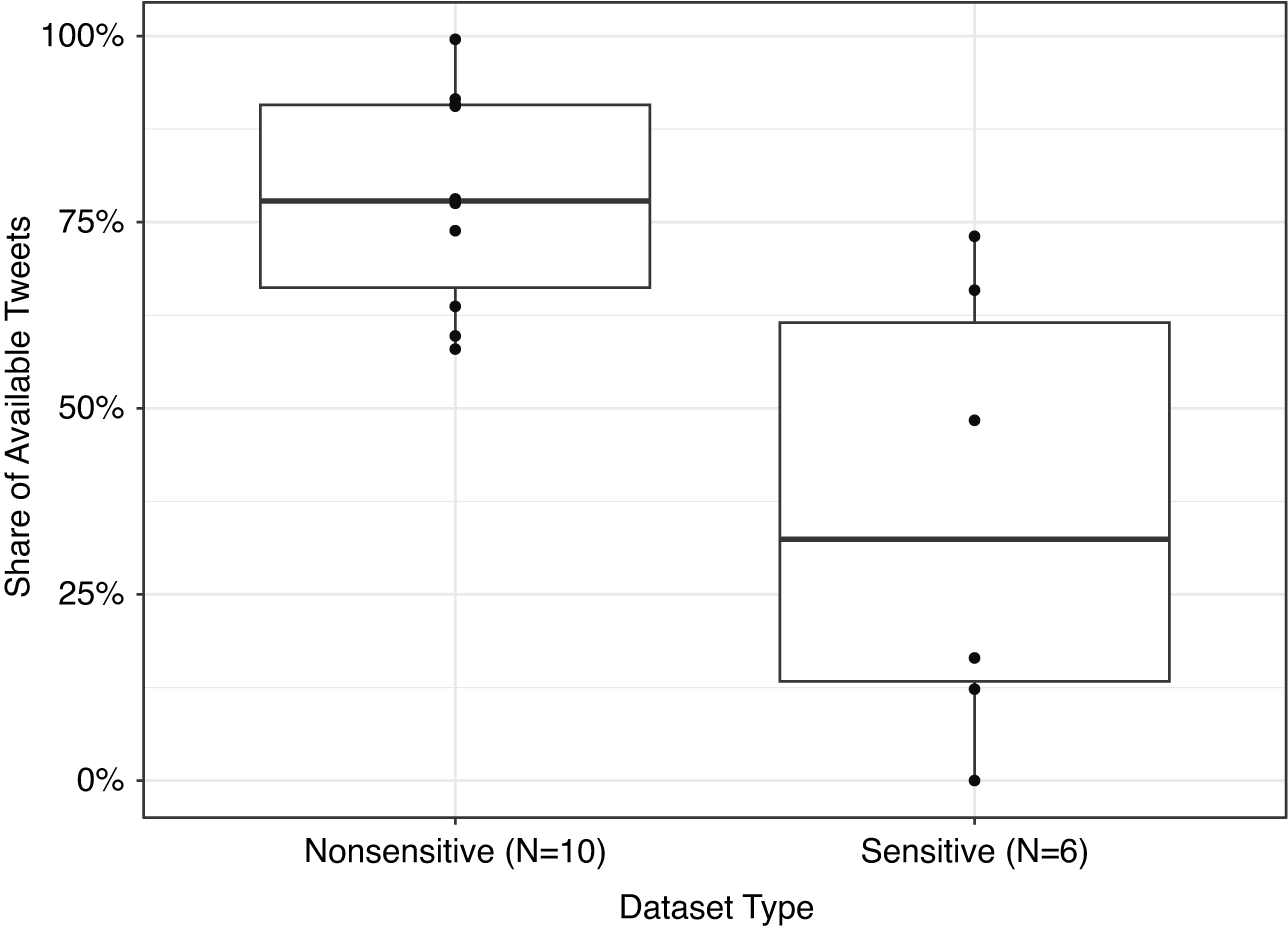
Relying on a data basis of more than three quarters of still available tweets in nonsensitive datasets sounds convincing to initiate a replication attempt. However, replicating studies could become challenging with only a third of the original tweets retrievable in sensitive datasets and without knowledge about the decision-making process of those removing the data. It is important to note that this issue is not confined solely to sensitive datasets: many nonsensitive datasets also include sensitive tweets. Recrawled versions of these published datasets might also generate bias to a certain extent, as sensitive tweets are more likely to be removed—and thus become unavailable to researchers.
While the retrieval rate of tweets from an MP or voters’ opinions on policies on Twitter appears to be closer to the original population (i.e., nonsensitive dataset), hate speech or extreme ideological datasets endure a significant loss in tweets (i.e., sensitive dataset). This bias must be highlighted as it is critical for replication. A high share of tweet removals is not explicitly caused by the authors of tweets (Almuhimedi et al. Reference Almuhimedi, Wilson, Liu, Sadeh and Acquisti2013). Letting users report tweets and accounts certainly impacts the platform’s decision to remove them. However, Twitter’s content moderation takes the final decision on whether to remove tweets and suspend accounts or keep them on Twitter (Alizadeh et al. Reference Alizadeh, Gilardi, Hoes, Klüser, Kubli and Marchal2022; Pierri, Luceri, and Ferrara Reference Pierri, Luceri and Ferrara2022). In result, the platform introduces a nontransparent layer of nonrandom tweet mortality directly impacting the data basis.
4. Case Study: Implications for Replicating Sensitive Twitter Studies
Sensitive datasets suffer from a notably higher loss of tweets than nonsensitive datasets, affecting replication. Kim (Reference Kim2023) is one example of a study that works with a sensitive dataset. The paper demonstrates how violent tweets surrounding the 2020 U.S. Presidential election reflect the real world and spotlights the groups targeted by violent content.Footnote 10
There are several reasons for considering this study for replication. Among all sensitive Twitter studies sharing tweet IDs, this paper does not only analyze the well-researched U.S. election in 2020 on social media but combines three methodological and datawise characteristics well-suited for an insightful replication. First, it studies violent tweets and compares them with nonviolent ones, which supports analyzing differences between the behavior across both dataset types. Second, it studies rather aggregated data and provides a longitudinal perspective. Third, the replication archive offers much data beyond tweet IDs (e.g., document-frequency matrices or hashtag frequencies), which supports comparing the original findings with the replication. Other potential replication candidates reflect these selection criteria only partially.Footnote 11
The study’s initial population of more than 300 million tweet IDs processed in a data collection pipeline is not publicly available. However, the replication archive allows access to all tweet IDs classified by the article’s deep-learning algorithm as containing violent content.Footnote 12 This set of IDs ranges from September 23, 2020 to January 8, 2021 and consists of 215,923 unique tweet IDs. As of November 15, 2022, there are only 35,552 (16.47%) of the original number of tweets retrievable via the API.Footnote 13 The reported values are even lower than the numbers for other controversial datasets (Elmas Reference Elmas2023), thus underlining the evidence that sensitive tweet removals are not random.
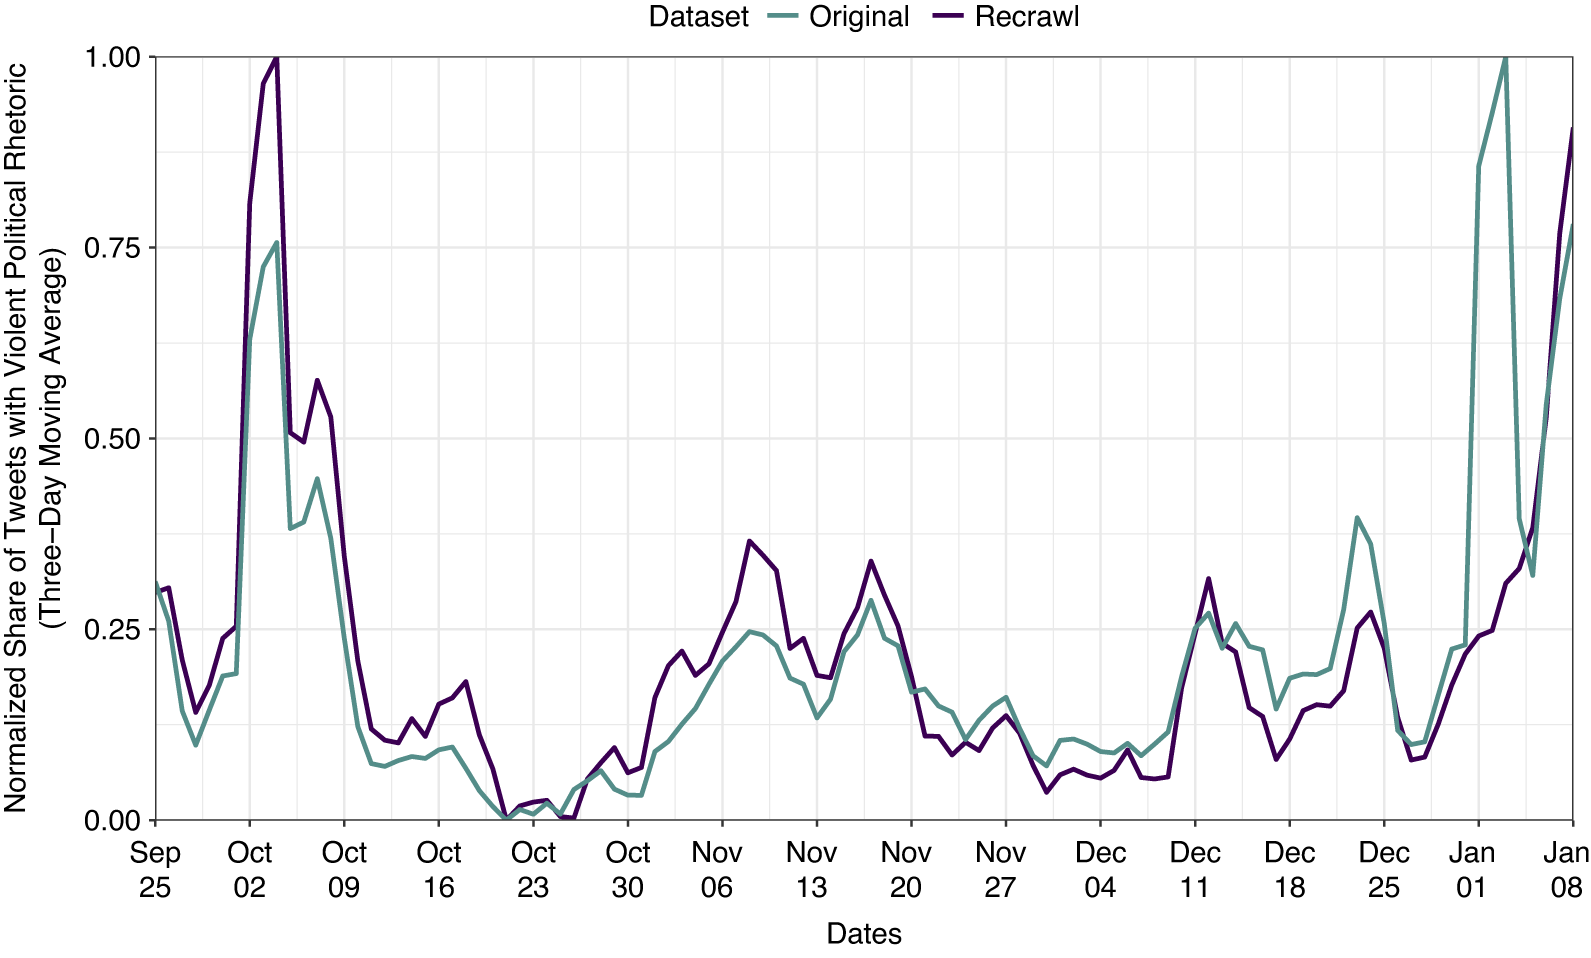
Timeline comparison of normalized proportion of violent political rhetoric tweets during the U.S. election 2020 for both the original and recrawled datasets (replication of Kim Reference Kim2023). Proportions are based on aggregated information on 215,923 original and 35,552 recrawled tweets.
What are the learnings from unavailable tweets and their authors? Twitter’s reasons for unavailable tweets are manifold. The compliance endpoint of the Twitter V2 API (Twitter 2021) helps examine them based on users tweeting violent content.Footnote 14 Over half of the tweets (52.90%) in the dataset are removed due to user suspensions. It is important to note that these decisions are taken by Twitter, for example, their systematic content moderation based on controversial trends or hashtags, or user reports of a particular tweet or account. Actions originating on the user side—deleted, protected, or deactivated accounts—are responsible for the remaining unavailable tweets. The Supplementary Material depicts detailed proportions in Figure A.2.
Compared with the original data, essential aspects of the recrawled data are no longer representative. Even without access to the full data, I can still rely on a random subset of 5,000 violent tweets aggregated in a document-frequency matrix openly distributed by the author. I approach the representativity of different textual features compared with an equally sized random sample of the recrawled violent tweets using Welch’s t-test (Zubiaga Reference Zubiaga2018). The basis for the analysis is the word frequencies independently generated from both samples. The t-test results show that the 95% confidence intervals for textual content and hashtags do not contain zero, indicating that these features are different in both datasets.Footnote 15 This is not the case for user mentions that seem representative based on the random sample. However, this does not ensure that findings related to specific groups of user mentions remain unaffected by replication issues. The metric only looks at the frequency of all user mentions in both datasets and by that, gives an overall picture, potentially overlooking group-specific dynamics.
4.1. Replication: Descriptive Analysis
Describing social media datasets frequently involves looking at how data change over time. Figure 3 (based on Figure 3 in Kim Reference Kim2023) shows peaks of tweet counts containing violent political rhetoric over time in the original dataset (teal line) and the recrawl (purple line). It becomes clear that the curve does not behave as expected when assuming a random removal of tweets. This is especially highlighted through early January 2021 during the power transition after the election and when the Capitol Riot happened. While one of the key findings of the author is to demonstrate that offline events are mirrored on social media, the recrawled data behave differently and fail to mirror the original data in their most important aspects. Accordingly, nonrandom tweet removals hamper the longitudinal representation of the dataset and the findings based on it.
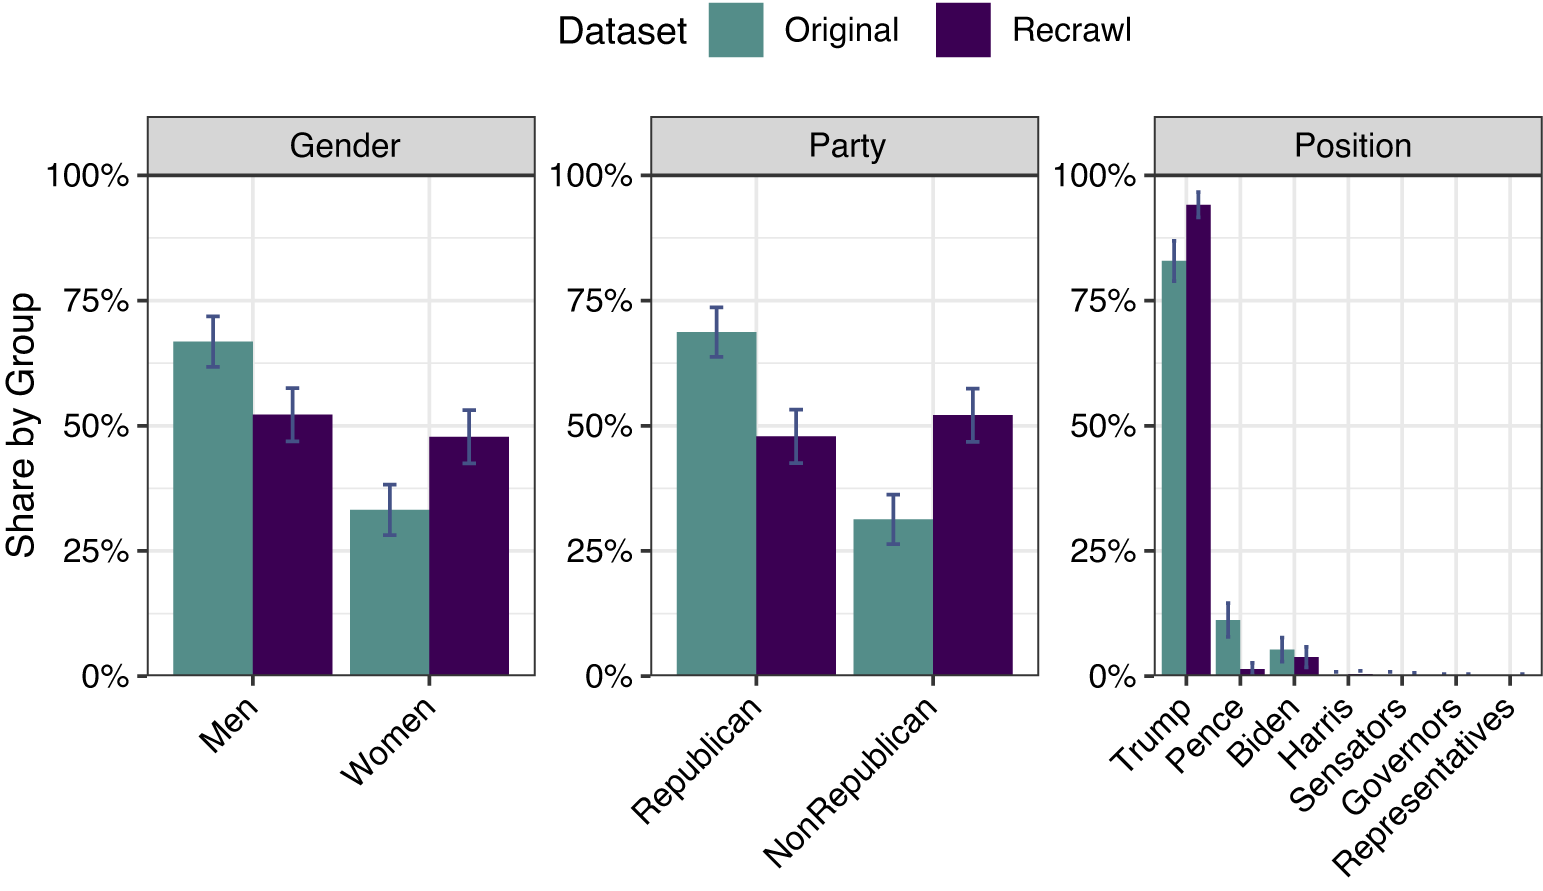
Comparative distribution of mean mentions of accounts in tweets containing violent political rhetoric by gender, party, and position in the original and recrawled datasets. Uncertainty displays the 95% confidence interval of each group. Proportions are based on aggregated information on 215,923 original and 35,552 recrawled tweets.
Hashtags are a core feature on Twitter and are vital to spreading ideas and sparking conversations. Therefore, it is crucial to also examine Kim’s study of frequent hashtags. Reusing Table 2 in the original paper published with hashtag frequencies, I retrieve the original counts of hashtags. As one would expect, all counts are much lower in the recrawled dataset than in the original one. However, the sorting of hashtags also differs clearly between the datasets, which is just another visual argument that the retrieved tweets do not represent the same distribution of hashtags as the original dataset. Most importantly, the top three most frequent hashtags in the original dataset (#wethepeople, #1, and #pencecard) are either absent from the revised top ranking or are indistinguishable from other hashtags due to their low count. Table A.3 in the Supplementary Material reports the usage of hashtags in violent tweets during the complete election period.
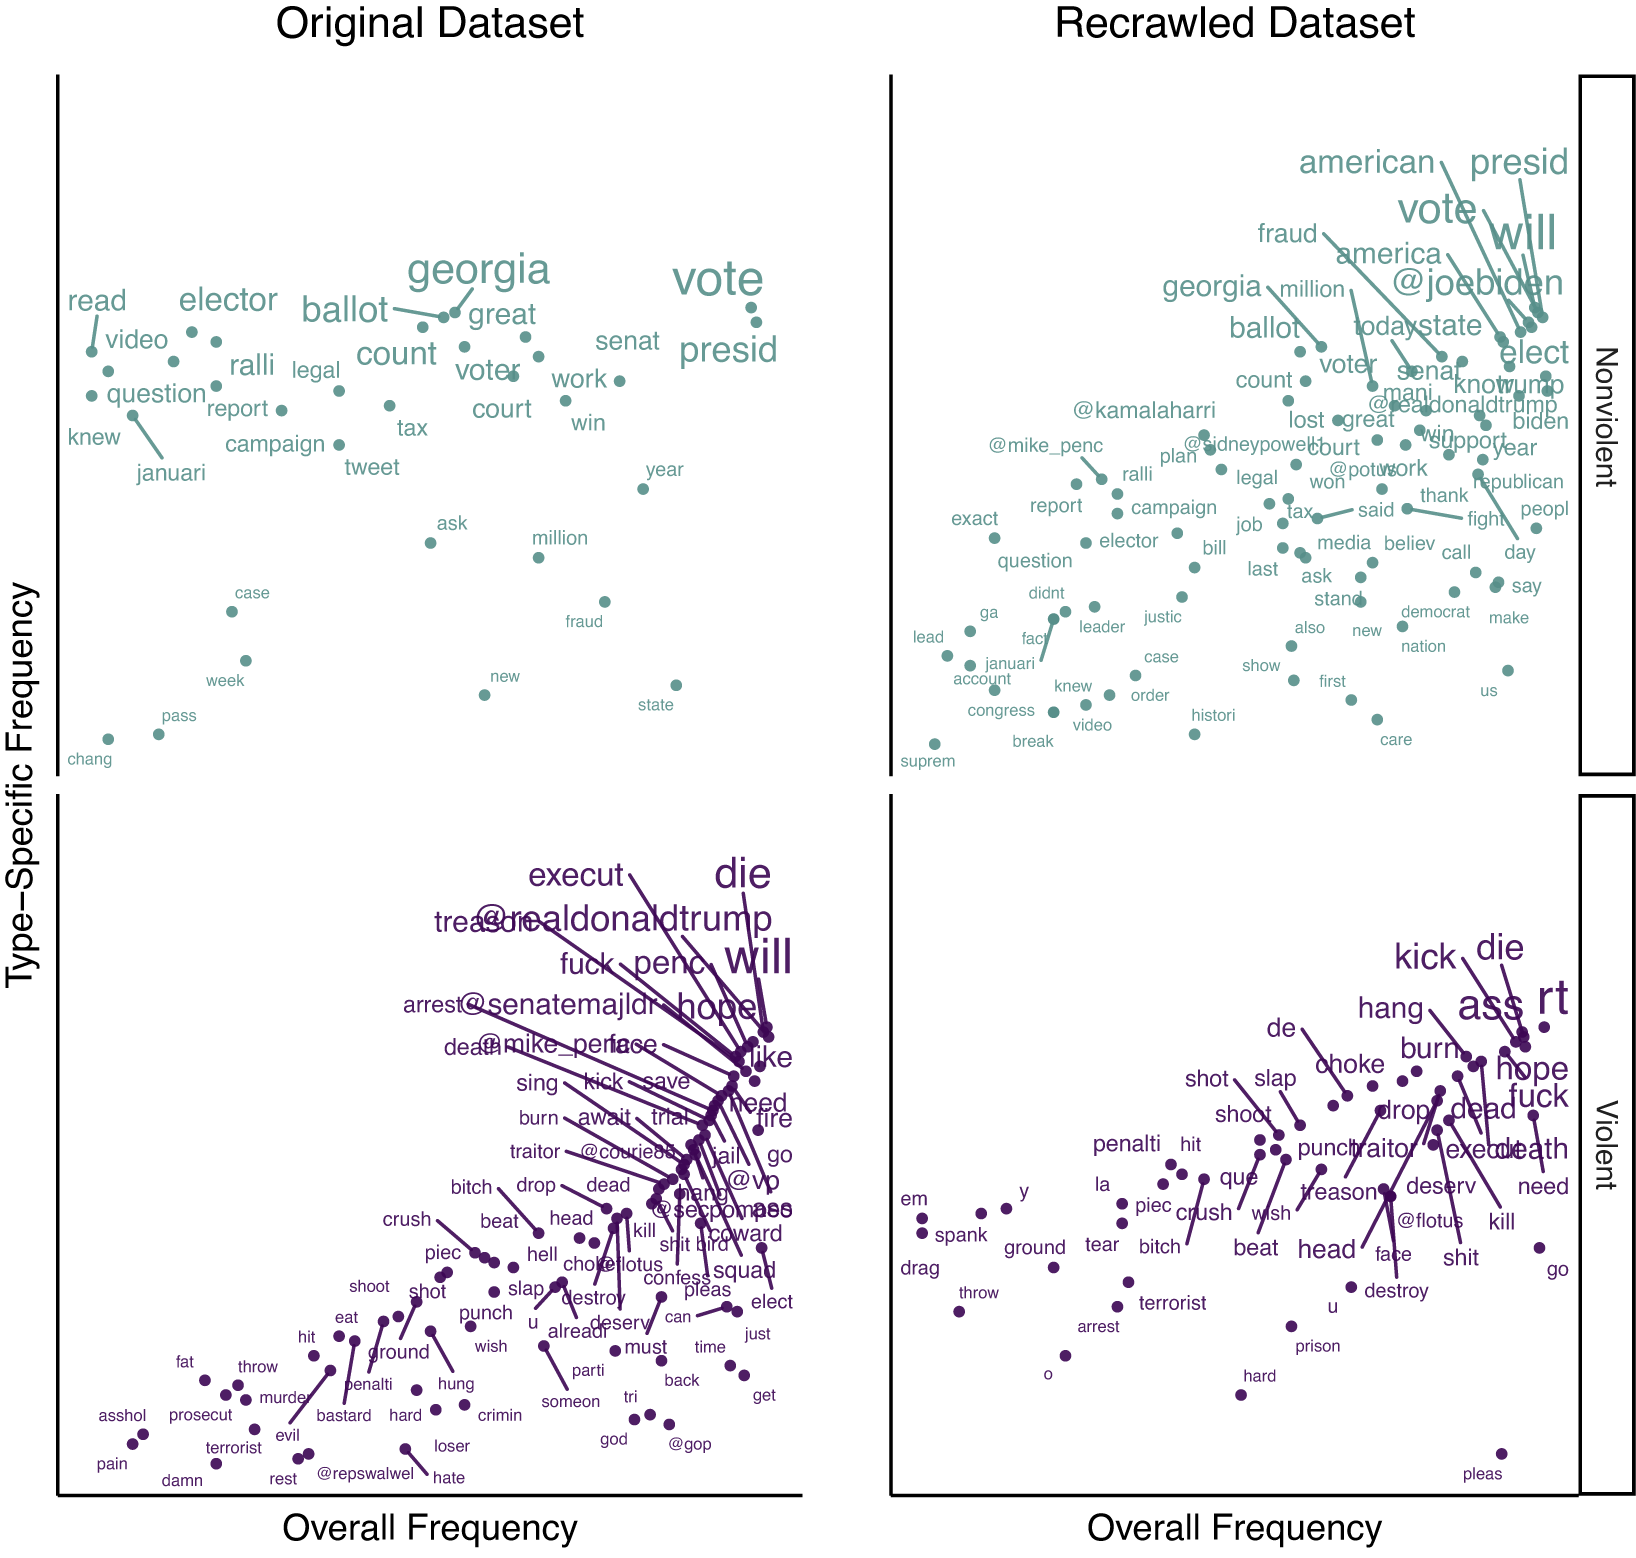
Comparison of terms grouped by violent (teal) and nonviolent (purple) tweets (a random sample of 5,000 tweets for each group) for both the original (left plot and upper-right panel) and the recrawled datasets (bottom-right panel). The x-axis shows the overall frequency of words in the dataset. The y-axis and the size of a word represent the frequency of words within a group. Following Kim (Reference Kim2023), several preprocessing techniques, such as lowercasing, stopword removal, and stemming, were applied to the tweets’ content.
While hashtags show discrepancies when being recrawled, how are different groups represented in the recrawled dataset? Discussions on Twitter occur between different actors. Utilizing the actor’s characteristics allows assigning them to groups. Only if the distribution across these groups remains consistent during replication, should further analysis consider their utilization. In Table 3 in the original paper, Kim (Reference Kim2023) summarizes the count of account mentions in violent political rhetoric and nonviolent tweets into three groups (Gender, party, and position). Reusing the author’s proposed group assignment allows for calculating the recrawled dataset’s proportions. Both proportions are depicted in Figure 4. The most important aspect is not necessarily the raw numbers but the proportions within the grouping characteristics. The original dataset has a disproportionate distribution of political party (69% Republican, 31% non-Republican) and gender (33% Women, 67% Men). However, in the recrawled set of tweets, party and gender are distributed evenly. While Trump remains the leader without substantial variation in the position group, the proportion of Pence-related user mentions shrinks close to zero. The findings demonstrate nonrandom removal patterns where tweets referring to women and Republicans are more likely to be removed than those referencing men and non-Republicans.
4.2. Replication: Statistical Model Findings
Knowing that the tweet content of both datasets is not representative anymore is one characteristic of irretrievable violent tweets. What are the implications for the overall distribution of words? In Figure 2 in their original paper, Kim focuses on a frequency comparison of words between and within violent and nonviolent tweets based on the Fightin’ Words algorithm (Monroe, Colaresi, and Quinn Reference Monroe, Colaresi and Quinn2008). The algorithm measures differences in word occurrences across groups by reducing (or increasing) the importance of very frequent (or infrequent) words.Footnote 16
Figure 5 replicates the results for both datasets. The original analysis (left plot) reveals that violent tweets (lower panel) very often mention political actors like Donald Trump, Mike Pence, and Mike Pompeo. Nonviolent tweets (upper-left panel) do not show this trend. The recrawled dataset shows only one user mention (Michelle Obama) in the most significant words of the recrawled violent tweets. Beyond that, her prominence is somewhat limited to violent tweets, according to the Fightin’ Words algorithm. Comparing recrawled violent tweets with the set of nonviolent frequencies reveals that the recrawled dataset characterizes itself by many user mentions in nonviolent tweets. Furthermore, even nondirect mentions and party names appear frequently in the nonviolent keywords (such as Trump, Biden, Republican, or Democrat). This comparison indicates a significant shift in the behavior of both groups between the original and recrawled datasets, reversing the original face validity outcome.
What are the implications of nonreplicable descriptive findings on statistical models? The author calculates five negative binomial regressions to estimate the number of mentions of a political account in violent tweets (Table 4 in the original paper). The different model specifications include the position of a political account (representative, governor, or senator), whether an account represents a woman, a party dummy (Republican or nonRepublican), as well as its logged follower count.Footnote 17
Comparing the original model 5 with regressions using the recrawled dataset (see Figure 6) reveals that one of the paper’s key findings of having more women targeted by violent tweets does not hold anymore. The estimate of the effect is close to zero, and the coefficient’s 95% confidence interval of the recrawled model widely includes zero, too. In the recrawled data, it is still most likely that Republicans find more mentions in violent tweets. However, the new parameter estimate is nearly 10% smaller than in the original model. In a similar vein, the Senators’ position estimate shrinks to only 11% of its original size. In addition to that, the Governors’ parameter estimate reduces to half of its original value.
Comparison of regression model coefficients based on the original, recrawled, and resampled dataset with their 95% confidence intervals. The resampled regression model is a simulation based on rebalanced party and gender ratios following the original dataset distributions.
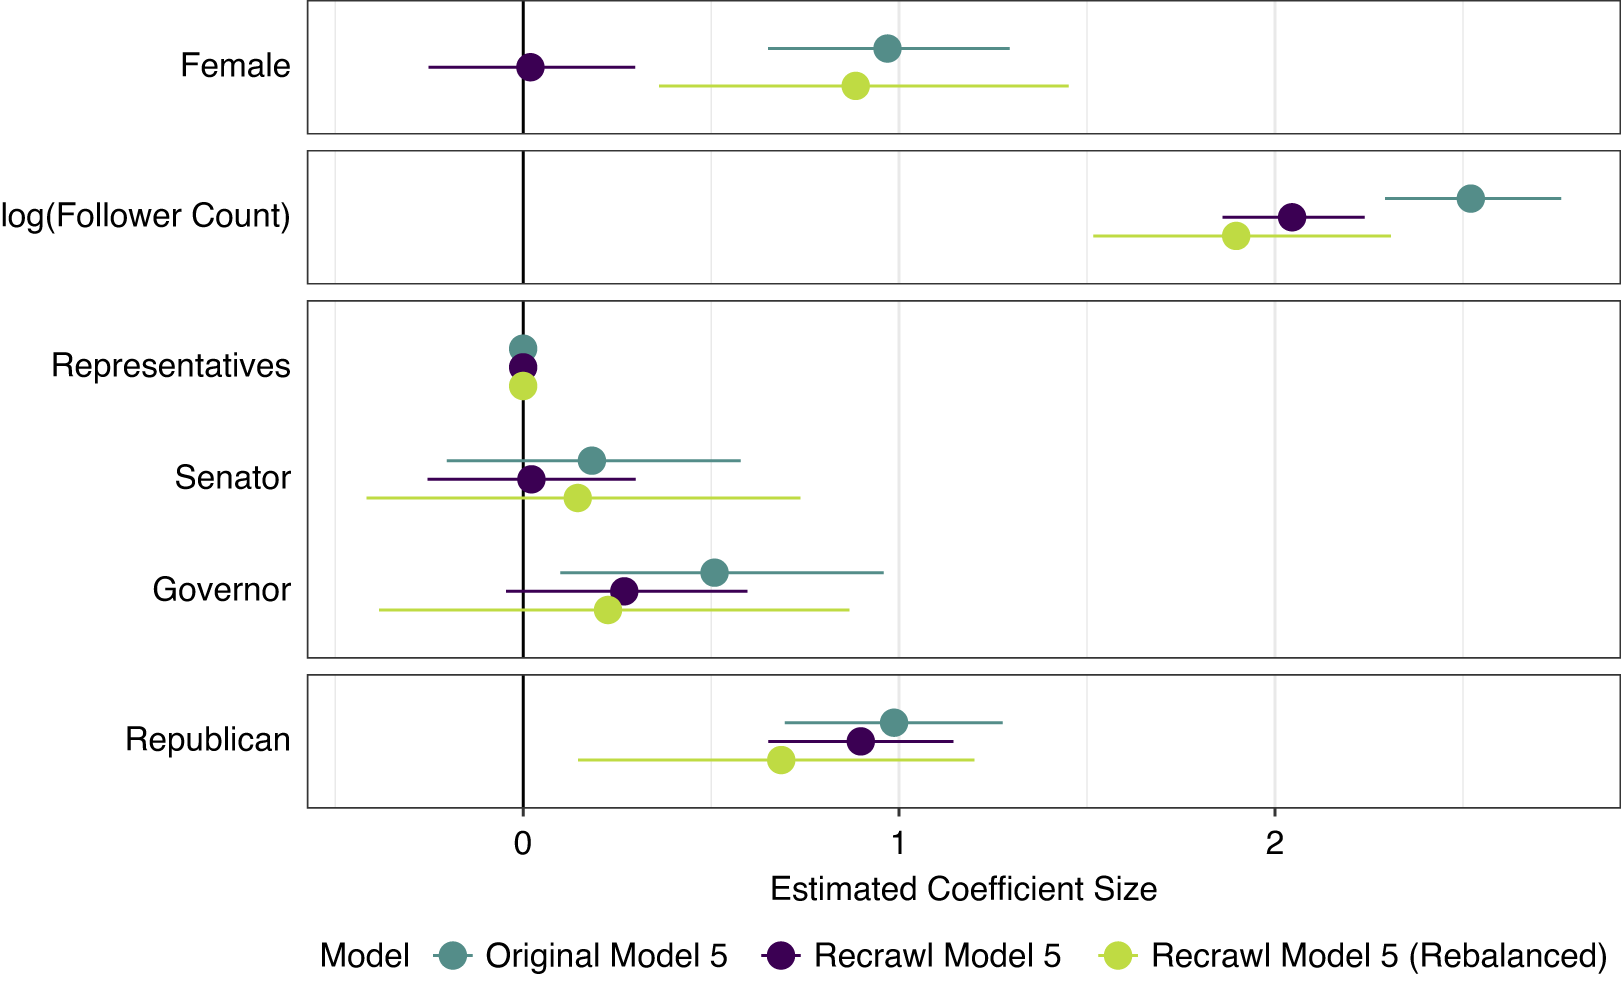
The recrawled regression model displays differing results, especially in the effect of gender. What patterns in the recrawled dataset drive these results? I leverage the original distribution of party and gender to resample the distribution of recrawled tweets. The redistributed dataset allows me to calculate another regression model. Simulating the resampling and reestimation process of the model 1,000 times reduces randomness and generates uncertainty intervals in the resulting coefficients. The averaged coefficients and their lowest/highest 95% confidence intervals are shown in the third regression level (lime color). While all of their confidence intervals are much wider than the original and recrawled data, the rebalanced Female coefficient shows no significant difference from the original one according to the 95% confidence interval. Correspondingly, the rebalanced regression model depicts important removal patterns on the differing group shares displayed in Figure 4. The results indicate that, most likely, tweets mentioning male Republicans were more often removed from the dataset than tweets mentioning female Republicans or male or female Democrats.
Twitter’s policies and API dismantling hinder the replication of research studies that involve the content of tweets, especially those containing sensitive content. While there are further findings in the original paper focusing on the follower network rather than the textual content, replicating the text-related steps of the study gives an idea of the implications of nonrandom tweet removal within sensitive datasets as several groups (of words, hashtags, and political actors) are no longer equally represented in the recrawled dataset compared to the original one. This unequal representation leads to descriptive and statistical model findings that differ considerably from the published figures. One could expect similar behavior on other sensitive Twitter datasets used by researchers within the discipline and beyond.
5. Data Access in the Post-API Era
While the replication issues related to Kim (Reference Kim2023) seem one case out of many, it highlights the issues inherent in replicating social media data studies. Following the suspension of Twitter’s Academic Research Track API, many researchers avoid studying Twitter or are forced to cancel their ongoing Twitter projects (Davidson et al. Reference Davidson2023). Although Twitter still offers an API, it comes for 5,000 USD/month (Twitter 2023), which is not affordable for most researchers. Even if some can afford the new subscription plans, this does not solve the issue of non-replicable research, as the conditions concerning Twitter’s restrictive data-sharing policies remain unchanged.
How can the research community respond effectively? Exploring ways to circumvent the restrictive behavior of commercial platforms and making work less dependent on their policies seems promising. One possible way out could be data donations (Davidson et al. Reference Davidson2023). Social media users can, by law, request a full copy of their data or install an app that collects it in real time and donate it for research. While this is a straightforward procedure that could be handled by centrally organized data donation platforms, researchers can only analyze the data of users they reach and those who consent. For studies that require analyzing sensitive datasets, researchers often cannot ask users for their consent. In these situations, a combination of approaches might lead to a promising way out: Public institutions can use their responsibility to archive data of public interest, including social media data. For example, when the Academic Research Track API was still available, the German National Library launched a data donation initiative to archive all German tweets. As proposed in Davidson et al. (Reference Davidson2023), automatic crawlers could update these archives without needing an API. However, one must carefully evaluate this step, as crawling social media platforms might be a legal gray zone. The library intends to make its collected data available “within the German National Library’s infrastructure.”Footnote 18
However, even if researchers have partial access to the data within institutions, Twitter’s policy still prohibits researchers from directly sharing the raw content of tweets. Under these circumstances, sharing the tweets’ one-way hashed content could be an option. One-way hash algorithms are designed to securely transform the original data into an encrypted version (Naor and Yung Reference Naor and Yung1989). The one-way aspect of this well-established computer science technique prevents rehydrating tweets’ raw content. Instead, a corresponding replication pipeline can reproduce the original results using the encrypted data (Bost et al. Reference Bost, Popa, Tu and Goldwasser2014). This could act as proof for reproducible research but would not replace direct access to social media data archives—still, though, hindering transparent replication.
Ultimately, academic journals are also responsible for ensuring a smooth and reliable review and replication process. Paying more attention to the origin and characteristics of data during review leads to higher-quality replication processes. This goes hand in hand with developing guidelines around the types of data that can be legally shared for scientific purposes.
In situations when none of the above approaches lead to replicable research, the discipline should broaden its scope to foster other data sources. While social media platforms provide a wealth of data, there are research questions about where alternative sources might lead to reliable and replicable results. Alternative sources especially include publicly available databases from institutional organizations. As a result, this leads to a diversification of data sources and less dependence on commercial platforms.
6. Conclusion
Even though Twitter experienced a lot of ups and downs due to the takeover of Elon Musk in October 2022, it still holds valuable data, which certainly keeps the platform essential for studying a wide range of social phenomena. While 75.00% of published Twitter studies in seven major political science journals might be potentially impeded by difficulties replicating the results due to missing replication data, this is especially alarming for 30.00% of all papers analyzing sensitive Twitter content. Based on tweet IDs in their replication archives, I demonstrate that only a third of the tweets in sensitive datasets are still available through the Twitter API. As this share is substantially lower than it is for nonsensitive datasets, it amplifies the worthiness and importance of understanding the tweet removal process on a more fine-grained level. In most cases, removed tweets do not result from an explicit user action but the final decision of Twitter’s content moderation department. Hence, nonrandom tweet removal is not a direct phenomenon controlled by the users. Instead, it is Twitter itself that potentially affects the outcomes of replicating political science studies. I replicate some of the central findings of Kim (Reference Kim2023) based on a recrawled sensitive dataset established on tweets to illustrate. The case study suggests that irretrievable tweets might not only lead to a drastically reduced corpus size of less than 20.00% compared with the original dataset, but also nonrandom tweet mortality undermines some of the paper’s fundamental descriptive and statistical model findings.
There is no easily feasible option for crawling tweets via the official Twitter API, making these results even more critical for replicable research. Foreseeing upcoming changes in the API is impossible, so the discipline needs to find alternatives to tackle both challenges: unavailable tweets due to removal and inaccessible tweets due to extensive API fees. This article presents a first outlook on data access possibilities in the post-API era, ranging from data donation to institutional obligations. Although platforms other than Twitter have not yet started to apply extensive fees for scientifically using their API, the issues and potential solutions raised in this paper are likely to also apply to other commercial social media platforms like TikTok, Instagram, or Facebook. This holds especially in light of recent changes to their APIs, which raise barriers to free, open, and easily replicable academic research. To give one example, TikTok tries to force users of their research API to update their collected dataset at least every 15 days to remove data points that were previously available but have since become unavailable (TikTok 2023)—and by that favoring a compromised replication instead of encouraging replicable research.
Acknowledgements
Christian Arnold, Brian Boyle, Christian Stecker, and the COMPTEXT 2023 audience provided very insightful comments on earlier versions of the manuscript. I thank six anonymous reviewers and the editor for their extremely helpful feedback. I also thank Leon Siefken for his excellent research assistance.
Funding Statement
There are no funding sources to report for this article.
Competing Interests
The authors have no competing interest to declare.
Data Availability Statement
Replication code for this article has been published in Code Ocean, a computational reprod ucibility platform that enables users to run the code and can be viewed interactively at https://doi.org/10.24433/CO.1624743.v3. A preservation copy of the same code and data can also be accessed via Harvard Dataverse at https://doi.org/10.7910/DVN/UUDNM7 (Küpfer Reference Küpfer2024a, Reference Küpfer2024b).
Supplementary Material
For supplementary material accompanying this paper, please visit https://doi.org/10.1017/pan.2024.7.


 Open access