


1 Introduction
Elites often preserve power in ethnically diverse societies by securing the support of in-group non-elites.Footnote 1 In-group support—whether genuine, co-opted, or coerced—is critical to elites’ survival because it protects the regime from broad-based uprisingsFootnote 2 and it provides legitimate votes at election time.Footnote 3 White elites in the modern U.S. have consolidated in-group votes by manipulating racial messaging and policies.Footnote 4 Sometimes, however, elites require more from their in-group than a checked ballot box or even protest abstinence. Instead, elites may demand that the in-group coerce or repress the out-group.Footnote 5
How do elites encourage in-group non-elites to repress the out-group? I investigate this question in the antebellum U.S. South, where enslavers (elites) demanded that non-slaveholding Whites’ (in-group non-elites) repress enslaved Americans (out-group). Enslavers controlled repression and coercion on the plantation, but they needed other Whites to help enforce their property rights off the plantation.Footnote 6 Specifically, they needed all Whites to apprehend any Black person they encountered, to arrest any Black person without documentation, and to accompany any potential runaway to the county jail or to their enslaver. Laws encouraged or mandated this kind of ad hoc policing, and slave patrols provided routinized, nightly policing. Problematically for elites, non-slaveholding Whites were not eager participants in these policing efforts, though they shared elites’ anti-Black racism and sometimes faced fines for missing patrol shifts.Footnote 7 Formal patrol service cost individuals’ time and risked their safety; it was not uncommon for patrols to run “from 9 p.m., until daylight next morning,” as the town of Charlotte ordered in 1859.Footnote 8 Ad hoc surveillance demanded constant vigilance and a willingness to risk safety or share valuable information. And the intended outcome of this policing—apprehending or recapturing enslaved persons—did not directly enrich non-slaveholders. Moreover, even Whites who desired robust policing would have been better off free-riding, enjoying the perceived security patrols provided, while others staffed the force.
I hypothesize that one way enslavers encouraged non-slaveholding Whites’ participation was directing more public resources to those who lived in areas where enslavers demanded more policing. To illustrate these dynamics, I focus on public schools, which states in the antebellum South funded as a means to educate children of non-elite Whites.Footnote 9 Southern elites leveraged the nation-wide shift to public schooling in the 1830sFootnote 10 to direct government benefits to strategically valuable Whites. I present evidence from a novel dataset on antebellum North Carolina to support my claims. I first proxy for policing demands with the number of enslaved persons per adult White male, which captures both the wealth of enslavers and the relative availability of Whites to engage in policing. Using qualitative evidence and 20 years of data from the North Carolina Literary Fund, the entity which provided school funds for all counties in the state, I demonstrate that more densely enslaved counties received more government resources for schools. With data on county taxes, I find that more densely enslaved counties voluntarily raised additional school funds through local, progressive taxes. It is striking that certain elites willingly directed valuable public resources to fund schools for their non-slaveholding neighbors.Footnote 11
I argue that enslavers did this because they sought neighboring Whites’ participation in policing their enslaved laborers. Yet, enslaved population density is not a strict measure of enslavers’ policing demands, and it may stand in for a host of features of the slavocracy. To address this concern, I introduce an additional source of variation in enslaver's policing demands: freedom seekers’ access to escape routes. The results are consistent with my hypothesis; in counties where more enslaved people lived, proximity to routes on the Underground Railroad is associated with more school tax revenue.
I also interrogate two alternative explanations of the relationship between enslaved density and school funds. In section 3, I consider that enslavers may have valued public education more than non-slaveholders. I show, instead, that enslaved population density is not associated with proxies for education demand. And in section 4, I ask if enslavers simply directed public goods to their voting base. I present evidence that non-elite Whites were not a critical constituency for politicians in densely enslaved counties. I conclude that neither electoral concerns, nor underlying education preferences, can solely explain the patterns in the data.
North Carolina is an ideal case to study because it had both a sizable enslaved population and a continuously operated public school system throughout the 1840s and 1850s. The state also preserved detailed records on annual state disbursements, school tax revenue, and county tax bases. My theory, however, need not apply only to one state. Because the rich data from North Carolina are not yet available for the rest of the region, I turn to the 1850 U.S. census for a preliminary investigation. Reassuringly, the data are consistent with my theory; they show that most Southern states distributed significantly more public school funds to more densely enslaved counties.Footnote 12
My work suggests a new perspective on non-elite Whites’ influence on public policy. Previous work has focused on non-elite Whites’ leverage, or lack thereof, through electoral channels. Enslavers in the antebellum period excluded non-elite Whites from political life through disfranchisement and malapportioned representation in state legislatures.Footnote 13 When and where non-elite Whites were enfranchised, they were more likely to vote for elites when they had received clientelistic benefits from enslavers.Footnote 14 Unlike existing studies, I argue that elites’ goal was cultivating not only compliant voters, but also active participants in the repression of Black Americans. I present evidence that elites directed public spending to the White masses in spite of non-elite Whites’ minimal voting power. The paper thus demonstrates a different means by which U.S. elites have exploited racial cleavages to protect their wealth and ensure their survival. In turn, it contributes to our understanding of the enduring relevance of race over class in U.S. politics.Footnote 15
The paper proceeds as follows. I first explain how enslavers policed the enslaved population and introduce my theory of how enslavers sought non-slaveholders’ participation in that policing and how public school funds could serve to encourage that participation. In section 3, I present qualitative evidence of how North Carolina funded schools, and I describe and analyze my novel data on North Carolina. I then present evidence on the policing and electoral incentive explanations in section 4. In section 5, I offer suggestive evidence that the relationships I document for North Carolina may apply to the entire South. Section 6 concludes with avenues for future research.
2 Background and theory
The maintenance of a stable institution of slavery was so important that owners early sought the cooperation of the entire community. This cooperation took the form of the patrol.Footnote 16
Resistance by enslaved Americans was an existential threat to elites’ lives and livelihoods. The most frequent and costly resistance came in the form of escape.Footnote 17 Runaways denied enslavers their source of capital, days or years of labor, and the resources invested in pursuing the runaway.Footnote 18 They also challenged the myths that Black Americans were happy to be enslaved and that the institution was sustainable and secure. So, enslavers implemented a variety of strategies to reduce the frequency and success of escape attempts.Footnote 19
2.1 How the South repressed escape
Policing in the antebellum South was an expansive system that ranged from formal patrolling, wherein a handful of individuals served in a local unit for a set amount of time, to informal surveillance, by which all Whites were empowered to monitor and apprehend Black Americans on their own time. I describe these two pillars of antebellum policing as slave patrols and ad hoc apprehension. Together, these institutions extended enslavers’ authority beyond the plantation borders and constituted a legal and social environment that Solomon Northrup described as “the thousand obstacles thrown in the way of a flying slave[:] Every white (sic) man's hand is raised against him—the patrollers are watching for him—the hounds are ready to follow on his track, and the nature of the country is such as renders it impossible to pass through it with any safety.”Footnote 20
Slave patrols originated in South Carolina in 1704. Local governments populated patrol rosters by calling for volunteers or drafting participants. Each night, groups of men, under the leadership of a captain, policed their assigned districts.Footnote 21 They were responsible for apprehending Black passersby, but also for investigating plantation sleeping quarters, disrupting gatherings, and confiscating weapons.Footnote 22 Predictably, patrols often ended in violence.Footnote 23 In 1857, for instance, Wilmington's The Daily Journal described at length, and with undue sympathy, four patrollers’ injuries incurred from interrupting “a collection of free blacks (sic), slaves, and some white folks, fiddling and frolicking,” which “was their duty to look after.”Footnote 24 And patrols were not only dangerous for participants, but, given their fixed numbers, they were also insufficient to satisfy enslavers’ demand for repression. Franklin and SchweningerFootnote 25 argue that, with patrols alone, “it was virtually impossible to maintain surveillance over the black (sic) population day and night in all parts of a county. There were too many places to hide and too many hours at night for runaways to move across the countryside.”
As a way to address this gap in surveillance, the law empowered, and in some cases mandated, all Whites to apprehend any suspected fugitive or unidentified Black American.Footnote 26 Journalist Frederick Law Olmsted documented this system at work when he wrote of a man who “with no commission or special authority, oblige[d] negroes (sic) to show their passports, simply because he did not recognize them as belonging to any of his neighbors.”Footnote 27 To incentivize community Whites to take this kind of initiative, many governments instituted commissions for those who detained runaways. As early as 1754, Georgia ordered local constables to pay persons “taking up” runaways at a rate of two pence per mile from their origin.Footnote 28 Starting in 1819, North Carolina similarly required jails to pay $5 to any White person who captured and delivered to the jail a fugitive from another county.Footnote 29 This system of ad hoc apprehension accomplished something a formal police force—definitionally limited to a fixed number of recruits—could not: it deputized every White person. Consequently, it was perilous for a freedom seeker to encounter, not just an official slave patroller, but any White person. And even if that White person did not personally apprehend the freedom seeker, he might inform the enslaver or local slave patrol of the freedom seeker’s movements or whereabouts.
Whether voluntarily apprehending suspected runaways, serving on nightly patrols, or simply providing information, local Whites—most of whom were not slaveholders—were indispensable to the preservation of enslavers’ wealth. Yet, direct payments were not sufficient to ensure optimal participation by locals. There is evidence, for example, that patrollers may have responded to the opportunity cost of serving on patrol by shirking when market wages were higher.Footnote 30 Moreover, patrollers were not subject to strict oversight or monitoring, and some were likely inclined to police lazily or avoid riskier locations. Elites often complained about patrollers’ supposed behavior, arguing that poor and incompetent patrollers hindered the effectiveness of patrols.Footnote 31 Although not so much, evidently, as to mobilize elites to embrace the responsibility themselves.Footnote 32 And non-slaveholders resented enslavers’ absence. In 1825, for example, 83 North Carolinians petitioned their county to release them from patrol duty, arguing that “no person [w]ho does not own a slave or slaves shall be compelled to serve as Patroler (sic) against his own will.”Footnote 33
Their resentment was also not confined to policing obligations, rather, it could extend to economic disparities and the institution of slavery. The South's economy, which was so profitable for enslavers, offered meager pay and instability to non-slaveholding Whites. In agricultural settings, free labor was more costly and less productive than enslaved labor, and there were few other low-skill jobs available in rural areas.Footnote 34 Small farmers “who came into economic competition with the slave” in rural North Carolina “decided that the slave was robbing the freeman of his wages.”Footnote 35 Prospects were only marginally better in urban centers; relative demand for White labor was elastic to the cost of enslaved labor (as measured by slave prices).Footnote 36
Yet it was these Whites—those who resented the slavocracy, those who were unmotivated by patrol pay, and those who were unwilling to risk bodily harm to police enslaved persons—who constituted the “community” whose cooperation enslavers so sought.Footnote 37 Enslavers were not satisfied with the participation of a few especially talented patrollers. They wanted the buy-in of “every white man.”Footnote 38
I hypothesize that one strategy elites used to generate that buy-in was directing government benefits to those who lived where enslavers most demanded policing. It was cheaper to provide benefits to all non-slaveholding Whites through public goods, rather than through individual transfers, because public goods are more cost-efficient than private goods in co-opting sufficiently large groups.Footnote 39 After receiving benefits from the enslaver-controlled government, non-slaveholding Whites may have been more amenable to taking a range of actions to police enslaved Americans. Even small actions, like sharing where a freedom seeker had last been seen, would have been valuable to enslavers. As such, targeted public goods was a valuable strategy for enslavers to add to their policing toolbox.
2.2 School funds as a benefit for non-slaveholding Whites
I argue that enslavers leveraged the national movement for public schools to provide such government benefits to non-slaveholding Whites.
The South was not immune to the common school reform movement of the 1800s, which sought to democratize elementary education.Footnote 40 Southerners’ support for public education increased throughout the 1830s and 1840s, which historians have attributed to the spread of Jeffersonian and Jacksonian democracy and the accompanying enfranchisement of White men.Footnote 41 When states received windfalls from the 1837 federal budget surplus, several states, including North Carolina, invested these funds in public schooling.Footnote 42 Elites did not introduce public schools to the South in order to co-opt non-slaveholding Whites, but given prevailing national trends and grassroots demands, public school funding was a convenient means for targeting strategically valuable constituents.Footnote 43
School funds were also an effective way to target non-slaveholding Whites, because public schools benefited non-elites exclusively. In fact, it was the only government program at the time that served only non-slaveholders.Footnote 44 In the decades preceding the war, North Carolina financed two types of government services: transportation infrastructure and education.Footnote 45 While non-elite Whites may have enjoyed the conveniences of paved roads and railroad access, the primary beneficiaries of these advances were enslavers.Footnote 46 Public schools, on the other hand, were strictly for non-elites. North Carolina legislators repeatedly described the Literary Fund as the means for educating “the indigent youth of the State (sic).”Footnote 47 An early argument for increasing the amount in the Literary Fund was that schooling was “of so much general usefulness to the younger classes of society, hundreds of whom, though poor, are children of much promise.”Footnote 48 This kind of discourse in the legislature suggests that political elites considered public schools to be a benefit to non-elite Whites. Indeed, a rudimentary education would have been especially valuable for the South's illiterate population, which constituted as many as 25% of White adults in North Carolina.Footnote 49 Elites also perceived school funds to be politically popular, as both Whigs and Democrats vied to claim credit for the expansion of public schools.Footnote 50
Elites did not, however, view the new public schools as appropriate for their children's education. Across the South, public schools “served those who could not afford private schools,”Footnote 51 while those who could afford it continued to send their children to academies, where they might be trained in the classics and taught by university graduates.Footnote 52 Elites’ absence from state schools frustrated representatives of poor Whites, at least two of whom relayed their complaints to the state superintendent. A school board chairman from the mountains bemoaned that “the greatest difficulty in the way of success in our Common Schools (sic) … is the apathy and indifferences manifested by the Upper Classes who do not send their children much to Common Schools.”Footnote 53 A chairman from the coast offered a similar sentiment: “I am sorry to say that in Wilmington our common schools are not patronized except by those who have not the means to send [their children] to other schools.”Footnote 54 Data from the 1850 census bolster the claim that enslavers continued to invest in private schools for their children; enslaved population density is significantly related to more teachers per private pupil.Footnote 55 Similarly, KaestleFootnote 56 finds that the expansion of public schools in the South coincided with the proliferation of private schools: by 1850, “the number of academies in the South as a whole (2,700) [had] surpassed the number of academies in the Middle Atlantic region (2,100) or New England (1,000).” Because enslavers did not send their children to public schools, I conclude that elites were allocating state funds and raising their county taxes, not for their direct benefits, but for a political purpose.
I argue that school funds were an available policy with which elites could provide material benefits to strategically valuable non-elites, but were schools also advantageous for cultivating elite support? Unlike other types of public goods, schools allow elites to shape beliefs and attitudes.Footnote 57 The governor who oversaw the inauguration of North Carolina's public schools enumerated this as a merit of the new system. In a speech to the legislature, he congratulated them for providing schools that “will so eminently improve [poor children's] moral and mental condition, to make them better and more valuable citizens, and inspire them with grateful feelings to their country, which will not be forgotten in the hour of danger.”Footnote 58
Textbooks and curriculum standards often provide insight into governments’ political or strategic goals in providing universal education.Footnote 59 Antebellum North Carolina's textbooks surely reflected the status quo. In the textbook by the first superintendent of North Carolina, slavery earns passing, matter-of-fact references.Footnote 60 Another textbook, Elementary Moral Lessons, for Schools and Families received commendation in Raleigh's The Standard as “an excellent work,” which the editors determined after having “examined it with some care, [finding] in it nothing offensive to a Southern reader.”Footnote 61 There is no affirmative evidence, however, that fostering pro-slavery sentiment was the objective of state politicians. On the contrary, the superintendent's primary goal in molding minds seemed to surround views of North Carolina. In his annual reports, the superintendent wrote at length of his efforts to provide textbooks with positive descriptions of the state, particularly its agricultural diversity and role in the nation's founding.Footnote 62 Following Paglayan'sFootnote 63 argument that politicians invest in teaching pro-regime propaganda when they are threatened, it is possible that elites did not feel they needed to defend slavery in the classroom.
Moreover, there is reason to suspect that educating non-slaveholding Whites did not serve to uphold elites’ power. While teaching someone to read enables them to absorb more pro-regime propaganda, it also allows them to read materials they encounter outside the classroom. MerrittFootnote 64 argues that this was precisely enslavers’ fear, that newly literate Whites would be exposed to abolitionist literature. Additionally, enslavers, unlike elites in free-market, industrial settings, did not profit from a more educated workforce.Footnote 65 Enslavers’ economic fortunes were independent of White workers’ education and abilities.
I therefore abstract away from the costs or benefits that educating non-elites may present to elites. Instead, I conceive of schools as a public good that provided tangible benefits to the White masses. I argue that receiving these benefits from an enslaver-controlled government nudged non-slaveholding Whites in the direction of taking costly actions to police enslaved Americans. And I find that non-elite Whites received more of these benefits when they lived where enslavers most demanded policing.
3 Evidence from North Carolina
3.1 Enslaved population density
I proxy for enslavers’ policing demands with the county share of enslaved persons per adult White male.Footnote 66 I create the variable by interpolating the 1840–1860 census estimates of White male and enslaved population sizes.Footnote 67 The median North Carolina county had 2.5 enslaved persons per White male, and all counties had less than nine enslaved persons per White male. Table 1 presents descriptive statistics of all variables, and Figure 1 displays a histogram of enslaved population density. Figure 1 also shows the distribution of enslaved population across the entire South; relative to the rest of the South, North Carolina had more counties with two to five enslaved persons per White male and fewer counties with six or more enslaved persons per White male.
Enslaved Population Density, 1850.

Summary Statistics, North Carolina Panel Variables

Covariate data from Michael Haines, Historical, Demographic, Economic, and Social Data: The United States, 1790–2002. ICPSR02896—v3 (Ann Arbor, MI: Inter-University Consortium for Political and Social Research, 2010), accessed July 31, 2022, https://doi.org/10.3886/ICPSR02896.v3; NC OneMap, Major Hydrography (Streams/Rivers) (Raleigh, NC: North Carolina Department of Information Technology, Government Data Analytics Center, Center for Geographic Information and Analysis, 2019), accessed August 24, 2023, https://doi.org/nconemap.gov/datasets/nconemap::major-hydrography-streamsrivers; William G. Thomas, III, Richard Healey, and Ian Cottingham, Historical GIS: The 1840–1845–1850–1861–1870 Railroad System in America, State and National Shapefiles, Railroads and the Making of Modern America (Lincoln, NE: Center for Digital Research in the Humanities, 2017). See “Historical North Carolina publications” in Online Supplementary Material, Appendix J. The descriptive statistics for the river variable are calculated for the counties that existed in 1855. See more about the creation of the river variable in Online Supplementary Material, Appendix F.
Enslaved population density reflects both the wealth of enslavers in the county and the relative availability of Whites who could contribute to the policing of enslaved persons; a county with high enslaved density is home to very wealthy enslavers and few Whites to police the large enslaved population. In line with this logic, CallahanFootnote 68 observed that “in [North Carolina] black belt counties, the white (sic) slave-holding population was not large enough to maintain an effective patrol on a regular basis.”Footnote 69 I thus contend that enslavers’ demand for non-slaveholding Whites to participate in policing was increasing in enslaved population density, and I hypothesize that public school funds—a benefit for non-slaveholders—were also increasing in enslaved population density.
3.2 Legislation governing school funds
Elites did not distribute funds equally to all non-slaveholders or even to the most vocal proponents. Instead, legislators wrote funding rules for public schools such that more densely enslaved counties received more resources. Notably, they did not fund other government programs in the same way. Money for government operations was allocated according to the branch or department; loan and bond payments were dispensed to individuals and banks; road and railroad construction was funded according to the project, like the McDowell and Yancy turnpike or a railroad from Salisbury to Charlotte.Footnote 70 Other than public school funds, no type of government spending went to all counties on an annual basis. So, when the General Assembly needed to distribute school funds to all North Carolina counties, they had to invent a new funding scheme. The resulting scheme allocated funds based on the federal population, wherein enslaved persons counted as three-fifths and everyone else counted as one.Footnote 71
But federal population wasn't the obvious allocation rule to all legislators, particularly to those disfavored by this apportionment. The federal allocation rule faced frequent opposition from representatives of sparsely enslaved counties, and it survived repeated repeal attempts because of the unanimous, bipartisan support from enslavers’ representatives.Footnote 72 During debates on the 1841 act to establish statewide public schools, for instance, six representatives proposed six variations of amendments to allocate funds by White population instead of federal population; all amendments failed.Footnote 73 In 1850, Governor Manly endorsed such amendments when he spoke out against the malapportionment of funds:
Those counties in the state containing a sparse white (sic) population, and but few white children to educate, yet containing many slaves and free negroes, receive the larger proportion of this public bounty; while those counties having a large white population and many children to educate, yet having few slaves and free negroes, receive the smaller share. This arrangement I hold to be wrong.Footnote 74
The General Assembly's committee on education again considered distributing funds according to White population in 1854, but the bill received only one vote of support. The lone supporter was the only member of the committee not from a densely enslaved county. Invoking a “duty to the three thousand poor White children whom I represent,” Representative Vance explicated what he saw as the absurdity of enslavers receiving a disproportionate share of the education funds:
It is a fact, that we have a statute law forbidding under fines and penalties the education of slaves and colored persons ... It is also a fact, and a very singular one too, that in the distribution of this fund for the education of Whites, that particular county which shows the largest number of slaves and free negroes (sic) should get the greatest amount of money. … The dispensing of this money among those who in the number of negroes they list upon the tax roll show prima facie that they are rich enough to do without it, is … a gross, monstrous and wholesale injustice.Footnote 75
Despite persistent opposition, the law from 1840 to 1860 stipulated that counties with more enslaved people would receive more state school funds. To verify that this legislative intent was reflected in the actual distribution of funds, I collected a novel dataset on North Carolina school funds. The data also allow me to investigate if local elites supplemented state funds with county taxes and if they raised more school taxes where the risk of slave escape was greater.
3.3 Data collected from novel and secondary sources
I define the school funds outcome as education funds per child, measured separately as resources from the state or from local taxes. In each case, I normalize school funds by the linearly interpolated population of White, school-aged (5–14 years) children. I divide by the population of White children, instead of pupils, because the number of pupils may itself be a function of school resources.Footnote 76 Below, I introduce the school data and describe the auxiliary controls.
3.3.1 Literary Fund disbursements
The state Literary Fund was responsible for managing and distributing school funds, and the annual state comptroller reports list the amount each county received from the Literary Fund between 1840 and 1860.Footnote 77 Counties received disbursements year-round, and sometimes multiple times in a month.Footnote 78 Counties encompassed tens of school districts, and a county official was tasked with distributing the funds equally among the districts,Footnote 79 though the state superintendent complained that “boards of county superintendents have mostly exercised a discretion in this matter.”Footnote 80
Although the legislation itself was clear on the apportionment scheme, state records do not describe precisely how the treasury determined individual county populations and calculated disbursements, and the data suggest that there may have been ambiguity in the actual disbursements. The fact that funds were allocated at multiple times throughout the year, with counties sometimes receiving the annual amount all at once and sometimes receiving it in parts over the year, suggests that the General Assembly's primary concern was not precision in accordance with the legislative language. This pattern of disbursements also reveals that state officials ignored the law instructing the Literary Fund to pay counties “on or before the first Monday of October in every year.” Figure C1 (Online Supplementary Material, Appendix C) depicts this variation in the timing of disbursements.
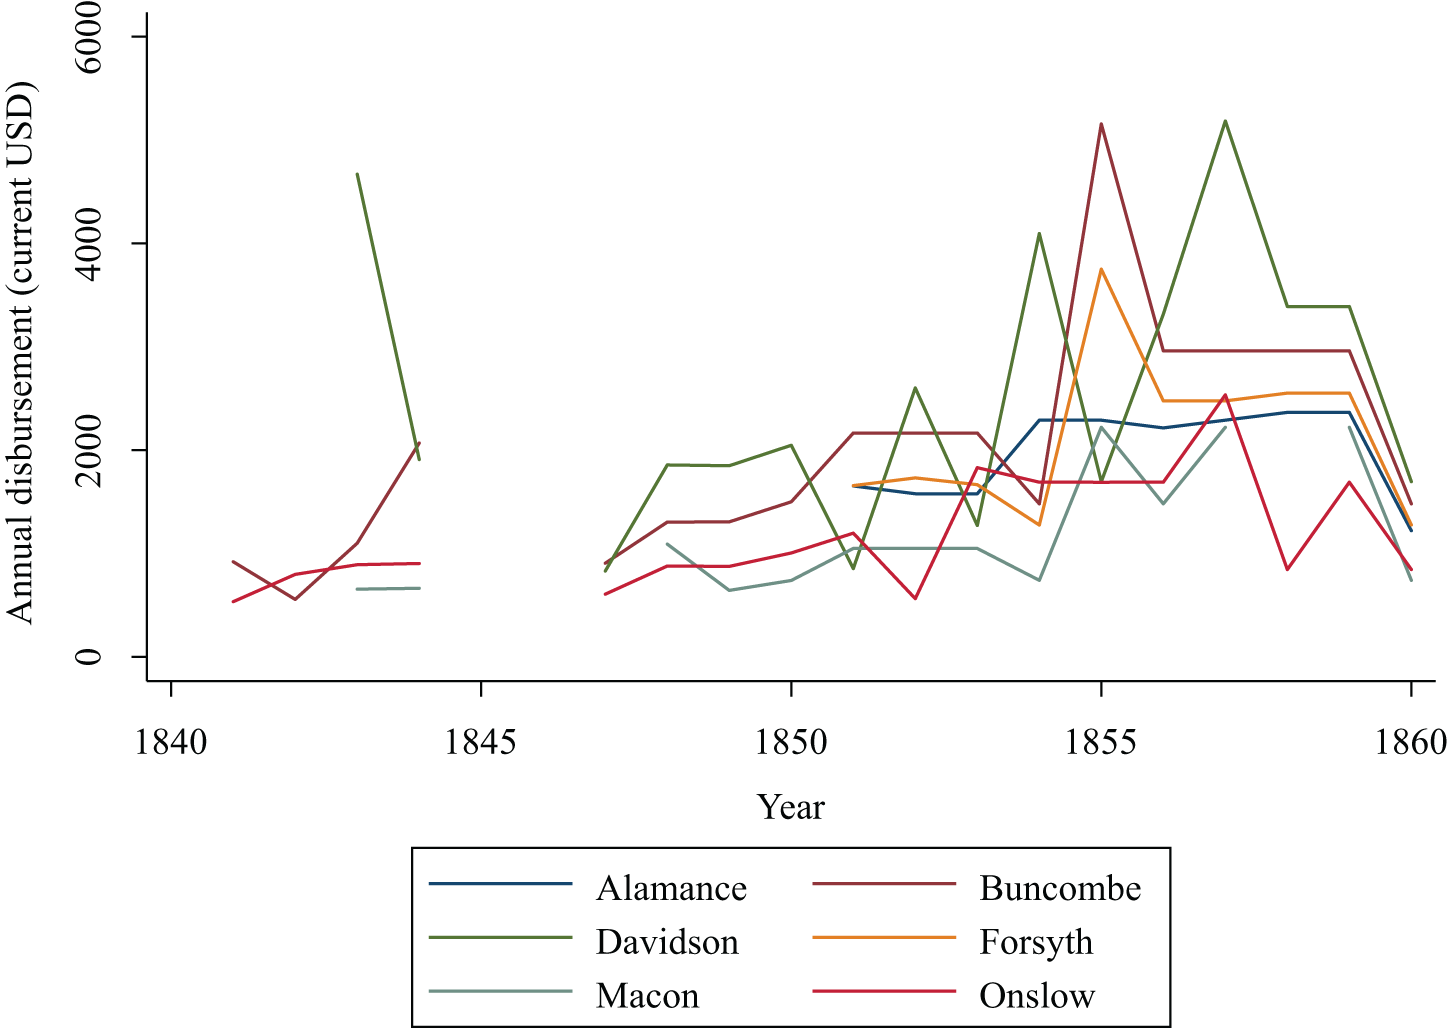
The amounts allocated also suggest that legislators did not adhere strictly to the law or census population counts. If they did, counties’ annual disbursements should follow similar patterns between census counts. For example, if the Literary Fund grew between years, we would observe all counties receive more, in proportion to their decennial population count. However, the data show that counties’ disbursements do not move together. Instead, between any two inter-decennial years, some counties’ disbursements increase, while others decrease. Figure 2 plots the annual disbursements for a sample of counties. (See the patterns for additional counties in Online Supplementary Material, figure C4, Appendix C). Observe, for example, that Alamance and Onslow counties received similar sums in 1856 as they did in 1855, while Buncombe, Forsyth, and Macon received less, and Davidson received more. This suggests that officials were not determining annual payments from only census counts and the state budget.
Annual Literary Fund Disbursements, Select Counties.

It is possible that officials instead adjusted payments based on intercensal population changes. Those officials had some knowledge of population sizes between censuses: the state levied poll taxes every year; the state superintendent tabulated the number of pupils in each county in his annual reports; and, individual counties kept track of the number of polls and enslaved persons within their borders for tax purposes. Moreover, when counties were created between censuses, they received school funds before the first census which would count the population within the new county borders.Footnote 81
Given the apparent anomalies between the legal text and Literary Fund outlays, I ask if the spirit of the law—that counties with more enslaved people receive more school funds, even though enslaved North Carolinians were not allowed to attend the schools—was reflected in the actual disbursement of funds.
3.3.2 Local taxes
While enslavers in the state legislature were unified on a policy that benefited enslavers across the state, not all enslavers had the same demands for public policing, and they likely differed in their willingness to provide resources to nearby non-slaveholding Whites. Local tax data allow me to capture variation in enslavers’ behavior. School taxes were voluntary starting in 1840, and most counties subsequently chose to raise some taxes for local schools.
Two types of government documents provide the county tax revenue data. First, the 1859 and 1860 superintendent reports each include a table of counties’ school tax revenue. Beginning in 1853, inaugural state superintendent Calvin H. Wiley submitted annual reports to the North Carolina General Assembly. Wiley required each county superintendent to supply, inter alia, the number of districts in the county, the number of pupils taught, and the average school term. The later reports also list revenue from county taxes. Second, the 1856 and 1858 comptroller reports include tables summarizing each county's tax returns.Footnote 82
County court minutes offer insight into the process behind raising local taxes. The men who sat on the county's finance committee determined local tax rates every year. They chose the taxes levied for schools, the poor, infrastructure, or general expenses. Each type of tax consisted of a rate on polls and a rate on real estate; the finance committee determined each of these rates as well.Footnote 83
North Carolina poll taxes applied equally to adult White men and adult enslaved men and women, with the enslaver paying the poll tax on himself and on each of his enslaved adults.Footnote 84 Because land ownership was concentrated among the elites, I assume that elites paid all of the real estate taxes. Non-slaveholding Whites, the direct beneficiaries of school funds, simply paid poll taxes on themselves. A concern, then, may be that enslavers disproportionately raised taxes on non-elite Whites, for example by levying no school taxes on real estate and a high tax on polls. If that were the case, then it would have been non-elite Whites who financed schools at the county level, and local school funds would not represent a transfer from elites. The 1856 and 1858 reports additionally list the number of polls and the school tax rates on property and on polls. With these data, I calculate the amount of taxes elites paid, and I find that elites paid 85% of school taxes on average. As a further robustness check, I also present results where the tax outcome is restricted to taxes paid by elites.Footnote 85
The 1856 and 1858 reports also enable me to quantify how much the county raised not just for schools, but for all local priorities. This allows me to consider if counties raised more taxes for schools not because they wanted to fund schools in particular, but because they raised more taxes overall. I thus control for general purpose, or “county expenses,” tax revenue. Funding for county expenses did not explicitly benefit one group of Whites over another, and so I interpret county expenses revenue as a reflection of elites’ ability and willingness to fund local government.
3.3.3 Auxiliary controls
A shortcoming of the data collected is that it is observational. A concern, then, is that school funds are increasing in enslaved population density because of a third factor that increases both school funds and enslaved density. In particular, it is plausible that wealth independent of the slave economy increased both the density of the enslaved population and school funds. If this were the case, non-slave wealth would confound the relationship between enslaved population and school funds. However, because of the nature of the antebellum political economy and data limitations inherent to historical research, there are scarce measures of antebellum wealth that are not synonymous with slavery. I attempt to capture economic activity that is not a direct function of slavery by controlling for urban population and country stores. The census enumerates residents in cities with more than 2,500 people. In 1850, four North Carolina counties contained urban populations, according to the census definition. These urban centers constituted economic hubs, like major shipping ports and the capital city.
Previous work has demonstrated the role of country stores in 19th century agricultural economies. Through country stores, local merchants “provided advances on the commercial crops that farmers had in their fields (or were about to plant) … [and] sold planting supplies on credit.”Footnote 86 Feigenbaum et al.Footnote 87 use 1840 census data on country stores as a measure of local financial markets, and they argue that it is appropriate to apply the 1840 measure to subsequent decades, having validated it against 1860 data on general store managers.Footnote 88
To further assuage concerns of omitted variable bias, I include a control for total population. In the tax regressions, I control for lagged Literary Fund disbursements to improve the precision of the estimate and because county taxes may have responded to the amount of school funds they received from the state. I also include year fixed effects in all specifications with data from more than two years. Year fixed effects allow me to statistically identify if the between-unit relationship generalizes across time.Footnote 89
3.4 Panel analysis
I investigate the relationship between enslaved population and school funds and if it is robust to various controls. I estimate equation 1, where the outcome  ${y^1}$ is the amount county $i$ received from the state Literary Fund in year $t$ and the explanatory variable of interest $x$ is county $i$’s enslaved population density in year $t - 1$. The full specification includes panel controls ${{\mathbf{Z}}_{it}}$—total population and urban population share—as well as the number of country stores in 1840 ${w_i}$, and year fixed effects ${\alpha _t}$.
 \begin{equation}y_{it}^1 = {\beta _0} + {\beta _1} \cdot {x_{it - 1}} + {\beta _2} \cdot {w_i} + {\beta} \cdot {{\mathbf{Z}}_{it}} + {\alpha _t} + {\varepsilon _{it}}\end{equation}
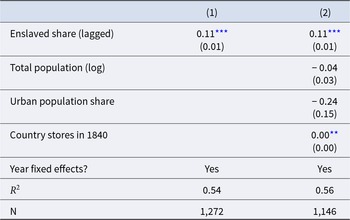
Table 2 presents the results, which confirm that more densely enslaved counties received significantly more school funds from the state. An increase in population density of one enslaved person per White male is associated with 11 more cents per White child from the state Literary Fund (model 1). The result is robust to the inclusion of controls (model 2). It is also robust to a moving average of Literary Fund disbursements, as well as to alternative specifications that reflect the scenario in which officials determined annual disbursements from decennial census counts.Footnote 90 Together, the results suggest that state officials acted on the intention of the legislative text by distributing significantly more funds to counties with relatively more enslaved people.
Relationship between Enslaved Population Density and Literary Fund Disbursements per White Child, 1840–1860

Population of White children is defined as those aged 5–14 years, according to the census, and the value is linearly interpolated for intercensal years. Coefficients are from OLS regression with year fixed effects. Robust standard errors are in parentheses.
** p < 0.01, ***p < 0.001.
Having verified that enslavers were successful in directing state resources to their home counties, I investigate if local elites voluntarily raised additional school funds through county taxes. I estimate equation 2, where the outcome  ${y^2}$ is the amount of school taxes county $i$ raised in year $t$ and the explanatory variable of interest $x$ is again county $i$’s enslaved population density in year $t - 1$. In select models, I restrict the outcome of all school taxes to only those paid by elites. The full specification includes panel controls ${{\mathbf{Z}}_{it}}$—total population, urban population share, and taxes for county expenses—as well as the number of country stores in 1840 ${w_i}$, state school funds received in the previous year ${v_{it - 1}}$, and, in models with more than two years, year fixed effects ${\alpha _t}$.Footnote 91
 \begin{equation}y_{it}^2 = {\beta _0} + {\beta _1} \cdot {x_{it - 1}} + {\beta _2} \cdot {w_i} + {\beta _3} \cdot {v_{it - 1}} + {\beta} \cdot {{\mathbf{Z}}_{it}} + {\alpha _t} + {\varepsilon _{it}}\end{equation}
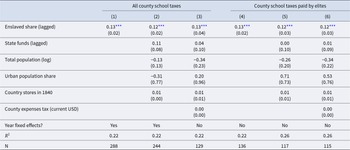
 Table 3 presents the results. In all models,  ${\beta _1}$, the coefficient on enslaved population density, is positive and precisely estimated. An increase in population density of one enslaved person per White male is associated with 13 more cents per child in school taxes (model 1), even when restricted to taxes paid by elites (model 4). The results are robust to controls (models 2 and 5), and also to the county expenses tax (models 3 and 6), indicating that densely enslaved counties raised more taxes for public schools, independent of their general commitments to local government.
Relationship between Enslaved Population Density and School Taxes per Child, 1856–1860

Models 1–2 include data from years 1856, 1858–1860, and models 3–6 include data from 1856 and 1858. Coefficients are from OLS regression, and robust standard errors are in parentheses.
*** p < 0.001.
Thus, enslavers’ counties, in addition to receiving relatively more school funds from the state government, voluntarily raised tax revenue for local schools.Footnote 92 Such an increase in funds would not have been insignificant for antebellum schools. An additional $0.13 per child was equivalent to moving from the 25th to 50th percentile of per-child resources from school taxes. And for the average county in the years for which I have data on school taxes and Literary Fund disbursements, an additional $0.24 per child ($0.13 in taxes and $0.11 from the Literary Fund) is equivalent to a 15% increase in total per child expenditure.
3.5 Demand for education spending
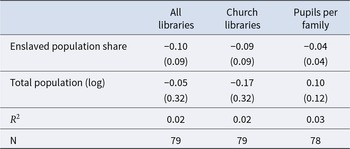
The above evidence supports my claim that enslavers strategically directed more school funds to neighboring Whites. An alternative explanation is that Whites in densely enslaved counties valued education more than their counterparts, and consequently demanded more school funds. Of course, there is possible endogeneity between available school resources and support for education, but I nonetheless look for evidence of diverging preferences. Using data from the 1850 census, I first consider libraries as a proxy for community interest in learning. I define libraries as the sum of public, church, and Sunday school libraries; 15.2% of counties had one or more libraries in 1850. In order to isolate latent education preferences from local governments’ ability to provide public goods, I also define a second library outcome as the sum of church and Sunday school libraries only.Footnote 93 Secondly, I examine the average number of children in school—whether public or private—per family (specifically, per adult White male). Again, although the number of children attending school is endogenous to school funding, it may nonetheless illustrate variation in families’ interest in education. In Table 4, I show that enslavers’ counties do not boast more libraries, and children in these counties do not attend school at higher rates. The coefficients on enslaved population share are negative and not statistically different from zero. These results are consistent with similar education preferences across enslavers and non-slaveholders.
Relationship between Enslaved Population Share and Latent Education Preferences, 1850

“Church libraries” is a sum of the church and Sunday school libraries in the county, and “all libraries” is a sum of church, Sunday school, and public libraries. “Pupils per family” is equal to the sum of academy and public school students, divided by the number of adult White men in the county. Coefficients are from OLS regression, and robust standard errors are in parentheses. No coefficients reach traditional levels of statistical significance.
I conclude, therefore, that even though enslavers neither valued public education more than non-slaveholders, nor sent their children to public schools, their counties received and raised significantly more public school resources. This evidence is consistent with my theory that poor Whites received more government resources where enslavers demanded their participation in policing, based on the claim that enslavers demanded more policing where there were more enslaved persons per adult White male. Enslaved population density, however, is a crude approximation of policing demand. So, I next introduce an additional source of variation in enslavers’ policing demand—proximity to escape routes—and I then address if electoral concerns motivated the distribution of school funds.
4 Policing vs. electoral concerns
The above analyses have established that elites directed state resources and raised their own taxes in order to fund schools for neighboring Whites. From this, I conclude that enslavers were particularly concerned about securing the support of these neighboring Whites. But why did elites need their support? I argue that elites were concerned about Whites in densely enslaved counties, and not about those in sparsely enslaved counties, because elites “sought [their] cooperation” in policing the enslaved population.Footnote 94 However, it is plausible, ex ante, that elites targeted public resources to their neighbors because they sought electoral support. Below, I consider both explanations.Footnote 95
4.1 Demand for policing
In March 1856, the Forsyth County Court awarded patrollers George Wilson and Benjamin Elliott $40 each for their previous four years of patrol service. Another Forsyth patroller, who had received no remuneration for his service, promptly penned his dismay to the local paper, thus inciting a month-long debate in the pages of The People's Press. The county judge eventually explained his reasoning by way of describing the conditions of George and Benjamin's patrol district:
In that district, an average majority of slaves are to be found. A negro (sic) quarter, without a proprietor, is included therein. Such a place, is one, well suited as a haunt and harbor for runaway negroes, or fugitives. No one will question the truth of the statement that runaways from other sections of the State, and even from the South, find it convenient to tarry there and find aid and comfort from their color.Footnote 96
The example of George and Benjamin illustrates that elites knew where escape was common and that they directed resources—in this case, $80 from the public purse—to the areas where they wanted more policing. I claim that similar trends might prevail at the county level. Specifically, I hypothesize that counties where there was a greater risk of slave escape raised more school funds to benefit local non-elite Whites.
When enslaved Americans ran from their enslavers, they sought refuge in swamp maroon camps, cities with sizable free Black populations, free states north of the Mason-Dixon line, or Texas and Mexico.Footnote 97 To reach these havens more quickly, they took advantage of transportation on covered wagons, boats, and trains.Footnote 98 Freedom seekers in North Carolina often ventured eastward in order to camp with other maroons in the Great Dismal Swamp, board a northbound ship on the coast, or blend in with the many free Black laborers in port cities.Footnote 99 Rivers that flowed toward these destinations facilitated escape for freedom seekers, who, with the assistance of abolitionist watermen, hid on riverboats and smaller vessels.Footnote 100 Accordingly, North Carolina was home to what historians call the “maritime Underground Railroad.”Footnote 101
Rivers, as well as railroads, also presented the threat of abolitionists and free Black Northerners traveling to the South. Enslavers in South Carolina and Virginia reportedly feared that “free Negroes from the North ... may incite rebellion in the local slave population.”Footnote 102 Thus, to enslavers, rivers meant costly resistance, either because rivers were escape route themselves or because rivers brought abolitionists who could incite rebellions or facilitate escape.Footnote 103
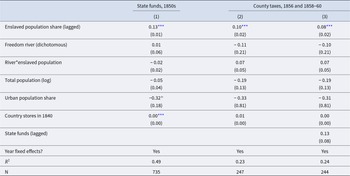
The National Park Service and the North Carolina African American Heritage Commission have identified five rivers that were active escape routes in North Carolina: Lower Cape Fear River, Neuse River, Pasquotank River, Roanoke River, and Tar-Pamlico River.Footnote 104 For shorthand, I refer to these as “freedom rivers.” Figure 3 maps these rivers. I capture river access with a dichotomous indicator at the county level, equaling 1 if one or more of the rivers traverse the county (25 counties) and 0 otherwise (61 counties). See descriptive statistics in Table 1. In secondary analyses, I consider access to actual railroads. I do not attempt to measure actual escapes, because escape attempts are themselves a function of the policing that the school funds served to encourage. I hypothesize that in densely enslaved counties, freedom rivers heightened elites’ fears of escape. But in counties with few enslaved persons, elites were less concerned by the maritime Underground Railroad, because there were few enslaved persons to take advantage of the escape routes. I therefore interact the river indicator with enslaved population density, and I add the interaction term to the models of state funds and county taxes. In the county models, I do not include the control for county expenses tax so as to preserve the four-year sample. The coefficient of interest is that on the interaction between enslaved population and freedom rivers.
Locations of Rivers on Underground Railroad.

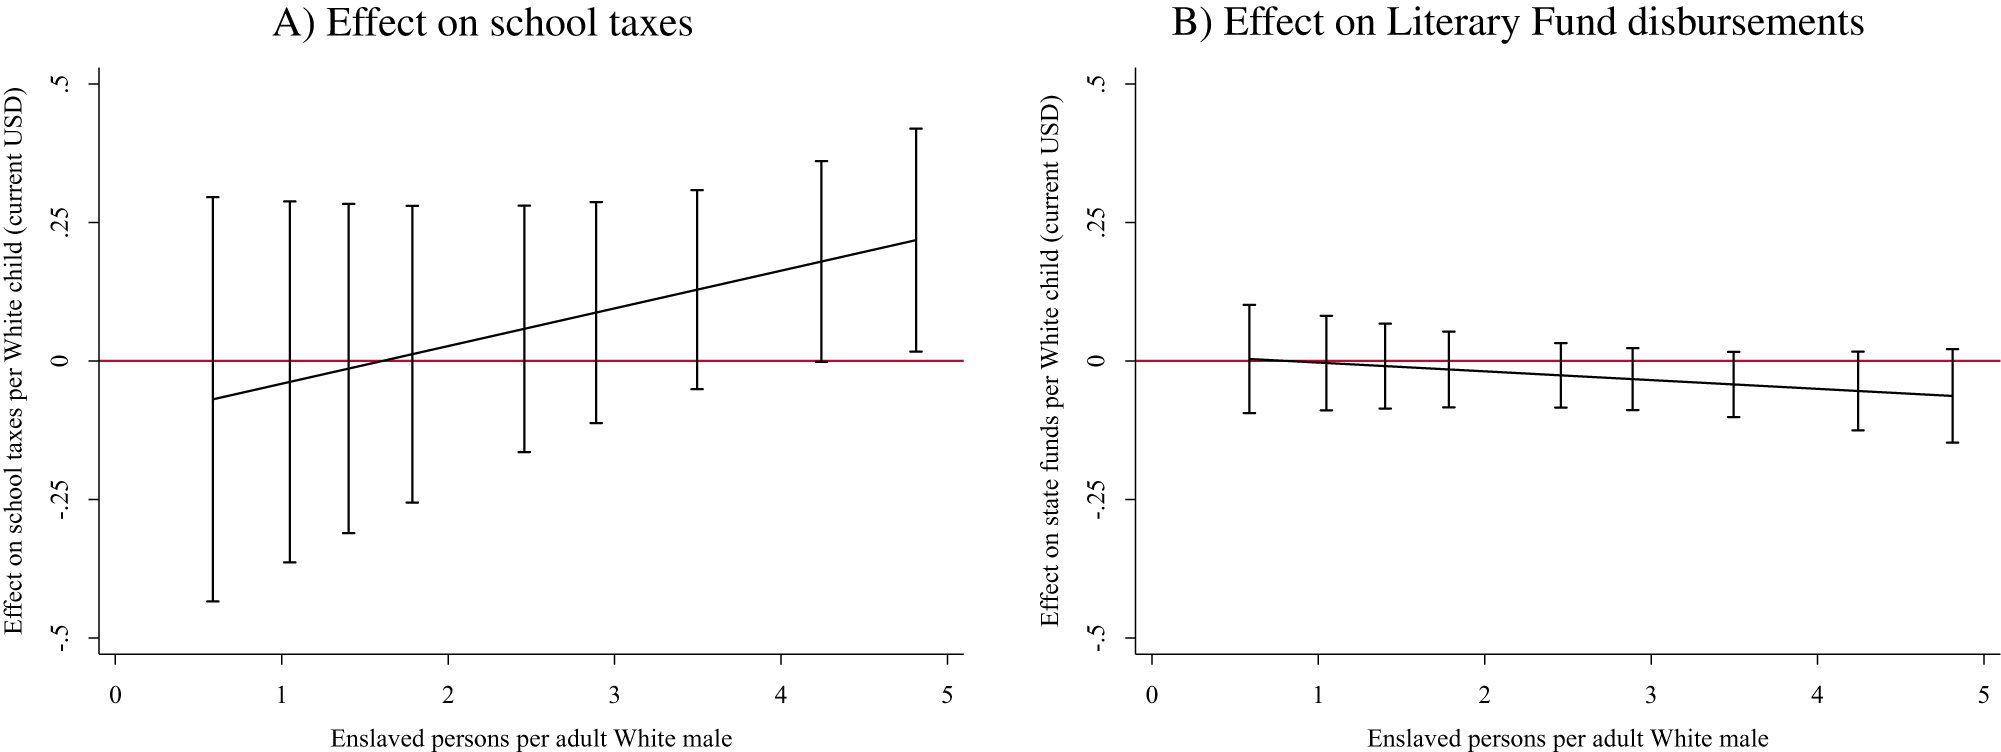
Adding river locations to the analysis may introduce new omitted variables. Specifically, factors that lead a county to have a river on the Underground Railroad may also lead it to raise more school funds. For instance, urban areas may have both more strategic value to freedom seekers, in turn increasing the presence of river escape routes, and different preferences for school funding. Thus, urbanization could confound the relationship between river access and school funds; I ameliorate this concern by controlling, as before, for urban population share.Footnote 105 Moreover, there is no evidence that Whites systematically moved to or resided in counties on these rivers. The average county with a freedom river had 1,568 adult White men, and the average county without had 1,629 (t = 1.23).Footnote 106 Still, there may be other unobservable features—features not related to enslavers’ policing demands—that lead river counties to raise more school funds than non-river counties. The data, therefore, cannot generate causal claims, but the following results are consistent with my theory. Table 5 shows the results of fixed-effect regressions where the outcome is education funds from the state government (model 1) or school taxes from the county (models 2–3). I present the county results with (model 3) and without (model 2) the control for lagged state funds. The interaction with river presence does not significantly predict state receipts (model 1) or school tax revenue (models 2–3), although the direction of the latter coefficient is in the expected direction. Because I hypothesize that river routes only capture escape risk in densely enslaved counties, I plot the marginal effect of river presence for different values of enslaved population density. See Figure 4. Again, the marginal effects on state funds (panel B) are null for all levels of enslaved population. But for the most densely enslaved counties, roughly the upper quintile of counties, river escape routes are associated with significantly more school tax revenue (panel A). Thus, in the counties where sizable enslaved populations could access the maritime Underground Railroad, elites raised significantly more school taxes.
Conditional Marginal Effect of County Containing Freedom River: (a) Effect on School Taxes, (b) Effect on Literary Fund Disbursements.

Access to Maritime Underground Railroad and School Funding per White Child

Coefficients are from OLS regression with year fixed effects. Robust standard errors are in parentheses.
*** p < 0.001.
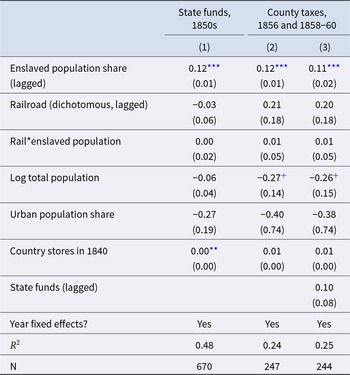
I further explore variation in the threat of escape by considering the location of actual railroads. Several successful freedom seekers are known to have utilized train travel to expedite their escapes.Footnote 107 In the decade before the Civil War, for instance, numerous freedom seekers escaped via the Philadelphia, Wilmington and Baltimore Railroad, a popular route on the Underground Railroad.Footnote 108 Although North Carolina freedom seekers likely more often took maritime than train routes, railroads may still have concerned enslavers with the possibility of speedy escape, given the use of trains by freedom seekers in North Carolina and neighboring regions.
Using Thomas, III et al.’sFootnote 109 Railroads and the Making of Modern America 1850 map of railroad tracks and data on years in which each railroad began operating, I create a variable equal to 1 for county-years wherein a railroad crosses or touches the county border (171 county-years) and 0 otherwise (749 county-years). The data are available for the years 1850–1860. Again, it is essential to control for urbanization and pre-existing economic activity, captured by the number of country stores in 1840, in order to limit omitted variable bias. More concerning still is that the location of railroads was endogenous to historical political and demographic dynamics. Political actors chose when and where to construct railroads, and individual residents may have moved in anticipation, or as a result, of rail construction. By including year fixed effects, I restrict comparisons to different counties within the same year, but readers should nonetheless exercise more caution in interpreting the following correlations than the previous river results. I address additional confounders in Online Supplementary Material, Appendix G.
The results are similar to those in the river analyses: the interaction with rail proximity does not significantly predict Literary Fund disbursements or school tax revenue. See Table 6. Again, I hypothesize that rail access is only relevant to densely enslaved counties, and so I plot the marginal effect of the railroad for different values of enslaved population density; see Figure 5. The marginal effects on state disbursements (panel B) are null, but the results for county taxes (panel A) are as predicted. As the enslaved population increases, the railroad effect is increasingly positive and significant.
Conditional Marginal Effect of Railroad: (a) Effect On School Taxes, (b) Effect on Literary Fund Disbursements.

Access to Railroads and School Funding per White Child

Coefficients are from OLS regression with year fixed effects. Robust standard errors are in parentheses.
+ p < 0.10, **p < 0.01, ***p < 0.001.
It is striking that enslavers voluntarily raised their own taxes to fund schools, and that those closer to railroads and river routes raised even more taxes. Yet, the state Literary Fund did not lend preference to counties near railroads or with rivers on the Underground Railroad. The discrepancy may be an artifact of the malapportionment scheme, which was biased toward enslavers but did not necessarily favor counties with railroads or rivers. Enslavers from counties with active escape routes may not have constituted a large enough faction to out-vote the rest of the assembly. Nonetheless, local elites who were especially concerned about slave escape could supplement state funds with tax revenue, because individual counties had autonomy over local taxes.
4.2 Electoral survival
Elites often protect their political survival by directing public or private goods to important constituencies.Footnote 110 Enslavers, who did not constitute a majority in any state,Footnote 111 were certainly concerned about non-slaveholders’ ability to seize political power. It is plausible, then, that the relationship between enslaved population and school funds may reflect elites’ attempts to secure votes, rather than their demands for policing. To address this concern, I first describe the extent of non-slaveholders’ disfranchisement, and I then look for evidence of differential school funds by electoral competitiveness.
Enslavers designed political institutions in such a way as to overcome their demographic minority. Jensen et al.Footnote 112 determine that six Southern statehouses “over-represented high slave-dependent areas … by including slaves in the population count, basing representation on taxes paid, or using a fixed basis that over-represented less populated rural areas.”Footnote 113 Many of those same states also banned poor Whites from the ballot box by setting property or tax requirements.Footnote 114 North Carolina had different requirements based on the office. All taxpayers could vote in gubernatorial and lower house elections as of 1835, but until 1856, only owners of 50 acres or more could vote in the upper house, or state senate, elections.
McCormickFootnote 115 took advantage of North Carolina's unique voter requirements to analyze whether the politics of non-elites diverged from that of large property owners. He finds that the two groups’ partisan preferences were “so nearly identical as to be astonishing,’’ and that this striking similarity existed in almost every county. McCormick'sFootnote 116 results are consistent with those of LipsetFootnote 117 and Acharya et al.,Footnote 118 who find that antebellum partisanship did not fall along slaveholding or class lines.Footnote 119 Thus, if enslavers wanted to target school funds to co-partisan voters, they could not have done so through the state legislature, because enslavers were not members of the same political party. The lack of clear partisan motives, together with the property requirements for state senate elections until 1856, suggests that electoral survival did not motivate the state legislature to distribute more school funds to enslavers’ neighbors.
Moreover, local and state politicians across the South had many extra-legal methods for securing votes. Even Whites who met the requirements for voting could not necessarily vote freely. Through the early nineteenth century, “voting was still an oral and public act: men assembled before election judges … and then announced which candidates they supported.”Footnote 120 When party ballots replaced public recitation, they “tended to be of different sizes, shapes, and colors,” and thus revealed the man's preference “to election officials, party bosses, employers, or anyone else watching the polls.”Footnote 121 Voters also received private benefits in exchange for their support. Masera and RosenbergFootnote 122 argue that non-slaveholders who received clientelistic benefits from enslavers voted for pro-slavery politicians. And in North Carolina, it was common for politicians to trade free liquor for votes.Footnote 123
Were targeted school funds perhaps another means by which slaveholding-politicians cultivated political supporters? To investigate this possibility, I ask if counties with particularly small electoral margins raised more school funds. I analyze election results from the 1848–1858 gubernatorial elections.Footnote 124 Given McCormick'sFootnote 125 finding that partisan voteshare was consistent across elected offices, as well as the lack of data for local elections, I use gubernatorial returns to proxy for the competitiveness of local races.Footnote 126 I define the absolute margin as the difference between the top two vote-getters, divided by total votes. I do not differentiate by candidate party, because enslavers were not loyal to one political party,Footnote 127 but I do calculate incumbents’ margins. For elections where one of the candidates was the sitting governor (years 1850, 1852, and 1856), I calculate the incumbent margin as the incumbent's votes less the challenger's votes, divided by total votes. To allow for generalizability across changing voter eligibility laws over time, I include year fixed effects.
Table 7 presents the results of OLS regressions. Consistent with the above prediction that electoral incentives did not motivate the politicians who disbursed state school funds, there is a null relationship between electoral competitiveness, measured either as absolute or incumbent gubernatorial margins, and state funds (models 1–3). I next consider the relationship between electoral competitiveness and local school taxes. In the bivariate regression (model 4), the coefficient is positive and insignificant. When including controls for population and economic activity, however, the coefficient is positive and significant (model 5). The positive coefficient counters my prediction that elites targeted resources to competitive counties; it instead shows that counties raised more school funds the greater the margin in the last election. These results suggest that elites may have rewarded counties that supported them overwhelmingly, or targeted counties that strongly opposed them—because enslavers were members of both political parties, it is difficult to disentangle these possibilities. The incumbent margin allows me to consider if elites distributed more school funds to counties that heavily supported the incumbent in the last election. If elites were rewarding their voters, I would expect to see a positive effect of incumbent margin on school funds. Here, I find a null result (model 6). Readers should, however, use caution when interpreting the effect of incumbent margin on county taxes, because these data are only available for one year.
Relationship between Electoral Competition and School Funds

The outcomes are normalized by the population of White children aged 5–14. The population and urban variables are lagged by two years to accord with the election lag. Coefficients are from OLS regresssions with year fixed effects, except model 6, which does not include year fixed effects because the data are only available for one year. Robust standard errors are in parentheses.
+ p < 0.10, *p < 0.05.
With the limited data available, I do not find evidence that enslavers directed more school resources to competitive counties, nor do I find dispositive evidence that elites rewarded counties that elected them with greater margins. These results, together with non-slaveholders’ demonstrably limited role in electoral politics for most of the antebellum period, do not support the claim that elites targeted politically strategic counties. Rather, the results of the Underground Railroad analyses are consistent with my claim that elites targeted school funds to counties where the risk of slave escape was greater.
5 Patterns across the South, 1850
The paper has used novel data from North Carolina to support my argument that enslavers directed school funds to non-slaveholding Whites who lived where enslavers demanded more policing. Does the argument hold for enslavers across the South, or just those in North Carolina? I next present suggestive evidence that such a dynamic may indeed have operated across the South. Admittedly, a complete answer to this question would require additional data collection on state and local school funds in other Southern states, as well as an investigation into the prominent escape routes in each state. Such an effort is beyond the scope of this paper, but 1850 census data allow me to offer a preliminary answer.
North Carolina was not alone in favoring enslavers as the primary recipients of school funds. South Carolina formulated the distribution of charity school funds such that enslavers received more,Footnote 128 and from 1827 to 1847, Louisiana distributed education funds according to parishes’ voter population, which included only wealthy White men.Footnote 129 Alabama did not centrally allocate funds according to biased population measures, but still enslavers’ counties received more school revenue because the funding mechanism operated through “section 16” lands.Footnote 130 The value of sixteenth sections varied widely across the state and thus rendered the school system useless, according to Alabama's first state superintendent.Footnote 131 In his retirement, the superintendent offered a reflection inadvertently reminiscent of the opposition to North Carolina's Literary Fund disbursements:
There were many hundreds of townships whose school lands were totally valueless … [and] these sections of the State contained a White population at once the densest and the most needy. The townships having the largest school endowments were found chiefly in the Tennessee Valley, and in the central portion of the State known as the black belt. [The funds] belonged to those who were in least need of aid; and … many of the most richly endowed townships were covered with cotton plantations and negro (sic) quarters, and had no schools at all.Footnote 132
A 1915 analysis by the federal Bureau of Education agreed. It concluded that Alabama's 15 wealthier counties received $1.59 per child in 1850, while the 15 poorer counties had $1.49 per child.Footnote 133 Using census data, I confirm that this pattern was present across the South: areas with larger enslaved populations had more resources for public schools.
5.1 1850 census data and analysis
The 1850 census reports the number of teachers, buildings, students, and income by type of school (public or private) for each county. I quantify school resources as the number of teachers and the amount of funds from local and state governments.Footnote 134 I use number of teachers, rather than schools, because the ongoing costs of operating a school were teacher pay and certification. Building construction, on the other hand, was a fixed cost, and many of the structures used for schools were built before states mandated public education.Footnote 135 I employ three outcome measures from the 1850 census: state funds per White child, the sum of state and local funds per White child, and class size (pupils per teacher).Footnote 136 Note that smaller class sizes indicate more resources, because there are more teachers for the student population.
To reduce the potential for omitted variable bias, I control for total population and improved farm land as a share of total farm acreage. Large enslaved populations were undoubtedly associated with more agricultural investments, and so improved farm acreage is a confounder if state and local governments also favored economically active areas in allocating government resources. See summary statistics in Table 8.
 \begin{equation}y_i^3 = {\beta _0} + {\beta _1} \cdot {x_i} + {\beta} \cdot {{\mathbf{Z}}_i} + {\alpha _s} + {\varepsilon _i}\end{equation}
Summary Statistics, 1850 Variables

Data are from the 1850 census. Unit of observation is the county. States included are Alabama, Arkansas, Florida, Georgia, Louisiana, Mississippi, North Carolina, South Carolina, Tennessee, and Virginia.
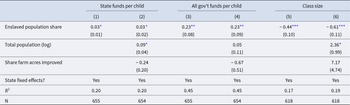
I estimate equation 3, where outcome  ${y^3}$ is school resources—either class size or funds per White child—in county $i$ and the explanatory variable of interest ${x_i}$ is the number of enslaved persons per adult White male. The full specification includes controls ${{\mathbf{Z}}_i}$—total population and improved farm acreage—and state fixed effects ${\alpha _s}$. Table 9 shows that more densely enslaved counties enjoyed significantly more public school resources. There is a positive relationship between enslaved population and school funds, whether measured as only state disbursements (models 1–2) or as the sum of state funds and local tax revenue (models 3–4), and there is a negative relationship between enslaved population and class size (models 5–6).Footnote 137 In Online Supplementary Material, Appendix I, I separately estimate the relationship between enslaved population share and school funds (as in model 3 in Table 9) for each state. I find that almost all states demonstrate a positive relationship, and most effects are statistically distinguishable from zero.
Relationship between Enslaved Population Share and School Funding, U.S. South, 1850

Coefficients are from OLS regression with state fixed effects. Funds are normalized by the population of White children aged 5–14. Robust standard errors are in parentheses.
+ p < 0.10, *p < 0.05, **p < 0.01, ***p < 0.001.
The census data indicate, therefore, that North Carolina was not the only state where enslavers received significantly more public school funds, even though they did not send their children to those schools. In fact, this was a region-wide phenomenon. Future research may explore if in other states, like in North Carolina, proximity to escape routes was also associated with more school funds.
6 Conclusion
In the antebellum South, enslavers’ methods of securing their wealth and power required the participation of non-slaveholders. I posit that elites attempted to co-opt non-slaveholding Whites by providing them with public goods. I test this hypothesis with a novel dataset on North Carolina school funds from 1840 to 1860. The data are clear: enslavers’ counties received more public school funds, even though enslavers did not send their children to public schools. I also present evidence supporting my hypothesis that enslavers directed school funds to neighboring Whites because elites sought their cooperation in policing enslaved Americans; I find that elites raised more school funds in counties where many enslaved Americans could access escape routes. Moreover, elites did this by raising taxes on themselves. The results exemplify how elites use public resources to secure the allegiance of in-group members, ultimately preserving their own power and undermining class-based coalitions.
6.1 Limitations and future research
While I do find suggestive evidence that other states also provided significantly more school funds to enslavers’ counties, North Carolina was admittedly unique among Southern states in the success and expanse of its antebellum public school system.Footnote 138 My theory, however, is not limited to school funds. Rather, I argue that public school funding was a convenient means for targeting strategically valuable constituents, given prevailing national trends and grassroots demands. Elites in states with less robust education systems, or in earlier decades, may have conceded other policy areas, like wages or labor protections. Future research may uncover if Southern elites acquiesced to these or other policy demands when and where they most needed non-slaveholding Whites for surveillance and security.
Nonetheless, targeted school funds, or any publicly provided good, could not have disincentivized non-slaveholding Whites from shirking their policing obligations.Footnote 139 If a school was available, children could attend regardless of their parents’ participation in patrols and ad hoc surveillance. Thus, a rational individual would avail himself of the school resources and shirk on policing. Why, then, did elites provide targeted school funding? First, elites may have found it more efficient to pay off non-elite Whites with a combination of public and private goods, rather than through private transfers alone. Recall that previous scholarship has shown that it is cost-effective to buy off a large group with public goods.Footnote 140
Second, the provision of school resources may have cultivated a sense of gratitude or indebtedness among non-slaveholders. Then, obligation to their racial group could have mobilized non-slaveholders to participate in surveillance and security. While there is ample evidence on the effect of social stratification on public good provision,Footnote 141 scant research has addressed the potential effects of targeted government programs on group identity.Footnote 142 Future research may investigate the direct relationship between individuals’ receipt of public goods and their identification with the dominant group.
While in this paper I have considered if elites strategically targeted public funds to areas where they were most concerned about slave escape, careful readers may wonder if elites’ strategy worked: did non-slaveholding Whites who received more public school funds police enslaved Americans more effectively? Unfortunately, there are a number of empirical hurdles to overcome in order to ascertain the effectiveness of antebellum policing and repression strategies. Note first that a successful repression strategy would be one that reduced the number of escape attempts, the number of successful escapes, or the costs required to maintain a given rate of recapture. Thus, quantifying the efficacy of policing policies requires a measure of escapes. A comprehensive record of escape attempts does not exist, but recent work by LawrimoreFootnote 143 may provide a framework for uncovering the number of escape attempts with data on existing runaway slave ads and records of successful escapes. It is also reasonable to consider that if the school funds strategy was successful, then enslavers would not need to purchase as many runaway slave ads; so, trends in ad purchases would reflect the effectiveness of school funds. This would only be the case, however, if the strategies were substitutes. Alternatively, we might expect to observe counties increase the size of patrol rosters if the school funds strategy was successful. This would be the case if the strategies were complements. Whether policing strategies were substitutes or complements is a theoretical and empirical question that future work may endeavor to answer.
The answer to the question of efficacy will certainly provide important context for my findings. If future work finds that areas that received more school funds were subsequently better at repressing escape, we could conclude that enslavers were right: public goods are an effective way to encourage a large group of people to take pro-regime actions. The opposite finding—that school funds are not associated with more effective or cheaper policing of escape—however, would be perhaps more consistent with the long history of policing enslaved Americans. Throughout the 18th and 19th centuries, enslavers experimented with a range of strategies for repressing escape and resistance. Yet, these strategies were not uniformly effective.Footnote 144 Franklin and SchweningerFootnote 145 observe, for example, that the laws enslavers designed “to control the movement of slaves … did not always work smoothly in practice.”Footnote 146 Future research may reveal that school funds were another such strategy that did not work as envisioned. Such a result, however, would not invalidate my finding that, in the last decades of the antebellum period, enslavers directed more school funds to the areas where they wanted more policing.
6.2 Implications for the study of American political development
Many scholars of American political development agree that White supremacy is foundational to America's historical political institutions.Footnote 147 My findings may offer new perspective on two key findings in this literature.
Du Bois established the now-canonical argument that the “public and psychological wage” of Whiteness offsets non-elite Whites’ economic concerns.Footnote 148 Building on Du Bois's observation, scholars have underscored how poor Whites’ attachment to racial identity reinforces the elite status quo.Footnote 149 I, however, share Bateman’sFootnote 150 view that “consensus on White supremacy” alone does not preserve elite Whites’ power. I show that elites have not simply relied on such a consensus or the psychological benefits of Whiteness; rather, they have offered government benefits to non-elite Whites where elites were most vulnerable.
This result complements another key insight in the literature. MorganFootnote 151 and HerronFootnote 152 argue that advances in rights for Whites have historically accompanied restrictions for Black Americans. I document a variation of this pattern in the antebellum South, with poor Whites receiving more school funds as enslavers sought to further repress enslaved Americans. Thus, it may be that the subjugation of Black Americans coincides with not only symbolic and legal privileges for Whites, but also material gains.
Targeted government resources is but one of many strategies White elites have employed to consolidate and maintain power. Identifying and analyzing such strategies is a necessary and fruitful endeavor for political scientists.
Supplementary material
The supplementary material for this article can be found at https://doi.org/10.1017/S0898588X25100254.
Acknowledgements
For helpful comments, I thank Amy Catalinac, Sanford Gordon, Catherine Hafer, Jeffrey Jensen, Rod Kiewit, Rajeshwari Majumdar, Robert Mickey, Bryant Moy, Agustina Paglayan, David Stasavage, James R. Vreeland, Elisa Wirsching, two anonymous referees, and participants at New York University's American Political Economy workshop, APSA 2022, and SPSA 2023. Alexis Nwatu and Sally Beth Brown provided superb research assistance.
Funding
This paper received funding from the Institute for Humane Studies (grant no. IHS017464) and New York University.








 Open access

