


1. Introduction
Identifying customer needs presents a challenge in product design and development because these needs are dynamic and often challenging to define (Reference Li, Liu, Lu, Zhang, Li and YuLi et al., 2021). A wide range of methods exists for collecting and classifying user requirements, from traditional surveys to advanced data-driven techniques. In recent years, the rapid growth of user-generated content, such as blogs, tweets, and online product reviews, has created new opportunities for companies to gain insights directly from their customers (Reference Hou, Yannou, Leroy and PoirsonHou et al., 2019; Reference Camargo, Palominos, Marche, Toledo, Boly and AlfaroCamargo et al., 2021). Reviews on e-commerce platforms, social media, and forums serve as a rich, real-time source of feedback on personal evaluations of product features, which can inform design decisions (Reference Ahrens and HehenbergerAhrens & Hehenberger, 2015). However, fully exploiting the potential of user-generated content is not straightforward. Three main challenges arise: (1) these data are unstructured, making analysis difficult; (2) the volume of available text is vast, rendering manual interpretation impossible; and (3) there is a persistent need to incorporate insights into established theoretical frameworks that guide design choices (Reference Albers, Zimmermann, Marthaler, Bursac, Duehr and SpadingerAlbers et al., 2021; Reference Koomsap, Dharmerathne and Hussadintorn Na AyutthayaKoomsap et al., 2023; Reference Wassenaar, Chen, Cheng and SudjiantoWassenaar et al., 2005; Reference Atlason, Stefansson, Wietz and GiacaloneAtlason et al., 2018). Although natural language processing (NLP) techniques have advanced considerably (Reference Sarica, Han and LuoSarica et al., 2023), partly due to the advent of Large Language Models (LLMs) that excel at identifying product attributes (Reference Chiarello, Barandoni, Škec and FantoniChiarello et al., 2024) and capturing customer sentiments (Reference Zhou, Ayoub, Xu and YangZhou et al., 2020; Reference Joung and KimJoung & Kim, 2021), a critical gap remains: how to systematically link data-driven insights to design models for representing product features, such as the Kano model (Reference Qu, Ren and WuQu et al., 2024; Reference Hou, Yannou, Leroy and PoirsonHou et al., 2019; Reference Borgianni and RotiniBorgianni & Rotini, 2015). The Kano model has been widely used to categorise product attributes based on how their fulfilment or absence influences customer satisfaction (Reference Atlason, Stefansson, Wietz and GiacaloneAtlason et al., 2018; Reference Kumar, Singh and KatariaKumar et al., 2024). Prior research has shown that integrating user perceptions with Kano classifications provides a structured method for prioritising design features and aligning product configurations with evolving customer expectations (Reference Hou, Yannou, Leroy and PoirsonHou et al., 2019).
Nevertheless, studies linking automated data extraction from large-scale user reviews to the Kano model remain limited, with many approaches still relying on manual filtering or failing to capture the complexity of continually changing customer sentiments (Reference Li, Sha, Li, Wang, Dong, Feng, Zhang and ChenLi et al., 2023; Reference Camargo, Palominos, Marche, Toledo, Boly and AlfaroCamargo et al., 2021). This paper addresses three key challenges in using user‑generated content for design decisions: (i) reliably extracting product features from unstructured reviews at scale, (ii) attributing sentence‑level sentiment to those features, and (iii) coherently integrating data‑driven evidence into an established design framework. We present an end-to-end pipeline that detects features, assigns aspect-level sentiment using large language models (LLMs), and maps the effects on customer satisfaction into a Kano-style representation. Our focus is on smartphones as a case study. The following research questions guide our work:
-
• RQ1: How accurately can important product features be extracted and assigned sentiment labels from extensive collections of online reviews?
-
• RQ2: How do feature‑specific positive versus negative sentiments relate to star ratings?
-
• RQ3: How can these relationships be visualised and classified within a Kano framework to inform design prioritisation?
The rest of the paper is organised as follows: Section 2 reviews the relevant literature on NLP in design, methods for product feature extraction, and the Kano model. Section 3 describes our methodology. Section 4 presents the results and explains how they can be interpreted through the Kano model. Finally, Section 5 concludes and suggests directions for future research.
2. LLMs and NLP in design
In engineering design, the increasing availability of user-generated content (such as online product reviews) has made NLP more essential for extracting meaningful insights. Among the various NLP techniques employed, Aspect-Based Sentiment Analysis (ABSA) has emerged as a key method for extracting detailed opinions about specific product features (Reference Zhou, Ayoub, Xu and YangZhou et al., 2020; Reference Joung and KimJoung & Kim, 2021). Unlike traditional sentiment analysis, which classifies an entire review as positive or negative, ABSA breaks down text into individual aspects (e.g., “display,” “battery”) and assesses the sentiment expressed towards each one, providing more actionable detail.
A variety of ABSA-related tasks have been developed. Aspect Term Extraction identifies mentioned product attributes, Aspect Category Detection groups these attributes into broader categories, Opinion Term Extraction locates the opinion words linked to each aspect, and Aspect Sentiment Classification determines the polarity (positive, negative, neutral) associated with these aspects (Reference Hou, Yannou, Leroy and PoirsonHou et al., 2019). Approaches to ABSA have advanced from early rule-based and statistical methods to more sophisticated supervised, semi-supervised, and unsupervised strategies. Recently, LLMs like BERT and RoBERTa have significantly improved ABSA performance by capturing complex linguistic and domain-specific nuances (Reference Zhou, Ayoub, Xu and YangZhou et al., 2020; Reference Qu, Ren and WuQu et al., 2024). Nonetheless, significant challenges remain, including accurately linking sentiment elements to their respective aspects and generalising models across different domains and contexts (Reference Li, Sha, Li, Wang, Dong, Feng, Zhang and ChenLi et al., 2023).
Parallel progress in product feature extraction has focused on enhancing the identification of key product attributes through methods such as Latent Dirichlet Allocation (LDA) with automated keyword filtering and ontology-based clustering (Reference Li, Liu, Lu, Zhang, Li and YuLi et al., 2021). More recently, LLMs have demonstrated the ability to handle even more complex tasks, providing zero-shot or few-shot predictions without the need for extensive domain-specific fine-tuning. This advancement promises to streamline feature extraction and ABSA, providing designers with scalable, adaptable solutions that keep pace with rapidly changing consumer feedback.
In summary, the interplay between ABSA and advanced NLP models offers a powerful approach for data-driven, customer-focused product design. The following section describes how we employed these techniques to extract and classify product features in the Kano model automatically.
3. Methodology
Our methodology consists of three stages. First, we gather and clean reviews from the Amazon Review Data (2018), focusing on the “Cell Phones and Accessories” category and filtering for phones only, not accessories. Second, we extract potential features from review texts and compile them into a domain ontology that is expanded using distributional similarity. Third, we assign sentence‑level sentiment to each feature mention using instruction‑tuned LLMs. We then model the relationship between the distribution of positive and negative feature mentions and the overall star rating, ultimately projecting these effects onto a Kano‑style map.
3.1. Data collection and cleaning
For the study, the Amazon Review Data (2018) was utilised, a publicly available dataset comprising a wide range of customer reviews along with detailed product information. The dataset covers reviews from May 1996 to October 2018, totalling 233.1 million reviews. These reviews are divided into two separate collections: Review Data and Product Metadata. Product categories further categorise each collection.
After analysing various categories, the decision was made to focus on the “Cell Phones and Accessories” category, which includes 10,063,255 reviews and 590,269 products. This category was chosen because cell phones are highly functional products, and the market is both dynamic and highly competitive, resulting in a large volume of reviews and diverse customer feedback. Additionally, we selected this dataset because another study addressed a similar problem using a comparable dataset (Reference Park, Joung and KimPark et al., 2023).
Once the datasets were collected, data cleaning operations were performed, including the removal of duplicate entries, discarding redundant variables that would not contribute to the analysis, and selecting only reviews related to phones, while excluding those for accessories (such as covers, screen protectors, etc.). The output of this phase consists of two datasets: one containing 1,124,986 reviews and another with information on 48,172 products, both of which are cleaned and ready for analysis.
3.2. Product features extraction
Product features are generally nouns or noun phrases in review sentences (Reference Huang, Liu, Wang and WangHuang et al., 2022). Therefore, Part of Speech (POS) tagging was performed on the reviews to identify the tag of each word (e.g., noun, adjective, verb). Once completed, it was possible to extract nouns and noun phrases, resulting in a dataset containing 74,893 unique nouns, all of which were potential product features extracted from the reviews.
After obtaining all potential product features, the aim was to classify each noun as a product feature or not. The main challenges were: (1) a noun may not be a product feature, and (2) the same product feature could be expressed by multiple terms (synonyms or semantically similar words).
To address challenge (1), a product features ontology specific to the Cell Phone case was created. An ontology is a structured collection of recognised product features. It acts as a “classifier” for the nouns extracted from the reviews. However, creating a comprehensive ontology with all possible terms for expressing a product feature is costly and impractical, as it would not be readily applicable across different product categories. For this reason, a manual list of phone-related product features was initiated. The manual creation of the ontology introduced another issue: relying solely on initial product features might result in missing some features mentioned by users, thus excluding them from the analysis.
To overcome challenge (2) and the limitations of manual ontology creation, word embeddings were employed. A word embedding represents a word as a real-valued vector, capturing its meaning such that words closer in the vector space are likely to share similar meanings.
Embeddings were generated for each product feature in the ontology and for each noun extracted from the reviews. A Word2Vec model, pre-trained on the Google News dataset with 300-dimensional vectors for 3 million words and phrases, was utilised. Each word or phrase was transformed into a 300-dimensional vector. The embeddings of the ontology’s product features served as a reference to classify the extracted nouns.
The goal was to identify nouns that not only matched those in the ontology but also included semantically similar words and abbreviations referring to the same product feature. Cosine similarity was calculated to measure the angle between two vectors in multi-dimensional space. Similarity was computed between each product feature in the ontology and each extracted noun. Cosine similarity indicates the semantic closeness between two words, ranging from -1 to 1. Words with a similarity near 1 are semantically close, those near 0 are less similar, and words near -1 are opposites.
Using a threshold of 0.65 for cosine similarity, nouns with a similarity above this value were assigned to the most similar product feature. This classification formed clusters of nouns around each product feature, containing semantically identical words.
These word clusters, starting from the ontology’s product features, addressed challenge (2) by including related words but also contained some noise: words that did not belong to any relevant cluster. This noise, however, was beneficial, as it indicated potential new product features not initially included, allowing for the expansion of the ontology with terms directly derived from the reviews.
This presented an iterative process that was repeated multiple times. After assigning nouns to product features, the precision was evaluated on 100 words identified as product features by the algorithm. One of the authors assessed whether each word was genuinely a product feature. If precision fell below 65%, the noise was used either to add new product features to the ontology or to refine existing ones, creating different clusters. This process continued until the desired precision threshold was met for each cluster. At the end of this iterative cycle, an ontology comprising 82 product features was developed, with clusters containing a total of 10,403 unique noun associations derived from the reviews.
Finally, it became possible to extract product features from the reviews by identifying terms within these clusters.
3.3. Sentiment evaluation
Once the product features were extracted from the reviews, the sentiment expressed in the sentence referring to the cited product feature was classified. For this task, an LLM was chosen due to recent advancements in these technologies within the field of NLP, as well as their ability to adapt to different contexts and domains. Using Google Colab and Huggingface, it was possible to implement and interrogate the models Mistral-7B-Instruct-v0.1-sharded and Llama-2-7b-chat-hf. Both are pretrained and fine-tuned generative text models, each with 7 billion parameters (larger versions would require more computing power than was available for this study). The decision to select models with 7 billion parameters was influenced by the limited computing power available. In fact, the free plan offered by Google Colab was used to run the models. If models with more parameters are used, an improvement in classification accuracy is expected, even if we do not anticipate changes in the comparisons between the two. LLaMA 7B and Mistral-7B-Instruct-v0.1-sharded are both LLMs designed for various NLP tasks, but they have distinct architectures and characteristics. Both models were provided with inputs such as the sentence from which the product features are extracted and one or more product features contained within the sentence itself. Various prompts for extracting sentiment were tested, including both Zero-shot and Few-shot prompts. The model that yielded the most consistent and correct outputs was Mistral-7B-Instruct-v0.1-sharded. The prompt that achieved the highest precision classified the sentiment correctly in 77% of cases. The output of this phase is a dataset containing 38,080 sentences, the extracted product features, and the expressed sentiment relating to each product feature.
4. Results
To explore the relationship between product features, sentiment, and overall customer evaluation, we operationalised the latter as the customer’s star rating on Amazon. This rating, ranging from 1 (poor) to 5 (excellent), succinctly reflects the user’s opinion of the product.
To assess the combined effect of the product features on the overall evaluation, a multivariate linear regression was conducted, with the star rating as the dependent variable and the product features as the independent variables. With 10.403 product features, it was necessary to reduce this number to facilitate a manageable interpretation of the parameters. The reduction process began by considering the clusters previously derived from the ontology and renaming various product features according to their primary features as listed in the ontology. For example, “battery life” was simplified to “battery,” indicating a feature related to the battery. This reduction decreased the number of distinct product features to 82. Since 82 remained too many for practical analysis, further clustering was carried out to group the features into macro-categories. To achieve this, the features were input into ChatGPT, which was asked to form clusters to create macro-categories that would facilitate comparison of different smartphones. Consequently, 10 clusters were created, grouping standard features- such as display resolution, colour, brightness, etc., under the category “Display and Screen. ” This approach resulted in a total of 9 overarching product features, making further interpretation feasible: Display, Camera, Hardware, Battery, Connectivity, Audio, Ergonomics, Operating Systems (OS), and Customer Service.
4.1. Multivariate analysis
At this point, seven regression models were developed, each differing in the independent or control variables included. Multiple models were generated to empirically advance the analysis, with the one explaining the most significant variance (R-squared) selected. For summarisation, only this chosen model is reported here.
The model was constructed by calculating, for each review, the percentages of product features mentioned alongside their corresponding sentiment (e.g., 20% of the features mentioned are “Audio” rated as “negative”). After these percentages were calculated, features evaluated with a “neutral” sentiment were excluded from further analysis.
The dataset developed exhibited an imbalance, with an over-representation of 5-star reviews, so a reduction was performed to balance it. Subsequently, a multivariate linear regression was conducted on the balanced data.
In the model, product features rated as positive or negative served as independent variables, while star ratings were the dependent variable. The product’s price was included as a control variable, facilitating a more precise understanding of the coefficients and considering possible variations in consumer expectations based on price. After analysing the correlations between variables, we confirmed that the model does not display multicollinearity. An examination of the residuals showed they follow a Gaussian distribution. Although the variance explained by the model is modest, at around 0.25, this is not a critical concern for this analysis, as the goal is not to predict star ratings but to understand the contribution of each product feature.
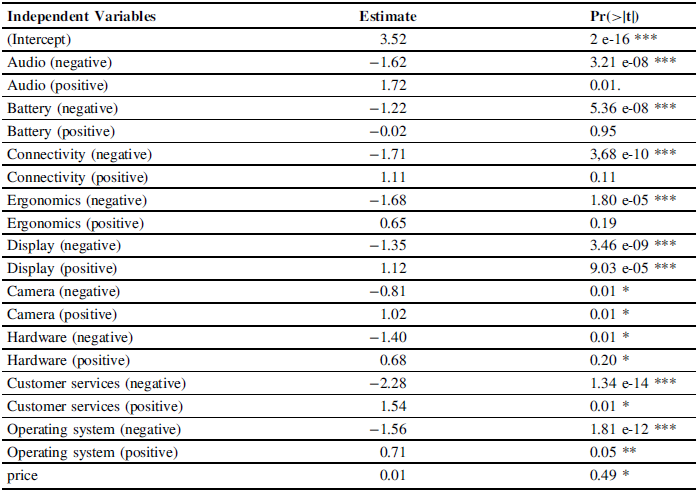
Coefficient estimates and significance levels from the multivariate regression model, indicating how positively or negatively evaluated product features (and their corresponding sentiment) influence the overall star rating

The coefficients in the regression model quantify the influence of each product feature on the overall star rating, assuming all other factors remain constant. Each coefficient indicates the expected change in star rating resulting from a one-unit increase in that variable. In practice, if a product feature has a positive coefficient, improving that feature generally enhances customer satisfaction and boosts the product’s rating; conversely, a negative coefficient suggests that deficiencies in that feature lead to a decrease in the star rating. Statistical significance, as shown by the p-values, indicates that most of these relationships are unlikely to be coincidental. In other words, the data strongly support that these product features affect how customers perceive and rate the product. The pattern is that features rated negatively tend to have negative coefficients, signalling a downturn in the rating when these features underperform. Conversely, features rated positively typically exhibit positive coefficients, increasing star rating when these features are well-designed. This finding aligns with intuitive expectations and confirms that the model captures real-world customer perception dynamics. It is noteworthy that negative evaluations exert a more substantial influence on the rating than positive ones. This asymmetry can be attributed to the “Negativity Bias” (Reference Bonaccorsi, Apreda and FantoniBonaccorsi et al., 2020), a well-established phenomenon in psychology.
Customers often weigh negative experiences more heavily than positive ones. For designers, this bias means that failing to meet expectations in a critical area can be more damaging than the potential benefits of excelling elsewhere. Therefore, it is essential to identify must-have or baseline features where the risk of negative experiences is high and ensure this meet at least a minimum standard. From a design perspective, these coefficients serve as a guide for resource allocation within design teams. Features with significant negative coefficients should be prioritised for fixing or maintained at a minimally acceptable level. For example, a weak battery or poor operating system stability can significantly diminish customer satisfaction. Designers should prioritise ensuring reliability and consistency in these areas before attempting to innovate or introduce new features. Conversely, features with strong positive coefficients, such as quality audio or enhanced connectivity, present opportunities for differentiation. By investing in these attributes, a design team can potentially elevate the product’s rating from average to above average, thus attracting more satisfied customers. While the numerical coefficients offer a precise measure of each product feature’s impact, it is often easier to interpret them within a visual and strategic framework. That is why we incorporate these coefficients into the Kano model, transforming linear regression outputs into a format that design teams can efficiently utilise to categorise features. This structured visualisation helps clarify whether a particular feature functions as a baseline necessity, a performance driver, or an attribute capable of delighting customers. The combined regression analysis and Kano interpretation presented in the following subsection enable designers not only to identify which levers to pull but also to gauge how forcefully to pull them, facilitating more informed product decisions.
4.2. Kano model
The Kano model is widely recognised as a powerful tool for understanding, prioritising, and classifying customer needs based on how well a product satisfies them. In its classic form, the model visualises needs on a two-dimensional diagram: the horizontal axis represents the degree to which a need is fulfilled, and the vertical axis shows the resulting level of customer satisfaction. From this, five categories of needs emerge: must-have (basic), one-dimensional (performance), attractive (exciting), indifferent, and reverse.
By extending this logic to product features, we can observe that each feature corresponds to one or more underlying needs. Consequently, mapping our regression results, which estimate how positively or negatively each feature influences the product’s star rating, fits naturally within the Kano framework. We plot two metrics: the change in star rating due to negative evaluations of features along the horizontal axis, and the change due to positive evaluations along the vertical axis. This reinterpretation, illustrated in Figure 1, transforms the traditional Kano diagram into a coordinate system where each feature’s position reflects its impact on customer satisfaction under both positive and negative conditions.
In this diagram, features that significantly increase satisfaction when delivered well, but do not notably decrease satisfaction if missing or poorly executed, fall into the “attractive” category. Similarly, features that both add and subtract satisfaction proportionally are considered “performance” attributes, and those that cause dissatisfaction if absent but offer little extra delight if present are “must-haves.” Using this reasoning, the classic Kano categories can be identified within the transformed diagram.
In our case study on smartphone features, we have chosen parameters such as α = 30° and β = 60° to divide the quadrant into regions aligned with Kano categories, and r = 0. 0.5 to define an “indifferent” radius threshold. This initial setup shows no “attractive” features, suggesting that the market may be moving towards commoditisation, where few features genuinely excite consumers. Such a snapshot helps designers identify where to focus efforts for differentiation and which features to optimise minimally to meet baseline expectations.
Kano-inspired classification of product features based on their estimated positive and negative impacts on overall customer satisfaction; each feature’s position reflects its contribution to satisfaction when present (vertical axis) and its penalty when lacking (horizontal axis)

It is important to note that the choice of parameters (e. g., α, β, and r) is not universal. These thresholds can and should be adjusted based on industry, product category, and strategic positioning. Conducting a sensitivity analysis, as we have done, highlights this flexibility. In Figure 2, for example, setting α to 26°, β to 39°, and r to 1.2 yields a more sensitive separation of features among Kano categories, offering a distinct strategic viewpoint. Ultimately, design teams can tailor these parameters to reflect their product’s unique context and desired outcomes.
Examining the diagram, we can infer the positioning of each product feature, indicating where designers might most effectively focus their efforts. The vertical (positive impact) and horizontal (negative impact) axes act as proxies for how the presence or absence of a feature influences overall customer satisfaction.
“Camera” is positioned closer to the attractive region, indicating that when executed well, it significantly boosts user satisfaction without causing considerable dissatisfaction if it underperforms. For designers, this suggests a strategic opportunity: investing in camera enhancements, whether image quality, stabilisation, or user interface, could lead to substantial gains in perceived value. Even small improvements might set a product apart from competitors, generating excitement among users.
Features like “Audio,” “Connectivity,” and “Customer Service” fall within the performance (or one-dimensional) category. Their position suggests a more linear relationship with satisfaction: the better these areas are, the happier the customer; however, any shortcomings in these areas directly diminish satisfaction. From a design perspective, this means focusing on continuous incremental improvements. For instance, refining audio quality or enhancing connectivity reliability will have a direct impact on user ratings. These features require ongoing innovation and optimisation, as higher performance correlates proportionally with increased customer satisfaction.
Features positioned near the must-have category (such as “Battery”) signify attributes that customers consider essential. If these features fall below a particular baseline, user satisfaction drops sharply; however, even significant improvements beyond the minimum acceptable level may not notably boost overall satisfaction. In design terms, this involves ensuring such features are robust, reliable, and meet user expectations. Over-investing in must-haves beyond the acceptable threshold might not be cost-effective. Instead, focus on establishing a solid baseline and directing substantial innovation efforts towards more rewarding categories, such as performance or attractive features. Finally, if certain features appear closer to the indifferent region, it indicates that their presence or absence has relatively little impact on customer satisfaction. Although it may be tempting to overlook these attributes, they still present strategic considerations. Designers could explore whether these features can be enhanced or combined with other aspects to shift them toward the “Attractive” or “Performance” categories. Alternatively, reducing complexity or cost in these areas (without compromising user experience) could help streamline the product.
Kano-inspired classification of product features using adjusted parameter settings with altered α, β, and r; this example illustrates how modifying these thresholds affects the placement of features into the “Attractive,” “Performance,” “Must-Have,” and “Indifferent” categories, thereby highlighting the sensitivity of the classification to parameter selection

5. Conclusion and limitations of the work
This paper introduced an integrated method for extracting product features from user-generated content and quantifying their impact on overall product evaluation through sentiment analysis. By embedding these findings within the Kano model, we demonstrated how feature-level sentiments can be translated into categories that reflect their influence on customer satisfaction. The approach provides a bridge between large-scale, data-driven customer feedback and the structured decision frameworks traditionally used in design research.
Despite these advantages, several limitations should be acknowledged.
First, the selection of thresholds and parameters for categorising product features into Kano categories, such as angular boundaries, radius values, or sentiment intensity cut-offs, remains partly subjective and context dependent. Although sensitivity analyses were performed with alternative parameter settings, the absence of a statistically grounded calibration procedure may limit the generalisability of the results. Future work should therefore focus on automating this calibration, for example, through optimisation algorithms or bootstrapped confidence regions that identify data-driven decision boundaries.
Second, the current implementation relies on linear regression to link sentiment-derived variables to ordinal star ratings. While adequate for exploratory interpretation, this choice does not fully capture the ordered nature of the dependent variable or potential nonlinearities between positive and negative sentiments. Adopting ordinal or mixed-effects models would enhance robustness and help account for unobserved heterogeneity among products and reviewers.
Third, the study’s empirical validation is restricted to a single domain (smartphones), which are characterised by abundant online feedback and rapidly evolving technology cycles. The applicability of the method to other product classes, especially those with limited or sensitive online reviews (e.g., sex toys, eyeglasses) or with scarce digital feedback (e.g., turbines, aircraft), remains untested. Cross-domain studies would clarify the extent to which the ontology- and sentiment-based components generalise beyond consumer electronics.
Fourth, the method depends heavily on the quality, representativeness, and temporal coverage of online reviews. Biases in reviewer demographics, overrepresentation of extreme opinions, and market-specific language can distort the extracted features and their associated sentiments. Temporal drift is another concern: reviews collected over a two-decade period may reflect shifting user expectations and product standards. Addressing these issues will require either time-window analyses or explicit modelling of temporal effects.
Fifth, the evaluation of the natural language processing components was conducted on relatively small, single-annotator samples. Broader validation using multi-annotator datasets, inter-rater reliability measures, and public release of code and ontology resources would substantially strengthen reproducibility and transparency. Likewise, comparing LLM-based sentiment classification with smaller domain-specific models could help assess trade-offs between scalability and accuracy.
Finally, the present work does not yet consider heterogeneity in customer segments or purchasing contexts. Integrating clustering or persona-based analyses could reveal how different user groups perceive product features, enabling more targeted product strategies. Combining this segmentation with temporal analyses may further uncover how needs evolve, supporting continuous product improvement and long-term roadmap planning.
In summary, while the proposed pipeline provides an accessible and theoretically grounded means of connecting online customer feedback to design-relevant insights, further methodological refinement and cross-domain validation are needed before the approach can be generalised. Nevertheless, these limitations open rich opportunities for future research at the intersection of data-driven design analytics and customer experience modelling.
Acknowledgement
This work was partly funded by the DETAILLs Project (DEsign Tools of Artificial Intelligence in Sustainability Living LabS) - European Union. Erasmus + KA2 - Cooperation partnership in higher education (Project Number: 2023-1-IT02-KA220-HED-000158755).


 Open access

