


In well-governed countries, citizens routinely provide critical information directly to governments in ways that enable specific adjustments to the implementation of public programs. For instance, Cleary (Reference Cleary2007) shows that citizen participation between electoral cycles explains more of the performance of local governments than does the threat of electoral sanctioning. Yet we lack understanding of how routine and direct citizen engagement can be initiated and sustained, especially where citizens expect little of government.
For their part, governments often lack actionable information about where services should be extended, where public works are failing, and where government employees or contractors are shirking. These information problems contribute to the substandard provision of public services. From direct experience, citizens hold information about deficient services and can direct governments toward precise corrections, but they will not share their information if they expect officials to ignore it. We thus identify a key problem – the disengagement dilemma – that stymies information flows between citizens and governments.
In light of this dilemma, we investigate how citizens can be motivated to provide routine and direct information to governments. In some circumstances, governments can invest in self-monitoring systems, but it is often more efficient to rely on information from citizens as a co-production strategy (Ostrom Reference Ostrom1996), especially in the age of widely available communication technologies. Furthermore, when citizens provide information, officials can build political support by being responsive to their concerns (McCubbins and Schwartz Reference McCubbins and Schwartz1984).
We theorize that citizens' provision of routine information to government about public services hinges on their beliefs about the expected value of reporting. These beliefs might strengthen or weaken based on (1) the social connectedness of the individuals and (2) their beliefs about the probability of government responsiveness. We hypothesize that community networks might select and motivate reporters who place a higher value on the community's welfare. We also theorize that a combination of (a) communicative responsiveness, in which governments acknowledge citizen engagement and attribute improvements in public services to their reports, and (b) active responsiveness, in which attempts are made to improve public services based on reports, will help sustain citizen engagement.
We test these expectations in two pre-registered field experiments targeting improvements in solid-waste services that were conducted in close partnership with the Kampala Capital City Authority (KCCA), the government of Uganda's capital city. Our research team recruited citizen reporters and prompted them to send reports over a number of months to the KCCA about waste services. We thus study a crowdseeding platform, in which specific reporters are selected to provide information, rather than an open crowdsourcing platform to which anyone can submit information (Van der Windt and Humphreys Reference Van der Windt and Humphreys2016), allowing us to study treatments aimed at individual-level selection, motivation and beliefs.
Solid waste is a major challenge in Kampala, since most trash is burned openly or discarded into informal dump sites (Kinobe et al. Reference Kinobe2015). A large majority of Kampala residents are concerned with poor waste services (Appendix A). The KCCA wanted to improve, but faced the challenge of soliciting information from citizens about where collections were being skipped and where whole-neighborhood clean-ups were needed.
In our first set of treatments, we employed community nominations and recognition to select and motivate reporters. These treatments allow us to investigate whether community networks can be used as tools to initiate and sustain reporting, building on research about peer selection (Nowell et al. Reference Nowell2016) and motivation (Pedersen Reference Pedersen2015).
In a second type of intervention, we randomly assigned some reporters to experience both communicative and active responsiveness from government. Communicative responsiveness was signaled through specific acknowledgements that reports were received, processed and acted on by the KCCA. Active responsiveness involved the KCCA compiling and executing weekly action plans to address reports. We expected that both types of responsiveness would be necessary to drive engagement, since both the attribution and credibility of responsiveness are necessary to maintain beliefs among reporters that their effort is well spent.
We found no evidence that any of the social-connectedness interventions involving community nominations or recognition increased reporting. Our results are surprising, given the findings from multiple prior studies which suggest that community networks can be leveraged to generate prosocial behavior (Brady, Lehman Schlozman and Verba Reference Brady, Schlozman and Verba1999; Kim et al. Reference Kim2015; Nowell et al. Reference Nowell2016). In contrast, we find that government responsiveness boosted actionable and usable reports over a period of months. The effects of responsiveness increase as time elapses, providing evidence that reporters are continuously updating their beliefs about whether government will act on their reports. For citizens who were recruited more recently, responsiveness causes reporters to submit more low-quality reports, highlighting that the main benefits of responsiveness arise over longer periods.
Building responsiveness into governance arrangements might sustain participation and information sharing that has proved more important than other signals received by governments (Cleary Reference Cleary2007). As a key contribution, we provide foundational evidence of the role of responsiveness in sustaining engagements between citizens and governments. We also show that reporting on public services does not appear to depend on social connectedness or recognition, which implies there are opportunities to broaden the types of people who interact with governments.
Theory
We argue that citizens will evaluate the expected benefit of sharing information in terms of their belief about the probability of receiving a response from government and the value of the requested action. Further, citizens will weigh those expectations against the cost of reporting to officials (see Sjoberg, Mellon and Peixoto Reference Sjoberg, Mellon and Peixoto2017). Citizen reporting will therefore increase as beliefs about government responsiveness improve, as the value of the government response increases, and as reporting costs decrease.
As authors such as Fox (Reference Fox2015) and Mansuri and Rao (Reference Mansuri and Rao2013) argue, in order to sustain engagement, monitoring efforts should focus on strengthening feedback loops between citizens and governments. However, where public services are substandard and governments have limited capacity, many citizens believe that governments will not respond positively or effectively to their concerns. Using Afrobarometer data, Bratton (Reference Bratton2012) finds that citizens in many countries generally have poor views of both the capacity of governments to deliver high-quality services and the likelihood that officials will respond to their concerns.
The lack of opportunity to update beliefs in such settings will entrench disengagement. When people do not report to governments because their beliefs about the probability or value of responsiveness are low, they will have few opportunities to update their beliefs. And when governments do not have specific information on service quality, they will likely face difficulties improving services. Thus, in many cases, both citizens and governments will be trapped in this low-information equilibrium, even if both would like to break out. Governments that want to initiate feedback in settings where citizens expect little will need to find remedies to this adverse cycle of disengagement.
Mass communication technologies have significantly increased the potential for governments to engage with the public to deliver public goods (Noveck Reference Noveck2017), yet little evidence has been systematically collected on the effectiveness of initiating and sustaining feedback using these new tools. We test three main approaches that might overcome the disengagement dilemma.
Selecting Reporters
Research suggests that people who are more central in social networks will be more likely to act prosocially on behalf of that network because of the higher salience of collective identity (Putnam Reference Putnam1995). Additionally, individuals with more social ties generally have more reasons to internalize social values and more opportunities to act in a prosocial manner (Wasko and Faraj Reference Wasko and Faraj2005). For example, related research finds that individuals with relatively high prosocial motivations undertake the bulk of online participation in governance (Budhathoki and Haythornthwaite Reference Budhathoki and Haythornthwaite2013). Lab-in-the-field experiments in Uganda show that individuals with strong group attachments who are in positions of community leadership display greater prosocial behavior in dictator games (Baldassarri and Grossman Reference Baldassarri and Grossman2013). These findings imply that selecting for community-oriented and socially connected individuals might increase reporting.
We leverage neighborhood-level social networks by asking neighbors and community leaders to nominate trustworthy individuals to fill reporter positions. While research on the role of social networks in governance has found that they create opportunities for citizen engagement (Berardo and Scholz Reference Berardo and Scholz2010), few studies actively leverage community networks to select citizens for participatory governance.
Nevertheless, the available evidence suggests that people can identify prosocial individuals in their networks. Closest to the present study, Kim et al. (Reference Kim2015) reported that using ‘friend nominations’ to select community members to distribute coupons for subsidized health-related goods resulted in higher uptake compared to relying on randomly selected individuals or those with the most social ties. Nowell et al. (Reference Nowell2016) find that individuals who are identified as playing an ‘active and sustained advocate role’ by their peers tend to themselves report high levels of duty to their social groups. And as Brady, Lehman Schlozman and Verba (Reference Brady, Schlozman and Verba1999) theorize about recruitment into political activity, people who are closer to prospective participants have advantages in selecting people who are most inclined to engage. Nominators can maximize their benefit by choosing reporters who are most likely to prosocially serve the community.
We test nominations by both neighbors and community leaders because the logic of selection may be different. Neighbor nominations might work by reaching community-oriented individuals spread throughout the entirety of social networks. Alternatively, leader nominations may have advantages in selecting higher-skilled and influential reporters or in implying increased social obligation about reporting. Reporting brings very little excludable, personal benefit (other than the very small chance of winning a modest lottery), so we see no reason why leaders would nominate reporters as a clientelistic benefit. Instead, leaders should be motivated to gain the rewards that come with securing improved services for their constituents. Elected community leaders are also at the center of neighborhood-level social networks, which might provide them additional links to responsible and prosocial individuals.
Motivating Reporters
Beyond selecting reporters, we expect that public announcements that offer social recognition can motivate reporters to be more active. Previous work has found that non-monetary rewards are more effective at motivating prosocial behavior than financial incentives (Ashraf, Bandiera and Jack Reference Ashraf, Bandiera and Jack2014). Studying Wikipedia contributors, Gallus (Reference Gallus2017) found that, even though most editors volunteer their efforts under usernames that cannot be connected to their real identities, offering a symbolic badge for participation boosted retention by 20 per cent over one year. In a fixed-wage task experiment, Kosfeld and Neckermann (Reference Kosfeld and Neckermann2011) learned that the chance to be awarded a purely symbolic card signed by the president of the organization significantly boosted achievement. These kinds of results speak to more general recognition of how social acknowledgement and status drive public behavior (for example, Besley and Ghatak Reference Besley and Ghatak2008, McClendon Reference McClendon2014; McCullough et al. Reference McCullough2001). To our knowledge, however, social recognition of prosocial behavior has not been researched when it comes to the contributions that community members make to public goods.
Responding to Reporters
Finally, if it is possible to credibly raise beliefs about the probability that governments will be responsive to reports, then citizens should be more likely to engage. Sjoberg, Mellon and Peixoto (Reference Sjoberg, Mellon and Peixoto2017) find that experiencing a response to a report of road disrepair in the United Kingdom positively affects both short- and long-term engagement in submitting additional reports. Yet generalizing this responsiveness finding requires replicating such results in settings where governments are weaker and publics are likely to have higher levels of distrust. Additionally, providing clearly exogenous responsiveness through randomized treatments can rule out the possibility that governments are predisposed to be responsive to the types of reporters who are most motivated to engage in providing information (see also Trucco Reference Trucco2017).
Pilot research in developing countries has explored new tools to improve responsiveness to feedback from citizens (Golden, Gulzar and Sonnet Reference Golden, Gulzar and Sonnet2017). In Uganda, Grossman, Michelitch and Santamaria (Reference Grossman, Michelitch and Santamaria2017) explore how citizens can be motivated to report deficiencies in public services via SMS texts to local politicians. As an experimental treatment, the researchers sent messages to study subjects from local officials encouraging them to report deficient public services, and found that the rate of citizens who used the platform at least once over a six-month period increased from approximately 3.4 per cent in the control group to 4.7 per cent in the treatment group. We take this design further by varying responsiveness from government, rather than just encouragement from officials.
Our argument that reporters are continuously updating their beliefs about the value of reporting implies a temporal dynamic to the treatment effects of responsiveness. In particular, we posit that each reporter evaluates whether reporting is worth their effort at each point in time. Like the theory outlined by Sjoberg, Mellon and Peixoto (Reference Sjoberg, Mellon and Peixoto2017), we expect this evaluation to be based on each reporter's belief that their report will prompt government action and the value they place on that action. Responsiveness should have little impact initially, since reporting is mostly driven by reporters' prior beliefs. However, with each report submitted, the reporter updates her beliefs about the probability of receiving a response. Over time, even the most motivated and community-oriented reporter will cease reporting if she believes there is no response. Thus differences in reporting rates between reporters who do and do not experience responsiveness should grow larger over time because the prior beliefs that drive initial reporting will diverge.
Note that a responsiveness intervention should optimally be designed to enhance personal efficacy – the belief that the government is responsive to the individual reporter's information – thereby increasing the expected value of reporting. Importantly, communicative responsiveness lets citizens know that governments hear them individually. After all, intensifying anticipation of responsiveness to others' reports may backfire by inducing free-riding. Crowdseeding – which involves recruiting specific reporters into positions, usually in pursuit of representative information coverage (see Van der Windt and Humphreys Reference Van der Windt and Humphreys2016) – is particularly useful as a tool to test a responsiveness treatment, since reporters should have low expectations of being able to free-ride as they might in an open crowdsourcing platform with many potential reporters.Footnote 1
Pre-Registered Hypotheses
Based on these theoretical considerations, we pre-registered the following hypotheses:Footnote 2
Hypothesis 1a
Nomination by neighbors will increase reporting.
Hypothesis 1b
Nomination by local council chairs will increase reporting.
Hypothesis 2
Announcement by the local council chair recognizing reporters will increase reporting.
Hypothesis 3
Responsiveness to citizen reports will increase reporting.
Experimental Design
Setting
Like many other parts of the world, Kampala, Uganda faces challenges in providing waste management (Okot-Okumu and Nyenje Reference Okot-Okumu and Nyenje2011; Oteng-Ababio Reference Oteng-Ababio2010; Katusiimeh, Mol and Burger Reference Katusiimeh, Mol and Burger2012). In recent years, the KCCA has outsourced this service to private companies for most areas of the city, while maintaining oversight responsibility. For example, it sets expectations and levies penalties on companies that do not address citizen complaints.
According to the contracts, private companies are allowed to enter into agreements with households for door-to-door services and set rates for these services, but they must also establish and service community collection points within at least 500m of every household in their concession area so that every resident has a managed option to dispose of waste regardless of their income. The contractors are supposed to manage zone-wide clean-ups as necessary. In practice, companies have almost entirely failed to establish and service community collection points, and the KCCA faces significant challenges in identifying the locations of shirking by contractors. Our pre-experimental survey shows that 90 per cent of Kampala residents are personally concerned with solid waste management (Appendix A), indicating that oversight is largely failing.
The KCCA has prioritized improving solid waste management to boost resident satisfaction and promote public health. However, despite having used public resources to develop an interactive SMS platform and a mobile application to exchange information with citizens, the KCCA struggled to use its technological investments to exchange useful information with the public. In addition to its nascent messaging system, citizens could make contact with the KCCA by calling its central phone number.Footnote 3 However, this information was never sufficient in volume or organized in a way that the KCCA felt it was actionable.
The platform that we developed with our KCCA partners involved the creation of a single SMS shortcode, a familiar tool that residents could use at no cost, which eliminated reporters' search costs for the right point of contact.Footnote 4 Because everyone who signed up as a reporter received regular prompts for information, they could also be assured that the platform was being actively maintained. Using in-country staff and a text-messaging platform developed by a domestic IT firm, our research team managed the flow of both outgoing and incoming messages. We processed the incoming information and summarized it at the zone level before passing it on to the KCCA, but this was not observable to recruited reporters. Outgoing prompts for information were co-designed with the KCCA's Waste Management Unit to gather the information that would be most useful for improving service delivery. Our team's assistance in processing citizen reports implies scope conditions for the practice of responsiveness. Specifically, the implementation of responsiveness requires quick and reliable data-processing capacity.
Overview of Experimental Design
We conducted two experiments. In the Phase 1 experiment, we tested how two recruitment conditions impacted reporting. In the Phase 2 experiment, we employed a three-arm, cross-randomized design to test how recruitment and social motivation impacted reporting for newly recruited reporters from Phase 2. We also randomized reporters recruited during Phases 1 and 2 into a responsiveness condition as part of the Phase 2 Experiment, with the responsiveness treatment crossed with the recruitment conditions of both phases. Figure 1 summarizes the overall design of both experiments, which is described in more detail below.
Summary of the cross-randomized experimental design
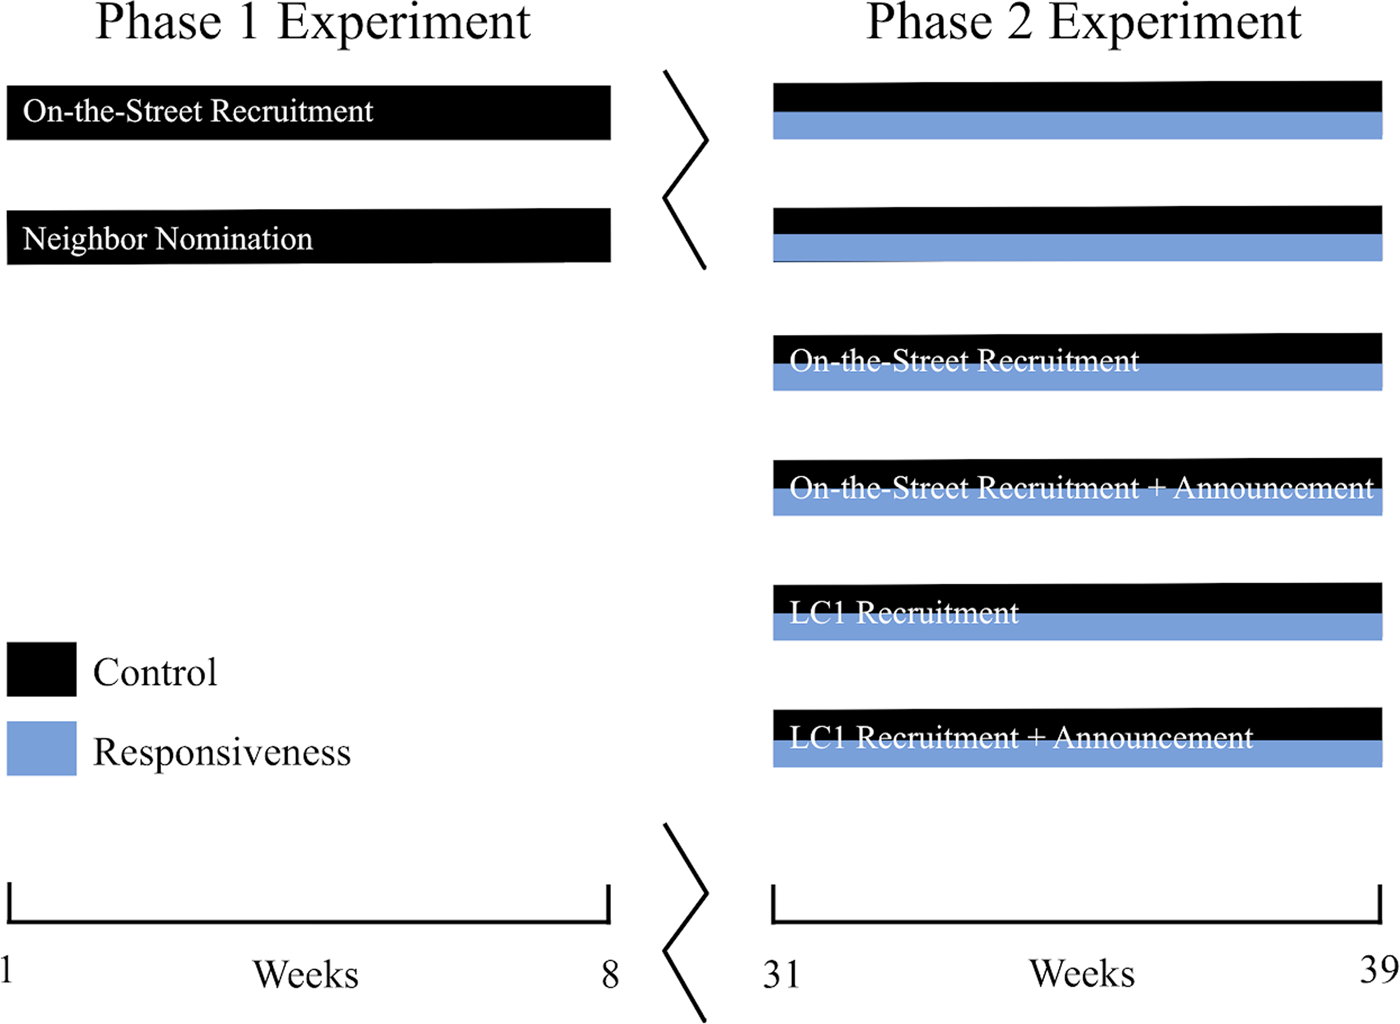
Phase 1 Experimental Design and Treatments
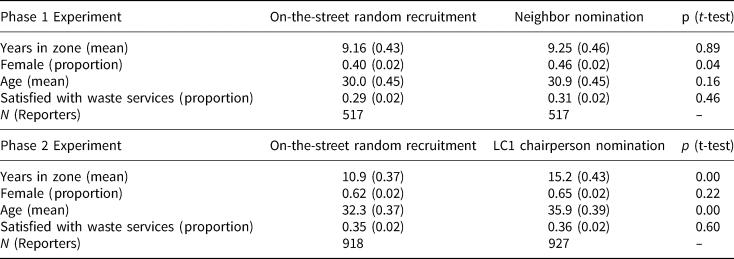
In the Phase 1 Experiment, we recruited a set number of citizen reporters from each of a sample of ninety randomly selected administrative zones (of 755) in November 2015 at the neighborhood level.Footnote 5 The KCCA provided us with a list of all zones (Local Council 1 or LC1s) inside Kampala and the associated shapefiles outlining their boundaries. We dropped eleven zones from the original sample because they were demolished, lacked residencies or were gated communities that barred access; we replaced them with other randomly selected zones.
After selecting the experimental sample, we randomly assigned each zone to one of two reporter-recruitment conditions using complete randomization (Figure 2, Panel A). In each zone, our research team aimed to recruit twelve citizen reporters according to the recruitment condition assigned at the zone level. The unit of treatment is thus the reporter position, with assignment clustered at the zone level, rather than a set of reporters who are recruited similarly but then treated differently. We varied the recruitment process to fill reporter positions with different types of reporters who might place different values on service delivery and may also differ on observable characteristics (see Appendix B for recruitment protocols):
Map of zones within Kampala
Note: (left) Phase 1 experiment recruitment conditions, (middle) Phase 2 experiment recruitment and motivation conditions, and (right) combined responsiveness treatment during Phase 2 experiment for reporters recruited in both phases.

(Recruitment baseline) on-the-street random recruitment
Following a random walk pattern, the enumeration team approached the closest adult walking or sitting outside of their home or business and asked whether they would sign up to be a reporter. While this recruitment method does not produce a random sample of the population, it specifically targets adults moving around the zone during the day, citizens who are likely able to provide observations of waste management issues in their zones.
(Recruitment treatment) neighbor nomination recruitment
Following a random walk pattern, the enumeration team approached the nearest adult walking or sitting outside of their home or business within the zone and asked whether they could nominate a ‘trustworthy and responsible’ individual who also lived in the zone to report on behalf of its residents. If the individual we approached indicated a willingness to nominate a reporter, the enumerator asked them to make a face-to-face introduction to the nominated neighbor, who was asked to sign up as a reporter.
These recruitment procedures continued in each zone until all reporter positions were filled. All reporters who filled the available positions were informed that the data they provided would be submitted anonymously to the KCCA, to avoid concerns about coercion. Reporters were required to be adult residents of the zone and the primary user of their own mobile phone. Over a seven-week reporting period, all reporters received the same seventeen prompts in either Luganda or English as preferred, regardless of their recruitment condition (see Appendix C for a list of prompts). To encourage reporting, the project held a lottery for one ~$10 prize in airtime each week uniformly for all reporters. Appendix Figure I1 tracks the design of the Phase 1 experiment in detail.
Phase 2 Experimental Design and Treatments
In June 2016, we recruited an additional 1,905 reporters from ninety-seven new and randomly selected administrative zones (LC1s), dropping five zones where research was impossible and replacing them with six new random selections. In each zone, enumerators aimed to recruit residents into twenty reporter positions, with treatment assigned at the zone level. Each zone was divided into four cells of roughly similar size and five individuals were recruited into reporter positions from each cell.
Each Phase 2 zone was assigned one of eight different treatment combinations based on a three arm experimental design. Two arms were recruitment and announcement conditions (Figure 2, Panel B). The third arm was government responsiveness to citizen reports. We cross-randomized reporters recruited during both Phase 1 and Phase 2 to the responsiveness condition (Figure 2, Panel C). The treatments are described in turn below.
(Arm 1, recruitment baseline) on-the-street random recruitment
Following a random walk pattern, the enumeration team approached the nearest adult walking or sitting outside of their home or business and asked whether they would sign up to be a reporter. This condition exactly followed the protocol from Phase 1 and serves as the baseline condition.
(Arm 1, recruitment treatment) LC1 chairperson nomination recruitment
Reporters in these zones were recruited by the LC1 chairperson or a delegated zone-level authority. LC1 chairpersons nominated reporters by introducing them to the recruitment team.
(Arm 2, announcement treatment) announcement of reporters by LC1 chairperson
Reporters in these zones were informed that the LC1 chairperson would announce the monitoring program and the names of reporters at an upcoming zone-wide meeting. LC1 chairpersons were selected for this role because they have significant social influence over zone residents.Footnote 6
A list of the names of recruited citizen reporters and information on the program were left with LC1 chairpersons in treated zones. The implementation team contacted LC1 chairpersons by phone one week following recruitment activities to remind them to make the announcement at a community meeting.Footnote 7 If the LC1 chairperson was not present during recruitment, our research team contacted them by phone that day to provide information about the monitoring program and request that they make an announcement. Zones not assigned to treatment were assigned to a control condition without an announcement from the LC1 chairperson.Footnote 8
(Arm 3, responsiveness treatment) responsiveness from the KCCA
The responsiveness treatment was a bundle of communicative and active responsiveness, both of which should prove important for increasing beliefs among citizens that reporting to the KCCA is worth their effort. Communicative responsiveness – where citizens' messages are acknowledged and the agency's process of turning monitoring into action is disclosed – allows citizens to attribute any changes to the public services they observe to their reporting. Active responsiveness – in which citizens can observe improvements to the deficiencies that they report – provides credibility to the communicative responsiveness. In isolation, communicative responsiveness is unlikely to be credible and active responsiveness is unlikely to be attributable, so the treatment involved both.
To signal communicative responsiveness, the platform sent reporters in treated zones 2–5 additional text messages at the end of each week emphasizing that their responses had been sent to the KCCA's Waste Management Unit and used to develop action plans. Although KCCA shared these zone-specific action plans with the research group, all subjects in the responsiveness condition received the same broad responsiveness messages. In some weeks, the platform also sent information listing the number of responses that individual reporters sent and the total number of responses by all citizen monitors in the reporter's zone, along with an offer for a program representative to answer questions.Footnote 9 Any questions received through the messaging platform were answered during a call center held each week.Footnote 10
Program representatives also called treated subjects one month into the reporting period to inform them that their reports were being sent to the KCCA Waste Management Unit and used to develop action plans (see Appendix K for the call center script). Program representatives who contacted subjects were different than the point of contact mentioned in text messages sent to treated subjects to minimize the chance of developing social ties that might influence reporting.Footnote 11 Both active and inactive reporters received the responsiveness outreach. Reporters in zones assigned to control did not receive any messages or phone calls responding to their reports.
In terms of active responsiveness, the KCCA created and implemented zone-specific action plans for treated zones to address deficiencies in solid waste services based on reports. While we did not design the study to systematically check the quality of active responsiveness, the KCCA provided detailed reports each week to our research team that included the zone-specific waste management problems identified based on citizen reports, step-by-step goals and activities to address the identified issues, and the responsible organizations and timeline for carrying out these interventions (see an example in Appendix J). As evidence that these plans were being implemented, we received messages from citizens thanking the KCCA for responding to their reports and indicating that they had observed service improvements in their zones. We are confident that these interventions were carried out based on meetings with KCCA staff.Footnote 12
Reporters in the control condition were not contacted to acknowledge reports about solid waste. Additionally, and per prior agreement, we only provided the KCCA with the reports from the control zones as a digest at the end of the eight-week study period, so reporters in control zones did not experience active responsiveness to their reports during the study period.
At the beginning of the eight-week reporting period, between 2 July and 29 August 2016, all subjects recruited during both phases received ten introductory messages in either Luganda or English as preferred that included an overview of the KCCA Waste Monitoring Project, information on what to expect from prompts requesting feedback on waste management issues in subjects' neighborhoods, and how to respond to prompts using the shortcode. All subjects then received a total of fifteen prompts about zone-level waste conditions designed with the KCCA Waste Management Unit (see Appendix C for the list of prompts used in Phase 2). We encouraged all reporters to answer prompts by running a lottery each week for ~$10 in airtime for all reporters in a uniform way. Each week all subjects received a message announcing the winner of the lottery and were encouraged to continue answering prompts to be eligible for the drawing (see complete list of outgoing messages in Appendix L). Appendix Figure I2 tracks the design of the Phase 2 experiment in detail.
Five weeks after the end of the Phase 2 reporting period, we implemented a short survey to understand whether responsiveness increased trust in government and satisfaction with waste services, which would indicate longer-lasting shifts in attitudes.
Outcome Measures of Reporting
As pre-registered (see Appendix D for exact hypotheses and measures), we measure reporting as follows for each of the two experiments: (1) the total number of active reporters (that is, those submitting at least one report) during the reporting period; (2) the total number of reports submitted by each reporter during the reporting period; (3) the total number of reports submitted by each reporter during the last two weeks of the reporting period and (4) the total number of open-ended reports (for example, descriptions of location of waste piles) submitted. We use the number of valid reports (that were not frivolous, irrelevant, or incomprehensible) for all analyses.
Descriptive Data on Reporters
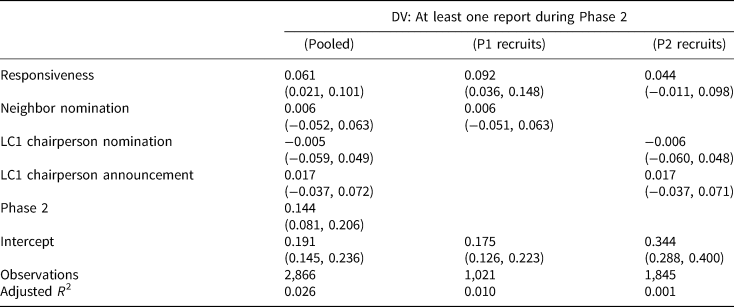
We selected reporters into reporter positions using different recruitment methods, which were intended to yield reporters with greater social connectedness and propensity toward prosocial behavior. Table 1 shows that some reporter characteristics were different based on the recruitment condition, as expected. For instance, the nomination process resulted in pools of reporters that were more female in both phases (Table 1). Additionally, the LC1 chairperson nomination produced a pool of reporters with longer average periods of residence in their zone and higher average age.
Descriptive statistics of reporters recruited in both phases
Note: this table displays descriptive statistics of all reporters at recruitment that are part of the effective sample for analysis. Standard errors computed by bootstrap within each experimental recruitment condition.
The reporters were only asked to provide limited information for intake into the KCCA reporting system, rather than a full survey of demographic and attitudinal items, which limits our ability to directly test for the social motivation of reporters. We designed the project such that reporting behavior would take place fully within a field environment with an intake form that would be typical of information collected by a government agency.
Analytical Methods
As pre-registered, we performed hypothesis tests via randomization inference using a simple difference-in-means approach. We generate 5,000 iterations of our randomization procedure (clustered at the zone level) and capture the sampling distribution of treatment effects under the sharp null to compute p-values. We use one-sided p-values corresponding to the direction of the pre-registered hypotheses. Because it facilitates the presentation of multiple treatment arms, we deviate from the pre-registered, single-arm, difference-in-means procedure for the Phase 2 experiment and instead estimate treatment effects via ordinary least squares (OLS) regression as specified in Equation 1:
 $$y_i = \; \alpha {\rm} + {\rm} \tau _1D_1 + {\rm} \tau _2D_2 + {\rm} \tau _3D_3 + {\rm} I\,({\rm Phase}) + {\rm} \varepsilon _j$$
where y i is the outcome for individual i, τ are estimates of treatment effects, D are treatment arms, I(Phase) is an indicator of the phase of recruitment (only for the pooled analysis), and ε j is an error term clustered at the zone level, corresponding to the level of assignment. This is the only deviation from the pre-registered analysis in the main text. We present the pre-registered difference-in-means specifications via randomization inference in Appendix Figure D1, which yields the same results. Analyses beyond those presented in Figure 3 and Tables 2–4 were not pre-registered. Appendix D contains a longer discussion of pre-registration and Appendix Table D1 describes the pre-registration status of all the tables and figures.
Reporting by recruitment condition during Phase 1
Note: (A) proportion of reporters who submitted at least one report by recruitment condition; (B) average number of total reports per reporter by recruitment condition; (C) average number of open-ended reports per reporter on the location of waste piles by recruitment condition. All panels display one-standard-error bars computed by bootstrap within the experimental condition. All panels use the full sample of n = 1,034 reporters.

Total number of active reporters during Phase 2
Notes: estimated by OLS per Equation 1. Parameter estimates are change in the proportion of reporters that submitted at least one valid and usable report during the study period; 95 per cent confidence intervals on parameter estimates, computed from robust standard errors clustered at the zone level, are displayed. Intercept shows estimated value for the baseline control group.
Total number of reports submitted by each reporter during Phase 2
Notes: estimated by OLS per Equation 1. Parameter estimates are change in valid and usable reports per reporter during the study period. 95 per cent confidence intervals on parameter estimates, computed from robust standard errors clustered at the zone level, are displayed. Intercept shows estimated value for the baseline control group.
Number of reports submitted by each reporter during the last two weeks of Phase 2

Note: estimated by OLS per Equation 1. Parameter estimates are change in valid and usable reports per reporter during the last two weeks of the study period, corresponding to open-end prompts asking for location and problem descriptions. 95 per cent confidence intervals on parameter estimates, computed from cluster-robust standard errors clustered at the zone level, are displayed. Intercept shows estimated value for the baseline control group.
We observed significant non-compliance with the LC1 Chairperson Announcement treatment in the Phase 2 Experiment, prompting us to estimate complier average causal effects as a robustness check on the intent-to-treat results reported in the main text (see Appendix E). This does not change the substantive or statistical significance of the main results. We do not find evidence of spatial spillover of the responsiveness treatment across zones (see Appendix H). Because we see no evidence that excess or incomplete recruitment into reporter positions is associated with the experimental conditions, we analyze the effective sample of all reporters recruited.
Findings: Phase 1 Experiment
In the Phase 1 Experiment, we find marginal evidence that nomination boosts reporting (Figure 3). The platform received a total of 493 valid SMS reports. Reporters assigned to nomination submitted more reports over the entire study period as a point estimate, but this value is not highly inconsistent with the null hypothesis (Panel A; te = 0.023, p = 0.17). If we instead compare the mean number of responses per reporter by assigned recruitment condition, we find that nominated reporters submitted an average of 0.524 reports, while on-the-street recruited reporters submitted an average of 0.429 reports, which is again not highly inconsistent with the null hypothesis (Panel B; te = 0.095, p = 0.18). Finally, if we consider how many times reporters responded to open-ended prompts for the locations of trash piles, the most difficult type of reporting, we see higher rates of reporting in treatment, but not so high that the rate is inconsistent with the null hypothesis (Panel C; te = 0.017, p = 0.16). These results are at best suggestive, but certainly far from conclusive of the impact of nomination. Again, these results are surprising compared to prior studies which have found that community networks have significant effects on prosocial behavior (Kim et al. Reference Kim2015; Nowell et al. Reference Nowell2016; Brady, Lehman Schlozman and Verba Reference Brady, Schlozman and Verba1999). Contrary to expectations and to prior findings, explicit requests for neighbors or local leaders to nominate responsible individuals to monitor solid waste services did not increase reporting compared to random-walk, on-the-street recruiting.
Findings: Phase 2 Experiment
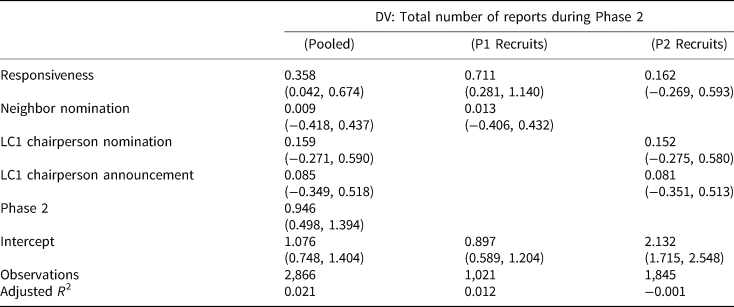
During the Phase 2 Experiment, the platform received 5,593 valid SMS reports from reporters recruited in both phases. In the tables below, we report the results for both the pooled group of subjects recruited during Phases 1 and 2, as well as the results split by the recruitment phase. Considering the proportion of reporters who submitted at least one on-topic report, only the responsiveness condition boosts participation (Table 2). Reporters recruited during Phase 1 from a zone assigned to the responsiveness condition are 53 per cent more likely to be active during Phase 2 than reporters in control zones (9.2 per cent more likely in absolute terms compared to a baseline activity rate of 17.5 per cent). Reporters recruited during Phase 2 from a zone assigned to the responsiveness condition are 13 per cent more likely to be active than those in control zones (4.4 per cent more likely in absolute terms compared to a baseline activity rate of 34.4 per cent).
In contrast, we do not observe any differences in the number of active reporters when recruiting was done by neighbor or LC1 chairperson nomination, or when reporters expected the LC1 chairperson to recognize them at a community meeting. Thus the evidence suggests that nominations and announcements do not increase reporting. This is good news for policy makers who wish to operate citizen-reporting platforms, since the results suggest that it is unnecessary to undertake more complex types of recruiting than on-the-street contacting.
Turning to the total number of reports in the Phase 2 Experiment, only the responsiveness treatment increases reporting (Table 3). Pooling zones across recruiting periods, we find that the responsiveness treatment increased the average number of reports per reporter by approximately 0.36 over eight weeks and fifteen prompts. This result is largely driven by the 79 per cent increase in reporting that the responsiveness treatment had on treated Phase 1 reporters (an average of 0.71 additional reports in absolute terms). In contrast, the responsiveness treatment did not increase the total number of reports by Phase 2 reporters in ways that are inconsistent with a zero effect size. We do not observe any differences in the number of reports per reporter with recruitment by neighbor or LC1 chairperson nomination, or when reporters expected the LC1 chairperson to recognize their participation.
Finally, we consider the total number of reports by each reporter during the last two weeks of the eight-week reporting period (Table 4). We again see little evidence that any recruitment condition (or the announcement about reporting by local leaders) significantly increased reporting during the last two weeks of the Phase 2 Experiment. The responsiveness treatment boosted reporting by Phase 1 reporters by 78 per cent (an average of 0.05 additional reports in absolute terms from a base rate of 0.07), but did not increase reporting by Phase 2 reporters at a magnitude inconsistent with a zero effect. This result highlights how responsiveness is especially necessary to sustain engagement, but that social connectedness and recognition are not. Indeed, our theory predicts that responsiveness will have a greater treatment effect as time elapses, since the beliefs of treated and control subjects will diverge based on the responsiveness that they experience.
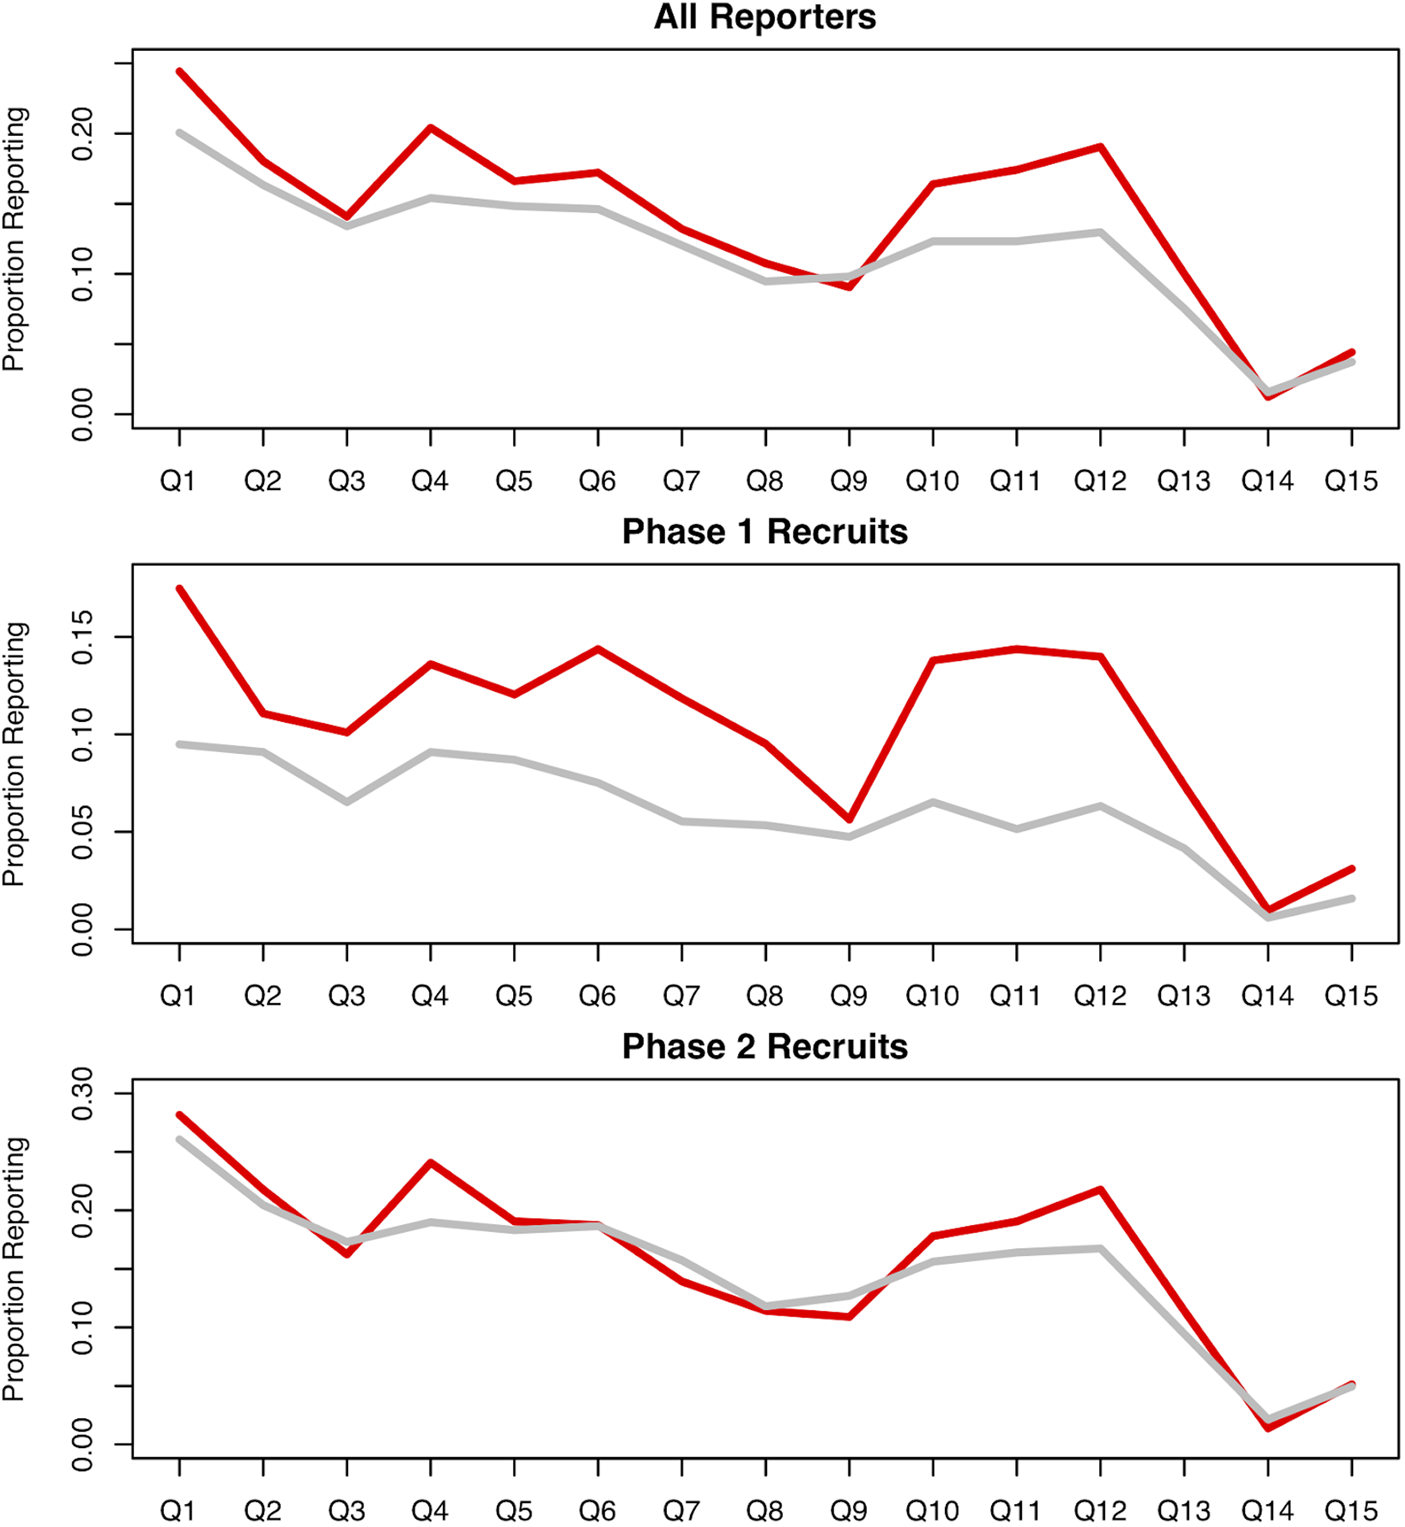
Figure 4 shows the proportion of reporters that submitted valid reports for each of the fifteen prompts during the Phase 2 Experiment. The effect of the responsiveness treatment is most pronounced toward the end of the reporting period and for Phase 1 recruits, as predicted, since these reporters have had longer to update their beliefs about responsiveness.
Proportion of reporters responding to each prompt during Phase 2 by phase of recruitment
Note: red indicates reporters assigned to the responsiveness condition, grey denotes reporters assigned to the control condition for responsiveness. The midline call center informing subjects of action plans and reviewing how responses were used by the KCCA rolled out concurrently with Q8 and Q9. ‘All reporters’ uses the pooled set of n = 2,866 reporters, while ‘Phase 1 reporters’ uses the n = 1,021 reporters that did not previously request removal and ‘Phase 2 reporters’ uses n = 1,845 reporters.
Mechanisms for Responsiveness Effect
Responsiveness Bundle
One limitation of the Phase 2 Experiment is that we are not able to determine which component(s) of the bundled responsiveness treatment are driving the treatment effect. There are several possibilities that have implications for how governments can most effectively operationalize responsiveness. Because few studies have explored the implications of government responsiveness, we test a strong responsiveness treatment that could be disaggregated in future research. As the key mechanism, we hypothesized that treatment changes beliefs in the probability of receiving a response and therefore the value of reporting, but we do not measure these instantaneous beliefs directly. We thus examine four other mechanisms that could be driving the treatment effect.
First, it is possible that treated reporters increased reporting because they received more messages from the platform, generally about three additional messages per week. Instead of changing beliefs about the probability that the government would respond to reports, additional messages sent days after prompts for information could have served as reminders to respond to prompts. In Appendix Tables F2–F4, we examine the robustness of the main results to the exclusion of all reports from both treatment and control conditions that were received after the responsiveness messages were sent at the end of each week. In this way, we examine only reporting before the treatment group could have been reminded to respond to previous prompts. None of the results are substantively different than those reported in the main text.
Secondly, only the responsiveness condition included a call center through which subjects had the chance to speak to program staff by telephone. Thus it is possible that the responsiveness treatment is driven by interpersonal contact, which was part of our responsiveness bundle. To shed some light on this possibility, we test whether the treatment effects of responsiveness are robust to the exclusion of different windows of observations following the midline call center. In Appendix Figure F2, we find some attenuation of treatment effects caused by removing observations as might be expected as opportunities for reporting decline, but the results reported in the main text generally hold.
Thirdly, reporters in the responsiveness condition were informed about the number of messages that had been received from their zone in the previous week on several occasions. This could have induced an increase in reporting because of social norms, either because reporters learned that reporting was insufficient or sufficient. However, we find that the effect of receiving messages about zone-wide reporting is not moderated by the number of reports that messages indicated as having been received from the zone (Appendix Table F1 and Figure F1).
Finally, we bundled together active and communicative responsiveness for the treatment. We do not know if one or the other is more important in the bundle of responsiveness, although we expected them to be mutually reinforcing. However, if the KCCA redirected its efforts toward treated responsiveness zones and away from control zones, then it is possible that divergence in reporting is due to decreased quality of services in control zones. While we cannot rule out this concern using the available data, we know citizens are most likely to contact governments because of service needs (Thomas and Melkers Reference Thomas and Melkers1999). If citizens are more likely to contact government to address poor services, a decrease in the quality of services in control zones should attenuate the effect of responsiveness.
Trust in Government
Five weeks after the Phase 2 endline, we fielded a post-reporting survey to measure reporters' trust in government and test their willingness to help the KCCA manage additional public services (see Appendix G). While responsiveness strongly influenced week-to-week reporting, this effect does not appear to have long-term implications for broader attitudes and willingness to volunteer for a future monitoring platform (Figure 5).Footnote 13
Attitudinal and behavioural responses to the responsiveness treatment
Note: data are survey responses collected five weeks after the reporting period. 95 per cent CIs computed by bootstrap sampling within each experimental condition. n = 1,584 reporters (of 2,866) reached during endline call center with survey questions and prompts to offer to volunteer.
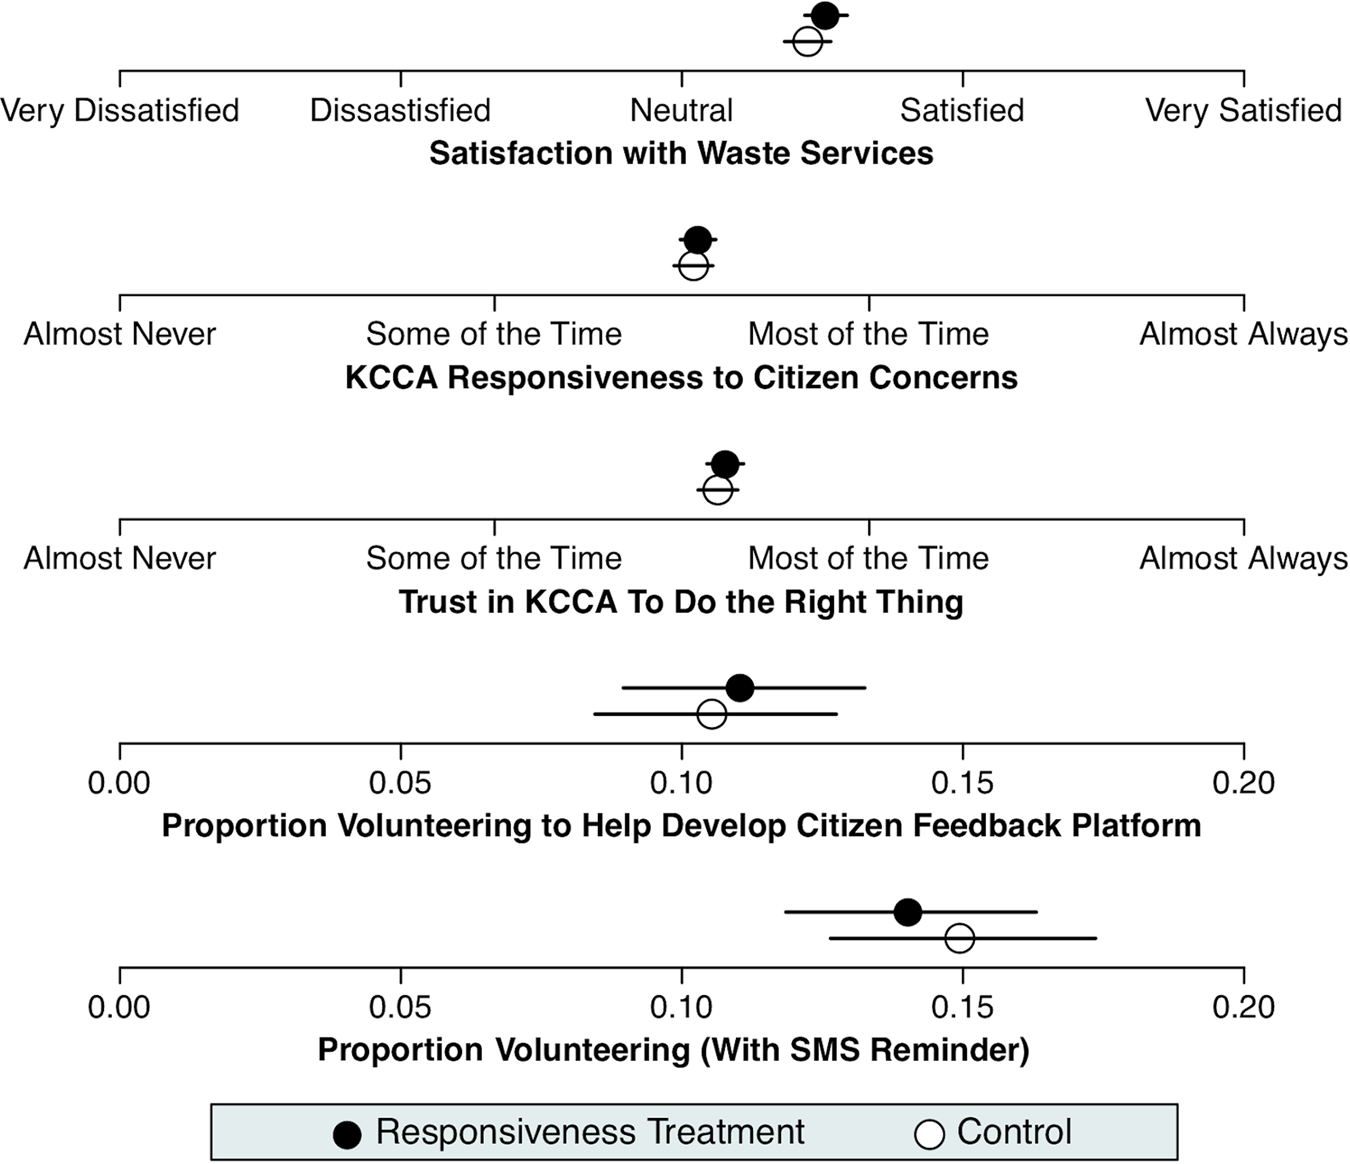
Reporters randomly assigned to the responsiveness treatment did not hold significantly more favorable attitudes about public services or government. Likewise, when reporters were asked to volunteer to test a public services reporting platform, treated reporters were no more likely to volunteer either before or after a reminder.Footnote 14 These results suggest that deeper attitudes related to trust in government and a willingness to assist government are either difficult to move, the effects of interventions are short-lived, or citizens' experiences are highly specific to a type of interaction with government – highlighting the importance of continuously reinforcing responsiveness in each area of government action to sustain reporting.
Quality of Citizen Reports
Our research team processed incoming messages each week prior to transmitting summary information to the KCCA. Our analysis of quality is based on in-the-field decisions to discard, clean or pass along reports in their raw format. More reports from reporters in the responsiveness condition needed cleaning or had to be discarded (Table 5). Relative to baseline, the proportional increase in reporting for the responsiveness condition is greatest for invalid reports. Thus the responsiveness condition seems to have created a trade-off between quality and quantity, generating more but lower-quality responses. Thus while responsiveness may be necessary to sustain engagement, it also implies a requirement for more intensive data processing.
Quality of responses by treatment condition
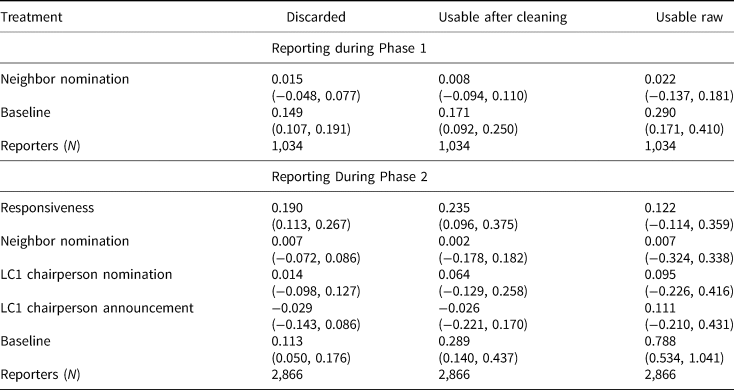
Notes: Estimation: Estimated by OLS per Equation 1 with zone-level clustering, which is more conservative than individual-level clustering in the data. Dependent Variables: Discarded is an indicator variable that is positive when raw responses are determined to be unusable by project staff; Usable after cleaning is an indicator variable that is positive when raw responses had to be manually recoded to be usable; Usable raw is an indicator variable that is positive when raw responses were usable directly. Other: 95 per cent confidence intervals on parameter estimates, computed from cluster-robust standard errors clustered at the zone level are displayed. Baseline shows estimated proportion of the responses for which the outcome is positive in the control condition.
Discussion and Conclusions
Engaging citizens in providing information about public services is likely critical to governance, and the text-messaging platform at the core of our field experiments exemplifies the tools that governments commonly use to engage citizens worldwide (Weerakkody et al. Reference Weerakkody2015). Yet despite significant effort to enlist citizens to participate in governance, these efforts often fail to generate sustained engagement; failures rarely appear in the scientific literature (McGee and Carlitz Reference McGee and Carlitz2013; Dahlander and Piezunka Reference Dahlander and Piezunka2014).
We theorized that citizens face a disengagement dilemma when they do not believe government is responsive to their concerns. Without input on failing or deficient services, governments struggle both to target services and to prevent agent shirking. Substandard service delivery leads to further distrust and disengagement in a negative, self-reinforcing cycle. We theorized that governments might escape this cycle by recruiting citizens with prosocial attributes, heightening the social value of public services, and demonstrating responsiveness to citizens.
Yet we find that citizens nominated by neighbors and local leaders did not report more frequently. Nor did local leaders' announcements of citizen participation increase reporting. Our results are some of the first to suggest the limited effectiveness of using community networks to activate participation in governance. It may be more efficacious to find individuals who place a higher personal value on public services, rather than relying on social values to drive participation. Alternatively, if individual values are most salient, governments can simply forego these recruitment efforts and rely on random selection or open crowdsourcing methods, which is good news in the context of resource constraints. Future research will be needed to explore these possibilities.
In contrast, this study produced strong evidence that government responsiveness can help sustain citizen reporting. Importantly, the benefits of government responsiveness are greatest for reporters who have been reporting the longest. Governments capable of operating on a much larger scale than our study might use responsiveness to create citizen engagement platforms that better align with governments' longer operational horizons. Still, while the responsiveness effect we observed is large relative to control group participation, it is modest in absolute terms, averaging an additional 0.36 reports over fifteen prompts. Responsiveness did not yield large-scale citizen participation, but was instead important for sustaining modest levels of participation. Yet even these modest results are important when considering the rarity of direct engagement of any type by citizens with government agencies in Africa (see Bratton Reference Bratton2012, Table 7).
We helped our partner government become more responsive by compiling reports into spreadsheets at the zone level, showing what is possible to accomplish assuming a quick and reliable capacity to process citizen reports. Our assistance consisted of hiring in-country staff to generate reports using commonly available spreadsheet software and data from a domestic SMS aggregation firm; the kind of data processing necessary for responsiveness is not out of reach of government agencies. This study shows why it may be desirable for governments to invest in this type of capacity if they value citizen engagement. Though the approach to responsiveness that we study is likely strong relative to the current practice of many governments, we sought to study an innovative yet feasible, rather than common, approach to engaging citizens. It remains an open question whether governments will choose to adopt this novel approach, but our evidence suggests they should do so.
A potential concern is that such platforms might distract citizens from alternative forms of civic participation. However, given that only a minute proportion of the population was engaged in the study, that random-walk recruitment functioned equally well as nomination, and that participation involved relatively limited time commitments from citizen reporters, the use of and responsiveness to citizen reporting platforms would need to become significantly more widespread before they are likely to result in meaningful crowding out of citizen attention or effort.
Moreover, government responsiveness does not appear to shift citizens' trust in government nor change their willingness to take part in other participatory governance efforts. Previous studies have found that attitudes about government change slowly, and that important factors influence citizens' trust in government including political-cultural variables such as general satisfaction with democracy (Christensen and Lægreid Reference Christensen and Lægreid2014). Continuous reinforcement of responsiveness appears critical, which again requires strong capacity.
Future research might explore what mix of communicative and active responsiveness is most effective at sustaining engagement and boosting trust over time. We expected that both are necessary and found evidence of their combined effects on citizen reporting. Communicative responsiveness helps citizens attribute government action to their reporting, and active responsiveness makes communications from government about improvements to public services credible.
When interpreting the results of this study, it is important to again note that we used on-the-street random recruitment to invite a broad sample of citizens into reporter positions, an approach commonly referred to as crowdseeding (Van der Windt and Humphreys Reference Van der Windt and Humphreys2016). This means that the treatment effects we observe apply to a broad population of potential reporters. We did not collect extensive demographic data on the reporters in our study, which limits our ability to comment on who participated. Future research is needed to determine how responsiveness shapes the composition of reporters (Grossman, Humphreys and Sacramone-Lutz Reference Grossman, Humphreys and Sacramone-Lutz2018), though existing work suggests it is equally important for crowdsourcing platforms (see Sjoberg, Mellon and Peixoto Reference Sjoberg, Mellon and Peixoto2017; Trucco Reference Trucco2017).
Recent reviews highlight the need to better understand feedback loops that might encourage public engagement (Fox Reference Fox2015). Our expectations in this study are based on the core idea that citizens must believe it is worth their effort to engage with governments. We expect these conditions to drive participatory governance in different contexts (see Sjoberg, Mellon and Peixoto Reference Sjoberg, Mellon and Peixoto2017). We show that responsive governments cannot depend on communication technologies without also committing to act on the information provided by citizens. By doing so, however, governments can break out of the disengagement dilemma over longer periods of time, overcoming the reinforcing cycle of low citizen involvement and poor public services.
Supplementary material
Data replication sets are available in Harvard Dataverse at: https://doi.org/10.7910/DVN/MPQGZP and online appendices are available at https://doi.org/10.1017/S0007123419000322.
Acknowledgements
The authors are grateful to Polycarp Komakech, Immaculate Apio Ayado and Catherine Tabingwa for contributions to the design and implementation of this research. This project has been carried out in partnership with the Kampala Capital City Authority, and we gratefully acknowledge the support and participation of Charles Herbert, Josephine Kitaka, James Semuwemba, Martin Ssekajja, Frank Batungwa Tumusiime, and Judith Tukahirwa. Experiment 1 was supported by AidData at the College of William and Mary and the U.S. Agency for International Development (USAID) Global Development Lab through cooperative agreement AID-OAA-A-12-00096. The views expressed here do not necessarily reflect the views of AidData, USAID, or the United States Government. Experiment 2 was supported by the Hellman Family Foundation through a fellowship to MB. All activities described in this article received approval from the University of California, Santa Barbara Human Subjects Committee (protocol ESMS-BU-MA-031), the Uganda Mildmay Research Ethics Committee (protocol 0706-2015), and the Uganda National Council for Science and Technology (protocol SS 3840) and the Uganda Office of the President (ref: ADM/154/212/03). We pre-registered the hypotheses and our plans for testing them at the Evidence in Governance and Politics registry (20151103AA). The authors received helpful comments on previous versions of this article from Guy Grossman, Matt Potoski, seminar participants at the University of California, Santa Barbara, and conference participants at the 2nd Annual Conference on Environmental Politics and Governance in Gerzensee, Switzerland and the 2016 Earth Systems Governance Conference in Nairobi, Kenya. The author contributions are as follows: MB is lead author. MB designed the research, with DN; JS managed implementation of the research, with MB; MB conducted the analysis; MB wrote the article, with JS and DN.


 Open access