

1. Introduction
The Zagros orogenic belt (ZOB) of SW Iran extends NW–SE from eastern Turkey through northern Iraq and along SW Iran to the Strait of Hormuz and into northern Oman, accommodating ~ 20 mm yr−1 of convergence between Arabia and Eurasia (Reilinger et al. Reference Reilinger, McClusky, Vernant, Lawrence, Ergintav, Cakmak, Ozener, Kadirov, Guilev, Stepanyan, Hadariya, Hahubia, Mahmoud, Sakr, ArRajehi, Paradissis, Al-Aydrus, Prilepin, Guseva, Evren, Dmitrosta, Filikov, Gomez, Al-Ghazzi and Karam2006). In contrast to most other parts of the Alpine–Himalaya mountain chain, convergence with Arabia has not yet obliterated the structure of the hanging-wall fore-arc. Many studies have been done on the structure, origin and geodynamic evolution of the Zagros region (e.g. Alavi, Reference Alavi1980, Reference Alavi2004, Reference Alavi2007; Agard et al. Reference Agard, Omrani, Jolivet and Mouthereau2005; Homke et al. Reference Homke, Verges, Serra-Kiel, Bernaola, Sharp, Garces, Montero-Verdo, Karpuz and Goodarzi2009). The ZOB is interpreted as the product of three major tectonic events (Alavi, Reference Alavi1994): (1) subduction of the Neo-Tethys Ocean beneath Central Iran during Cretaceous time; (2) emplacement of ophiolites over the Afro-Arabian passive continental margin in Turonian to Campanian time; and (3) collision of the Arabian plate with Iran beginning in mid-Cenozoic time. The ZOB is bounded to the NW by the East Anatolian strike-slip fault and to the SE by the Oman line (Falcon, Reference Falcon and Kent1969). The ZOB formed because of convergence between Arabia and Eurasia, behaving essentially as a subaerial accretionary prism and provides insights into the early stages of collision (e.g. Hatzfeld et al. Reference Hatzfeld, Tatar, Priestly and Ghafori-Ashtiany2003; Vernant et al. Reference Vernant, Nilforoushan, Hatzfeld, Abbassi, Vigny, Masson, Nankali, Martinod, Ashtiani, Bayer, Tavakoli and Chery2004). Growth of the ZOB reflects the continuing subduction of the Arabian continental crust beneath Iran, which began 10–20 Ma (McQuarrie et al. Reference McQuarrie, Stock, Verdel and Wernicke2003). Several major tectonic events occurred across the ZOB during Late Cretaceous, Late Eocene and Early to Middle Miocene times (Robertson, Reference Robertson, Bozkurt, Winchester and Piper2000; Agard et al. Reference Agard, Omrani, Jolivet and Mouthereau2005) with reorganization at 5 ± 2 Ma (Allen, Jackson & Walker, Reference Allen, Jackson and Walker2004). Abundant ophiolites in the ZOB define the southern Eurasian fore-arc and mark the suture with Arabia, which continues to develop. This ophiolite belt is key for reconstructing the Neo-Tethyan realm from Late Permian rifting to the beginning of collision in Miocene time. It is therefore especially important to understand how and when these ophiolites formed.
The Iranian ophiolites of Zagros are part of a 3000 km long belt that extends from Troodos, Cyprus, to Semail, Oman (Fig. 1). The ophiolites at either end of this belt are the best studied in the world (e.g. Pearce & Robinson, Reference Pearce and Robinson2010; Dilek & Furnes, Reference Dilek and Furnes2009; Dilek, Furnes & Shallo, Reference Dilek, Furnes and Shallo2007; Garfunkel, Reference Garfunkel and Robertson2006; Robertson & Mountrakis, Reference Robertson, Mountrakis and Robertson2006; Godard, Dautria & Perrin, Reference Godard, Dautria and Perrin2003; Godard, Bosch & Einaudi, Reference Godard, Bosch and Einaudi2006; Robertson, Reference Robertson2002, Reference Robertson, Robertson, Emeis, Richetr and Camerlenghi1998; Floyd, Yaliniz & Goncuoglu, Reference Floyd, Yaliniz and Goncuoglu1998; Sengor, Reference Sengor, Robertson, Searle and Ries1990; Alabaster, Pearce & Malpas, Reference Alabaster, Pearce and Malpas1982, among others). In contrast, the Upper Cretaceous ophiolites of the Iranian Zagros (Fig. 2a) are poorly known. Developing a cohesive tectonic model which explains the significance of the Zagros ophiolite belt is a complex task and in particular requires a better understanding of these ophiolites.
Location of the Zagros Ophiolitic Belt as part of the 3000 km long Upper Cretaceous ophiolite belt of SW Asia between Cyprus and Oman (modified after Blome & Irwin, Reference Blome and Irwin1985).

(a) Map showing the distribution of the inner (Nain–Dehshir–Baft–Shahr-e-Babak) and outer (Kermanshah–Neyriz–Haji–Abad) Zagros ophiolitic belts, the location of the Urumieh–Dokhtar magmatic arc (Eocene–Quaternary), and Main Zagros Thrust (MZT). (b) Schematic cross-section showing the relationship between the outer and the inner Zagros ophiolitic belts and the Zagros thrust–fold belt (after Shafaii Moghadam, Stern & Rahgoshay, Reference Shafaii Moghadam, Stern and Rahgoshay2010). Note that the Sanandaj–Sirjan Zone is shown as exhumed subducted material, as discussed in the text.
Zagros ophiolites can be subdivided into two belts, one south of the Main Zagros Thrust (MZT) fault and the other along the SW periphery of the Central Iranian (Tauride) block (Stocklin, Reference Stocklin1977) (Fig. 2a). Hereafter, we use ‘Outer Zagros Ophiolitic Belt’ (OB) and ‘Inner Zagros Ophiolitic Belt’ (IB) to describe the parallel belts containing the Kermanshah–Neyriz and Nain–Baft ophiolites, respectively (Fig. 2a, b). The OB includes the Kermanshah, Neyriz and Haji–Abad–Esfandagheh ophiolites, from the NW to SE (Fig. 2a, b). There are many hypotheses to explain the tectonic significance of these ophiolites. The Neyriz ophiolite has been considered both as a piece of Neo-Tethyan oceanic lithosphere generated at the foot of the north Gondwanan passive margin (e.g. Ricou, Reference Ricou1971, Reference Ricou1976; Ricou, Braud & Brunn, Reference Ricou, Braud and Brunn1977; M. R. Jannessary, unpub. Ph.D. thesis, l'Univ. de Louis Pasteur, France, 2003) and as seafloor that was scraped off the down-going plate and incorporated into the Zagros accretionary prism (e.g. Babaie et al. Reference Babaie, Babaei, Ghazi and Arvin2006). The Kermanshah ophiolite is described as a piece of Tethyan oceanic lithosphere scraped off during NE-directed subduction underneath the Iranian block (e.g. Braud, Reference Braud1970, Reference Braud1978; J. Braud, unpub. Ph.D. thesis, Univ. Paris-Sud, France, 1987). The tectonic history of the Haji–Abad–Esfandagheh ophiolites is much more complex. Here, two types of ophiolites coexist: older ones (Upper Triassic–Cretaceous ophiolites) such as the Sikhoran (Ghasemi et al. Reference Ghasemi, Juteau, Bellon, Sabzehi, Whitechurch and Ricou2002), and younger ones, the Upper Cretaceous ophiolites, including Haji–Abad, near the MZT fault.
The IB is an ophiolitic mélange along the SW margin of the Central Iranian block (e.g. Davoudzadeh, Reference Davoudzadeh1972; Stocklin, Eftekhar-Nezhad & Hushmandzadeh, Reference Stocklin, Eftekhar-Nezhad and Hushmandzadeh1972; Berberian & King, Reference Berberian and King1981; Arvin & Robinson, Reference Arvin and Robinson1994; Arvin & Shokri, Reference Arvin and Shokri1997). In addition to various hypotheses that have been considered for IB formation (see Shafaii Moghadam, Stern & Rahgoshay, Reference Shafaii Moghadam, Stern and Rahgoshay2010 for further details), these ophiolites are interpreted as para-autochthonous fragments of fore-arc lithosphere that formed when subduction began beneath Iran in Late Cretaceous time (Shafaii Moghadam, Stern & Rahgoshay, Reference Shafaii Moghadam, Stern and Rahgoshay2010). We regard all Upper Cretaceous Zagros ophiolites as well as others in the 3000 km long belt that extends from Cyprus to Oman to result from an episode of subduction initiation on the north side of the Neo-Tethys Ocean. Most Upper Cretaceous Zagros ophiolites are highly disrupted fragments in tectonic mélange, complicating their study. Some ophiolites from northwestern Iran (such as Khoy–Maku) and Armenia are along-strike continuations of the IB and considered both as IB and OB by some geologists (e.g. Berberian & King, Reference Berberian and King1981; Khalatbary-Jafary et al. Reference Khalatbari-Jafari, Juteau, Bellon, Whitechurch, Cotten and Emami2004). Although describing these ophiolites is beyond the scope of this paper, recent works on the Khoy ophiolite (e.g. Khalatbary-Jafary et al. Reference Khalatbari-Jafari, Juteau, Bellon, Whitechurch, Cotten and Emami2004; Azizi et al. Reference Azizi, Chung, Tanaka and Asahara2011) and Armenian ophiolites (e.g. Galoyan et al. Reference Galoyan, Rolland, Sosson, Corsini, Billo, Verati and Melkonyan2009; Asatriyan et al. Reference Asatryan, Danelian, Sosson, Sahakyan, Person, Avagyan and Galoyan2010) highlight that these ophiolites are geochemically, geochronologically and geodynamically different from both IB and OB ophiolites.
This paper summarizes our understanding of the geodynamic evolution of the Zagros ophiolites based on the available radiometric ages, field data and geochemistry of mantle peridotites and overlying lavas. We discuss each of the important ophiolitic massifs in both the inner and outer Zagros ophiolitic belts. This overview is intended to provide useful background for geoscientists interested in Upper Cretaceous ophiolites and tectonic evolution of the larger Eastern Mediterranean and Persian Gulf region, and to advance discussion of the relationship between subduction initiation and ophiolite formation generally.
2. Tectonic evolution of the Zagros orogenic belt: previous reconstructions
The ZOB is bounded to the NW by the East Anatolian strike-slip fault. This left-lateral fault separates the ZOB from the Eastern Taurides of Turkey (Alavi, Reference Alavi2007). Tectonically the ZOB consists of six tectonic zones oriented parallel to the Arabian–Eurasian plate boundary, from undeformed trench fill (in the SW) to a magmatic Andean-type arc (in the NE; Alavi, Reference Alavi1994, Reference Alavi2004, Reference Alavi2007) (Fig. 2b): (1) Mesopotamian Foredeep/Persian Gulf; (2) Zagros fold-and-thrust belt (Zagros active orogenic wedge of Alavi, Reference Alavi2007); (3) Outer Zagros Ophiolitic Belt; (4) Sanandaj–Sirjan Zone (Moritz, Ghazban & Singer, Reference Moritz, Ghazban and Singer2006); (5) Inner Zagros Ophiolitic Belt; and (6) Urumieh–Dokhtar magmatic arc (Alavi, Reference Alavi1994). Each zone is bounded by reverse faults. These zones are further described in the next Sections.
2.a. Mesopotamian Foredeep/Persian Gulf
The Mesopotamian Foredeep/Persian Gulf is an elongated basin filled with sediments as old as Neoproterozoic along the northeastern subducting margin of the Arabian plate. This basin is asymmetric from NE to SW, with sediments thickening from 4.5 km on the Arabian plate to 18 km beside the MZT (Edgell, Reference Edgell, Alsop, Blundell and Davison1996). As the Arabian and Eurasian plates converged, passive margin sedimentation on the north side of Arabia evolved into a foreland basin, the Mesopotamian Foredeep, which accumulated thick, coarse clastic sediments as its depocentre migrated through time from NE to SW to its present location in the Persian Gulf (Molinaro et al. Reference Molinaro, Guezou, Leturmy, Eshraghi and Frizon de Lamotte2004).
2.b. Zagros fold–thrust belt
The Zagros fold–thrust belt (ZFTB) is the external (trenchward) deformed part of the ZOB (Alavi, Reference Alavi1980, Reference Alavi1991, Reference Alavi1994). The ZFTB extends SE for nearly 2000 km from southeastern Turkey through northern Syria and northeastern Iraq to western and southern Iran (Alavi et al. Reference Alavi, Vaziri, Seyed-Emami and Lasemi1997). The ZFTB reflects the shortening and off-scraping of thick sediments from the northern margin of the Arabian platform, essentially behaving as the outer part of the accretionary prism for the Iranian convergent margin (Farhoudi & Karig, Reference Farhoudi and Karig1977). Convergence between Arabia and Iran has ~ 60° obliquity (e.g. McClay et al. Reference McClay, Whitehouse, Dooley and Richards2004; Vernant & Chery, Reference Vernant and Chery2006; Alavi, Reference Alavi2007); this results in a significant transpressional component of deformation in the ZOB, with dextral strike-slip faulting along NW-trending faults such as the Main Recent Fault. Because the pole of rotation for Arabia–Eurasia convergence lies in the Eastern Mediterranean, the convergence rate increases eastward along the ZOB, from ~ 1.5–1.8 cm/yr in the NW (McClusky et al. Reference McClusky, Balassanian, Barka, Demir, Ergintav, Georgiev, Gurkan, Hamburger, Hurst, Kahle, Kastens, Kekelidze, King, Kotzev, Lenk, Mahmoud, Mishain, Hadariya, Ouzounis, Paradissis, Peter, Prilepin, Reilinger, Sanli, Seeget, Tealeb, Toksöz and Veis2000) to ~ 2.8 cm/yr to the SE (Sella, Dixon & Mao, Reference Sella, Dixon and Mao2002). The ZFTB is bounded on the NE by the Main Zagros Thrust (Berberian & King, Reference Berberian and King1981; Berberian, Reference Berberian1995). The ZFTB is further subdivided across strike into three structural subzones, which largely manifest cumulative shortening increasing to the NE, which are from NE to SW: the Zagros Imbricate Zone (High Zagros); Zagros Simply Folded Belt (Falcon, Reference Falcon1974); and the Zagros Foredeep (which is the same as the Mesopotamian Foredeep/Persian Gulf). The Zagros Imbricate Zone or ‘crush zone’ consists of imbricated tectonic slices of Mesozoic limestones, radiolarites, ophiolites and Eocene volcanic rocks and flysch (Agard et al. Reference Agard, Omrani, Jolivet and Mouthereau2005). The Zagros Simply Folded belt consists of c. 13–14 km of shelf deposits of Permo-Triassic to Late Cretaceous/Paleocene age similar to those of the Arabian platform followed by a more complex pattern of sedimentation up to Pliocene time (James & Wynd Reference James and Wynd1965; Berberian & King Reference Berberian and King1981). These deposits were folded into a succession of NW–SE-trending folds after Mio-Pliocene time (Agard et al. Reference Agard, Omrani, Jolivet and Mouthereau2005).
2.c. Outer Zagros Ophiolitic Belt
The OB includes three main ophiolites, which are, from NW to SE, the Neyriz, Kermanshah and Haji–Abad. These slices are separated by the MZT from the ZFTB. Among outer belt ophiolites, only the Neyriz ophiolite has been studied in much detail. We will briefly discuss these ophiolites in Section 3.a.
2.d. Sanandaj–Sirjan Zone
Rocks of the 100–150 km wide Sanandaj–Sirjan Zone (SSZ) make up the metamorphic core of the Zagros (Mohajjel, Fergusson & Sahandi, Reference Mohajjel, Fergusson and Sahandi2003) and separate the inner and outer ophiolite belts. SSZ rocks span most of Phanerozoic time, including imbricated slices of marine and continental siliciclastic sediments metamorphosed under low- and medium-grade greenschist conditions (Alavi, Reference Alavi1994). Lavas and intrusive bodies accompany these sediments. In many interpretations, the northern continental margin of the Neo-Tethyan Ocean is represented by the SSZ (e.g. Berberian & King, Reference Berberian and King1981; Sengor, Reference Sengor, Robertson, Searle and Ries1990). Following Stocklin (Reference Stocklin1968), several geologists consider the SSZ as a once-active margin of the Central Iranian block (e.g. Berberian & King, Reference Berberian and King1981; Sengor, Reference Sengor, Robertson, Searle and Ries1990; Sheikholeslami et al. Reference Sheikholeslami, Pique, Mobayen, Sabzehei, Bellon and Emami2008; Fazlnia et al. Reference Fazlnia, Schenk, Van der Straaten and Mirmohammadi2009) with northeastward subduction of the Tethys Ocean during Late Triassic–Early Jurassic time (Berberian & King, Reference Berberian and King1981; Davoudzadeh & Schmidt, Reference Davoudzadeh and Schmidt1984) or Late Jurassic time (Mohajjel & Fergusson, Reference Mohajjel and Fergusson2000). Others suppose that the SSZ is an accreted microcontinent that separated from Gondwanaland during Early Jurassic time (e.g. Golonka, Reference Golonka2004; Agard et al. Reference Agard, Omrani, Jolivet and Mouthereau2005). In some of these models the SSZ is a continental fragment rifted from Arabia and was accreted to Eurasia during Cretaceous time (e.g. Glennie, Reference Glennie, Alsharan and Scott2000; Golonka, Reference Golonka2004; Agard et al. Reference Agard, Omrani, Jolivet and Mouthereau2005, Reference Agard, Monie, Gerber, Omrani, Molinaro, Meyer, Labrousse, Vrielynck, Jolivet and Yamato2006). However, Robertson (Reference Robertson, Karner, Manatschal and Pinheiro2007) observed that the rocks of the SSZ cannot be correlated with Arabian rocks.
In the Golpayegan area, to the SE, the SSZ can be subdivided into two parts: (1) the southern part consists of rocks deformed and metamorphosed in Middle to Late Triassic time; and (2) the northwestern part, deformed in Late Cretaceous time, contains many intrusive felsic rocks of mainly Late Cretaceous–Paleocene age (Eftekharnejad, Reference Eftekharnejad1981; Rachidnejad et al. Reference Rachidnejad, Emami, Sabzehei, Rastad, Bellon and Piqué2002; Ghasemi & Talbot, Reference Ghasemi and Talbot2006). The presence north of Shahr-e-Kord (the southern part of the SSZ) of metabasites, amphibolites and eclogites with mid-ocean ridge (MORB)-like compositions suggests remnants of Neo-Tethyan oceanic lithosphere (Davoudian et al. Reference Davoudian, Khalili, Noorbehesht, Dachse, Genser and Shabanian2006, Reference Davoudian, Genser, Dachse and Shabanian2007), thought to be exhumed subduction zone materials. Blueschists are an important component of SSZ rocks in the Haji–Abad area, where Agard et al. (Reference Agard, Monie, Gerber, Omrani, Molinaro, Meyer, Labrousse, Vrielynck, Jolivet and Yamato2006) documented metamorphic conditions around 11 kbar and 520–530°C, and laser-ablation 40Ar/39Ar ages on phengite clustering at 85–95 Ma; similar rocks are found in the SSZ near Neyriz (Davoudian et al. Reference Davoudian, Khalili, Noorbehesht, Dachse, Genser and Shabanian2006, Reference Davoudian, Genser, Dachse and Shabanian2007). These blueschist occurrences show that some SSZ rocks were subducted and later exhumed. Agard et al. (Reference Agard, Monie, Gerber, Omrani, Molinaro, Meyer, Labrousse, Vrielynck, Jolivet and Yamato2006) concluded that exhumation of Haji–Abad blueschist was completed by 80 Ma. The Early Eocene uplift and therefore hiatus in overlying sediments of all Zagros ophiolites during Paleocene–Early Eocene time may be a further expression of the exhumation of the Sanandaj–Sirjan accretionary complex. This extension and exhumation of metamorphic rocks of the SSZ has been also suggested by Moritz, Ghazban & Singer (Reference Moritz, Ghazban and Singer2006).
Because it separates the inner and outer belt ophiolites, the nature of the SSZ, particularly whether or not it was subducted and exhumed in Late Cretaceous–Palaeogene time, is a critical test of the Iranian fore-arc hypothesis of Shafaii Moghadam, Stern & Rahgoshay (Reference Shafaii Moghadam, Stern and Rahgoshay2010). In the northern part of Chah Gaz (Zardu 1/100000 sheet) and Balvard regions, SSZ metamorphic rocks show faulted contacts with Shahr-e-Babak and Balvard–Baft ophiolites (Dimitrijevic, Reference Dimitrijevic1973). We think that the metamorphic conditions of SSZ rocks and emplacement between otherwise identical Zagros ophiolite belts supports the idea that these are exhumed subducted materials, which now define an anticlinorium structurally beneath the fore-arc ophiolites (Fig. 2b), as first proposed by Alavi (Reference Alavi2004, fig. 5). The SSZ behaves today as a fairly rigid block moving northward at ~ 14 mm yr−1 relative to Eurasia (Vernant et al. Reference Vernant, Nilforoushan, Hatzfeld, Abbassi, Vigny, Masson, Nankali, Martinod, Ashtiani, Bayer, Tavakoli and Chery2004).
2.e. Inner Zagros Ophiolitic Belt
Zagros inner belt ophiolites occur in several distinct massifs named after nearby towns. These massifs can be traced along strike for 500–600 km and are, from NW to SE, the Nain, Dehshir, Shahr-e-Babak and Balvard–Baft ophiolites. These ophiolites are organized as a pile of slices, imbricated during Late Cretaceous time, and cut by strike-slip faults. We will briefly discuss these ophiolites in Section 3.b.
2.f. The Urumieh–Dokhtar magmatic assemblage
The Urumieh–Dokhtar magmatic assemblage (UDMA) is a 50–80 km wide Andean-type magmatic belt of intrusive and extrusive rocks formed by northeastward subduction of Neo-Tethyan ocean floor beneath Iran (Falcon, Reference Falcon1974; Berberian & Berberian, Reference Berberian, Berberian, Gupta and Delany1981; Berberian & King, Reference Berberian and King1981; Berberian et al. Reference Berberian, Muir, Pankhurst and Berberian1982; Alavi, Reference Alavi1994; Shahabpour, Reference Shahabpour2007). This magmatic assemblage includes a thick (~ 4 km) pile of early calc-alkaline and latest shoshonitic as well as alkaline rocks (Alavi, Reference Alavi1997).
The presence of pyroclastic rocks along with Upper Cretaceous pelagic sediments just above the Baft ophiolite, along with the observation that these pyroclastic rocks thicken to the NE, suggests that the UDMA existed in Late Cretaceous time. In the Zagros Imbricate Zone, there are local thrust slivers which consist of Cretaceous–Tertiary pyroclastic/volcaniclastic strata, interpreted to be distal facies from UDMA activity deposited in a fore-arc basin and later deformed by Zagros thrusting (Alavi, Reference Alavi, Vaziri, Seyed-Emami and Lasemi1997).
3. Lithology and rock units of Zagros ophiolites
The principal lithologies and mineral components of Zagros ophiolites are summarized below. Upper Cretaceous Zagros ophiolites consist of fragments that were tectonically disrupted during emplacement and younger deformation and often comprise tectonic mélange, but locally the relationships within ophiolitic units and overlying sediments and flanking units are well preserved.
3.a. Outer Zagros Ophiolitic Belt
3.a.1. Kermanshah ophiolite
This is the NW-most outer belt ophiolite in Iran. The ophiolite trends NW–SE and is distributed in two regions, separated by the SSZ metamorphic rocks (see Fig. A1 in online Appendix 1 at http://journals.cambridge.org/geo). The ophiolite is exposed over ~ 2400 km2, essentially SW of the MZT (Fig. 2). It is bordered to the NE by SSZ metamorphic rocks and to the SW by Bisotun limestone, a ~ 3 km thick carbonate sequence of Late Triassic to Late Cretaceous (Cenomanian) age, as well as by the Triassic to Cretaceous Kermanshah radiolarites and then by ZFTB sedimentary rocks. The Kermanshah ophiolite is thrust over the Bisotun limestone. Initial thrusting of the Kermanshah ophiolite is thought to have occurred during Maastrichtian–Paleocene time, as evidenced by ophiolitic clasts in the Maastrichtian–Paleocene Amiran Conglomerate Formation of the ZFTB (J. Braud, unpub. Ph.D. thesis, Univ. Paris-Sud, France, 1987). This episode of erosion may also correspond to when SSZ rocks were exhumed. This thrust was reactivated in Miocene time, as indicated by the presence of Miocene flysch below the ophiolite (Agard et al. Reference Agard, Omrani, Jolivet and Mouthereau2005).
Two oceanic domains, the Harsin sub-oceanic basin to the south and the Neo-Tethys to the north are proposed for the evolution of the Kermanshah ophiolite (Wrobel-Daveau et al. Reference Wrobel-Daveau, Ringenbach, Tavakoli, Ruiz, Masse and Frizon de Lamotte2010). In this new model, the Harsin basin is suggested to have resulted from mantle exhumation and detachment faulting at two different times: Early Jurassic and early Late Cretaceous (Cenomanian). The later extensional regime could correlate with tectonic movements indicated by Aptian–Albian olistostromes in Neyriz oceanic sediments, the Pichakun nappe (Robin et al. Reference Robin, Gorican, Guillocheau, Razin, Dromart, Mosaffa, Leturmy and Robin2010). Moreover, there may be a younger nappe stack of gabbros, intrusive rocks and pelagic sediments, emplaced during Late Eocene time on the top of the former Cretaceous ophiolite (Wrobel-Daveau et al. Reference Wrobel-Daveau, Ringenbach, Tavakoli, Ruiz, Masse and Frizon de Lamotte2010).
The Kermanshah ophiolite has not been studied much. The presence of scattered dykes with island arc tholeiite (IAT) affinity is reported by Desmons & Beccaluva (Reference Desmons and Beccaluva1983). Some diabasic dykes yield 40K–40Ar ages of 83–86 Ma (Delaloye & Desmons, Reference Delaloye and Desmons1980). Ghazi & Hassanipak (Reference Ghazi and Hassanipak1999) reported mantle peridotites, gabbro and both island arc tholeiitic and alkaline lavas. Recently Allahyari et al. (Reference Allahyari, Saccani, Pourmoafi, Beccaluva and Masoudi2010) described mantle peridotite, normal mid-ocean ridge basalt (N-MORB)- to enriched mid-ocean ridge basalt (E-MORB)-type gabbroic sequences and scarce pillow lavas at Sahneh (NE of Kermanshah). Not all mafic gabbros are ophiolitic, for example undated pegmatitic gabbro south of Sahneh is probably the westernmost part of a 5 × 10 km E–W gabbro-volcanic belt of Eocene age shown by Allahyari et al. (Reference Allahyari, Saccani, Pourmoafi, Beccaluva and Masoudi2010).
The Upper Cretaceous Kermanshah ophiolite comprises mantle and crustal igneous rocks. The crustal sequence is distinguished by a sheeted dyke complex and a well-developed sequence of pillow lavas; crustal gabbros are missing (see Fig. A2 in online Appendix 1 at http://journals.cambridge.org/geo). Mantle peridotites including harzburgite, depleted lherzolite and pervasively impregnated harzburgite intruded by pegmatite gabbro lenses are found along the Harsin to Noor-Abad road. Another outcrop of depleted lherzolites and harzburgites is SSW of Sahneh (Allahyari et al. Reference Allahyari, Saccani, Pourmoafi, Beccaluva and Masoudi2010). Harzburgites contain serpentinized olivines, large orthopyroxene porphyroclasts, minor clinopyroxene and tiny grains of chromite. Interstitial undeformed plagioclase blebs and unstrained intergranular clinopyroxene are abundant in impregnated harzburgites, where they occur as melt-crystallized phases between pyroxene and olivine porphyroclasts. These minerals and millimetre-size gabbro-noritic aggregates indicate impregnation of harzburgite by melts with the composition of the low-pressure peridotite eutectic (e.g. Piccardo et al. Reference Piccardo, Zanetti, Spagnolo and Poggi2005; Pearce et al. Reference Pearce, Barker, Edwards, Parkinson and Leat2000). Depleted lherzolites have minor clinopyroxene and are considered to represent residual MORB mantle (Allahyari et al. Reference Allahyari, Saccani, Pourmoafi, Beccaluva and Masoudi2010). Ultramafic–mafic cumulate rocks are not observed.
Sheeted dyke complexes, including early basaltic and basaltic-andesitic-diabasic dykes and late dacitic-rhyolitic dykes, are found near Kherran and Sartakht villages (Fig. 3b, c). Each dyke (usually < 0.5 m, locally > 1 m thick) has been injected into others (Fig. 3c); locally plagiogranitic patches are observed as screens between dykes. Diabasic dykes are porphyritic with plagioclase phenocrysts and microlites. Magnesio-hornblende and/or clinopyroxene are also common. The felsic dykes are clearly younger as they cut the mafic dykes. Felsic dykes are composed of feldspar, quartz and amphibole phenocrysts and a cryptocrystalline to spherulitic groundmass. Relative abundances of felsic to mafic dykes are 1:3 to 1:2. A well-preserved volcanic sequence and sheeted dyke complex is found in many places e.g. near Kherran and Sartakht villages, especially near 47°E. Near the Kherran village, there is a ~ 200 m thick volcanic pile including (from bottom to top) poorly phyric basaltic-andesites, basaltic lavas and pillowed basalts (Fig. 3a). Pillow lavas contain clinopyroxene, altered plagioclase microlites and tiny titanomagnetites set in an altered glassy groundmass. The volcanic pile is capped by a thin basaltic lava flow. Locally, basaltic flows contain thin plagiogranitic veins.
Field photographs of Zagros outer belt ophiolites (approximate positions shown in Fig. A10 in online Appendix 1 at http://journals.cambridge.org/geo). (a) Pillow lava sequence of the Kherran to Sartakht section (Kermanshah ophiolite). (b) Sheeted dyke complex in the Kherran to Sartakht section (Kermanshah ophiolite). Late felsic dykes injected into early mafic dykes. (c) Close-up view of contact between dykes in sheeted dyke complex (Kermanshah ophiolite). (d) Upper Cretaceous pillow lava sequence near Siah-Pareh village (section C of Fig. A10 in online Appendix 1 at http://journals.cambridge.org/geo) (Kermanshah ophiolite). (e) Close-up view of fragmented pillow lavas in Dowlat-Abad, Neyriz ophiolite. (f) Tale-Afshari sheeted dyke complex in the Neyriz ophiolite. Late felsic dyke injected into early mafic dyke. (g) Upper Cretaceous boninitic pillow lavas near Avenan village, Haji–Abad ophiolite. (h) Calc-alkaline pillow lavas with intercalation of Upper Cretaceous pelagic limestones near Chale-Mort village (Haji–Abad ophiolite).

The base of the volcanic pile SSE of Sartakht village consists of pillowed basalts intruded by diabasic dykes that grade down into a sheeted dyke complex. Dykes include some that are andesitic and amphibole-bearing diabasic. Near Siah-Pareh village, there is a > 5 km2 region composed of a thick sequence of pillow lavas and basaltic flows (Fig. 3d).
3.a.2. Neyriz ophiolite
The Neyriz ophiolite (see Fig. A3 in online Appendix 1 at http://journals.cambridge.org/geo) was first defined as the High Zagros ophiolite–radiolarite belt by Berberian & King (Reference Berberian and King1981). There are three imbricated sheets, from bottom (SW) to top (NE), the Pichukan series, mélange units and ophiolite (Ricou, Reference Ricou1971, Reference Ricou1976; L. E. Ricou, unpub. Ph.D. thesis, Univ. Paris-Sud, France, 1974; Ricou, Braud & Brunn, Reference Ricou, Braud and Brunn1977). The Pichakun series (Ricou, Reference Ricou1968) consists of Upper Triassic limestone, Middle Jurassic oolitic limestone and Lower–Middle Cretaceous conglomeratic limestone, representing Neo-Tethys pelagic sediments (analogous to the Bisotun limestone and radiolarites of Kermanshah). The Pichakun series is wedged between two thrust sheets of sheared mélange (Pamić & Adib, Reference Pamić and Adib1982; Babaie et al. Reference Babaie, Ghazi, Babaei, La Tour and Hassanipak2001). Above the Pichukan series, the mélange consists of exotic blocks of Permian–Triassic Megalodon-bearing limestone associated with radiolarites, pillow lavas with alkaline (M. Arvin, unpub. Ph.D. thesis, Univ. London, 1982) and tholeiitic (Babaie et al. Reference Babaie, Babaei, Ghazi and Arvin2006) characteristics, serpentinites and metamorphic rocks. The upper mélange is tectonically overlain by ophiolite slices, and both ophiolite and mélange thrust sheets are transported over Cenomanian–Turonian shallow water shelf/platform carbonates (Sarvak Formation; Alavi, Reference Alavi1994). The contact of the lower mélange with the underlying autochthonous Sarvak Formation is marked by a mylonitic amphibolite sole (Babaei, Babaie & Arvin, Reference Babaei, Babaie and Arvin2005).
Ophiolite thrust sheets cover about 1500 km2. These are unconformably overlain by uppermost Cretaceous anhydritic limestones of the Tarbour Formation (James & Wynd, Reference James and Wynd1965). The Neyriz ophiolite was thrust over the Pichakun and mélange sheets in Turonian to Maastrichtian time (e.g. Ricou, Braud & Brunn, Reference Ricou, Braud and Brunn1977; Alavi, Reference Alavi1994; Babaie et al. Reference Babaie, Babaei, Ghazi and Arvin2006), exposing and allowing erosion of the ophiolite and accumulation of such clasts in Upper Cretaceous–Paleocene conglomerates (Haynes & Reynolds, Reference Haynes and Reynolds1980; Lanphere & Pamić, Reference Lanphere and Pamic1983). This episode of erosion may correspond to when SSZ rocks were exhumed, as evidenced by the presence of SSZ clasts in Upper Cretaceous–Paleocene conglomerates (Sabzehei, Reference Sabzehei1996).
The Neyriz ophiolite is composed of mantle and crustal units capped by Upper Cretaceous (Cenomanian–Turonian to lower Santonian) pelagic sediments. The mantle sequence is represented by depleted to highly impregnated harzburgites containing screens of residual dunite, podiform chromitite, pyroxenitic sills/dykes, pegmatite gabbros, gabbroic dykes/sills, isotropic melano-gabbros and diabasic-basaltic-andesitic dykes (see Fig. A2 in online Appendix 1 at http://journals.cambridge.org/geo). Diabasic dykes contain highly altered plagioclase and clinopyroxene. Isotropic melano-gabbros are characterized by plagioclase, orthopyroxene, clinopyroxene, brown amphibole, minor sulfides and titanomagnetite. Dunitic dykes/sills are common through the Neyriz mantle sequence. At the top of the mantle sequence there are highly impregnated peridotites including layered leucogabbro, olivine-bearing melanogabbro and pyroxenite cumulate sills and lenses. These lenses intrude mantle peridotites (see Fig. A2 in online Appendix 1 at http://journals.cambridge.org/geo) and contain olivine, slightly altered plagioclase, clinopyroxene and fine-grained sulfide. Marble and skarn-type rocks are found at the contact of these intrusions with depleted harzburgite and on the top of gabbroic dykes (see Fig. A2 in online Appendix 1 at http://journals.cambridge.org/geo) suggesting they formed when hot peridotite intruded Upper Triassic platform limestones during continental rifting (Hall, Reference Hall1980) and/or via interaction with high-temperature fluids released from gabbroic dykes intruding peridotite (M. R. Jannessary, unpub. Ph.D. thesis, l'Univ. de Louis Pasteur, France, 2003).
Coarse-grained melano-gabbros containing plagiogranitic pockets overly the mantle sequence. These rocks consist of serpentinized olivine, plagioclase and clinopyroxene showing cumulate texture. A highly fragmented sheeted dyke complex is widespread in the Tale-Afshari region (Fig. 3f); this includes diabasic-basaltic and dacitic dykes. Although intrusive contacts between dykes are difficult to recognize owing to faulting, some intrusive contacts between dykes and dyke-in-dyke relationships are seen. Pillowed and massive lavas containing chert and Upper Cretaceous pelagic limestone are common (Fig. 3e).
3.a.3. Haji–Abad ophiolite
The Haji–Abad (sometimes called Esfandagheh) ophiolite covers ~ 2000 km2. Two ophiolites exist here; an older (more northerly) one of Late Triassic–Cretaceous age (Sikhoran–Soghan complexes; Ghasemi et al. Reference Ghasemi, Juteau, Bellon, Sabzehi, Whitechurch and Ricou2002; Ahmadipour et al. Reference Ahmadipour, Sabzehi, Whitechurch, Rastad and Emami2003), and a younger, Upper Cretaceous Haji–Abad ophiolite (more southerly) near the MZT (see Fig. A4 in online Appendix 1 at http://journals.cambridge.org/geo). The older complex is overlain by marble and amphibolites of the Sargaz–Abshur complex and are intruded by Upper Triassic–Lower Jurassic (K–Ar dating; Ghasemi et al. Reference Ghasemi, Juteau, Bellon, Sabzehi, Whitechurch and Ricou2002) isotropic gabbros. The injection of Middle Jurassic–Cretaceous diabasic dykes was the last igneous event experienced by the older ophiolites (Ghasemi et al. Reference Ghasemi, Juteau, Bellon, Sabzehi, Whitechurch and Ricou2002; Ahmadipour et al. Reference Ahmadipour, Sabzehi, Whitechurch, Rastad and Emami2003). Older ophiolitic lavas have suprasubduction zone geochemical signatures. Formation in a back-arc basin (Ghasemi et al. Reference Ghasemi, Juteau, Bellon, Sabzehi, Whitechurch and Ricou2002) or rift (Ahmadipour et al. Reference Ahmadipour, Sabzehi, Whitechurch, Rastad and Emami2003) has been suggested.
The southern Haji–Abad ophiolite formed in Late Cretaceous time and is highly faulted. The mantle sequence includes depleted harzburgite and residual dunite occasionally foliated with aligned spinel. Podiform chromitites are common within the residual dunite (see Fig. A2 in online Appendix 1 at http://journals.cambridge.org/geo). Porphyroclastic harzburgites contain serpentinized olivine, bastitized orthopyroxene, occasional traces of clinopyroxene and black-brown to pale brown spinels. Dunites have highly deformed olivine porphyroclasts with deformation lamellae and inclusions of black spinel. Leucogabbroic and gabbroic dykes are common in the harzburgites. Metamorphosed diabasic dykes containing amphibole, altered plagioclase, chlorite and epidote cross-cut the mantle harzburgite. Haji–Abad ophiolite crustal sequences are characterized by pillowed and massive lava flows (Fig. 3g, h), overlain tectonically or occasionally stratigraphically by Upper Cretaceous pelagic limestones. Small tonalitic intrusions into the crustal sequence also show fault contacts with serpentinites. A fine-grained plagiogranitic sill cross-cuts the tonalitic intrusions. Highly spilitized metavolcanics with thin layers of pelagic limestone are widespread (Fig. 3h). The Upper Cretaceous Haji–Abad ophiolite is overlain by volcaniclastic sandstone and siltstone turbidites, which are succeeded by basalt flows (see Fig. A2 in online Appendix 1 at http://journals.cambridge.org/geo). Basalts are commonly metamorphosed to greenschist facies, with chlorite, titanite, epidote, calcite and secondary quartz. Plagioclase is altered and clinopyroxene rims are chloritized. Greenschist-facies metamorphism may be related to a Cyprus-type massive sulfide deposit within pillow lavas in the Sheikh-Ali region (Rastad, Miralipour & Momenzadeh, Reference Rastad, Miralipour and Momenzadeh2002). Ophiolitic lavas are overlain by Upper Cretaceous pelagic limestones.
3.b. Inner Zagros Ophiolitic Belt
3.b.1. Nain ophiolite
The Nain ophiolite is the NW-most IB massif (Fig. 2) and covers about 600 km2 (see Fig. A5 in online Appendix 1 at http://journals.cambridge.org/geo). Davoudzadeh (Reference Davoudzadeh1972) first described it as an Upper Cretaceous–Lower Eocene coloured mélange. Rahmani, Noghreyan & Khalili (Reference Rahmani, Noghreyan and Khalili2007) proposed that the Nain ophiolites formed in a suprasubduction zone tectonic environment, based on the composition of sheeted dykes.
The Nain ophiolite mantle sequence is composed of moderately depleted harzburgites with minor plagioclase lherzolite formed as a result of gabbroic impregnation. Harzburgites have porphyroclastic and/or blastomylonitic texture. Pegmatite gabbros, coarse-grained sulfide-bearing gabbros and isotropic gabbros/gabbronorites are common within the mantle sequence. Pyroxenitic, gabbroic, gabbronoritic and diabasic dykes and sills cross-cut the Nain mantle sequence (Fig. 4a and Fig. A6 in online Appendix 1 at http://journals.cambridge.org/geo). Pegmatite gabbros contain large clinopyroxene and plagioclase crystals. Coarse-grained gabbros locally show alternating plagioclase-rich and clinopyroxene-rich layers. Gabbronorites are cumulates, containing olivine, orthopyroxene, clinopyroxene and plagioclase crystals with minor pyrite. Isotropic gabbros have clinopyroxene, amphibole and variably altered plagioclase crystals. Slices of garnet amphibolite containing leucocratic segregations resulting from partial melting occur in this ophiolite.
Field photographs of Zagros inner belt ophiolites (approximate positions shown in Fig. A11 in online Appendix 1 at http://journals.cambridge.org/geo). (a) Early rodingitized gabbroic sill in mantle harzburgite of the Nain ophiolite. (b) Injection of diabasic dyke into amphibole gabbros, host of the Nain ophiolite sheeted dyke complex. (c) Isolated diabasic dyke in mantle sequence of the Dehshir ophiolite. (d) Late dacitic dykes injected into early diabasic dykes in the Dehshir ophiolite sheeted dyke complex. (e) Rhyolitic dyke injected into volcanic sequence of the Shahr-e-Babak ophiolite. (f) Interbedded andesitic lavas with Upper Cretaceous radiolarites in the Shahr-e-Babak ophiolite. (g) Basaltic sill within pyroclastic rocks of the Balvard–Baft ophiolite. (h) Pyroclastic unit of the Balvard–Baft ophiolite overlain by Upper Cretaceous pelagic limestones.

The Nain ophiolite crustal sequence includes a sheeted dyke complex and overlying lavas (Fig. 4b and Fig. A6 in online Appendix 1 at http://journals.cambridge.org/geo). The sheeted dyke complex contains mafic and felsic microgabbroic and gabbronoritic dykes with mutually intrusive contacts. These dykes either intrude the host amphibole gabbros/microgabbros (Fig. 4b) and plagiogranites (e.g. near Ahmad-Abad village) or are injected into other dykes (SE of Separo village). Pillow lavas and massive lava flows overlie the sheeted dyke complex. Plagioclase microlites and clinopyroxene are primary minerals of the lavas. Once-glassy lava groundmass is altered into reddish clay.
Globotruncana-bearing Upper Cretaceous (Coniacian–Maastrichtian) pelagic limestones overlie the pillow lavas and are found as thin screens between pillows. Pelagic limestones are unconformably overlain by grey sandy limestones of Palaeogene age (Davoudzadeh, Reference Davoudzadeh1972). A basal conglomerate containing ophiolitic cobbles indicates Early Paleocene uplift and erosion of the ophiolite. Diabasic sills with boninitic affinities intrude Middle to Upper Paleocene limestones (H. Shafaii Moghadam, unpub. Ph.D. thesis, Shahid Beheshti Univ., Tehran, Iran, Reference Shafaii Moghadam, Whitechurch, Rahgoshay and Monsef2009). Small Oligo-Miocene dacitic domes with adakitic signatures cross-cut the Nain ophiolite (H. Shafaii Moghadam, unpub. Ph.D. thesis, Shahid Beheshti Univ., Tehran, Iran, Reference Shafaii Moghadam, Whitechurch, Rahgoshay and Monsef2009).
3.b.2. Dehshir ophiolite
The Dehshir ophiolite is exposed discontinuously over ~ 150 km2 near the centre of the IB (Fig. 2 and Fig. A7 in online Appendix 1 at http://journals.cambridge.org/geo). The lavas of this ophiolite are conformably capped by Turonian–Maastrichtian (93.5–65.5 Ma) Globotruncana-bearing pelagic limestones. This ophiolite was first described as part of regional geological mapping (Sabzehei, Reference Sabzehei1997). More detail is presented by Shafaii Moghadam, Stern & Rahgoshay (Reference Shafaii Moghadam, Stern and Rahgoshay2010).
The Dehshir ophiolite mantle sequence includes harzburgite, clinopyroxene- bearing harzburgite and cumulate rocks including plagioclase lherzolite, clinopyroxenite, leucogabbro and pegmatite gabbro (see Fig. A6 in online Appendix 1 at http://journals.cambridge.org/geo). Plagioclase and clinopyroxene are the predominant cumulus phases in pegmatite gabbros. Clinopyroxene is partly converted into tremolite whereas plagioclase is altered into sericite and clay. Plagioclase occurs as large euhedral cumulus grains in leucogabbros and together with clinopyroxene displays coarse-grained granular texture. More rarely plagioclase laths are aligned, defining magmatic foliation. Olivine is interstitial between plagioclase. Accessory phases are titanomagnetite and ilmenite occurring as intercumulus grains.
Diabasic dykes and isotropic gabbros intrude the harzburgite (Fig. 4c). Diabasic dykes are fine- to medium-grained, aphyric to moderately porphyritic with clinopyroxene and plagioclase phenocrysts set in an intergranular groundmass. Plagioclase and clinopyroxene are the main constituents of isotropic gabbros and show intergranular to sub-ophitic textures. Green amphiboles (magnesio-hornblende) and disseminated ilmenites are present in isotropic gabbros.
The Dehshir ophiolite crustal section comprises pillowed basalts, basaltic and basaltic-andesitic massive flows, and a basaltic-dacitic sheeted dyke complex (Fig. 4d). Pillowed and massive lavas are moderately porphyritic, with clinopyroxene and plagioclase phenocrysts set in a glassy groundmass with plagioclase microlites. Albite microlites, K-feldspar and quartz are the main constituents of dacitic dykes in the sheeted dyke complex. Plagiogranite occurs both as dykelets injected into isotropic gabbros and as small plugs emplaced in metamorphic rocks. Plagioclase, orthoclase and anhedral quartz with accessory amphibole and biotite are found in plagiogranite.
3.b.3. Shahr-e-Babak ophiolite
The Shahr-e-Babak ophiolite lies ~ 100 km SE of Dehshir (Fig. 2) and covers ~ 500 km2. It is bounded to the west by the Dehshir–Baft fault, to the SSW by Sanandaj–Sirjan metamorphic rocks and to the NNE by the Dehaj–Sarduiyeh magmatic belt (see Fig. A8 in online Appendix 1 at http://journals.cambridge.org/geo), which is part of the Urumieh–Dokhtar arc (Dimitrijevic, Reference Dimitrijevic1973). Faulting, shearing, displacement of ophiolite units and tectonic interleaving with younger units is common. This ophiolite was first described by Dimitrijevic (Reference Dimitrijevic1973) as a result of mapping in the Kerman region. Shahr-e-Babak comprises a complete ophiolite sequence except for a sheeted dyke complex (Ghazi & Hassanipak, Reference Ghazi and Hassanipak2000). Two geochemical signatures are observed: arc-like basalts, andesites and rhyodacites and ocean-island basalt (OIB)-like trachy-andesites. Ghazi & Hassanipak (Reference Ghazi and Hassanipak2000) proposed formation in a narrow oceanic basin that opened between the Central Iranian microcontinent and the SSZ, followed by subduction to the NW.
The Shahr-e-Babak ophiolite mantle sequence is dominated by highly serpentinized harzburgites. Diabasic dykes and isotropic gabbro lenses commonly intrude harzburgite (see Fig. A6 in online Appendix 1 at http://journals.cambridge.org/geo). Isotropic gabbros are common within the mantle sequence as small lenses cut by plagiogranitic veins. The volcanic sequence is composed of basalt, andesite, dacite and rhyolite. These are either massive lava flows or are interbedded (associated with diabasic mafic rocks) with Campanian–Maastrichtian pelagic sediments (Fig. 4f). Massive and pillowed lavas overlie the interbedded volcanic sequence. Rhyolitic dykes and sills cross-cut andesite and basalt near Chah-Bagh village (Fig. 4e). Shallow dioritic-granitic plutons intrude the massive lavas (see Fig. A6 in online Appendix 1 at http://journals.cambridge.org/geo).
Basalts contain altered plagioclase phenocrysts and microlites associated with clinopyroxene. Plagioclase (albite-oligoclase) is the predominant mineral in andesites, < 2% in aphyric andesite and > 20% in porphyritic andesite. Clinopyroxene and amphibole (edenitic to pargasitic hornblende) are also common in andesite. Plagioclase microlites with fine-grained quartz are present in the groundmass of these rocks. Coarse-grained plagioclase and quartz are the main constituents of dacites, with less abundant sanidine and apatite. Spherulitic intergrowth of albite, fine-grained polycrystalline to cryptocrystalline quartz and chlorite is characteristic of rhyolitic lavas.
Coniacian–Maastrichtian pelagic limestones overlie the basaltic-dacitic rocks of the Shahr-e-Babak volcanic sequence (Fig. 4e). Younger sediments record a hiatus during Paleocene to Early Eocene time, an unconformity overlain by Eocene conglomerate, which grades upwards into Nummulites-bearing limestones and then into coarse- to medium-grained sandstones. Ophiolitic cobbles are common in Eocene conglomerates (Dimitrijevic, Reference Dimitrijevic1973), demonstrating that the ophiolite was exposed and eroded at this time.
3.b.4. Balvard–Baft ophiolite
The Balvard–Baft ophiolite defines a 5–10 km wide WNW-trending belt, covering 800 km2 (see Fig. A9 in online Appendix 1 at http://journals.cambridge.org/geo). This ophiolite extends NW towards Shahr-e-Babak and SE to the Dare–Pahn and Haji–Abad ophiolites (Fig. 2). The first report on the Balvard–Baft ophiolite was by Dimitrijevic (Reference Dimitrijevic1973) as a result of mapping of the Kerman region. Two types of basaltic pillow lavas and lava flows are recognized in the Baft and the Gogher (Balvard) regions (Arvin & Robinson, Reference Arvin and Robinson1994; Arvin & Shokri, Reference Arvin and Shokri1997): (1) tholeiites similar to N-MORB and (2) transitional tholeiites, geochemically intermediate between E-MORB and IAT, clearly produced by melting of a subduction-modified mantle.
The Balvard–Baft mantle sequence consists of harzburgite, minor lherzolite with diabasic dykes, and pockets of isotropic and pegmatitic gabbro. Harzburgite has porphyroclastic texture, with coarse, deformed orthopyroxene. Serpentinized olivine, clinopyroxene and dark brown spinel are other peridotite constituents. Plagioclase and clinopyroxene are the predominant cumulus phases in pegmatitic gabbros, with traces of olivine and spinel (< 3%). Plagioclase and clinopyroxene are the main constituents of the isotropic gabbros, with accessory magnetite and ilmenite.
Mafic to felsic rocks including pillow lavas, basaltic-andesitic-dacitic lava flows, and basaltic-andesitic-dacitic sills in pyroclastic rocks (Fig. 4g) are the Balvard–Baft ophiolite crustal units. Pillowed and massive lavas are porphyritic, with coarse-grained, euhedral to subhedral plagioclase and subhedral to anhedral clinopyroxene phenocrysts set in an altered glassy groundmass with plagioclase microlites. Basaltic lava flows are characterized by plagioclase and clinopyroxene whereas hornblende and plagioclase are dominant in andesites and dacites. Basaltic-andesitic and dacitic sills in pyroclastic rocks contain altered plagioclase laths set in a groundmass of altered glass and plagioclase microlites. Clinopyroxene phenocrysts are present, except in dacites, altered to uralite and chlorite especially around their margins. Some lavas are nearly aphyric with 1–2% plagioclase phenocrysts and pilotaxitic texture. Pyroclastic rocks and hyaloclastites rest unconformably over the basaltic lava flows (Fig. 4h). They are composed of volcanic breccias, agglomerates, tuff, tuffaceous sandstones and lutites, pillow cold breccias and andesitic hyaloclastites with basaltic-andesitic and pillow fragments. Volcaniclastic rocks are overlain by Turonian–Maastrichtian (93.5–65.5 Ma) pelagic limestones. The Balvard–Baft ophiolite is in fault or unconformable contact with Middle to Upper Eocene sedimentary-volcanic sequences related to the Urumieh–Dokhtar arc (Srdic et al. Reference Srdic, Dimitrijevic, Cvetic and Dimitrijevic1972; Mijalkovic, Cvetic & Dimitrijevic, Reference Mijalkovic, Cvetic and Dimitrijevic1972). These sediments consist of sandstone, marl and Nummulites-bearing limestone turbidites, with interbedded basaltic-andesitic lava flows above a basal conglomerate. The Early Eocene appears to have been a time of uplift and erosion of the ophiolite, as evidenced by ophiolitic clasts in Middle Eocene basal conglomerate.
3.c. Summary of similarities and differences between inner and outer belt ophiolites
Major lithological variations in Zagros ophiolites are summarized in Table 1. As can be seen from the above summaries, mantle rocks of both inner and outer Zagros ophiolites are dominated by depleted harzburgites with gabbroic-diabasic dykes. Lherzolite and gabbro are subordinate but common. Boninitic dykes are restricted to the Nain (inner belt) ophiolite. Large chromite pods and residual to cumulate dunitic lenses are restricted to the outer Zagros Neyriz and Haji–Abad ophiolites. Although gabbroic impregnations are present in almost all inner and outer belt ophiolites, they are especially common in the Nain massif. Pegmatitic and isotropic gabbro lenses are common in the mantle sequence of all ophiolites; however, gabbronorites are found only in Nain harzburgites.
Summary of outer and inner Zagros ophiolitic belt characteristics

* Crustal thickness except overlying sediments.
1Delaloye & Desmons (Reference Delaloye and Desmons1980); 2Babaie et al. (Reference Babaie, Babaei, Ghazi and Arvin2006); 3Lanphere & Pamic (Reference Lanphere and Pamic1983); 4Jannessary (2003); 5Shafaii Moghadam et al. (Reference Shafaii Moghadam, Whitechurch, Rahgoshay and Monsef2009).
Crustal sequences of both inner and outer belt ophiolites are dominated by lavas, both pillowed and massive. Sheeted dyke complexes are found in both inner (Nain, Dehshir) and outer (Kermanshah, Neyriz) belt ophiolites. More-evolved felsic rocks including dacitic-rhyolitic lavas and plagiogranites are common in all ophiolites. Gabbros are generally minor parts of most crustal sections. Lenses of cumulate rocks are common in these ophiolites but crustal cumulates are present only in the Neyriz and Haji–Abad (OB) ophiolites. Isotropic gabbros are common in the Zagros IB crustal sequence and rare in the OB.
Overlying sedimentary sequences also are similar and distinctive. Pyroclastic rocks with basaltic to dacitic sills are abundant only for the Balvard–Baft ophiolite, but are also found at Shahr-e-Babak; these are not found in OB ophiolites, indicating that IB ophiolites were closer to the evolving Urumieh–Dokhtar arc. All inner and outer belt ophiolites are associated with overlying Upper Cretaceous pelagic limestones, except for the Neyriz ophiolite where the pelagic sediments are interbedded with lavas. Pelagic sediment interlayers are also common in the Shahr-e-Babak and Balvard–Baft ophiolites. The age of the pelagic limestones varies from Cenomanian–Turonian (99.6–89.3 Ma) to Early Santonian (85.8–83.5 Ma) in the Neyriz and Turonian (93.5–89.3 Ma) to Maastrichtian (70.6–65.5 Ma) in the Kermanshah OB ophiolites, and from Coniacian–Maastrichtian (89.3–65.5 Ma) in the Nain and Turonian–Maastrichtian (93.5–65.5 Ma) in the Dehshir and Baft IB ophiolites (Table 1). All sedimentary successions record a Paleocene–Eocene unconformity with ophiolitic clasts, indicating that the Zagros ophiolites were exposed and eroded by that time.
4. Geochemical evolution of the Zagros ophiolite lavas and dykes
In this section we summarize the principal geochemical properties of the Zagros Upper Cretaceous ophiolite magmas, as preserved in lavas and dykes, using major, trace and rare earth element (REE) concentrations. We also try to reconstruct the magmatic evolution of the ophiolites, as reconstructed from lavas or dykes. We understand that caution is needed when considering ophiolitic dykes, because some are much younger than the ophiolite, for example Kermanshah has Eocene–Miocene dioritic-gabbroic intrusions and felsic dykes (e.g. Leterrier, Reference Leterrier1985). We have been careful to avoid sampling such younger dykes or intrusions. Data on Zagros IB ophiolites come from H. Shafaii Moghadam (unpub. Ph.D. thesis, Shahid Beheshti Univ., Tehran, Iran, Reference Shafaii Moghadam, Whitechurch, Rahgoshay and Monsef2009) except for Dehshir, which comes from Shafaii Moghadam, Stern & Rahgoshay (Reference Shafaii Moghadam, Stern and Rahgoshay2010). For the Neyriz ophiolite we used data from M. R. Jannessary (unpub. Ph.D. thesis, l'Univ. de Louis Pasteur, France, 2003). Major and trace element analyses for the Kermanshah and Haji–Abad ophiolites were carried out using inductively coupled plasma atomic emission spectrometry (ICP-AES) and ICP mass spectrometry at the Centre de Geochimie de la Surface, Strasbourg (France) and ACME Lab (Canada), respectively. Whole-rock compositional data are reported in online Appendix 2 at http://journals.cambridge.org/geo.
Despite the often-disrupted nature of the Upper Cretaceous Zagros ophiolites, the relationships between lava units and analysed samples for intact fragments of both inner and outer Zagros ophiolitic belts are shown for the OB (see Fig. A10 in online Appendix 1 at http://journals.cambridge.org/geo) and IB (see Fig. A11 in online Appendix 1 at http://journals.cambridge.org/geo). For chemostratigraphy within each ophiolite, our sampling was based on the intact ophiolitic fragments, where original, unfaulted contacts between units are clear (as shown in Figs A2 and A6 in online Appendix 1 at http://journals.cambridge.org/geo) and not from mélange units.
4.a. Outer Zagros Ophiolitic Belt
Lavas and dykes from the OB ophiolites are dominated by mafic (50–54 wt% SiO2) samples but also include a significant proportion of felsic material (up to 72 wt% SiO2), as shown by a histogram of SiO2 contents (Fig. 5a). This is a much wider range in SiO2 than observed at mid-ocean ridges, which are entirely basalts and basaltic-andesites.
Histograms of wt% SiO2 (recalculated 100% anhydrous) for Zagros ophiolite lavas and dykes from sheeted dyke complex. Highly altered samples with high LOI content are not plotted. Most samples have 50–56 wt% SiO2 but there is a significant proportion of samples with > 60 wt% SiO2.

4.a.1. Kermanshah ophiolite
The Kermanshah ophiolite magmatic succession is characterized by a sheeted dyke complex with mafic and felsic dykes, as well as by massive and pillowed lavas. To reconstruct the magmatic chemostratigraphy of this well-preserved ophiolite, we studied four sections along the Kherran to Sartakht road, near Sartakht village and near Siah-Pareh village.
Along the Kherran to Sartakht road there is a volcanic pile with sparsely phyric basaltic-andesites at the bottom grading upwards into porphyritic basalts with plagiogranitic veins and then into pillowed lavas (Fig. 3a and Fig. A10a in online Appendix 1 at http://journals.cambridge.org/geo). This sequence is capped by a thin basaltic flow. These lavas are basaltic with 49.6–52 wt% SiO2. They have high FeO/MgO, and in the FeO/MgO v. SiO2 diagram plot in the high-Fe tholeiitic field (Fig. 6). Mg no. (= 100 Mg/(Mg + Fe)) of these lavas varies from 43.4 to 66.4, indicating some are primitive. TiO2 and Zr contents vary from ~ 1 to 1.9 wt% (Fig. 7) and 69 to 166 ppm, respectively. Sample KH09-24 has higher Zr content along with lower Mg no.
FeOt/MgO v. SiO2 (volatile free, normalized to 100% total) for Zagros OB and IB magmatic rocks. Boundaries between tholeiitic and calc-alkaline suites (thin solid line) and between low-, medium- and high-Fe suites (thick, dashed lines) are from Miyashiro (Reference Miyashiro1974) and Arculus (Reference Arculus2003), respectively. For comparison compositional fields from the Kizildag ophiolite, Turkey (Dilek & Thy, Reference Dilek and Thy2009), Oman (Godard, Dautria & Perrin, Reference Godard, Dautria and Perrin2003) and IBM fore-arc lavas (Reagan et al. Reference Reagan, Ishizuka, Stern, Kelley, Ohara, Blichert-Toft, Bloomer, Cash, Fryer, Hanan, Hickey-Vargas, Ishii, Kimura, Peate, Rowe and Woods2010) are shown.

Major element variations (TiO2 v. MgO) of OB and IB mafic rocks and comparisons to Troodos upper and lower lavas (modified after Dilek & Thy, Reference Dilek and Thy2009). Troodos upper and lower lava fields are outlined by dashed and dotted lines, respectively.

On REE plots, samples KH09-17 (poorly phyric basaltic flow), KH09-19 (basaltic flow) and KH09-20 (pillow lava) have flat to slightly depleted REE patterns (LaN/YbN = 0.75–1.1) (Fig. 8a). These samples show similar REE patterns except for slight Eu enrichment in KH09-17 and KH09-19, with REE contents similar to N-MORB (e.g. La = 2.2–4.1 ppm, Yb = 2.1–2.6 ppm versus N-MORB = 2.5 ppm La, 3.05 ppm Yb; Sun & McDonough, Reference Sun, McDonough, Saunders and Norry1989). Sample KH09-24 is LREE enriched (LaN/YbN = 2.4) similar to calc-alkaline lavas (Fig. 8a). The N-MORB-normalized trace element patterns for Kermanshah basaltic rocks show strong depletion in Nb–Ta relative to light REEs (LREEs) (Nb/La = 0.5–0.9 × N-MORB) (Fig. 8b). These basalts are enriched in large-ion-lithophile elements (LILEs) (e.g. Rb, Ba, U, K, Pb) relative to LREEs. All basaltic rocks in this sequence are IAT except KH09-24 which displays a calc-alkaline affinity. IAT and calc-alkaline lavas interfinger in this sequence.
Chondrite-normalized rare earth element patterns (chondrite abundances are from McDonough & Sun, Reference McDonough and Sun1995) and normal mid-ocean ridge basalt (N-MORB)-normalized multi-element patterns (N-MORB concentrations are from Sun & McDonough, Reference Sun, McDonough, Saunders and Norry1989) for rock units of outer belt ophiolites. (a, b) Kermanshah ophiolite; (c, d) Neyriz ophiolite; and (e, f) Haji–Abad ophiolite.

A sheeted dyke complex near Kherran village contains older diabasic dykes intruded by younger andesitic-dacitic-rhyolitic dykes (Fig. 3b, c and Fig. A10 in online Appendix 1 at http://journals.cambridge.org/geo). All mafic dyke samples (KH09-26, KH09-36 and KH09-37) are basalts and basaltic-andesites, with 51 to 54 wt% SiO2. These lavas have lower FeO/MgO and plot in the medium-Fe tholeiitic to low-Fe calc-alkaline fields (Fig. 6). They are fractionated, with low Mg no. (44 to 53.9) and elevated TiO2 (1.7 to 2.8 wt%) (Fig. 7) and Zr (212 to 316 ppm). These mafic lavas are LREE enriched (Fig. 8a) with LaN/YbN ranging from 2.8 to 3.3. Depletion in Nb–Ta and enrichment in Rb, Ba, Th, U, K and Pb relative to N-MORB (e.g. Nb/La = 0.55–0.7 × N-MORB and Th/La = 5.6–6.3 × N-MORB) are characteristic of these mafic dykes (Fig. 8b). Felsic dykes have higher SiO2 (53–56 wt%) and Zr contents (426–474 ppm). They contain 5.6–5.9 wt% Na2 O, which may be magmatic because alteration is not severe, as shown by low loss on ignition (LOI: 0.4–0.8 wt%).
Kherran dykes show REE patterns that are concave upwards from La to Eu (Fig. 8a), with a slight increase from heavy REEs (HREEs) to middle REEs (MREEs) (DyN/YbN = 1.1–1.3 × chondrite) and low LaN/SmN (0.7–0.96) but with LaN/YbN = 0.98–2.2. These patterns may be attributed to crystal fractionation of basaltic melt to form felsic magmas. Like the mafic rocks, felsic dykes show slight negative Nb–Ta (and Ti) and positive Rb, Ba, Th, K, U and Pb anomalies relative to N-MORB (e.g. Nb/La = 0.88 × N-MORB, except KH09-31 with Nb/La = 2.5 × N-MORB and Th/La = 28.5–7.3 × N-MORB) (Fig. 8b). In this section, earlier mafic dykes are calc-alkaline grading into later felsic dykes that probably are fractionated arc tholeiites or products of amphibolite melting.
A well-preserved pillow lava sequence near Siah-Pareh village is > 100 m thick (Fig. A10c in online Appendix 1 at http://journals.cambridge.org/geo and Fig. 3d). To characterize the melt evolution with time, we sampled from the bottom to the top of this pillow sequence. These are fractionated basalts, with relatively constant SiO2 (~ 52 wt%) and low Mg no. (44–47). These lavas have lower FeO/MgO and are similar to low-Fe calc-alkaline lavas (Fig. 6). They are characterized by high TiO2 (~ 1.8 wt%) and Zr (~ 200 ppm), similar to lower Troodos lavas (Fig. 7). REE patterns (Fig. 8a) do not change systematically from the bottom to the top of the pillow sequence. The lavas have similar REE patterns, enriched in LREEs (LaN/YbN = 2.2–2.9) and LILEs (e.g. Th/La = 28.5–7.3 × N-MORB), and depleted in Nb–Ta (e.g. Nb/La = 0.5–0.6 × N-MORB), typical features of calc-alkaline rocks.
A sheeted dyke complex overlain by pillow lavas is found between Sartakht and Siah-Pareh villages (see Fig. A10d in online Appendix 1 at http://journals.cambridge.org/geo). These lavas are fractionated basalts and basaltic-andesites, with variable SiO2 (49–54 wt%), Mg no. (31–59) and calc-alkaline signature (Fig. 6). They vary from more primitive (KH09-75 and KH09-79 with MgO = 6.41 wt%, TiO2 = 1.22–1.4 wt% and Zr = 125–138 ppm, respectively) to more evolved (KH09-82 and KH09-76 with MgO = 2.89–3.34 wt%, TiO2 = 2.46–2.51 wt% and Zr = 230–255 ppm, respectively) (Fig. 7). All lavas are LREE enriched, with LaN/YbN between 3 and 3.6 (Fig. 8a). Depletion in Nb–Ta (e.g. Nb/La = 0.5–0.7 × N-MORB) and enrichment in LILEs (e.g. Th/La = 5.3–6.5 × N-MORB), similar to calc-alkaline series, characterizes these lavas.
Kermanshah lavas display both tholeiitic and calc-alkaline trends in terms of FeO/MgO v. SiO2 (Fig. 6), with dispersion in FeO/MgO and SiO2 contents. Such dispersion along with the presence of tholeiitic and calc-alkaline lavas was considered by Miyashiro (Reference Miyashiro1973) to be typical of arc magmas. The Kermanshah lavas have high TiO2 contents with a primary to evolved nature, evidenced by their MgO content (Fig. 7). Kermanshah lavas have high Ti/V, ranging from 35 in arc tholeiites to 104 in calc-alkaline lavas. In spite of LILE enrichments and Nb–Ta depletions, characteristics indicating arc-like compositions, these ratios fall into the MORB and within-plate fields of Shervais (Reference Shervais1982) (Fig. 9a).
Ti v. V diagram (after Shervais, Reference Shervais1982) for Zagros outer belt (a) and inner belt (b) ophiolites. For comparison, fields for the V1 (lower, Geotimes unit) and V2 (upper, Lasail unit) lavas of Oman ophiolite (data from Alabaster, Pearce & Malpas, Reference Alabaster, Pearce and Malpas1982) and for Mariana fore-arc basalts and boninites (Reagan et al. Reference Reagan, Ishizuka, Stern, Kelley, Ohara, Blichert-Toft, Bloomer, Cash, Fryer, Hanan, Hickey-Vargas, Ishii, Kimura, Peate, Rowe and Woods2010) are shown.

Reconstruction of Kermanshah ophiolitic lava chemostratigraphy indicates that lava compositions do not show major changes in the sections described above, only interfingering of IAT and calc-alkaline lavas in the Kherran to Sartakht road section.
4.a.2. Neyriz ophiolite
The volcanic and hypabyssal sequence of the Neyriz ophiolite is represented by mafic and felsic dykes in a sheeted dyke complex, massive and pillowed lavas, and dykes in mantle peridotite. Despite several studies on the Neyriz ophiolite (e.g. Babaie et al. Reference Babaie, Babaei, Ghazi and Arvin2006; M. R. Jannessary, unpub. Ph.D. thesis, l'Univ. de Louis Pasteur, France, 2003), we know little about its chemostratigraphical evolution, probably because the crustal sequence is highly faulted. Here we try to combine our field observations plus geochemical data from M. R. Jannessary (unpub. Ph.D. thesis, l'Univ. de Louis Pasteur, France, 2003). We selected three volcanic sequences for closer scrutiny: (1) isolated diabasic to andesitic dykes injected into mantle harzburgites (NJ755, NJ633, NJ294, NJ296, NJ217), (2) Dowlat–Abad pillowed and massive lavas with intercalated pelagic sediments (NJ223, NJ5, NJ303, NJ222) (Fig. 3e and Fig. A10e in online Appendix 1 at http://journals.cambridge.org/geo) and (3) Tale–Afshari sheeted dyke/lava sequence with felsic and mafic dykes (NJ591, NJ594, NJ596, NJ609, NJ603, NJ601) (Fig. 3f and Fig. A10f in online Appendix 1 at http://journals.cambridge.org/geo). Unfortunately we cannot separately discuss the lava and dyke geochemistry because these are not distinguished.
Dykes intruding mantle rocks vary from basaltic (diabasic) to andesitic with 45 to 54 wt% SiO2 (Fig. 5a). These dykes are mostly tholeiitic with high FeO/MgO (Fig. 6). These dykes display variable enrichment in TiO2 (0.3–2.2 wt%) and Zr (10–92 ppm). In the TiO2 v. MgO diagram, TiO2-rich dykes resemble lower lavas of Troodos while TiO2-poor dykes show similarity to Troodos upper lavas (Fig. 7). They are geochemically divided into (1) IAT-like dykes that are enriched in bulk REEs (NJ633 and NJ755; La = 3.3–4.8 ppm, Yb = 3.2–4.3 ppm versus N-MORB = 2.5 ppm La, 3.05 ppm Yb; Sun & McDonough, Reference Sun, McDonough, Saunders and Norry1989) but are LREE depleted (LaN/YbN = 0.8), have modest negative Nb anomalies (Nb/La = 0.8 × N-MORB) and are enriched in LILEs relative to LREEs (e.g. Th/La = 1.7–1.8 × N-MORB) (Fig. 8c, d); and (2) boninitic dykes, which are depleted in bulk REEs (NJ294, NJ296, NJ217) with La = 0.7–1 ppm and Yb = 1–1.8 ppm (versus N-MORB = 2.5 ppm La, 3.05 ppm Yb; Sun & McDonough, Reference Sun, McDonough, Saunders and Norry1989), are LREE depleted (LaN/YbN = 0.3–0.7), have negative Nb anomalies (Nb/La = 0.6–0.8 × N-MORB) and are enriched in positive LILEs relative to LREEs (e.g. Th/La = 3–4.6 × N-MORB) (Fig. 8c, d). Boninitic dykes also have lower Zr and TiO2 contents.
Dowlat–Abad pillow lavas (Fig. 3e and Fig. A10e in online Appendix 1 at http://journals.cambridge.org/geo) are andesitic to dacitic with variable SiO2 (56–68 wt%; Fig. 5a) and Zr contents (67–106 ppm). They have high FeO/MgO (Fig. 6) and moderate TiO2 (1.4–1.7 wt%) (Fig. 7a). They have approximately flat REE patterns (Fig. 8c) with LaN/YbN = 0.7–1.3, Nb depletion (Nb/La = 0.5–0.8 × N-MORB) and LILE enrichment (e.g. Ba/La = 1.2–8.9 × N-MORB), transitional between N-MORB and IAT (similar to fore-arc basalts).
Tale-Afshari lavas and dykes include both more- and less-evolved samples (M. R. Jannessary, unpub. Ph.D. thesis, l'Univ. de Louis Pasteur, France, 2003). Less-evolved lavas are characterized by low SiO2 (50–55 wt%), Zr (20–65 ppm) and higher MgO (2.4–6.4 wt%). Lower MgO (0.5–2.5 wt%) and higher Zr (48–205 ppm) and SiO2 (63–70 wt%) contents of more-evolved samples confirm these represent fractionated magmas. They are mostly tholeiitic (Fig. 6) and similar to lower lavas of Troodos (Fig. 7). More-evolved types have higher bulk REE concentrations (e.g. La = 5.2–6.6 ppm, Yb = 4.8–7.4 ppm versus N-MORB = 2.5 ppm La, 3.05 ppm Yb; Sun & McDonough, Reference Sun, McDonough, Saunders and Norry1989) with LREE depletion (LaN/YbN = 0.6–0.8) and negative Nb anomalies (Nb/La = 0.4–0.5 × N-MORB). These types of lavas show negative Eu anomalies (Eu/Eu* = 0.7–0.8) indicating plagioclase differentiation. The less-evolved types do not show negative Eu anomalies and are characterized by lower bulk REE contents (e.g. La = 1.6–2.3 ppm, Yb = 2.3–3.1 ppm v. N-MORB = 2.5 ppm La, 3.05 ppm Yb; Sun & McDonough, Reference Sun, McDonough, Saunders and Norry1989). These types also show LREE depletion (LaN/YbN = 0.5–0.6) and significant Nb anomalies (Nb/La = 0.5–0.8 × N-MORB). Both Tale–Afshari lava types have an IAT signature, indicating formation in a suprasubduction zone environment. Most Neyriz lavas are medium- to high-Fe tholeiitic (Fig. 6), characterized by low MgO and high TiO2 contents resembling Troodos lower lavas (Fig. 7). Some boninitic samples, with lower FeO/MgO and TiO2 abundances, are similar to Troodos upper lavas (Fig. 7). On a Ti v. V diagram (Shervais, Reference Shervais1982) (Fig. 9a), some plot as IAT while others have slightly higher TiO2 content, transitional between MORB and IAT.
4.a.3 Haji–Abad ophiolite
Haji–Abad ophiolitic lavas vary in composition from tholeiitic to calc-alkalic (Fig. 6) and from moderately high to very low TiO2 contents. Three volcanic sequences are distinguished: (1) older E-MORB-type pillow lavas, (2) calc-alkaline volcanic rocks and (3) younger boninitic lavas. E-MORB type pillow lavas (HG10-21, HG10-25 & HG10-26) are found near the MZT, especially near Sheikh-Ali village (see Fig. A4 in online Appendix 1 at http://journals.cambridge.org/geo). These older, E-MORB-type lavas are highly altered with relatively high LOI contents (7.9–10.6 wt%) and variably fractionated Mg no. (47–53). They are high-Fe tholeiitic (Fig. 6) similar to Troodos lower lavas (Fig. 7). These lavas have moderately high TiO2 (1.5–1.8 wt%) (Fig. 7) and plot in the MORB field on a Ti v. V diagram (Shervais, Reference Shervais1982), similar to V1 Oman lavas (Fig. 9a), thought to be the first lavas to erupt. Haji–Abad E-MORB lavas are LREE enriched (LaN/YbN = 4.3–7.2) (Fig. 8e) and have positive Nb anomalies (Nb/La = 1.4–1.7 × N-MORB). They are enriched in LILEs (e.g. Th/La = 2.5–3.1 × N-MORB) (Fig. 8f).
Calc-alkaline lavas are massive or pillowed and are associated with pelagic limestone layers in the Chale–Mort to Haji–Abad tectonic mélange; they are also stratigraphically overlain by pelagic limestones (see Fig. A10g in online Appendix 1 at http://journals.cambridge.org/geo). Sample HG10-17 is from a lava flow on top of the turbidite sequence. These lavas are acidic andesite to dacite in composition with SiO2 and TiO2 ranging from 60 to 69 wt% (except sample HG10-14 that is characterized by SiO2 leaching during alteration and a high content of LOI; 10.8 wt%) and 0.47 to 0.95 wt%, respectively. They are more-evolved lavas, with Mg no. indicating significant fractionation, from 33 to 43. In the FeO/MgO against SiO2 diagram, these lavas plot in the tholeiitic field (Fig. 6) similar to Troodos lower lavas (Fig. 7). These lavas are slightly enriched in LREEs (LaN/YbN = 1.6–2.2) and LILEs (e.g. Th/La = 2.6–3.2 × N-MORB and Pb/La = 1.1–5.7 × N-MORB). They are strongly depleted in Nb (Nb/La = 0.3–0.8 × N-MORB) and TiO2 (0.5–0.9 wt%), as expected for subduction-related igneous rocks.
Late boninitic magmatism is represented by pillowed and massive lavas. They are basaltic to basaltic andesite in composition with variable SiO2 (41–54 wt%) and Mg no. (43.8–76.9). The low SiO2 content of some lavas may partly reflect alteration, as indicated by high LOI (4.2–6.2 wt%). These lavas have very low Zr (4.7–6.1 ppm) and TiO2 (0.3–0.4 wt%) contents and FeO/MgO and are similar to Troodos upper lavas (Figs 6, 7). Their low Ti and V contents plot in the boninitic field of the Shervais (Reference Shervais1982) discrimination diagram (Fig. 9a). Haji–Abad boninitic lavas also are highly depleted in bulk REEs (e.g. La = 0.1–0.3 ppm, Yb = 0.9–1.2 ppm v. N-MORB = 2.5 ppm La, 3.05 ppm Yb; Sun & McDonough, Reference Sun, McDonough, Saunders and Norry1989). They are strongly LREE depleted (LaN/YbN = 0.1–0.2) (Fig. 8e), with large negative Nb anomalies (e.g. Nb/Th ~ 0.1 × N-MORB) and are strongly enriched in LILEs relative to LREEs (e.g. Th/La = 13.9–41.7 × N-MORB). These boninites are similar to the Ca-boninites of Falloon & Crawford (Reference Falloon and Crawford1991). A late microgabbroic dyke injected into the Haji–Abad mantle sequence (HG10-30) is compositionally similar to boninitic lavas. The dyke has low contents of bulk REEs (e.g. La = 0.2 ppm and Yb = 0.5 ppm), TiO2 (0.2 wt%) and Zr (2.5 ppm). This dyke is very depleted in LREEs (LaN/YbN = 0.3) and Nb (Nb/La = 0.5 × N-MORB), similar to boninites. This may be a feeder dyke for the boninitic lavas.
We tentatively conclude that Haji–Abad magmatism evolved from early E-MORB to boninitic.
4.b. Inner Zagros Ophiolitic Belt
The composition of IB ophiolitic lavas and dykes is similar to that of OB rocks, including a wide range in SiO2 contents, extending to much higher values than seen in modern mid-ocean ridge lavas (Fig. 5b). IB lavas and dykes are bimodal in SiO2 content, with two modes: (1) between 50 and 56 wt% and (2) > 61 wt%. This type of chemical variability among the IB lavas as well as OB lavas, in the sense of silica distribution, resembles that of island arc magmatic sequences (Miyashiro, Reference Miyashiro1973; Pearce & Robinson, Reference Pearce and Robinson2010).
4.b.1. Nain ophiolite
Crustal rock units in the Nain ophiolite consist of massive and pillowed lavas, a sheeted dyke complex and amphibole gabbros, which also serve as a root zone for the sheeted dyke complex. Diabasic-gabbroic-noritic dykes and isotropic gabbro lenses are widespread within the Nain mantle sequence. To better constrain the chemostratigraphic evolution of the Nain ophiolite, we sampled two sequences where age relationships are clear: (1) a sheeted dyke complex with overlying pillow lavas and underlying gabbros and plagiogranites (see Fig. A11a in online Appendix 1 at http://journals.cambridge.org/geo), and (2) intrusions in mantle peridotite, including early rodingitized diabasic-gabbroic dykes/sills and late chloritized diabasic dykes (see Fig. A11b in online Appendix 1 at http://journals.cambridge.org/geo). The sheeted dyke complex includes earlier diabasic and later dacitic-rhyolitic-noritic dykes. In the root zone of this complex, the diabasic dykes intrude gabbros, microgabbros, amphibole gabbros and plagiogranite (see Fig. A11a in online Appendix 1 at http://journals.cambridge.org/geo). Dykes intrude each other at higher levels. A pillow lava sequence overlies the dyke complex and is covered by pelagic sediments.
Nain ophiolitic dykes are classified into earlier IAT and later boninitic dykes. The FeO/MgO of these dykes mostly distribute in medium-Fe tholeiitic to low-Fe calc-alkaline domains (Fig. 6). These dykes have variable and low contents of TiO2 (0.2–0.8 wt%) and Zr (17.5–32.5 ppm). Their low TiO2 content is similar to Troodos low-Ti upper lavas (Fig. 7). One early IAT dyke (BAH-14) is LREE depleted (LaN/YbN = 0.54) (Fig. 10a). This dyke contains less REE than N-MORB (e.g. La = 1.56 ppm, Yb = 2.07 ppm versus N-MORB = 2.5 ppm La, 3.05 ppm Yb; Sun & McDonough, Reference Sun, McDonough, Saunders and Norry1989). It is highly depleted in Nb–Ta (e.g. Nb/La = 0.31 × N-MORB) and enriched in LILEs relative to LREEs (e.g. Th/La = 2.8 × N-MORB) (Fig. 10b). Later boninitic-IAT and boninitic dykes are represented by samples BS05-16 and BS05-13, respectively. BS05-16 shows a LREE-depleted pattern (LaN/YbN = 0.45) whereas BS05-13 has a U-shaped REE pattern (Fig. 10a, b), with LaN/YbN = 1.05, typical of boninites (Crawford, Falloon & Green, Reference Crawford, Falloon, Green and Crawford1989). These dykes are depleted in REEs relative to N-MORB (e.g. La = 1.24–0.85 ppm, Yb = 0.85–1.36 ppm v. N-MORB = 2.5 ppm La, 3.05 ppm Yb; Sun & McDonough, Reference Sun, McDonough, Saunders and Norry1989). A negative Nb anomaly is common for these dykes (e.g. Nb/La = 0.3–0.9 × N-MORB). Late andesitic-dacitic dykes (BS05-12, BS05-8 A) intrude diabases in the Nain sheeted dyke complex. These dykes have 55–64 wt% SiO2 and 0.5–0.7 wt% TiO2, with low Zr contents (26–51 ppm). These plot in the calc-alkaline field on the FeO/MgO versus SiO2 diagram (Fig. 6). Felsic dykes are characterized by depleted LREEs (LaN/YbN = 0.5) and Nb–Ta (e.g. Nb/La = 0.5–0.96 × N-MORB) (Fig. 10a, b), similar to IAT trace element patterns. Sample BS05-8 A shows a negative Eu anomaly, suggesting that this was a highly fractionated melt in equilibrium with cumulate or residual plagioclase.
Chondrite-normalized rare earth element patterns (chondrite abundances are from McDonough & Sun, Reference McDonough and Sun1995) and normal mid-ocean ridge basalt (N-MORB)-normalized multi-element patterns (N-MORB concentrations are from Sun & McDonough, Reference Sun, McDonough, Saunders and Norry1989) for rock units of inner belt ophiolites. (a, b) Nain ophiolite; (c, d) Dehshir ophiolite; (e, f) Shahr-e-Babak ophiolite; and (g, h) Balvard–Baft ophiolite.

Pillowed tholeiitic lava (BAH-35) found above the sheeted dyke sequence has higher TiO2 (0.9 wt%) and Zr (61 ppm) relative to dykes. This lava has a flat REE pattern (LaN/YbN = 0.9) and is enriched in LILEs relative to LREEs (e.g. Ba/La = 7.7 × N-MORB). Th/La is higher than that of N-MORB (Th/La = 2.25 × N-MORB), and Ba is even more enriched (Ba/Th = 3.4 × N-MORB). Nb–Ta is depleted relative to K and U (e.g. U/Nb = 2.9 × N-MORB), although Nb content of the Nain pillow lava is slightly higher than that of N-MORB (Nb = 2.63 versus N-MORB = 2.33 ppm Nb; Sun & McDonough, Reference Sun, McDonough, Saunders and Norry1989).
Geochemically, most gabbros below the Nain sheeted dyke complex are LREE-depleted IAT (LaN/YbN = 0.77–0.16), except samples BAH-12 and BS05-11 which are boninitic (Fig. 10a, b). Most gabbros are depleted in Nb compared to LREEs (Nb/La = 0.23–1.6 × N-MORB) (Fig. 10b). BAH-12 and BS05-11 have very low REE contents (e.g. La = 0.16–0.34 ppm, Yb = 0.72–0.73 ppm versus N-MORB = 2.5 ppm La, 3.05 ppm Yb; Sun & McDonough, Reference Sun, McDonough, Saunders and Norry1989), indicating derivation from highly depleted mantle.
Dykes and sills intruding mantle peridotites, including a gabbroic dyke (BSP-3) and diabasic dykes (BSU-10 & BSU-11), are variably altered, from a rodingitized dyke with high LOI (9.5 wt%) to diabasic dykes with lower LOI (2.1–2.6 wt%). They are characterized by low TiO2 (0.5–0.8 wt%) and Zr (21–62 ppm). These dykes are LREE-depleted (Fig. 10a) (LaN/YbN = 0.9–0.4) with negative Nb–Ta (Nb/La = 0.3–0.2 × N-MORB) and positive LILE anomalies (U/La = 2.9–2.8 × N-MORB). The gabbroic dyke (BSP-3) is more differentiated (e.g. La = 2.73 ppm versus N-MORB = 2.5 ppm La; Sun & McDonough, Reference Sun, McDonough, Saunders and Norry1989) and the diabasic dyke BSU-10 is boninitic with low REE contents (e.g. La = 0.8 ppm versus N-MORB = 2.5 ppm La; Sun & McDonough, Reference Sun, McDonough, Saunders and Norry1989).
Most Nain lavas scatter in the FeO/MgO v. SiO2 diagram (Fig. 6). All Nain ophiolite rock units are depleted in immobile Nb and HREEs (Fig. 10b), demonstrating a subduction-related source for genesis of these magmas. On a Ti v. V diagram (Shervais, Reference Shervais1982), lavas show IAT or boninitic affinities (Fig. 9b) and otherwise resemble Troodos upper pillow lavas (Fig. 7). Injection of late boninitic and noritic dykes into early tholeiitic dykes indicate that Nain magmas evolved from early IAT into late boninites as the ophiolite formed. A similar conclusion is reached for dykes intruding mantle peridotites, where late boninitic and non-altered noritic dykes are found.
4.b.2. Dehshir ophiolite
Detailed geochemical data and interpretations were presented by Shafaii Moghadam, Stern & Rahgoshay (Reference Shafaii Moghadam, Stern and Rahgoshay2010); here we focus on the chemostratigraphy of ophiolite magmatic units. Fine-grained isotropic gabbros, pillow basalts, basaltic lava flows and basaltic-andesitic-dacitic dykes (in a sheeted dyke complex and intruding amphibole gabbros) are the magmatic rocks of the Dehshir ophiolite. These magmatic rocks belong to both the calc-alkaline and tholeiitic series (Fig. 6). Some samples are similar to Troodos lower lavas, with higher TiO2 contents, while others resemble Troodos upper lavas (Fig. 7).
Pillow lavas above the sheeted dyke complex (AZ06-32, DAR05-6) (Fig. 4c) and harzburgites (A06-2, A06-3) in the Ardan region (see Fig. A11d in online Appendix 1 at http://journals.cambridge.org/geo) show either flat REE patterns (LaN/YbN = 1.1–1.2) or are LREE enriched (LaN/YbN = 2.7–3.3) typical of IAT and calc-alkaline series, respectively (Fig. 10c). On an N-MORB-normalized trace element diagram, these lavas are depleted in Nb (Nb/La ~ 0.2–0.7 × N-MORB) and enriched in Pb, U, Ba and Th (e.g. Th/La ~ 1–3 × N-MORB) (Fig. 10d).
The sheeted dyke complex includes early basalts and late dacitic dykes (see Fig. A11c in online Appendix 1 at http://journals.cambridge.org/geo). An early basaltic dyke (sample AZ06-38) in the sheeted dyke complex has a nearly flat REE pattern (Fig. 10c) with LaN/YbN = 0.8. It shows no high-field-strength element (HFSE) depletion (Nb/La = 1.1 × N-MORB) and geochemically is similar to N-MORB. Late dacites in the sheeted dyke complex have nearly flat REE patterns (LaN/YbN = 1.2–1.3). Relative to N-MORB, these rocks are depleted in Nb, Ta, P and Ti, whereas U, Th and Pb show positive anomalies (Fig. 10d). Felsic dykes show trace element similarities with low-K tholeiitic or calc-alkaline rock series. Dacitic dykes are distinguished by very low Sr/Y and LaN/YbN (3.9–10 and 1.2–1.3, respectively), typical of low-pressure basalt fractionates or amphibolite melts (Shafaii Moghadam, Stern & Rahgoshay, Reference Shafaii Moghadam, Stern and Rahgoshay2010).
Isotropic gabbros beneath the sheeted dyke complex (samples D06-3 & DZ05-1 H) (Fig. 4c) have flat to LREE-depleted patterns (LaN/YbN = 1.7–0.4) with strong Nb depletion (Nb/La = 0.2–0.5 × N-MORB). An andesitic dyke (DZ05-1D) intruding gabbro has low REE contents relative to N-MORB (e.g. La = 0.8 ppm and Yb = 1.5 ppm v. N-MORB = 2.5 ppm La, 3.05 ppm Yb; Sun & McDonough, Reference Sun, McDonough, Saunders and Norry1989), with LREE and Nb depletion (LaN/YbN = 0.4; Nb/La = 0.4 × N-MORB), similar to boninite. On a Ti v. V diagram (Shervais, Reference Shervais1982), Dehshir lavas show MORB to boninitic affinities (Fig. 9b).
A diabasic dyke in mantle harzburgite (AZ06-29; see Fig. A11d in online Appendix 1 at http://journals.cambridge.org/geo) is slightly LREE enriched (LaN/YbN = 1.6) but is strongly depleted in Nb and Ta (e.g. Nb/La ~ 0.3 × N-MORB), typical of calc-alkaline series. Dyke sample A06–1 is compositionally similar to overlying pillow lavas. Another diabasic dyke (AZ06-29, Fig. 10c, d) is depleted in total REEs (La = 0.6 ppm, Yb = 0.8 ppm versus N-MORB = 2.5 ppm La, 3.05 ppm Yb; Sun & McDonough, Reference Sun, McDonough, Saunders and Norry1989), LREE-depleted (LaN/YbN = 0.5) and is strongly depleted in Nb (Nb/La = 0.5 × N-MORB).
Although disruption of rock units during and after ophiolite emplacement prohibits reconstructing Dehshir ophiolitic lava chemostratigraphy in detail, the data of Shafaii Moghadam, Stern & Rahgoshay (Reference Shafaii Moghadam, Stern and Rahgoshay2010) indicate that basalt lava compositions vary from MORB and IAT to calc-alkaline and boninitic with time (see Fig. A11c, d in online Appendix 1 at http://journals.cambridge.org/geo). For example, the base of pillow lavas (see Fig. A11c in online Appendix 1 at http://journals.cambridge.org/geo) is IAT (sample AZ06–32) and is intruded by basaltic-dacitic dyke swarms. Early basaltic dykes (sample AZ06–38) are N-MORB and are intruded by late dacitic dykes with a suprasubduction zone chemical signature. We saw no evidence in the field for a break between the MORB/IAT (lower) and the upper (IAT/boninite) sequences in the form of an unconformity or intervening sedimentary sequence.
4.b.3. Shahr-e-Babak ophiolite
Basaltic to rhyolitic lava sheets interbedded with Upper Cretaceous pelagic sediments (limestones, radiolarites, marly limestones) (Fig. 4f and Fig. A11f in online Appendix 1 at http://journals.cambridge.org/geo) are the main components of the Shahr-e-Babak ophiolite crustal sequence. Lavas are basaltic, andesitic, dacitic and rhyolitic together with minor pyroclastic rocks. Rhyolitic dykes and sills cross-cut this rock assemblage. To constrain the geochemical signatures of this sequence, we selected interbedded mafic (R06-9, R06-45, R05-6, R06-32 and R06-24), andesitic (R06-41) and dacitic samples (R06-39). A rhyolitic dyke (R06-26) injected into the lavas is also discussed (Fig. 4e and Fig. A11f in online Appendix 1 at http://journals.cambridge.org/geo). Interbedded lavas have SiO2 and Mg no. ranging from 47 to 70 wt% and 62 to 27, respectively. The rhyolitic dyke is more evolved with 74 wt% SiO2 and a Mg no. of 22. These lavas mostly have higher FeO/MgO and are mildly tholeiitic (Fig. 6) with some calc-alkaline samples. Their variable TiO2 contents overlap with both lower and upper Troodos lavas (Fig. 7). These lavas display two REE patterns (Fig. 10e): (1) slightly to highly LREE enriched and (2) LREE depleted. LREE-enriched samples show LaN/YbN = 1.3 for dacitic lava (sample R06-39) and LaN/YbN = 6.1–7.1 for some mafic lavas (samples R05-6 and R06-45). HFSE depletion and LILE enrichment relative to LREEs is typical for these lavas (e.g. Nb/La = 0.1–0.3 × N-MORB, Th/La ~ 2.5–7.3 × N-MORB and U/La ~ 2.4–3.9 × N-MORB). Some mafic lavas show calc-alkaline to shoshonitic affinities. LREE-depleted samples have LaN/YbN = 0.4–0.9 and are depleted in Nb–Ta relative to LREEs (Nb/La ~ 0.3 × N-MORB), similar to IAT. Samples R06-32 and R06-9 are exceptional, with low concentrations of REEs (e.g. La = 0.7–1.1 ppm, Yb = 1.5–1.2 ppm versus N-MORB = 2.5 ppm La, 3.05 ppm Yb; Sun & McDonough, Reference Sun, McDonough, Saunders and Norry1989) similar to boninites. A rhyolitic dyke has a nearly flat REE pattern, LaN/YbN = 1.1 (Fig. 10e), negative Eu anomaly, depletion in Nb (Nb/La ~ 0.3 × N-MORB) and LILE enrichment (Th/La ~ 2.5 × N-MORB), confirming formation as a low-pressure fractionate of IAT magma or amphibolite melt.
Based on field observations, it seems that calc-alkaline-shoshonitic lavas are younger than tholeiites. Lavas are interbedded with Upper Cretaceous pelagic sediments. Upper Cretaceous calc-alkaline-shoshonitic lavas are sometimes confused with Eocene shoshonitic basaltic-dacitic lavas, but some features distinguish them: (1) Upper Cretaceous ones are interbedded with Upper Cretaceous pelagic sediments with no evidence of injection into pelagic limestones, and (2) dacitic-rhyolitic lavas associated with ophiolites are tholeiitic compared to Eocene calc-alkaline dacites.
Shahr-e-Babak ophiolite pillow lavas (see Fig. A11e in online Appendix 1 at http://journals.cambridge.org/geo) occur as isolated patches in fault contact with massive lava flows. Massive and pillowed lavas are variably evolved (Fig. 5) with SiO2 and Mg no. ranging from 50 to 74 wt% and 31 to 54, respectively. These lavas are tholeiitic (Fig. 6) and resemble Troodos lower lavas (Fig. 7) with slightly higher TiO2 content (~ 0.7 wt%). A pillow lava sample (R06-4) is slightly LREE-depleted (LaN/YbN = 0.9) with negative Nb anomaly relative to LREEs (Nb/La ~ 0.3 × N-MORB) resembling IAT (Fig. 10e, f). Overlying basaltic to dacitic lava flows, as well as interbedded rock units discussed above, are classified as: (1) those with flat REE patterns (LaN/YbN = 0.9–1.3) and Nb depletions (Nb/La ~ 0.2–0.3 × N-MORB), similar to IAT, and (2) those with LREE-enriched patterns (LaN/YbN = 2.3–6.5) and strong Nb depletions (Nb/La ~ 0.1–0.5 × N-MORB) resembling calc-alkaline to shoshonitic lavas. Both types are overlain by Upper Cretaceous pelagic limestones.
Nb depletion is especially conspicuous for Shahr-e-Babak lavas compared with other inner and outer belt ophiolitic lavas; calc-alkaline rocks have more Nb than tholeiitic-boninitic lavas (Fig. 10f). On a Ti v. V diagram (Shervais, Reference Shervais1982), the Shahr-e-Babak lavas scatter in the fields of boninite to MORB (Fig. 9b); felsic lavas have very low V and Ti concentrations.
Although disruption and faulting of the Shahr-e-Babak ophiolite prohibits chemostratigraphic reconstruction of lava stratigraphy, our field observations for individual sections suggest that lava compositions changed from IAT/boninite into calc-alkaline-shoshonitic with time.
4.b.4. Balvard–Baft ophiolite
Crustal rock units in the Balvard–Baft ophiolite consist of massive and pillowed lavas, overlain by pyroclastic rocks. Basaltic to dacitic sills are common within the pyroclastic rocks (Fig. 4g and Fig. A11h in online Appendix 1 at http://journals.cambridge.org/geo). Upper Cretaceous pelagic limestones rest unconformably on the pyroclastic rocks (Fig. 4h). Isotropic gabbro lenses are common within the Balvard–Baft mantle sequence. To better constrain the chemostratigraphic evolution of the Balvard–Baft ophiolite, we studied two sequences: (1) an isotropic gabbro lens including early diabasic and late gabbroic dykes NNW of Baft (see Fig. A11g in online Appendix 1 at http://journals.cambridge.org/geo), and (2) a volcanic sequence (Cheshmeh–Baghal sequence) grading upwards into pyroclastic rocks and capped by Upper Cretaceous pelagic limestones (Fig. 4h and Fig. A11h in online Appendix 1 at http://journals.cambridge.org/geo). Mafic samples of the Balvard–Baft ophiolite have 40 wt% (most altered basaltic sample) to 54 wt% SiO2 and 23 to 72 Mg no. They are characterized by medium-Fe, mildly tholeiitic to calc-alkaline signatures (Fig. 6). Most have low TiO2 content and plot in upper lava field of the Troodos ophiolite (Fig. 7).
An isotropic gabbro sample (BT05-5) is LREE enriched (LaN/YbN = 2.2) (Fig. 10g) with slight Nb depletion relative to LREEs (Nb/La ~ 0.8 × N-MORB) (Fig. 10h) similar to T-MORB. Early diabasic dykes (sample BT05-2 A) cross-cut isotropic gabbros and are enriched in LREEs (LaN/YbN = 2.2) and LILEs (e.g. Th/La ~ 3.6 × N-MORB) without a negative Nb anomaly (Nb/La ~ 1.1 × N-MORB). These dykes are compositionally transitional between transitional mid-ocean ridge basalts (T-MORB) and calc-alkaline lavas. Late gabbroic dykes (BT05-3 & BT05-6) also are enriched in LREEs (LaN/YbN = 1.6–1.7) and Th (Th/La ~ 3.1 × N-MORB) and are somewhat depleted in Nb (Nb/La ~ 0.7 × N-MORB), similar to calc-alkaline series. This suggests that magmas evolved from MORB to calc-alkaline with time. Other isotropic gabbros in the Balvard–Baft mantle sequence (e.g. BT06-33) show calc-alkaline affinities with LREE enrichment (LaN/YbN = 1.5) and Th (Th/La ~ 3.2 × N-MORB) and Nb depletion (Nb/La ~ 0.3 × N-MORB) (Fig. 10g, h).
E-MORB-type pillow lavas were first reported by Arvin & Robinson (Reference Arvin and Robinson1994) in the Balvard–Baft ophiolite. Pillow lavas at the base of the ophiolite volcanic sequence are LREE enriched (LaN/YbN ~ 5–6), lack Nb depletion (Nb/La ~ 1.4 × N-MORB) and are similar to E-MORB. Overlying massive lavas (samples BT06-13 & BT06-15) are LREE and Nb depleted (LaN/YbN ~ 0.7–0.8; Nb/La ~ 0.2 × N-MORB) (Fig. 10g, h), similar to IAT. Sample BT06-15 is also depleted in bulk REEs (e.g. La = 1.4 ppm, Yb = 1.4 ppm versus N-MORB = 2.5 ppm La, 3.05 ppm Yb; Sun & McDonough, Reference Sun, McDonough, Saunders and Norry1989), resembling boninite. Lava flows are overlain by thick pyroclastic rocks with basaltic to dacitic sills. Basaltic sills (BT07-24 and BT06-25) have geochemical affinities with IAT, including approximately flat REE patterns (LaN/YbN ~ 0.8–1.8), Nb depletion (Nb/La ~ 0.4–0.5 × N-MORB) and Th enrichment (Th/La ~ 2.6–5.1 × N-MORB) (Fig. 10g, h). A pillow fragment in volcanic breccias (BT06-38) is calc-alkaline with LREE enrichment (LaN/YbN ~ 1.5) and strong negative Nb anomaly (Nb/La ~ 0.2 × N-MORB). Geochemical evolution from MORB to IAT and then into calc-alkaline and boninitic is characteristic of the lava sequence at Cheshmeh–Baghal. On a Ti v. V diagram (Shervais, Reference Shervais1982) (Fig. 9b), Balvard–Baft lavas plot mostly in the IAT field but also in MORB and boninite fields.
4.c. Inner and outer belt ophiolitic peridotite: constraints from whole-rock CaO and Al2O3 contents
Peridotite compositions are sensitive indicators of tectonic setting (e.g. Bonatti & Michael, Reference Bonatti and Michael1989). Some major oxides such as Al2O3 and CaO are especially useful for evaluating the degree of melting and peridotite depletion (Ishii et al. Reference Ishii, Robinson, Maekawa, Fiske, Fryer, Pearce and Stocking1992; Pearce et al. Reference Pearce, Vander Laan, Arculus, Murton, Ishii, Peate, Parkinson, Fryer, Pearce and Stocking1992). Modal abundance of clinopyroxene in mantle peridotite covaries with CaO and Al2O3 contents. Most mantle rocks of both inner and outer belt ophiolites are harzburgites with low modal pyroxene abundances and low Al2O3 and CaO contents. Depleted lherzolites occur sporadically in some ophiolites. These peridotites mostly plot in the Mariana fore-arc field on an Al2O3 v. CaO diagram (Fig. 11), similar to Oman peridotites. Some peridotites from the Haji–Abad, Dehshir and Balvard–Baft ophiolites, as well as some Oman peridotites, have higher pyroxene modal content and plot in the abyssal peridotite field of Pearce et al. (Reference Pearce, Vander Laan, Arculus, Murton, Ishii, Peate, Parkinson, Fryer, Pearce and Stocking1992). As is clear in Figure 11, most OB and IB Zagros and Oman peridotites are residues after > 15% partial melting (RMM20). For comparison we also plotted Kermanshah peridotite data from Allahyari et al. (Reference Allahyari, Saccani, Pourmoafi, Beccaluva and Masoudi2010). These are considered depleted abyssal peridotite having high Al2O3 and CaO contents. These peridotites, especially lherzolites show scatter in the Al2O3 v. CaO diagram (Fig. 11), having CaO and Al2O3 contents that are mostly lower than depleted MORB mantle (e.g. Workman & Hart, Reference Workman and Hart2005). In contrast, ZOB peridotites are compositionally similar to fore-arc peridotites.
Al2O3 v. CaO compositional plot (volatile free, normalized to 100% total) for Zagros inner and outer belt ophiolitic peridotites. Fields for abyssal and fore-arc peridotites are from Pearce et al. (Reference Pearce, Vander Laan, Arculus, Murton, Ishii, Peate, Parkinson, Fryer, Pearce and Stocking1992). MARK peridotite data is from Casey (Reference Casey, Karson, Cannat, Miller and Elthon1997). Data for Oman ophiolite harzburgites (Godard, Jousselin & Bodinier, Reference Godard, Jousselin and Bodinier2000; Girardeau et al. Reference Girardeau, Monnier, Lemee and Quatrevaux2002) are shown for comparison. The composition of primitive upper mantle (PUM), fertile MORB mantle (FMM) and mantle residue after 5 to 25% partial melting are from Pearce & Parkinson (Reference Pearce, Parkinson, Prichard, Alabaster, Harris and Neary1993). Data for the Kermanshah ophiolite from Allahyari et al. (Reference Allahyari, Saccani, Pourmoafi, Beccaluva and Masoudi2010) are shown for comparison.
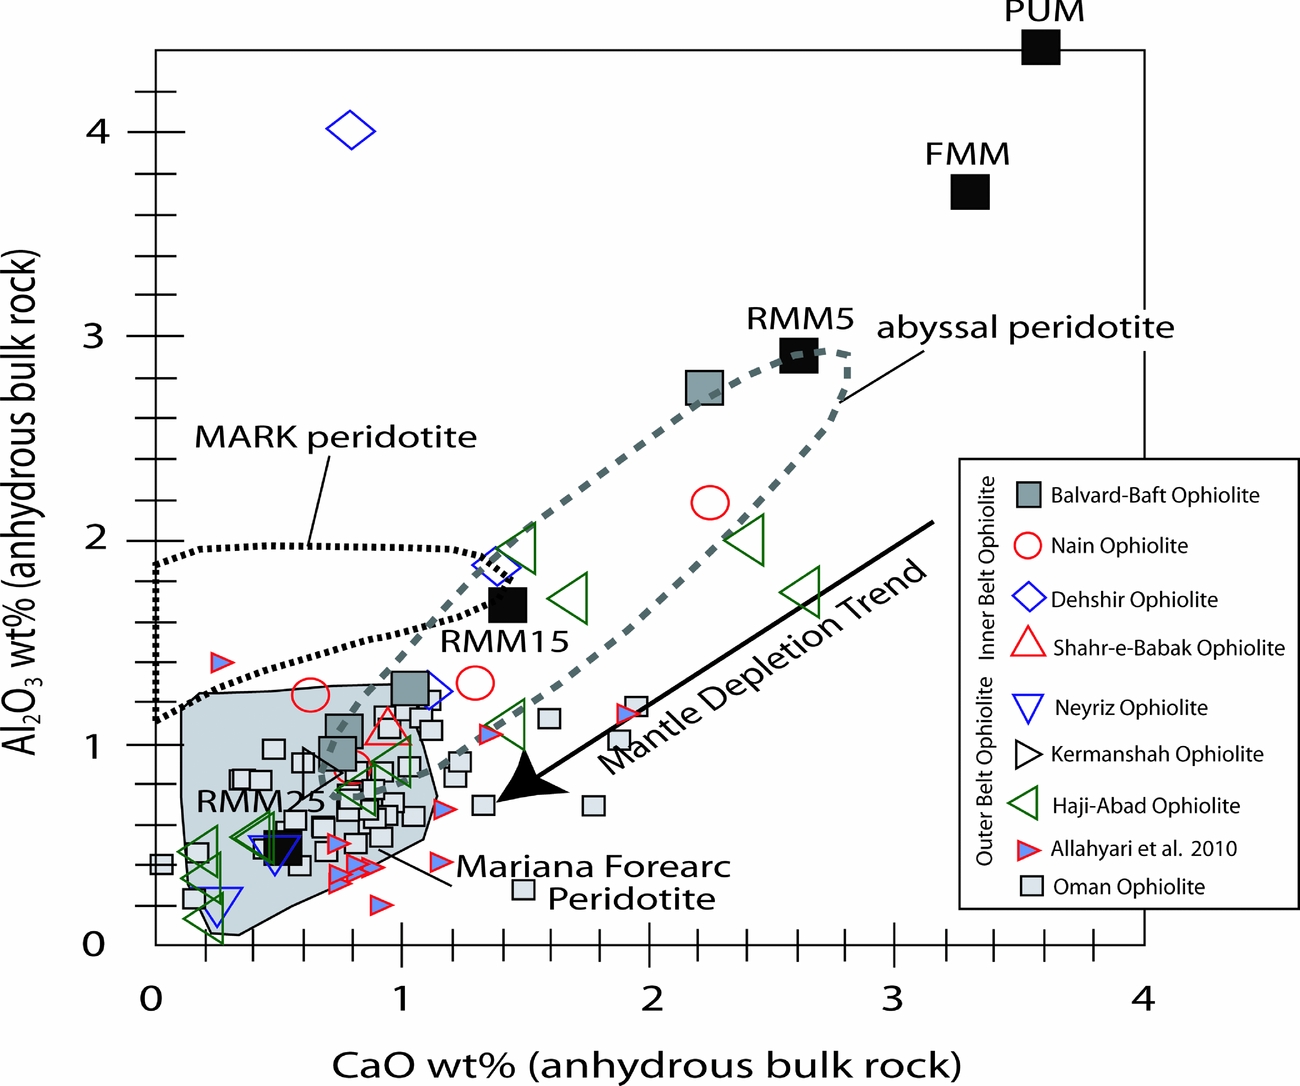
4.d. Pyroxene composition of inner and outer belt peridotites
Depleted mantle harzburgite has pyroxenes with higher Mg no. and lower TiO2 and Al2O3 abundances than fertile lherzolite. OB and IB peridotites usually have Opx with Mg no. > 90.1, except for Dehshir, where Opx Mg no. = 85–90. OB and IB peridotite orthopyroxenes have low Al2O3 (< 4 wt%) and CaO (< 2.2 wt%), except for some Nain and Haji–Abad Opxs with slightly higher Al2O3 content, resembling depleted harzburgites from modern fore-arcs (Fig. 12a). Al2O3 and TiO2 contents of most OB and IB peridotite clinopyroxenes are similar to the very low values found in Cpx from highly depleted fore-arc peridotites (Ishii et al. Reference Ishii, Robinson, Maekawa, Fiske, Fryer, Pearce and Stocking1992) (Fig. 12b). Most OB and IB harzburgite Cpxs are chemically distinct from those of moderately depleted abyssal peridotites, which have significantly higher Al2O3 and TiO2 contents (e.g. Hébert, Adamson & Komor, Reference Hébert, Adamson, Komor, Detrick, Honnorez and Bryan1990; Johnson, Dick & Shimizu, Reference Johnson, Dick and Shimizu1990). Some Cpxs from Haji–Abad, Neyriz and Kermanshah harzburgites have higher TiO2 content, indicating compositional changes due to re-equilibration of Cpx with percolating melts.
Composition of OB and IB harzburgite pyroxenes. (a) Orthopyroxene Al2O3 v. Mg no. composition diagram. Fields for abyssal peridotites (Johnson, Dick & Shimizu, Reference Johnson, Dick and Shimizu1990) and fore-arc peridotites (Ishii et al. Reference Ishii, Robinson, Maekawa, Fiske, Fryer, Pearce and Stocking1992) are shown for comparison. (b) Clinopyroxene TiO2 against Al2O3 for OB and IB harzburgites. Comparative fields are shown for abyssal peridotites (abyssal peridotite 1: Hébert, Adamson & Komor, Reference Hébert, Adamson, Komor, Detrick, Honnorez and Bryan1990; abyssal peridotite 2: Johnson, Dick & Shimizu, Reference Johnson, Dick and Shimizu1990) and fore-arc peridotites (Ishii et al. Reference Ishii, Robinson, Maekawa, Fiske, Fryer, Pearce and Stocking1992). The long thin arrow shows changes expected for residual clinopyroxene due to progressive partial melting of peridotite. Short thick arrow shows compositional changes due to re-equilibration of Cpx with percolating melt. Izu–Bonin–Mariana (IBM) and South Sandwich fore-arc harzburgite data are from Parkinson & Pearce (Reference Parkinson and Pearce1998) and Pearce et al. (Reference Pearce, Barker, Edwards, Parkinson and Leat2000), respectively; Mariana Trough (back-arc basin peridotite) data are from Ohara et al. (Reference Ohara, Stern, Ishii, Yurimoto and Yamazaki2002). For comparison we have also plotted data on the Kermanshah peridotite from Allahyari et al. (Reference Allahyari, Saccani, Pourmoafi, Beccaluva and Masoudi2010).

4.e. Spinel composition from inner and outer belt peridotites
Spinel Cr no. (=100Cr/(Cr + Al)) is a sensitive indicator of partial melting of host peridotite (e.g. Dick & Bullen, Reference Dick and Bullen1984; Johnson, Dick & Shimizu, Reference Johnson, Dick and Shimizu1990). With increasing degree of partial melting, decreasing activity of aluminium in the peridotite leads to an increase in Cr no. of spinel (Hellebrand et al. Reference Hellebrand, Snow, Dick and Hofmann2001; Hellebrand, Snow & Muhe, Reference Hellebrand, Snow and Muhe2002). Fore-arc mantle peridotite is composed of depleted harzburgite, characterized by spinels with Cr no. > 50 and low TiO2 contents (Bloomer & Hawkins, Reference Bloomer, Hawkins and Hayes1983; Parkinson & Pearce, Reference Parkinson and Pearce1998; Stern, Reference Stern, Kusky, Zhai and Xiao2010). Spinels from the IB and OB peridotites (also spinel data from Allahyari et al. Reference Allahyari, Saccani, Pourmoafi, Beccaluva and Masoudi2010 on the Kermanshah ophiolite), as well as spinels from the Oman peridotite, show chemical variations following both the MORB and fore-arc trends of Dick & Bullen (Reference Dick and Bullen1984), with most of them plotting in the fore-arc field (Fig. 13a). The TiO2 content of most spinels is less than 0.2 wt% similar to those of fore-arc harzburgites and boninites (Tamura & Arai, Reference Tamura and Arai2006) (Fig. 13b). Some spinels, especially Haji–Abad spinels, display higher TiO2 abundance (TiO2 > 0.2 wt%), interpreted to be the result of melt–mantle interaction during melt percolation (Cannat et al. Reference Cannat, Chatin, Whitechurch, Ceuleneer, Karson, Cannat, Miller and Elthon1997). These spinels are found in very depleted harzburgites of the Haji–Abad mantle sequence.
(a) Cr no. v. Mg no. diagram (modified after Dick & Bullen, Reference Dick and Bullen1984) for spinels in OB and IB harzburgites. (b) Diagram (after Tamura & Arai, Reference Tamura and Arai2005, Reference Tamura and Arai2006) showing TiO2 against Cr no. of spinels, in order to discriminate between various types of peridotites and links to boninite. Note that spinels plot in fields for both MORB peridotites and fore-arc peridotites. Some data show affinity to boninite. IBM and South Sandwich fore-arc harzburgite data are from Parkinson & Pearce (Reference Parkinson and Pearce1998) and Pearce et al. (Reference Pearce, Barker, Edwards, Parkinson and Leat2000), respectively; Mariana Trough (back-arc basin) peridotite are from Ohara et al. (Reference Ohara, Stern, Ishii, Yurimoto and Yamazaki2002); Oman harzburgite data are from Le Mée, Girardeau & Monnier (Reference Le Mée, Girardeau and Monnier2004) and Tamura & Arai (Reference Tamura and Arai2006).

5. Discussion
In this Section we discuss three aspects of the Upper Cretaceous Zagros ophiolites: compositional variations, comparison with other Upper Cretaceous ophiolites between Cyprus and Oman and modern fore-arcs, and the tectonic setting of Upper Cretaceous Zagros ophiolites.
5.a. Summary of Upper Cretaceous Zagros ophiolite compositional variations
Geochemical evolution of both the OB and IB ophiolites is summarized in Table 1. OB and IB mantle harzburgites, as well as Oman peridotites, have low CaO and Al2O3 abundances similar to Mariana fore-arc peridotite (Pearce et al. Reference Pearce, Vander Laan, Arculus, Murton, Ishii, Peate, Parkinson, Fryer, Pearce and Stocking1992). Fore-arc peridotites are typically more depleted than abyssal peridotites, except for some lherzolites from the South Sandwich fore-arc (Pearce et al. Reference Pearce, Barker, Edwards, Parkinson and Leat2000; Arai & Ishimaru, Reference Arai and Ishimaru2008). Opx and Cpx from OB and IB harzburgites have low CaO, Al2O3 and TiO2 contents, resembling those of depleted harzburgites from modern fore-arcs and different from moderately depleted abyssal peridotites. OB and IB mantle harzburgites, like Oman harzburgites, are dominated by Cr-rich spinels, mostly with Cr no. > 50 and low TiO2 content, similar to spinel from fore-arc harzburgites. In fertile abyssal lherzolites, spinels with Cr no. < 30 are dominant (Dick & Bullen, Reference Dick and Bullen1984), while spinel in fore-arc peridotites may cover a slightly wider range, 40 < Cr no. < 80 (Arai, Reference Arai1994).
OB and IB lavas and dykes, as well as other Upper Cretaceous Tethyan ophiolites such as Troodos (Pearce & Robinson, Reference Pearce and Robinson2010) have variable SiO2 contents; most lavas have 50–56 wt% SiO2 but a significant proportion has up to 75 wt% SiO2 (Fig. 5). The abundance of silica-rich lavas is not seen at mid-ocean ridges and is an important argument for a suprasubduction zone origin for Zagros ophiolites. Compositional data for lavas and isotropic gabbros from both IB and OB ophiolites scatter on the FeOt/MgO versus SiO2 diagram of Arculus (Reference Arculus2003) (Fig. 6). Although some of this scatter may reflect alteration, mostly it indicates that tholeiitic and calc-alkaline magmas coexisted, although most lavas plot in the tholeiitic, medium- to high-Fe field. Oman V1 and V2 lavas, when compared to IB and OB lavas, are mostly high-Fe tholeiites, while other Tethyan Upper Cretaceous ophiolites such as the Kizildag (Turkey) are mostly low- to medium-Fe types, probably manifesting differing magmatic H2O contents, low for tholeiites and high for calc-alkaline series (Arculus, Reference Arculus2003). Our Al2O3/TiO2 v. TiO2 data from OB and IB lavas as well as Kizildag and Oman ophiolites and Izu-Bonin-Mariana (IBM) fore-arc basalts range from MORB-like to IAT to boninites (Fig. 14a). The first lavas in Tethyan ophiolites as well as IBM fore-arc basalts tend to be MORB-like, with higher TiO2 and Zr contents (Fig. 14b), compared to younger calc-alkaline or boninitic lavas.
(a) Al2O3/TiO2 versus TiO2 and (b) Zr versus TiO2 variations for OB and IB magmatic rocks (modified after Bagci, Parlak & Hock, Reference Bagci, Parlak and Hock2008). North Tonga boninites from Falloon & Crawford (Reference Falloon and Crawford1991); IBM fore-arc boninites from Arculus et al. (Reference Arculus, Pearce, Murton, Van der Laan, Fryer, Pearce and Stocking1992). (c) Th/Yb v. Nb/Yb diagram (after Leat et al. Reference Leat, Pearce, Barker, Millar, Barry and Larter2004) for OB and IB ophiolites. Most OB and IB mafic rocks have high Th/Yb and plot above the mantle array near the volcanic arc array, with some exceptions that are MORB-like. For comparison data from the Kizildag ophiolite, Turkey (Dilek & Thy, Reference Dilek and Thy2009), Oman lavas (Godard, Dautria & Perrin, Reference Godard, Dautria and Perrin2003) and IBM fore-arc lavas (Reagan et al. Reference Reagan, Ishizuka, Stern, Kelley, Ohara, Blichert-Toft, Bloomer, Cash, Fryer, Hanan, Hickey-Vargas, Ishii, Kimura, Peate, Rowe and Woods2010) are shown.

Furthermore, most ZOB lavas and dykes show trace element characteristics of subduction-related magmas (IAT, boninite and calc-alkaline) such as Nb–Ta depletion and LILE enrichments but there are some with trace element patterns like those of MORB. Where magmatic successions can be reconstructed, there is often a change from earlier tholeiitic melts (MORB and/or IAT) that are less affected by subduction-related geochemical inputs to those that are more affected, such as boninitic and/or calc-alkaline lavas or intrusions. E-MORB type pillow lavas are also found in the Balvard–Baft and Haji–Abad ophiolites, while N-MORB basalts occur in the Dehshir ophiolite. Late boninitic lavas and dykes are common in most inner and outer belt ophiolites but are especially conspicuous in the Nain, Haji–Abad, Balvard–Baft and Dehshir. Late-stage high-K calc-alkaline to shoshonitic magmatism is common in the Kermanshah and Shahr-e-Babak ophiolites. This magmatic evolution, from bottom to top, appears to have been continuous; there is no evidence in any of the ophiolites for a hiatus between lower MORB/IAT-like and upper calc-alkaline/boninite sequences in the form of an unconformity or intervening sedimentary sequence. This evolution is similar to that seen in the IBM fore-arc (Reagan et al. Reference Reagan, Ishizuka, Stern, Kelley, Ohara, Blichert-Toft, Bloomer, Cash, Fryer, Hanan, Hickey-Vargas, Ishii, Kimura, Peate, Rowe and Woods2010).
The Th/Yb versus Nb/Yb diagram is useful for further exploring the petrogenesis and tectonic setting of OB and IB igneous rocks (Fig. 14c). In this diagram, Yb is used to normalize Nb and Th to remove the effects of partial melting, fractional crystallization and crystal accumulation (Pearce & Peate, Reference Pearce and Peate1995; Pearce et al. Reference Pearce, Baker, Harvey and Luff1995). Th and Nb have similar melt-crystal distribution coefficients (Leat et al. Reference Leat, Pearce, Barker, Millar, Barry and Larter2004), but Th is added by high-temperature fluid release from subducted sediments to mantle magma sources above subduction zones, whereas Nb is not. Most, but not all, OB and IB mafic rocks are displaced from the mantle array, defined by MORB and OIB owing to higher concentrations of the subduction-mobile element Th (Fig. 14c). These relations reinforce the conclusion that most OB and IB melts were derived from subduction-modified MORB-like asthenospheric mantle. The Oman V1 (Geotimes unit) and V2 (Lasail unit) lavas follow the Zagros ophiolite trends with lower Th (and maybe higher Yb) content, while Kizildag ophiolite (Turkey) lavas mostly plot along the MORB–OIB array. Nevertheless, MORB-like tholeiites are common and cannot easily be ascribed to a different tectonic setting; instead, these are probably associated with fore-arc spreading when subduction began.
Low concentrations of incompatible elements and low Nb/Yb imply that tholeiitic melts issued from depleted N-MORB mantle, with the interesting exception of E-MORB/OIB-type lavas in the Balvard–Baft and Haji–Abad ophiolites. Involvement of convecting asthenosphere and/or extremely depleted mantle with more extensive hydrous fluid input generated IAT/calc-alkaline and boninitic magmas, respectively (Ishizuka et al. Reference Ishizuka, Kimura, Li, Stern, Reagan, Taylor, Ohara, Bloomer, Ishii, Hargrove and Haraguchi2006). Some pillow lavas from the Balvard–Baft and Haji–Abad ophiolites are geochemically between E-MORB and OIB-type lavas. There are two possible explanations for the genesis of these lavas: (1) they formed during the early stage of oceanic formation (in Late Permian time), as suggested by Allahyari et al. (Reference Allahyari, Saccani, Pourmoafi, Beccaluva and Masoudi2010) for the genesis of E-MORB type gabbros in Kermanshah ophiolites. In addition, Ghazi & Hassanipak (Reference Ghazi and Hassanipak1999) and M. Arvin (unpub. Ph.D. thesis, Univ. London, 1982) reported Triassic OIB-type lavas from Kermanshah and Neyriz ophiolites. Therefore, it may be that these E-MORB/OIB-type lavas correlate with the alkaline lavas of the Oman (Robertson, Reference Robertson, Karner, Manatschal and Pinheiro2007) and that they formed during the rifting/early oceanization phase of north Gondwana. However, the Balvard–Baft and Haji–Abad E-MORB/OIB-type pillow lavas are associated with Upper Cretaceous pelagic limestones and are not likely to be Triassic; and (2) the Haji–Abad and Balvard–Baft E-MORB/OIB-type lavas are in fact the first lavas to erupt when the Tethyan oceanic plate began to sink beneath the Eurasian plate as subduction began in Late Cretaceous time. They were generated from subduction component-free mantle, perhaps flowing in from beneath Eurasia to fill space created by the initial sinking of the Tethyan plate, as hypothesized by Stern & Bloomer (Reference Stern and Bloomer1992). Such a model is also suggested for the early MORB-like lavas from the IBM fore-arc (Reagan et al. Reference Reagan, Ishizuka, Stern, Kelley, Ohara, Blichert-Toft, Bloomer, Cash, Fryer, Hanan, Hickey-Vargas, Ishii, Kimura, Peate, Rowe and Woods2010). To approximate the proportion of ophiolitic lavas and dykes that are arc-like rather than non-arc-like (MORB and E-MORB) we plotted all Zagros ophiolitic lavas and dykes on a Nb/Yb v. Nb/La diagram (Fig. 15). Arc lavas are represented by Nb/La < 0.95 while a Nb/Yb ratio > 3 discriminates between N-MORB and E-MORB. A total of 237 analyses were plotted; 213 samples (90%) have the low Nb/La indicating arc affinities (Fig. 15), whereas only 24 samples (10%) are characterized by non-arc geochemical signatures. Among non-arc lavas, only 8 samples (3%) plot in the E-MORB field and 16 samples (7%) plot in the N-MORB field. This diagram emphasizes the overwhelming arc-like affinities of lavas and dykes in the Zagros Upper Cretaceous ophiolites.
Nb/Yb v. Nb/La diagram to discriminate between arc-like and non-arc lavas and dykes in the Upper Cretaceous Zagros ophiolites. Nearly all samples (90%) indicate arc-like characteristics while only 10% of lavas have a tendency towards non-arc geochemical characteristics.

5.b. Comparison with Oman–Turkey, Troodos ophiolites and the IBM fore-arc
Upper Cretaceous Tethyan ophiolites south of the Tauride platform (including the Central Iranian block) were emplaced onto the northern edge of Arabia, including Troodos (Cyprus), Kizildag (Turkey), Baer-Bassit (Syria) and Zagros (Dilek & Thy, Reference Dilek and Thy2009). All these Upper Cretaceous Tethyan ophiolites are about the same age; 90–94 Ma for Troodos plagiogranite (U–Pb zircon; Mukasa & Ludden, Reference Mukasa and Ludden1987); 95 Ma for Oman plagiogranite (U–Pb zircon; Hacker, Mosenfelder & Gnos, Reference Hacker, Mosenfelder and Gnos1996); 91–92 Ma for Kizildag plagiogranite (U–Pb zircon; Dilek & Thy, Reference Dilek and Thy2009); 92–93 Ma for OB Neyriz hornblende gabbros (40Ar–39Ar; Babaie et al. Reference Babaie, Babaei, Ghazi and Arvin2006) and 93 Ma for IB gabbros (K–Ar; Shafaii Moghadam et al. Reference Shafaii Moghadam, Whitechurch, Rahgoshay and Monsef2009). The tight clustering of ages for ophiolites along the ~ 3000 km belt implies a common origin.
The Troodos ophiolite crustal sequence contains gabbros (3–6 km thick, Mackenzie et al. Reference Mackenzie, Maguire, Coogan, Khan, Eaton and Petrides2006), a sheeted dyke complex (800 m thick) and overlying lavas and sediments (750 m–1.5 km thick). Lower pillow lavas are IAT while upper lavas are boninitic (Thy & Xenophontos, Reference Thy and Xenophontos1991; Dilek & Thy, Reference Dilek and Thy2009). Kizildag ophiolite (Turkey) crustal rocks include cumulate rocks (165–700 m thick), isotropic gabbros (2–2.5 km thick), a sheeted dyke complex and lavas (1.3 km thick) with geochemical evolution from MORB to boninite (Bagci, Parlak & Hock, Reference Bagci, Parlak and Hock2008; Dilek & Thy, Reference Dilek and Thy2009). In the Oman ophiolite, the crustal sequence starts with layered gabbros (2.0–2.5 km thick) grading upwards into isotropic gabbros (500–1000 m thick). The Oman sheeted dyke complex is 400–1600 m thick and the overlying lava sequence is 1.0–1.7 km thick. Chemostratigraphy for Oman lavas shows that these lavas change from MORB-like (Geotimes unit) upwards into depleted IAT and boninitic (Lasail unit) (Alabaster, Pearce & Malpas, Reference Alabaster, Pearce and Malpas1982; Ernewein, Pflumino & Whitechurch, Reference Ernewein, Pflumino and Whitechurch1988). Our compiled data (Table 1) indicates that the Zagros ophiolites are similar to most other Upper Cretaceous Tethyan ophiolites in terms of age, lithological components (other than having little gabbro) and geochemical evolution. These ophiolites are also remarkably similar to 45–50 Ma lithosphere of the IBM fore-arc in terms of peridotite compositions and the magmatic evolution of the volcanic and sheeted dyke complex (Stern, Reference Stern2004). The first lavas in the IBM fore-arc are older MORB-like basalts (fore-arc basalts) with low Ti/V (14–16, compared to Pacific MORB with Ti/V = 26–32) grading upwards into younger boninites (Reagan et al. Reference Reagan, Ishizuka, Stern, Kelley, Ohara, Blichert-Toft, Bloomer, Cash, Fryer, Hanan, Hickey-Vargas, Ishii, Kimura, Peate, Rowe and Woods2010).
The IBM fore-arc and many ophiolitic lava sequences change systematically from MORB-like early lavas to late lavas that are boninitic, but there is a lot of variability from ophiolite to ophiolite and between IBM fore-arc and Tethyan Upper Cretaceous ophiolites. The scatter amongst the analysed Zagros ophiolitic samples in REE- and extended trace element plots indicates variable geochemical signatures (MORB, calc-alkaline, boninite, IAT) within OB and IB magmas. This could reflect the life cycle of suprasubduction zone ophiolites (Shervais, Reference Shervais2001). Such variability in geochemical signatures is also found amongst fore-arc lavas (e.g. Ishizuka et al. Reference Ishizuka, Kimura, Li, Stern, Reagan, Taylor, Ohara, Bloomer, Ishii, Hargrove and Haraguchi2006; Macpherson & Hall, Reference Macpherson and Hall2001; Pearce et al. Reference Pearce, Vander Laan, Arculus, Murton, Ishii, Peate, Parkinson, Fryer, Pearce and Stocking1992; Taylor et al. Reference Taylor, Lapierre, Vidal, Nesbitt, Croudace, Taylor and Fujika1992) mostly reflecting variable contributions of subducted fluid and sediment to the rapidly evolving magma source (Stern, Reference Stern2004).
The TiO2 versus MgO diagram (based on Dilek & Thy, Reference Dilek and Thy2009) compares Zagros lavas (Fig. 7) and those from other Tethyan ophiolites with those of modern fore-arcs (Fig. 16). Troodos upper pillow lavas as well as Oman Geotimes units have lower TiO2 and higher MgO abundances than the lower pillow lavas of these ophiolites (Fig. 16a). Zagros ophiolitic lavas scatter similarly between low and high TiO2 end-members, with Nain lavas mostly having lower and Kermanshah lavas mostly higher TiO2 contents (Fig. 7). IBM fore-arc basalts (Reagan et al. Reference Reagan, Ishizuka, Stern, Kelley, Ohara, Blichert-Toft, Bloomer, Cash, Fryer, Hanan, Hickey-Vargas, Ishii, Kimura, Peate, Rowe and Woods2010) have higher MgO contents than Troodos lower lavas, and IBM fore-arc boninites of Ishizuka et al. (Reference Ishizuka, Kimura, Li, Stern, Reagan, Taylor, Ohara, Bloomer, Ishii, Hargrove and Haraguchi2006) have lower MgO contents than Troodos upper lavas (Fig. 16b).
(a) Major element variations (TiO2 v. MgO) of mafic rocks of Upper Cretaceous Tethyan ophiolites from Troodos, Kizildag, Oman and Baer-Bassit (modified after Dilek & Thy, Reference Dilek and Thy2009). (b) Major element variations (TiO2 v. MgO) of Chichijima Island boninites (Ishizuka et al. Reference Ishizuka, Kimura, Li, Stern, Reagan, Taylor, Ohara, Bloomer, Ishii, Hargrove and Haraguchi2006) and IBM fore-arc lavas (Reagan et al. Reference Reagan, Ishizuka, Stern, Kelley, Ohara, Blichert-Toft, Bloomer, Cash, Fryer, Hanan, Hickey-Vargas, Ishii, Kimura, Peate, Rowe and Woods2010) are also shown for comparison. Troodos upper and lower lava fields are outlined by dashed and dotted lines, respectively.

Most Zagros OB and IB lavas fall into the IAT and boninite fields on a Ti v. V diagram (Fig. 9a, b), similar to both depleted Oman Lasail lavas (V2 lavas) and IBM fore-arc lavas (Reagan et al. Reference Reagan, Ishizuka, Stern, Kelley, Ohara, Blichert-Toft, Bloomer, Cash, Fryer, Hanan, Hickey-Vargas, Ishii, Kimura, Peate, Rowe and Woods2010). Some Zagros ophiolite lavas are more MORB-like, and some are compositionally intermediate between tholeiitic lavas of the Oman Geotimes (V1) and depleted lavas of the Lasail (V2) units. Neyriz lavas are similar to MORB-like IBM fore-arc basalts, whereas most other Zagros lavas are more akin to IBM boninites or are transitional between these two end-members. The Kermanshah calc-alkaline lavas are exceptional in having high TiO2 with low V abundance. Felsic lavas from Zagros ophiolites have much lower Ti and V abundances and plot in the lower left corner of the diagram.
5.c. Tectonic setting of Zagros ophiolite formation
Several different tectonic models have been considered for the tectonic environment where Upper Cretaceous Zagros ophiolites formed. These hypotheses are here briefly described before we present our model.
5.c.1. Suggested tectonic models for the OB
Several hypotheses have been proposed for the tectonic evolution of the OB (e.g. Berberian & King, Reference Berberian and King1981; Desmons & Beccaluva, Reference Desmons and Beccaluva1983; Glennie, Reference Glennie, Alsharan and Scott2000, Stampfli et al. Reference Stampfli, Mosar, Favre, Pillevuit, Vannay, Ziegler, Cavazza, Robertson and Crasquin-Soleau2001). According to some geologists, Neo-Tethyan oceanic lithosphere was consumed in a NE-dipping subduction zone beneath the SSZ margin during Early Jurassic time (Dercourt et al. Reference Dercourt, Zonenshain, Ricou, Kazmin, Le Pichon, Knipper, Grandjacquet, Sbortshikov, Geyssant, Lepvrier, Pechersky, Boulin, Sibuet, Savostin, Sorokhtin, Westphal, Bazhenov, Lauer and Biju-Duval1986). In one school of thought, the Neyriz ophiolite is considered both as a piece of Neo-Tethyan oceanic lithosphere generated at the foot of the north Gondwana passive margin (e.g. Ricou, Reference Ricou1971, Reference Ricou1976; M. R. Jannessary, unpub. Ph.D. thesis, l'Univ. de Louis Pasteur, France, 2003) and/or as material that was scraped off the down-going plate and incorporated into the Zagros accretionary prism (e.g. Babaie et al. Reference Babaie, Babaei, Ghazi and Arvin2006). Otherwise the Kermanshah ophiolite may be described as a piece of Tethyan oceanic lithosphere scraped off during NE-directed subduction underneath the Iranian block in Early Cretaceous time (e.g. Agard et al. Reference Agard, Omrani, Jolivet and Mouthereau2005; Braud, Reference Braud1970, Reference Braud1978; J. Braud, unpub. Ph.D. thesis, Univ. Paris-Sud, France, 1987). An intraoceanic arc origin is also suggested for the Kermanshah ophiolite by Ghazi & Hassanipak (Reference Ghazi and Hassanipak1999) and Desmons & Beccaluva (Reference Desmons and Beccaluva1983). All these models, except Jannessary's model for the Neyriz ophiolite, consider a suprasubduction zone for the evolution of the outer belt ophiolites.
5.c.2. Previous tectonic models for the IB
The IB is described as ophiolitic mélange, originated from a Neo-Tethyan oceanic branch that existed between the SSZ and the Lut blocks (e.g. Davoudzadeh, Reference Davoudzadeh1972; Stocklin, Eftekhar-Nezhad & Hushmandzadeh, Reference Stocklin, Eftekhar-Nezhad and Hushmandzadeh1972; Berberian & King, Reference Berberian and King1981; Arvin & Robinson, Reference Arvin and Robinson1994; Arvin & Shokri, 1996). In many interpretations the Nain–Baft ophiolite belt represents a suture on the site of a small Mesozoic ocean basin (e.g. Stampfli & Borel, Reference Stampfli and Borel2002; Agard et al. Reference Agard, Monie, Gerber, Omrani, Molinaro, Meyer, Labrousse, Vrielynck, Jolivet and Yamato2006; Shafaii Moghadam et al. Reference Shafaii Moghadam, Whitechurch, Rahgoshay and Monsef2009) with a number of microcontinents. However, there is no agreement as to how such microcontinents and ocean basins should be reconstructed in space and time, or in the rift processes (Robertson, Reference Robertson, Karner, Manatschal and Pinheiro2007). Why did the Nain–Baft (IB) oceanic branch open? Do we have the evidence of rifted margins including turbidites, deep-water radiolarites and platform carbonates along with plume-related alkaline lavas older than Late Cretaceous in the Nain–Baft ophiolites? These types of deposits and lavas are reported from all eastern Tethyan ophiolites, such as the Hawasina window of Oman, and are suggested to show pulses of rifting, responsible for opening the Neo-Tethys. These types of rocks are not found for the Nain–Baft ophiolites. Some geologists prefer a model whereby the IB marks the position of a Campanian back-arc basin (e.g. Stampfli & Borel, Reference Stampfli and Borel2002; Agard et al. Reference Agard, Monie, Gerber, Omrani, Molinaro, Meyer, Labrousse, Vrielynck, Jolivet and Yamato2006; Shafaii Moghadam et al. Reference Shafaii Moghadam, Whitechurch, Rahgoshay and Monsef2009). This back-arc basin represented a narrow seaway with discontinuous oceanic crust (Shafaii Moghadam et al. Reference Shafaii Moghadam, Whitechurch, Rahgoshay and Monsef2009). A back-arc basin model is also proposed for ophiolites on the northern margin of the Tauride microcontinent (Stampfli & Borel, Reference Stampfli and Borel2002). In this model, the SSZ was also considered similar to the Tauride block of Robertson (Reference Robertson, Karner, Manatschal and Pinheiro2007). As for the SSZ, both flanks of the Tauride block are marked by ophiolites, the trace of the North Tethyan Ocean to the north and that of the South Tethyan Ocean to the south, although there is evidence of Triassic rifting and continental breakup along the northern margin of the Tauride–Anatolide platform (see Yilmaz et al. Reference Yilmaz, Tuysuz, Yigitbas, Genc, Sengor and Robinson1997 and Robertson, Reference Robertson, Karner, Manatschal and Pinheiro2007 for more information).
Another possible explanation for the mixture of MORB and suprasubduction zone basaltic rocks in the Zagros ophiolites is that these formed in one or two back-arc basins (e.g. Stampfli & Borel, Reference Stampfli and Borel2002; Agard et al. Reference Agard, Monie, Gerber, Omrani, Molinaro, Meyer, Labrousse, Vrielynck, Jolivet and Yamato2006; Shafaii Moghadam et al. Reference Shafaii Moghadam, Whitechurch, Rahgoshay and Monsef2009). We do not think this is a good explanation, for a number of reasons. First, there is no arc to the south of the Zagros ophiolites, so for the back-arc basin hypothesis to be correct either the arc to the south was completely removed somehow or the back-arc basin was associated with a S-dipping subduction zone. Tectonic evolution from a S-dipping subduction zone in Late Cretaceous time to a N-dipping one today requires that a collision occurred sometime between then and now, causing the subduction zone polarity reversal, from S-dipping to N-dipping. There is no evidence for this; instead, it appears that a magmatic arc has been present at about where the Urumieh–Dokhtar arc is through much of Late Cretaceous time and all of Cenozoic time. Second, boninites are common in fore-arcs and rare in back-arc basins (Bedard et al. Reference Bédard, Lauzière, Tremblay and Sangster1998). Peridotite compositions are also diagnostic. Upper Cretaceous Zagros ophiolitic peridotites include ultra-depleted harzburgites (and minor depleted lherzolites) that are not reported from back-arc basins (back-arc basin peridotites are moderately depleted, like MOR peridotites (Ohara, Reference Ohara2006)); such depleted harzburgites are only found in modern intraoceanic fore-arcs.
5.c.3. A fore-arc tectonic model for the evolution of the Upper Cretaceous Zagros ophiolites
Considered together, the data we have reviewed for the Zagros Upper Cretaceous ophiolites, along with what is known for the better-studied Troodos and Oman ophiolites, compels us to conclude that a long, broad and continuous tract of oceanic lithosphere was created at about the same time during Late Cretaceous time along the southern margin of Eurasia. This tract extended beyond Iran through Syria and Turkey as far as Cyprus to the west and Oman to the east (Fig. 1). The similarity of ages for igneous rocks and overlying sediments, both along (from Cyprus to Oman) and across (inner to outer belt) the ophiolite belt indicates that a successful model should explain all of these occurrences.
All Zagros ophiolites are dominated by components with strong suprasubduction zone affinities, especially for the most diagnostic lithologies of mantle harzburgite, diabasic dykes and lavas. Most volcanic sections have mixtures of arc-like and MORB-like compositions with some E-MORB/OIB-type pillow lavas. Where age relationships can be resolved, MORB-like lavas usually are older and arc-like lavas are younger. It is important to appreciate that MORB-like basalts do not require a mid-ocean ridge tectonic environment, only that asthenospheric mantle melted to ~ 10% due to decompression, without a discernible input from subducted sediments or crust. Tectonic models with two distinct phases (for example, a MOR setting followed by an arc setting) might be appropriate if there was any evidence for a significant hiatus between MORB-like lower basalts and arc-like upper basalts and boninites, but this is nowhere observed in any Upper Cretaceous Zagros ophiolitic lava section, or in any of the other Upper Cretaceous ophiolites from Cyprus to Oman. Instead, we interpret the volcanic succession to have formed in a single tectonic environment, albeit one that was rapidly evolving. This reflected melting and progressive depletion of originally fertile asthenospheric mantle as a new subduction zone formed on the SW flank of Eurasia. Melting was first due to decompression alone and then due to an influx of water and sediment melts when the foundering lithosphere reached a certain depth and true subduction started. This interpretation is partly based on comparing our results with those of recent Shinkai 6500 diving on the inner wall of the Mariana Trench, which found MORB-like basalts (called fore-arc basalts) at the base of the volcanic succession, followed upsection by boninitic lavas (Reagan et al. Reference Reagan, Ishizuka, Stern, Kelley, Ohara, Blichert-Toft, Bloomer, Cash, Fryer, Hanan, Hickey-Vargas, Ishii, Kimura, Peate, Rowe and Woods2010). Reagan et al. (Reference Reagan, Ishizuka, Stern, Kelley, Ohara, Blichert-Toft, Bloomer, Cash, Fryer, Hanan, Hickey-Vargas, Ishii, Kimura, Peate, Rowe and Woods2010) interpreted the lower MORB-like lavas as first stage melts of asthenospheric mantle that were generated when foundering of Pacific lithosphere to initiate the IBM subduction zone occurred in Eocene time. This model was applied to Tethyan ophiolites, including Troodos and Semail, by Whattam & Stern (Reference Whattam and Stern2009). The geochemical data we have summarized for both Upper Cretaceous Zagros ophiolites, plus the observation that some IB ophiolites are conformably overlain by arc-derived pyroclastic rocks compels the conclusion that both the OB and IB formed over a subduction zone, at least for the later part of their early history. It is more controversial whether the MORB-like lavas of these ophiolites formed in the same setting, earlier during subduction initiation, or are remnant pieces of older oceanic crust, as seems to be the case for the Khoy and Haji–Abad ophiolites, where older tracts are juxtaposed with Upper Cretaceous ophiolites. We note that in these cases, the evidence for greater age of the older fragments is clear, whereas no such evidence exists for other Zagros OB and IB ophiolites. Consequently, we prefer to interpret MORB- and OIB-like igneous rocks in the Upper Cretaceous Zagros ophiolites as forming at about the same time as those with clear suprasubduction zone affinities.
It is also controversial whether or not the IB and OB are remnants of two distinct Late Cretaceous oceanic basins (as most other workers prefer) or a single disrupted one (as we prefer). Understanding the tectonic history of the SSZ is key for resolving this controversy, as discussed above. Our preferred hypothesis is that Zagros IB and OB ophiolites are remnants of a once-continuous tract of fore-arc lithosphere that formed during a Late Cretaceous episode of subduction initiation on the SW flank of Eurasia. We further argue that SSZ rocks were subducted several tens of kilometres deep before being exhumed beneath the Zagros fore-arc and disrupted it to yield the two ophiolite belts and the present configuration shown in Figure 2b. We reiterate that there is evidence that SSZ rocks were deeply subducted. They contain blueschist (e.g. Agard et al. Reference Agard, Monie, Gerber, Omrani, Molinaro, Meyer, Labrousse, Vrielynck, Jolivet and Yamato2006) and other evidence of high P/T metamorphism, but much more work is needed to test this idea. Furthermore, we hypothesize that the Paleocene–Eocene unconformity found above all Zagros ophiolites could mark the main episode of Sanandaj–Sirjan exhumation.
The fore-arc/subduction initiation model for the Zagros ophiolites is most consistent with diagnostic lithologies, boninite and harzburgite. Boninites are unusually high-degree melts of Cpx-poor peridotite. They are often found as parts of fore-arc crust, where they are thought to form when subduction begins. Boninites are rarely found in back-arc basins (Bedard et al. Reference Bédard, Lauzière, Tremblay and Sangster1998). Back-arc basin boninite has recently been discovered erupting in the northernmost Lau Basin (Michael et al. Reference Michael, Escrig, Rubin, Cooper, Langmuir, Clague, Keller and Plank2009), but this is a restricted, unusual tectonic setting, where the Lau Basin spreading axis intersects a transform margin. Peridotite compositions are also key. Upper Cretaceous Zagros ophiolitic peridotites include ultra-depleted harzburgites (and minor depleted lherzolites) that today are only found in modern intraoceanic fore-arcs. Harzburgites are residues after unusually extensive melting, to the point of Cpx exhaustion. At some point in their evolution, the shallow upper mantle beneath the Upper Cretaceous Zagros ophiolites experienced much more extensive melting (to the point of Cpx exhaustion) than is found anywhere else in the modern Earth (Bonatti & Michael, Reference Bonatti and Michael1989; Neumann & Simon, Reference Neumann and Simon2009). Because the mantle beneath modern fore-arcs is cold and rarely melts, this catastrophic melting must have occurred under very special conditions, most likely when subduction began. A much larger volume of magma is produced when a subduction zone first forms than for mature arcs (Stern & Scholl, Reference Stern and Scholl2010). Such voluminous melt generation mostly yields abundant tholeiite magma and harzburgitic residual mantle, sometimes along with boninite. This is consistent with the observation that boninites and very depleted peridotites are produced during subduction initiation and are common in the IBM fore-arc (Ishizuka et al. Reference Ishizuka, Kimura, Li, Stern, Reagan, Taylor, Ohara, Bloomer, Ishii, Hargrove and Haraguchi2006; Reagan et al. Reference Reagan, Ishizuka, Stern, Kelley, Ohara, Blichert-Toft, Bloomer, Cash, Fryer, Hanan, Hickey-Vargas, Ishii, Kimura, Peate, Rowe and Woods2010).
The tectonic scenario that we prefer for the Upper Cretaceous Zagros ophiolites and other Upper Cretaceous ophiolites from Cyprus to Oman is that these formed along the southern margin of Eurasia during a subduction initiation event, as summarized in Figure 17. This interpretation implies that these ophiolites are not accreted fragments but formed essentially where they are today on the southern margins of Eurasia. They are not far-travelled, exotic fragments of oceanic lithosphere but are partially preserved fragments of an oceanic fore-arc that formed when subduction began along this margin in Late Cretaceous time. This inference links Zagros, Cyprus and Oman ophiolites as examples of subduction initiation magmatic activity and precludes models for their formation at a normal MOR, a small Red Sea-like basin, a back-arc basin or anywhere except at a strongly extensional, incipient convergent margin. Such a model is also consistent with the observation that Zagros ophiolites formed when relative plate motions in the region changed dramatically (Garfunkel, Reference Garfunkel and Robertson2006).
Generation of the Upper Cretaceous Zagros ophiolites as a proto-fore-arc formed during subduction initiation, modified after Stern (Reference Stern2004). Left panels are sections perpendicular to the evolving plate boundary and right panels are map views. (a) and (b) show the initial (> 95 Ma) configuration. Two lithospheres of differing density (buoyant Eurasia, dense Tethys) are juxtaposed across a transform fault or fracture zone. (c, d) Old, dense lithosphere sinks asymmetrically, with maximum subsidence nearest the transform fault or fracture zone. Asthenosphere flows over the sinking lithosphere and propagates along the transform/fracture zone. Strong extension in the region above the sinking lithosphere leads to seafloor spreading, forming infant arc crust of the proto-fore-arc. This forms the Zagros ophiolites, ~ 93 Ma ago. (d) shows that this process is asynchronous along the margin; ophiolite ages indicate that subduction propagated from E (Oman) to W (Cyprus) between 95 and 90 Ma. (e, f) Beginning of down-dip motion of the lithosphere marks when true subduction starts (< 90 Ma). Strong extension in the fore-arc and trenchward migration of asthenosphere ends, cooling the sub-fore-arc mantle, which becomes lithosphere; further addition of water leads only to serpentinization. The locus of igneous activity retreats ~ 200 km away from the trench, to the region above where asthenospheric advection continues, forming the Urumieh–Dokhtar arc. This fore-arc today defines the Oman (Om), SW Iran (SI), and Cyprus (Cy) ophiolites. (g) A detailed view of how magmatism in the arc evolves with time: (1) infant arc crust of the fore-arc ophiolite forms by seafloor spreading during the first c. 5 Ma of subduction zone evolution; (2) retreat of magmatic activity away from the trench (Tr) during the second c. 5 Ma; (3) focusing of magmatic activity at the position of the active magmatic arc, resulting in crustal thickening and delamination.

6. Conclusions
The OB and IB Zagros Upper Cretaceous ophiolites as well as similar-aged ophiolites in Turkey, Cyprus and Oman are coeval and represent remnants of a Late Cretaceous oceanic fore-arc formed along the southern margin of Eurasia. Our compilation indicates that the Zagros ophiolites and other Upper Cretaceous Tethyan ophiolites of SW Asia are broadly similar in terms of age, lithological components and geochemical evolution. Nearly all Zagros ophiolite components show strong suprasubduction zone affinities, especially for the most diagnostic lithologies of mantle harzburgite, arc thoeiite and boninite, excepting some MORB-like pillow lavas. Most volcanic sections have mixtures of arc-like and MORB-like compositions.
Along with other Tethyan ophiolites in the region of similar age, Zagros ophiolites are interpreted to represent autochthonous fore-arc lithosphere that formed by seafloor spreading along the southern margin of Eurasia during Late Cretaceous time. This fore-arc lithosphere was once continuous, both across the two Zagros ophiolite belts (OB and IB) as well as from Cyprus to Oman. This fore-arc has been disrupted by continued shortening, especially since collision began with Arabia in mid-Cenozoic time, as well as by tectonic underplating beneath the fore-arc and subsequent exhumation to form the SSZ, which now separates the Zagros IB and OB. Zagros ophiolites and correlatives from Cyprus to Oman constitute a tract of oceanic lithosphere that formed along the southern margin of Eurasia when subduction began, forming the subduction zone that has continued operating until today. This subduction zone is responsible for the Urumieh–Dokhtar arc and has since swallowed all of the Neo-Tethys between Afro-Arabia and Eurasia. The Zagros orogen has evolved as a convergent plate margin since subduction began ~ 95 Ma, with the Persian Gulf representing a trench that is being progressively filled from the NW, the Zagros fold-and-thrust belt representing a still-growing accretionary prism.
Acknowledgements
HSM's research on Zagros IB ophiolites has been supported financially by the French CNRS (contribution of the UMR 7516 ‘Institut de Physique du Globe’, Strasbourg, France) and the Cultural Service of the French Embassy at Tehran. We are deeply indebted to Dr Blanchy, Dr Duhamel and Dr Lambert. We are most thankful to the University of Strasbourg for producing analyses on the IB and would like to thank Prof. Mohamad Rahgoshay, Prof. Hubert Whitechurch and Dr Raymond Montigny for helping HSM interpret IB ophiolites for his Ph.D. research. Financial support for the OB ophiolite studies from the Research Council of Damghan University (grant number 88/GEO/64/127 to HSM) is acknowledged. We sincerely thank Prof. Pour-Mousavi from Damghan University for his excellent support of this research programme. This paper greatly benefited from the comments of Dr Mark Allen, Dr Guy Simpson and two anonymous reviewers.


