


1. INTRODUCTION
In recent decades, air temperatures over portions of coastal Antarctica, the Southern Ocean and the winter atmosphere over Antarctica have exhibited record warming resulting in catastrophic disintegration of Antarctic ice shelves and coastal glaciers (ACCE, Reference Turner, Bindschadler, Convey, Prisco, Fahrbach, Hodgson, Mayewski and Summerhayes2009). As a consequence of stratospheric ozone depletion over Antarctica and tropospheric greenhouse gas warming (Thompson and Solomon, Reference Thompson and Solomon2002), there has been a significant poleward displacement of the polar jet and intensification of the polar westerlies (poleward (winter 3.38°S; summer 1.88°S) and intensifying (up to 6%) between 1981–1990 and 2001–10) (Mayewski and others, Reference Mayewski2012). The current rate and magnitude is potentially unsurpassed in the last 5200 a (Mayewski and others, Reference Mayewski2012). Further, the resultant steeper latitudinal (N–S) thermal gradient has left much of interior Antarctica at least temporarily isolated from the full force of greenhouse gas warming and sea ice extent surrounding much of Antarctica has increased (Turner and others, Reference Turner2009).
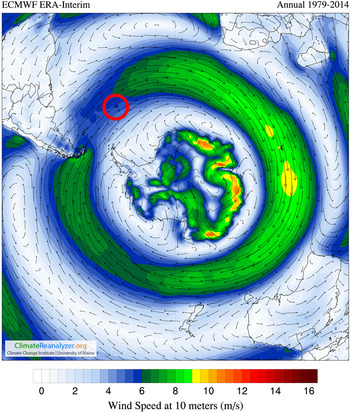
Although warming is clearly impacting sub-Antarctic glacier extent (ACCE, Reference Turner, Bindschadler, Convey, Prisco, Fahrbach, Hodgson, Mayewski and Summerhayes2009) ice core records recovered from carefully selected sites may still offer valuable reconstructions of past climate. South Georgia has a particularly advantageous location, placing it in the direct path of westerly winds (Fig. 1) dominated by marine air, and a variety of South American crustal, terrestrial biogenic and anthropogenic chemical sources from as far north as the Amazon. As a result South Georgia ice may contain records that capture past changes in the intensity and latitudinal range of atmospheric circulation systems such as the westerlies. Changes in the strength and position of the westerlies have significant impacts on moisture balance, storminess and northward penetration of cold surface ocean currents on both the west and east coasts of southern South America (Mayewski and others, Reference Mayewski2015). South Georgia also receives intermittent air mass intrusions from the sub-tropics of eastern South America associated with El Niño (La Niña) southward (northward) displacement of mean circulation over the South Atlantic (Yuan, Reference Yuan2004) that could be useful in assessing polar-tropical teleconnections. Finally changes in air chemistry resulting from changes in the passageways of air masses over chemistry source regions could impact nutrient deposition over marine and terrestrial ecosystems in the South Atlantic region. South Georgia is, therefore, well placed to offer a record of past climate change over the South Atlantic. The major uncertainty, however, is how complete or robust an ice core record remains in South Georgia?
Red circle indicates location of South Georgia directly in the path of the westerlies.
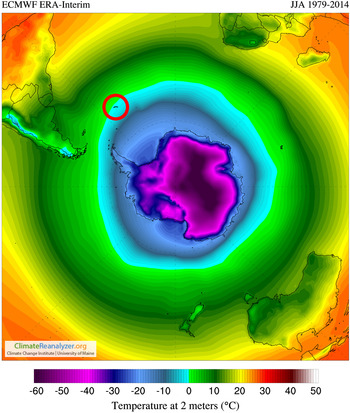
South Georgia's climate is classified as polar since it is south of the Polar Front. At sea level, winter temperatures are close to freezing (Fig. 2) and proximity to the Antarctic Current results in cold surface waters although, sea ice rarely forms around the island in winter. Dominant westerly winds result in harsher conditions on the northwestern side of the island compared with the southeast side, where descending winds yield milder and drier conditions. Annual precipitation is ~1500 mm and summer snowline is ~300 m a.s.l. on the northwest side of the island (https://en.wikipedia.org/wiki/SouthGeorgiaandtheSouthSandwichIslands). Incoming radiation levels are low (maximum ~21% of total available) due to clouds and local topography. Elevations on the island's interior plateau are up to 1000 m a.s.l. and climbing teams (S. Novak, 2014, personal communication) report the presence of dry snow zones on the interior plateau, indicating suitable conditions for a well preserved ice core record in these regions. The highest peak on the Island is Mount Paget (2935 m a.s.l.), but this mountain and others above 2000 m a.s.l. are either too small to preserve an ice cap or require helicopter support to avoid the heavily crevassed slopes surrounding the mountains. A limited number of climbing teams have ascended these mountains, but transport of equipment, needed for drilling to bedrock, through the crevasses and icefalls surrounding these sites is unrealistic. There is at this time no possibility of helicopter support on the island or from offshore so our search for a deep drilling site has been confined to regions, where future drilling could realistically be undertaken via oversnow traverse from the coast.
Red circle indicates location of South Georgia within the Polar Front. Winter (JJA (June, July, August) temperature plotted.
Previous research on Marinelli Glacier in the Cordillera Darwin, Tierra del Fuego, at nearly the same latitude as South Georgia and at an elevation of 1823 m a.s.l. (Grigholm and others, Reference Grigholm2009), revealed significant surface melting. The mean maximum temperature at Ushuaia, located on the coast, 90 km east of Marinelli Glacier, is 13°C (http://www.weather-and-climate.com), and occurs in January and February. Assuming a temperature lapse rate of 6°C km−1, at an elevation of 1823 m on Cordillera Darwin, the mean maximum temperature in January/February should be ~+2°C. Clearly there must be warmer days with higher maximum temperature at 1823 m on Marinelli Glacier, but already a mean maximum temperature of +2°C is sufficiently high to explain the extensive snowmelt observed. A similar estimation for South Georgia suggests a mean maximum temperature of −2°C in February at an elevation of 1823 m, based on a mean maximum temperature of 9°C recorded at Grytviken (http://www.weather-and-climate.com), located on the warmer northeastern coast of South Georgia. Therefore, cold snow and ice should definitely exist at elevations above 2000 m on South Georgia, with suitable microclimate conditions to preserve an ice core record. However, South Georgia is subjected to extremely strong winds year round that at elevation, could lead to significant loss of surface snow thus seriously compromising records retrieved from the highest regions of the island. Further, unlike the Cordillera Darwin, South Georgia is located south of the Polar Front so that ice located at lower elevations than 2000 m or very old ice retrieved through drilling and from glacier margins warrants reconnaissance investigation. Waiting much longer only increases the likelihood of losing any record that might still be preserved.
In October 2012 our research team joined a crew of three on board the 73′ sailboat Pelagic Australis and set sail to South Georgia from the Falkland Islands. Our goals were to retrieve a shallow firn core, to assess the potential for identifying ‘annual layering’ in old ice, and to conduct preliminary ice radar measurements. Our window of opportunity for this first reconnaissance was significantly shortened by unusually heavy October winds, so we did not have sufficient time to collect a firn core from our proposed site on the Kohl Plateau (Fig. 3) at ~900 m a.s.l., however, we were able to collect preliminary information that highlights the valuable climate record potentially available from a South Georgia ice core and confirms the potential for more detailed future investigations. In the short period available for fieldwork we collected one 2.5 m deep snowpit at 550 m a.s.l. from Szielasko Ice Cap on the Barff Peninsula (Fig. 3). Unfortunately this is the warmer north side of the island and the site is surrounded by ice free, dark rock. The snowpit yielded unmelted winter/spring snow deposited over ice, which was no doubt, refrozen melt from the previous warm season or older. At Szielasko Ice Cap we also measured surface elevation and ice thickness with radar sounding, to assess the potential span of an ice core record and to evaluate recent elevation changes. In addition, we collected two short (~1 m) cores from the terminal reaches of the Nordenskjöld and Fortuna Glaciers on the northeastern side of the island (Fig. 3). While none of these locations are suitable for the collection of continuous ice core records that include modern snow, they do represent the first chemical sampling of snow and ice from South Georgia and the results offer promise for future study.
Image captured by the Landsat-8 satellite on 16 February 2015 USGS/ESA. South Georgia is ~186 km from northwest to south east and ~36 km at its widest point.

2. ICE CORE CHEMISTRY – METHODS AND RESULTS
We utilized the Climate Change Institute's W.M. Keck Laser Ice Core Facility LA-ICP-SFMS (Laser Ablation-Inductively Coupled Plasma-Sector Field Mass Spectrometry) system for the ultra-high resolution glaciochemical analyses of the ice cores reported in this study. Components include a Thermo Element 2 ICP-SFMS (also used for the lower resolution trace element sampling of the snowpit in this study), coupled to a New Wave UP-213 laser system and the Sayre Cell ™, a cryocell chamber designed to seal a 1 m ice core from the surrounding air, while maintaining a uniform temperature of ~−15°C, and a 121 µm sampling resolution (Sneed and others, Reference Sneed2015). Hydrogen isotope ratios (δD) were measured via Cr reduction with a Eurovector elemental analyzer coupled to a Micromass Isoprime mass spectrometer. Samples of particulate organic carbon for 14C analysis were decontaminated, extracted and combusted at Heidelberg University resulting in CO2-gas for direct 14C analysis via the gas ion source at the MICADAS-AMS in Mannheim (Kromer and others, Reference Kromer, Lindauer, Synal and Wacker2013).
14C measurements were made on ice from the short cores recovered at the margins of Fortuna and Nordenskjöld Glaciers. Calibrated 14C ages of 8633–9397 a BP and 10 295–10 997 a BP, respectively, suggest that the ice terminii age, potentially the oldest ice on the island, could be in the range 8500–11 000 a BP. While we report these dates, we caution that future investigation, including 14C dating of local ice-free region materials is clearly essential, in light of reservoir effects potentially introduced by the incorporation of local dusts and sediment.
Figure 4 shows δD from the Szielasko snowpit and the Fortuna and Nordenskjöld terminii short cores. We assume that the snowpit data covers winter/spring 2011/12 and the range, −170 to −100‰, suggests significant enough variability to represent storms or seasons. Lacking longer records, it is unclear if the values are controlled by temperature, snow accumulation rate, transport distance and/or source region. The significantly older glacier margin short cores reveal significantly less depleted values (Fortuna −62 to −54; Nordenskjöld −99 to −81) and significantly subdued variability suggesting post-depositional alteration of the water isotope record or possibly warmer and shorter transport conditions 8500–11 000 a ago, which if the 14C age is correct, coincide with widespread Antarctic early Holocene warming from 9000 to 11 500 a BP (Steig and others, Reference Steig2000).
δD (deuterium), calcium, iron and sodium ICP-SFMS values for Szielasko snowpit, Fortuna and Nordenskjöld Glacier terminii ice cores. Gray highlighting shows sections analyzed by LA-ICP-SFMS in Figure 5.

Calcium and iron LA-ICP-SFMS for Fortuna and Nordenskjöld termini ice samples. Location of samples highlighted in gray in Figure 4.

Figure 4 also reveals calcium (crustal source), iron (crustal and marine source), and sodium (marine source) ICP-SFMS derived concentrations for the Szielasko snowpit, and for the Fortuna and Nordenskjöld terminii cores. Winter/spring Szielasko snowpit concentrations are higher in calcium than most of the core samples. Winter/spring Szielasko iron concentration is in between those of Nordenskjöld and Fortuna, respectively. Szielasko sodium concentration is notably higher than in either core. The generally higher calcium and notably higher sodium concentrations in modern winter/spring snow may suggest stronger westerly winds and/or a more exposed local dust sources, albeit based on limited data.
To investigate the potential for the preservation of ‘annual layers’, 121 µ ultra-high resolution LA-ICP-SFMS measurements from 9 cm long sections of the termini cores are presented in Figure 5. Perhaps most intriguing is the ~10 mm, fairly consistent variability in both the Fortuna and Nordenskjöld LA-ICP-SFMS calcium and iron data. The variability is similar to that induced by ‘annual layering’. However, knowledge of modern day annual layering (net mass balance) is needed before assigning the variability described here as ‘annual’. Nevertheless there is the potential to recover a long record of ‘annually-resolved’ past mass balance potentially covering the Holocene.
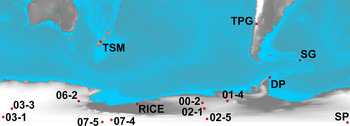
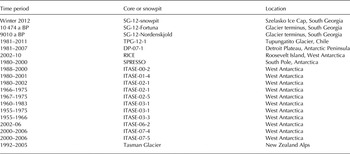
Figure 6 and Tables 1 and 2 provide an initial comparison of the levels of crustal (Sr, Ba, La, Ce, Pb, Li, S, Ca, Ti, Mn, Fe, Na, Mg), marine (Sr, Ba, Pb, S, Ca, Fe, Na, Mg) and anthropogenic (Ba, Pb, S) source elements from ice core sites in Antarctica, Chile, New Zealand and South Georgia. Levels of several elements (Sr, Ba, La, Ce, Pb, Li, S, Ca, Ti, Mn, Fe, Na, Mg) are in general higher for extra-Antarctic sites (South Georgia, New Zealand (Tasman) and the Chilean Andes (TPG) than for northerly Antarctic sites (Antarctic Peninsula (DP), and coastal West Antarctica (RICE), which in turn are higher than West Antarctic (ITASE; Dixon and others, Reference Dixon2013) and South Pole (SPRESSO; Korotkikh and others, Reference Korotkikh, Mayewski, Dixon, Kurbatov and Handley2014) ice core values. Szielasko winter snowpit values for Sr, Na, and Mg are the highest in the record demonstrating the significant marine influence impacting South Georgia. Anomalously high Ba values at South Pole are attributed to local station anthropogenic sources (building materials and fuels) (Korotkikh and others, Reference Korotkikh, Mayewski, Dixon, Kurbatov and Handley2014), while mining in the Chilean Andes could explain the high Ba values for South Georgia.
Distribution of concentration data presented in Table 1. Map base from ETOPO1 (Amante and Eakins, Reference Amante and Eakins2009).
Time period covered, site name and location for records presented in Figure 6
Mean chemical concentration data for sites compared in this study (Fig. 6)

All data were collected by and analyzed by the Climate Change Institute.
3. RADIO ECHO SOUNDING AND GPS – METHODS AND RESULTS
A portable impulse radar with a central frequency of 4 MHz was used with a transmitter to produce a pulse with an output voltage of 1600 V, a rise time of 100 ns and a pulse repetition frequency of 400 pulses s−1. The receiver is composed of a Fluke PM97 oscilloscope connected to a portable PC that acts as a recording unit. Antennae with a half-dipole length of 20 m (λ/4) were used in the field, equivalent to a wavelength (λ) of 42 m in ice, assuming an electromagnetic wave velocity in temperate ice of 168 m µs−1 (Blindow and others, Reference Blindow2010). Frequencies <30 MHz are especially adequate for temperate glaciers such as those found at lower elevations on South Georgia, since the presence of water bodies within the ice with a dimension on the order of several meters produces strong signal loss by scattering and absorption. The radar data were processed using the ReflexW program (K.J. Sandmeier software).
A single freguency GPS receiver with C/A code and pseudorange was used for geolocation of the radar data and also for monitoring the surface elevation of the glacier. The GPS data were differentially processed with data from the IGS (International GNSS Service (http://igs.org/rts) stations Falkland Islands (FALK, located 1470 km to the west) and O'Higgins Station (OHIG, located 1580 km southwest in the Antarctic Peninsula) using the GrafNav software combined with the online Precise Point Positioning (PPP) solution of the Canadian Spatial Reference System (http://www.geod.nrcan.gc.ca/products-produits/ppp_e.php). The elevation accuracy of the data is 4 m.
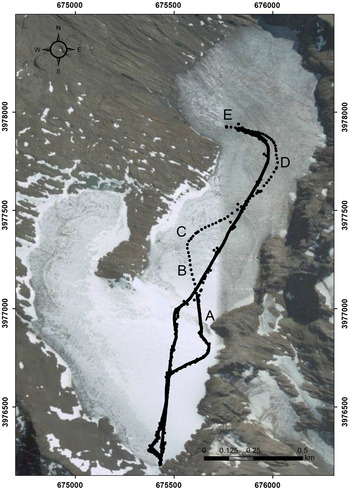
A 2 km north-south and south-north radar and GPS transect, with a similar return track (total 4 km), was completed on Szielasko Ice Cap on 18 October 2012 (Fig. 7). The Szielasko Glacier covers an area of 1.6 km2, with a total area of ~3 km2 including neighboring ice-covered areas, which is ~4% of the whole Barff Peninsula. Based on its size Szielasko is classified at present as a glacier, rather than an ice cap (Cogley and others, Reference Cogley2011).
Szielasko Glacier. The image is 1.6 km wide (east-west) and 2.5 km long (north-south). The black path represents the radar/GPS track performed on 18 October 2012 and the lowest elevation is marked as ‘D’. The radar profile ABCDE was measured on the return track, and the corresponding radargram is shown in Figure 8. A maximum ice depth of 76 m was measured at point B. Source: Google Earth.
Radargram corresponding to the profile AA′ shown in Figure 7. The left axis shows two-way travel time in ns, while the right axis is the equivalent ice depth in m. The horizontal scale is expressed as number of radar traces, and corresponds to a horizontal distance of 1460 m. The lower radargram is the same as the upper one, but with a red curve indicating the interpreted glacier bed. The maximum ice depth of profile AA′ occurs at trace N°76 with 76 m (Figure 7).

The maximum ice depth along the radar transect is 86 m. Figures 7 and 8 show a radar transect with a maximum ice thickness of 76 m. Ice thicknesses have a nominal accuracy of 5 m. These are the first reported ice thickness measurements of South Georgia, and will help to calibrate estimated ice depths (Cooper and others, Reference Cooper, Tate and Cook2010). For Szielasko Glacier, the estimated ice depth using a standard ice flow model based on SRTM surface elevations (Farr and others, Reference Farr2007) is between 0 and 250 m, with a 50% confidence (Cooper and others, Reference Cooper, Tate and Cook2010).
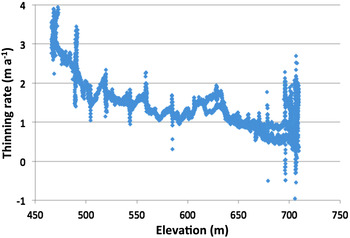
Comparison of our GPS data of 18 October 2012 with the 1 arcsecond (24.5 m horizontal resolution and vertical error of 8 m) SRTM elevation data of February 2000 allows us to derive elevation changes for Szielasko Glacier. The total elevation change error is the quadrature sum of the GPS and the STRM errors. The absolute elevation errors of the GPS and the SRTM data (at 90% probability level) are 4 and 8 m, respectively, so the quadrature error is 9 m. For an average thickness change over the area of Szielasko Glacier, the total error can be further divided by the square root of the number of GPS data points obtained (11 773 data points at a rate of 1 Hz), resulting in an elevation change error of 8 cm. An average thinning of 20.38 m was obtained for the 12.7 a period, equivalent to an average thinning rate of 1.6 m a−1. The thinning rate is maximum at lower elevations (4 m a−1 at 420 m) and minimum at higher elevations (~1 m a−1 at 700 m) (Fig. 9).
Thinning rates (m) at Szielasko Glacier were obtained from GPS 18 October 2012 data and SRTM February 2000 1 arcsec data. Thinning rates are maximum at lower elevations and minimum at the highest elevations.
Assuming a mean snow/firn density of 0.5 g cm3 at Szielasko Glacier, a mass loss of 0.8 m w.e. a−1 is obtained, that is in the upper range of the global average of glacier mass loss (Zemp and others, Reference Zemp2015) for the first decade of the 21st century, and the highest mass loss rate measured during the last 100 a. The large majority (97%) of glaciers in South Georgia have been retreating since at least 1938, with 15 glaciers having retreated >1 km, and Neumayer Glacier on the northeastern coast exhibiting the largest retreat in South Georgia; 4.4 km in the period 1957–2008 (Cook and others, Reference Cook, Poncet, Cooper, Herbert and Christie2010). This accelerated retreat is most probably a response to warmer air and sea surface temperatures with impacts on albedo, glacier calving and other ablation processes. At Grytviken, on the northeast coast of South Georgia, summer temperatures are nearly 2°C higher than in the 1930s (Cooper and others, Reference Cooper, Tate and Cook2010).
If current glacier loss rates remain stable, peripheral low-elevation glaciers such as Szielasko would completely disappear within 50 a. Under future climate warming scenarios glacier extinction could probably occur earlier. On the main icefield of South Georgia the highest elevations are close to 1000 m and reach 2935 m a.s.l. at Mount Paget. Considering that the large majority of glaciers are retreating on South Georgia, any potential snow accumulation increase related to warming and intensification of the westerlies, has likely been counterbalanced by enhanced ablation due to temperature increase at lower elevations. Therefore we should expect ongoing accelerated glacier loss over South Georgia in the future.
4. CONCLUSIONS
Our data together with the inspection of climatological data suggest that a viable ice core climate record is available from South Georgia, particularly at elevations above 2000 m a.s.l. There exists a strong impetus for continuing the search for a well-preserved ice core site based on the following: (1) South Georgia is clearly in a region that is sensitive to and potentially severely impacted by changes in the position and strength of the westerlies; (2) glacier retreat in response to warming severely limits the availability of viable ice core recovery sites on South Georgia; (3) ‘annual layering’ could be preserved in old ice; (4) recent terrestrial dust (calcium) and seasalt (sodium) values suggest intensification of the westerly winds today relative to a snapshot in time tentatively assigned to the early Holocene; and (5) South Georgia glaciochemical concentrations are very high relative to West Antarctic and Antarctic Peninsula ice core sites, and similar to ice core sites in the Chilean Andes and the New Zealand Alps, as might be expected based on latitude and proximity to terrestrial and anthropogenic sources. It is clear that an ice core sampling site well above 550 m (ideally above 2000 m), on the west side of the island (summer snowline ~300 m), far from exposed rock, is required to test the viability of a deeper ice core. Sites in the Kohl Plateau region at ~1000 m a.s.l. or the small ice caps above 2000 m a.s.l. are likely candidates. The highest sites are subjected to intense winds and therefore significant erosion that could cause major erosional disconformities in resulting ice core records. Further they require helicopter support to transport deep drilling equipment, that is, at present, not available for South Georgia.
ACKNOWLEDGEMENTS
We wish to thank the crew (Magnus Day, Kali Kahn, and Edd Hewitt) and owner Skip Novak of Pelagic Australis for their amazing support, the Kuli Foundation for their generous funding, the Government of South Georgia and the South Sandwich Islands for permission to work on South Georgia and for their remarkable oversight of the island, the Government of the Falkland Islands and the South Atlantic Environmental Research Institute in the Falkland Islands for their advice and support, the British Antarctic Survey for allowing use of their freezer at the King Edward Point Station, and for transporting our ice samples to the UK from which we could transport them to Maine, two anonymous reviewers for their helpful comments, W.M. Keck Foundation and the US National Science Foundation 1042883) for support and enhancement of the W.M. Keck Laser Ice Facility at CCI, and to the University of Heidelberg (Dietmar Wagenbach and Pascal Bohleber) for facilitating the 14C measurements.


 Open access

