


Introduction
Bipolar disorder (BD), a complex disorder characterized by severe fluctuations in mood states, recurrent episodes of mania and depression, and a high risk of suicide, can have a strong negative impact on social activities, cognition, and overall quality of life (McIntyre et al., Reference McIntyre, Berk, Brietzke, Goldstein, López-Jaramillo, Kessing and Mansur2020). The overall prevalence of BD is approximately 1%, with a heritability rate of approximately 60% (Bessonova et al., Reference Bessonova, Ogden, Doane, O’Sullivan and Tohen2020; Merikangas et al., Reference Merikangas, Jin, He, Kessler, Lee, Sampson and Zarkov2011; Smoller & Finn, Reference Smoller and Finn2003; Song et al., Reference Song, Kuja-Halkola, Sjölander, Bergen, Larsson, Landén and Lichtenstein2018). However, in a large-scale genome-wide association study conducted by the Psychiatric Genomics Consortium, genetic variations accounted for approximately 19% of the phenotypic variance in BD (Mullins et al., Reference Mullins, Forstner, O’Connell, Coombes, Coleman, Qiao and Andreassen2021). Additionally, a substantial body of research indicates that BD is influenced by various genetic and environmental factors (e.g. preterm birth, adverse childhood experiences, substance abuse) (Anand et al., Reference Anand, Koller, Lawson, Gershon and Nurnberger2015; Marangoni, Hernandez, & Faedda, Reference Marangoni, Hernandez and Faedda2016; Musci, Augustinavicius, & Volk, Reference Musci, Augustinavicius and Volk2019; Nosarti et al., Reference Nosarti, Reichenberg, Murray, Cnattingius, Lambe, Yin and Hultman2012; Rodriguez et al., Reference Rodriguez, Alameda, Trotta, Spinazzola, Marino, Matheson and Vassos2021). Accordingly, DNA methylation, which is influenced by several environmental factors and dynamically regulates gene expression, may be relevant for understanding the pathophysiology of BD (Uher, Reference Uher2014).
DNA methylation is a mechanism of epigenetic regulation regulated by DNA methyltransferase and involves the addition of methyl groups to the C5 position of cytosine (Mattei, Bailly, & Meissner, Reference Mattei, Bailly and Meissner2022). Epigenetic patterns in the nervous system can be influenced by various environmental risk factors, and abnormal epigenetic patterns can affect gene expression (Moore, Le, & Fan, Reference Moore, Le and Fan2013). It is possible that similar changes reflect gene-environment interactions associated with BD etiology and affect the expression patterns of relevant genes, which could then be potential candidates for regulating the neurobiological mechanisms involved in the pathogenesis of BD (Fries et al., Reference Fries, Li, McAlpin, Rein, Walss-Bass, Soares and Quevedo2016). Epigenome-wide association studies (EWASs) have emerged as a successful methodology for identifying changes in epigenetic patterns associated with various diseases. Nevertheless, despite the growing body of evidence that suggests associations between the instability of DNA methylation patterns and the development of BD, evidence regarding epigenetic variations associated with the development of BD remains limited compared to that for other psychiatric disorders (Bundo et al., Reference Bundo, Ueda, Nakachi, Kasai, Kato and Iwamoto2021; Fries et al., Reference Fries, Li, McAlpin, Rein, Walss-Bass, Soares and Quevedo2016; Hesam-Shariati et al., Reference Hesam-Shariati, Overs, Roberts, Toma, Watkeys, Green and Fullerton2022; Legrand, Iftimovici, Khayachi, & Chaumette, Reference Legrand, Iftimovici, Khayachi and Chaumette2021).
Considering that DNA methylation plays an essential role in brain maturation and function, structural and functional changes in brain networks may mediate the association between epigenetic variations and BD development (Gapp, Woldemichael, Bohacek, & Mansuy, Reference Gapp, Woldemichael, Bohacek and Mansuy2014). The cortical thickness (CT), the highly folded neuron sheets that form the outer layer of the brain, is considered a direct quantitative indicator of cerebral cortex integrity and morphology (Fischl & Dale, Reference Fischl and Dale2000; Rebsamen et al., Reference Rebsamen, Rummel, Reyes, Wiest and McKinley2020). It reflects geographically preserved information and is associated with various important parameters, such as neuronal and glial cell numbers, dendritic arborization, neuron size, and extracellular space size (Hanford, Nazarov, Hall, & Sassi, Reference Hanford, Nazarov, Hall and Sassi2016; Narr et al., Reference Narr, Woods, Thompson, Szeszko, Robinson, Dimtcheva and Bilder2007). CT is particularly relevant to the pathophysiology of BD and is one of the most intensively researched neuroimaging parameters in relation to genetic factors in BD (Harrison, Colbourne, & Harrison, Reference Harrison, Colbourne and Harrison2020). For instance, a large-scale longitudinal study by the Enhancing Neuro Imaging Genetics through Meta-Analysis (ENIGMA) BD working group revealed slower thinning of fusiform and hippocampal CT in patients with BD, and a negative correlation between the frequency of (hypo)manic episodes and prefrontal CT (Abé et al., Reference Abé, Ching, Liberg, Lebedev, Agartz, Akudjedu and Landén2022). Additionally, a recent meta-analysis revealed significant cortical thinning across broad areas of the brain in patients with BD, including the bilateral anterior cingulate cortex, left Rolandic operculum, left transverse temporal gyrus, left inferior frontal gyrus, and left superior frontal gyrus (Zhu et al., Reference Zhu, Zhao, Wen, Li, Pan, Fu and Gong2022).
Several studies have investigated the associations between brain structure and genetic variations in patients with BD, including one study on the associations between changes in brain structure and the methylation level of the OXTR gene, which is linked to social cognition abilities and emotion processing (Abé et al., Reference Abé, Liberg, Song, Bergen, Petrovic, Ekman and Landén2020; Han et al., Reference Han, Han, Kim, Kang, Kang, Kang and Ham2019; Jiang et al., Reference Jiang, Zai, Kennedy, Zou, Nikolova, Felsky and Goldstein2023; Kennedy et al., Reference Kennedy, Shahatit, Dimick, Fiksenbaum, Freeman, Zai and Goldstein2022; Rubin et al., Reference Rubin, Connelly, Reilly, Carter, Drogos, Pournajafi-Nazarloo and Sweeney2016). However, to the best of our knowledge, the EWAS approach has not yet been used to examine the changes in brain structure in BD. This study aimed to identify the differences in epigenetic patterns associated with the pathophysiology of BD and investigate their correlation with changes in CT. First, we investigated significant differences in epigenetic patterns using EWAS at the whole-genome level. Second, we explored structural changes in CT using T1-weighted magnetic resonance imaging (MRI) data. Thereafter, correlations between CT and the methylation levels of epigenetic loci identified based on the EWAS were examined. Finally, we used functional enrichment analysis to identify significantly enriched pathways and functions using the gene list obtained from the EWAS and performed copy number alteration (CNA) analysis to detect structural variations associated with the pathophysiology of BD.
Materials and methods
Study participants
This study included 161 healthy controls (HCs) and 90 patients with BD as confirmed by at least two experienced board-certified psychiatrists (Ham B.J. and Han K.M.) based on a standardized clinical interview (the Structured Clinical Interview for the 5th edition of the Diagnostic and Statistical Manual of Mental Disorders Axis I disorders) (First, Williams, Karg, & Spitzer, Reference First, Williams, Karg and Spitzer2016). Patients with BD were recruited between January 2015 and August 2021 at the outpatient psychiatric clinic of Korea University Anam Hospital in Seoul, Republic of Korea. Self-reported information was used to confirm that the ancestry of each participant for the last three generations was Korean. Additionally, no samples were identified as genetic outliers through principal component analysis and Mahalanobis distance (Supplementary Method 1). The inclusion criteria for the BD group were as follows: (i) a diagnosis of bipolar I or II disorder according to DSM-5; (ii) age between 19 and 69 years; and (iii) current euthymic or depressive state, operationally defined as a score of ≤12 on the 11-item Young Mania Rating Scale (YMRS), indicating the absence of (hypo)manic symptoms (Macellaro et al., Reference Macellaro, Cafaro, Kelly, Ostacher, Dell’Osso, Lyu and Suppes2025; Suppes et al., Reference Suppes, Mintz, McElroy, Altshuler, Kupka, Frye and Post2005). Patients meeting criteria for (hypo)mania were explicitly excluded. This restriction was applied to reduce mood-state–related heterogeneity (Abé et al., Reference Abé, Ekman, Sellgren, Petrovic, Ingvar and Landén2015) and to ensure structural MRI data quality, as in-scanner head motion can systematically bias cortical morphometric estimates (Reuter et al., Reference Reuter, Tisdall, Qureshi, Buckner, van der Kouwe and Fischl2015). The exclusion criteria were: (i) comorbid diagnosis of major psychiatric disorders (including personality and substance use disorders); (ii) high suicidal risk requiring immediate inpatient treatment; (iii) history of a serious or unstable medical illness; (iv) primary neurological illness (e.g. Parkinson’s disease, cerebrovascular disease, or epilepsy); (v) pregnancy or nursing; and (vi) any contraindications for MRI (Han et al., Reference Han, Han, Kim, Kang, Kang, Kang and Ham2019). HCs were recruited via advertisements during the same period. In addition to the aforementioned criteria, the absence of a history of psychiatric disorders was used as an additional criterion for their recruitment.
The severity of depressive symptoms was assessed using the 17-item Hamilton Depression Rating Scale (HDRS) (Hamilton, Reference Hamilton1960). The 11-item YMRS was used to assess the manic symptoms of patients with BD (Young, Biggs, Ziegler, & Meyer, Reference Young, Biggs, Ziegler and Meyer1978). All patients were confirmed as being right-handed using the Edinburgh Handedness Test (Oldfield, Reference Oldfield1971). For the BD group, the duration of illness was defined as the lifetime cumulative number of months of depressive and (hypo)manic episode(s) using the life-chart methodology.
This study was approved by the Institutional Review Board of Korea University Anam Hospital (2017AN0185). All participants provided written informed consent before being included in the study.
Data acquisition and processing
A combination of two datasets was used: (i) genomic data for biomarker identification and (ii) brain MRI data. To measure the DNA methylation levels of peripheral blood of each participant, the Infinium MethylationEPIC BeadChip (Illumina Inc.; San Diego, CA, USA) was used according to the manufacturer’s protocol (Supplementary Method 2). After removing low-quality samples and probes, the beta-mixture quantile normalization and ComBat algorithms were applied to eliminate technical biases (Supplementary Method 3) (Johnson, Li, & Rabinovic, Reference Johnson, Li and Rabinovic2007). The composition of white blood cell was estimated using the FlowSorted.Blood.EPIC R package to control potential bias from cell type heterogeneity in DNA methylation (Supplementary Method 4) (Houseman et al., Reference Houseman, Accomando, Koestler, Christensen, Marsit, Nelson and Kelsey2012; Salas et al., Reference Salas, Koestler, Butler, Hansen, Wiencke, Kelsey and Christensen2018). The beta (β) value – range from 0 to 1 – was used to represent the methylation level.
Among 251 participants, 82 patients with BD and 154 HCs underwent brain MRI to acquire T1-weighted images (Supplementary Method 5). FreeSurfer version 7.2 (Laboratory for Computational Neuroimaging, Athinoula A. Martinos Center for Biomedical Imaging, Charlestown, MA, USA; http://surfer.nmr.mgh.harvard.edu) was used to measure the thickness of 38 cortical gyri in each hemisphere according to the atlas by Destrieux et al. (Supplementary Method 6) (Destrieux, Fischl, Dale, & Halgren, Reference Destrieux, Fischl, Dale and Halgren2010). CT was defined as the minimum distance from the boundary of gray/white matter to the pial surface.
Differential methylation analysis
Differential methylation analysis for comparing HCs and patients with BD was conducted at both the probe and region levels. Age and sex were considered as covariates. Differentially methylated probes (DMPs) were identified using the limma R package (Ritchie et al., Reference Ritchie, Phipson, Wu, Hu, Law, Shi and Smyth2015). Type I errors were controlled using false discovery rate (FDR) correction. Significant DMPs were defined as those with a FDR ≤ 0.05 and an absolute Δβ value ≥0.07 based on statistical power estimation using the pwrEWAS R package (Supplementary Method 7) (Supplementary Figure S1) (Graw, Henn, Thompson, & Koestler, Reference Graw, Henn, Thompson and Koestler2019). For region-level analysis, the DMRcate R package was used to identify differentially methylated regions (DMRs) based on previously recommended parameters (lambda = 500; C = 5) (Mallik et al., Reference Mallik, Odom, Gao, Gomez, Chen and Wang2019; Peters et al., Reference Peters, Buckley, Statham, Pidsley, Samaras, V Lord and Molloy2015). Significant DMRs were identified based on the cutoff of Stouffer P-value ≤0.05, absolute mean Δβ value ≥0.05, and the number of probes in region ≥7. The GRCh38/hg38 reference genome was used to represent the position of each DMP and DMR.
Neuroimaging–epigenetic analysis
First, one-way analysis of covariance was used to explore the differences in CTs in 76 cortical gyri of the bilateral hemispheres between patients with BD and HCs. Age, sex, total intracranial cavity volume (TICV), and years of education were controlled as covariates. Second, we performed correlation analyses between significant DMPs from the EWAS and CTs for the 76 cortical gyri to investigate brain structural correlates of epigenetic signatures in the BD and HC groups. Pearson’s partial correlation analysis was conducted to explore significant relationships between CTs and the DNA methylation levels of DMPs (Han et al., Reference Han, Choi, Kim, Kang, Kang, Tae and Ham2022). In the BD group, age, sex, years of education, TICV, HDRS score, YMRS score, and illness duration were considered as covariates; age, sex, years of education, and TICV were considered as covariates in the HC group. The Benjamini–Hochberg approach was equally applied for both analyses (FDR ≤ 0.05).
Copy number analysis in patients with BD
To identify CNAs in BD, the circular binary segmentation algorithm in the ChAMP R package was used, with HCs as the reference (Olshen, Venkatraman, Lucito, & Wigler, Reference Olshen, Venkatraman, Lucito and Wigler2004; Tian et al., Reference Tian, Morris, Webster, Yang, Beck, Feber and Teschendorff2017). Frequently recurring focal alterations were identified using the Genomic Identification of Significant Targets in Cancer (GISTIC) 2.0 algorithm (Mermel et al., Reference Mermel, Schumacher, Hill, Meyerson, Beroukhim and Getz2011). Significant focal amplifications and deletions were defined using the |copy number| ≥ 0.5 and FDR ≤ 1.0×10⁻³ cutoffs. Genomic positions of all focal alterations are represented based on the GRCh38/hg38 reference genome.
Gene ontology and pathway enrichment analysis
To gain insights into the relevant biological functions, Gene ontology (GO) and Kyoto Encyclopedia of Genes and Genomes (KEGG) pathway enrichment analyses were performed using the GOmeth algorithm (Maksimovic, Oshlack, & Phipson, Reference Maksimovic, Oshlack and Phipson2021; Phipson, Maksimovic, & Oshlack, Reference Phipson, Maksimovic and Oshlack2016). Both functional enrichment analyses were conducted for significant DMPs (FDR ≤ 0.05 and |Δβ| ≥ 0.07). Significantly enriched GO terms and KEGG pathways were identified using the unadjusted P-value ≤ 0.05 and minimum number of genes associated with DMPs ≥ 2 cutoffs.
Co-methylation analysis
Given that the primary neuroimaging–epigenetic analyses identified significant CT–methylation associations in the right postcentral gyrus and right pars triangularis, we conducted weighted gene co-methylation network analysis (WGCNA) as an exploratory follow-up to further characterize coordinated methylation patterns and to identify potential hub CpG sites related to regional CT. Specifically, to expand upon the findings of neuroimaging–epigenetic analysis and to further investigate potential CpG sites, we explored key co-methylation modules that have significant correlations with the CTs of the right postcentral gyri and pars triangularis using the WGCNA R package (P-value ≤ 2.78×10⁻³) (Supplementary method 8) (Langfelder & Horvath, Reference Langfelder and Horvath2008). Hub CpG sites were identified based on the criteria of | module membership | ≥0.9 and | gene significance | ≥0.3 for the key module. Functional enrichment analysis for the CpG sites in the key modules was conducted using the same method as described above. R version 4.2.3 was used for all statistical analyses.
Results
Differential methylation analysis results
The sociodemographic and clinical characteristics of participants (90 patients with BD and 161 HCs) who satisfied the study criteria are listed in Table 1. Age, HDRS scores, and years of education differed significantly between the two groups. The methylation levels of 729,166 probes, excluding those that did not meet the inclusion criteria, were included in the downstream analysis.
Demographic and clinical characteristics of patients with BD and HCs

Note: BD, bipolar disorder; HC, healthy control; SD, standard deviation; HDRS-17, 17-item Hamilton Depression Rating Scale; YMRS, Young Mania Rating Scale; SSRI, selective serotonin reuptake inhibitor; SNRI, serotonin and norepinephrine reuptake inhibitor; NDRI, norepinephrine-dopamine reuptake inhibitor; NaSSA, noradrenergic and specific serotonergic antidepressant; Combination of AD, combinations of two or more types of antidepressant; APs, antipsychotics; ADs, antidepressants; Li, lithium; AED, antiepileptic mood stabilizer; Combination of AEDs, combinations of two or more types of antiepileptic mood stabilizer; Combination of APs, combinations of two or more types of antipsychotics.
a P-values for comparisons of age, education years, and HDRS scores were obtained using an independent t-test.
b P-values for the distribution of sex were obtained using a chi-squared test.
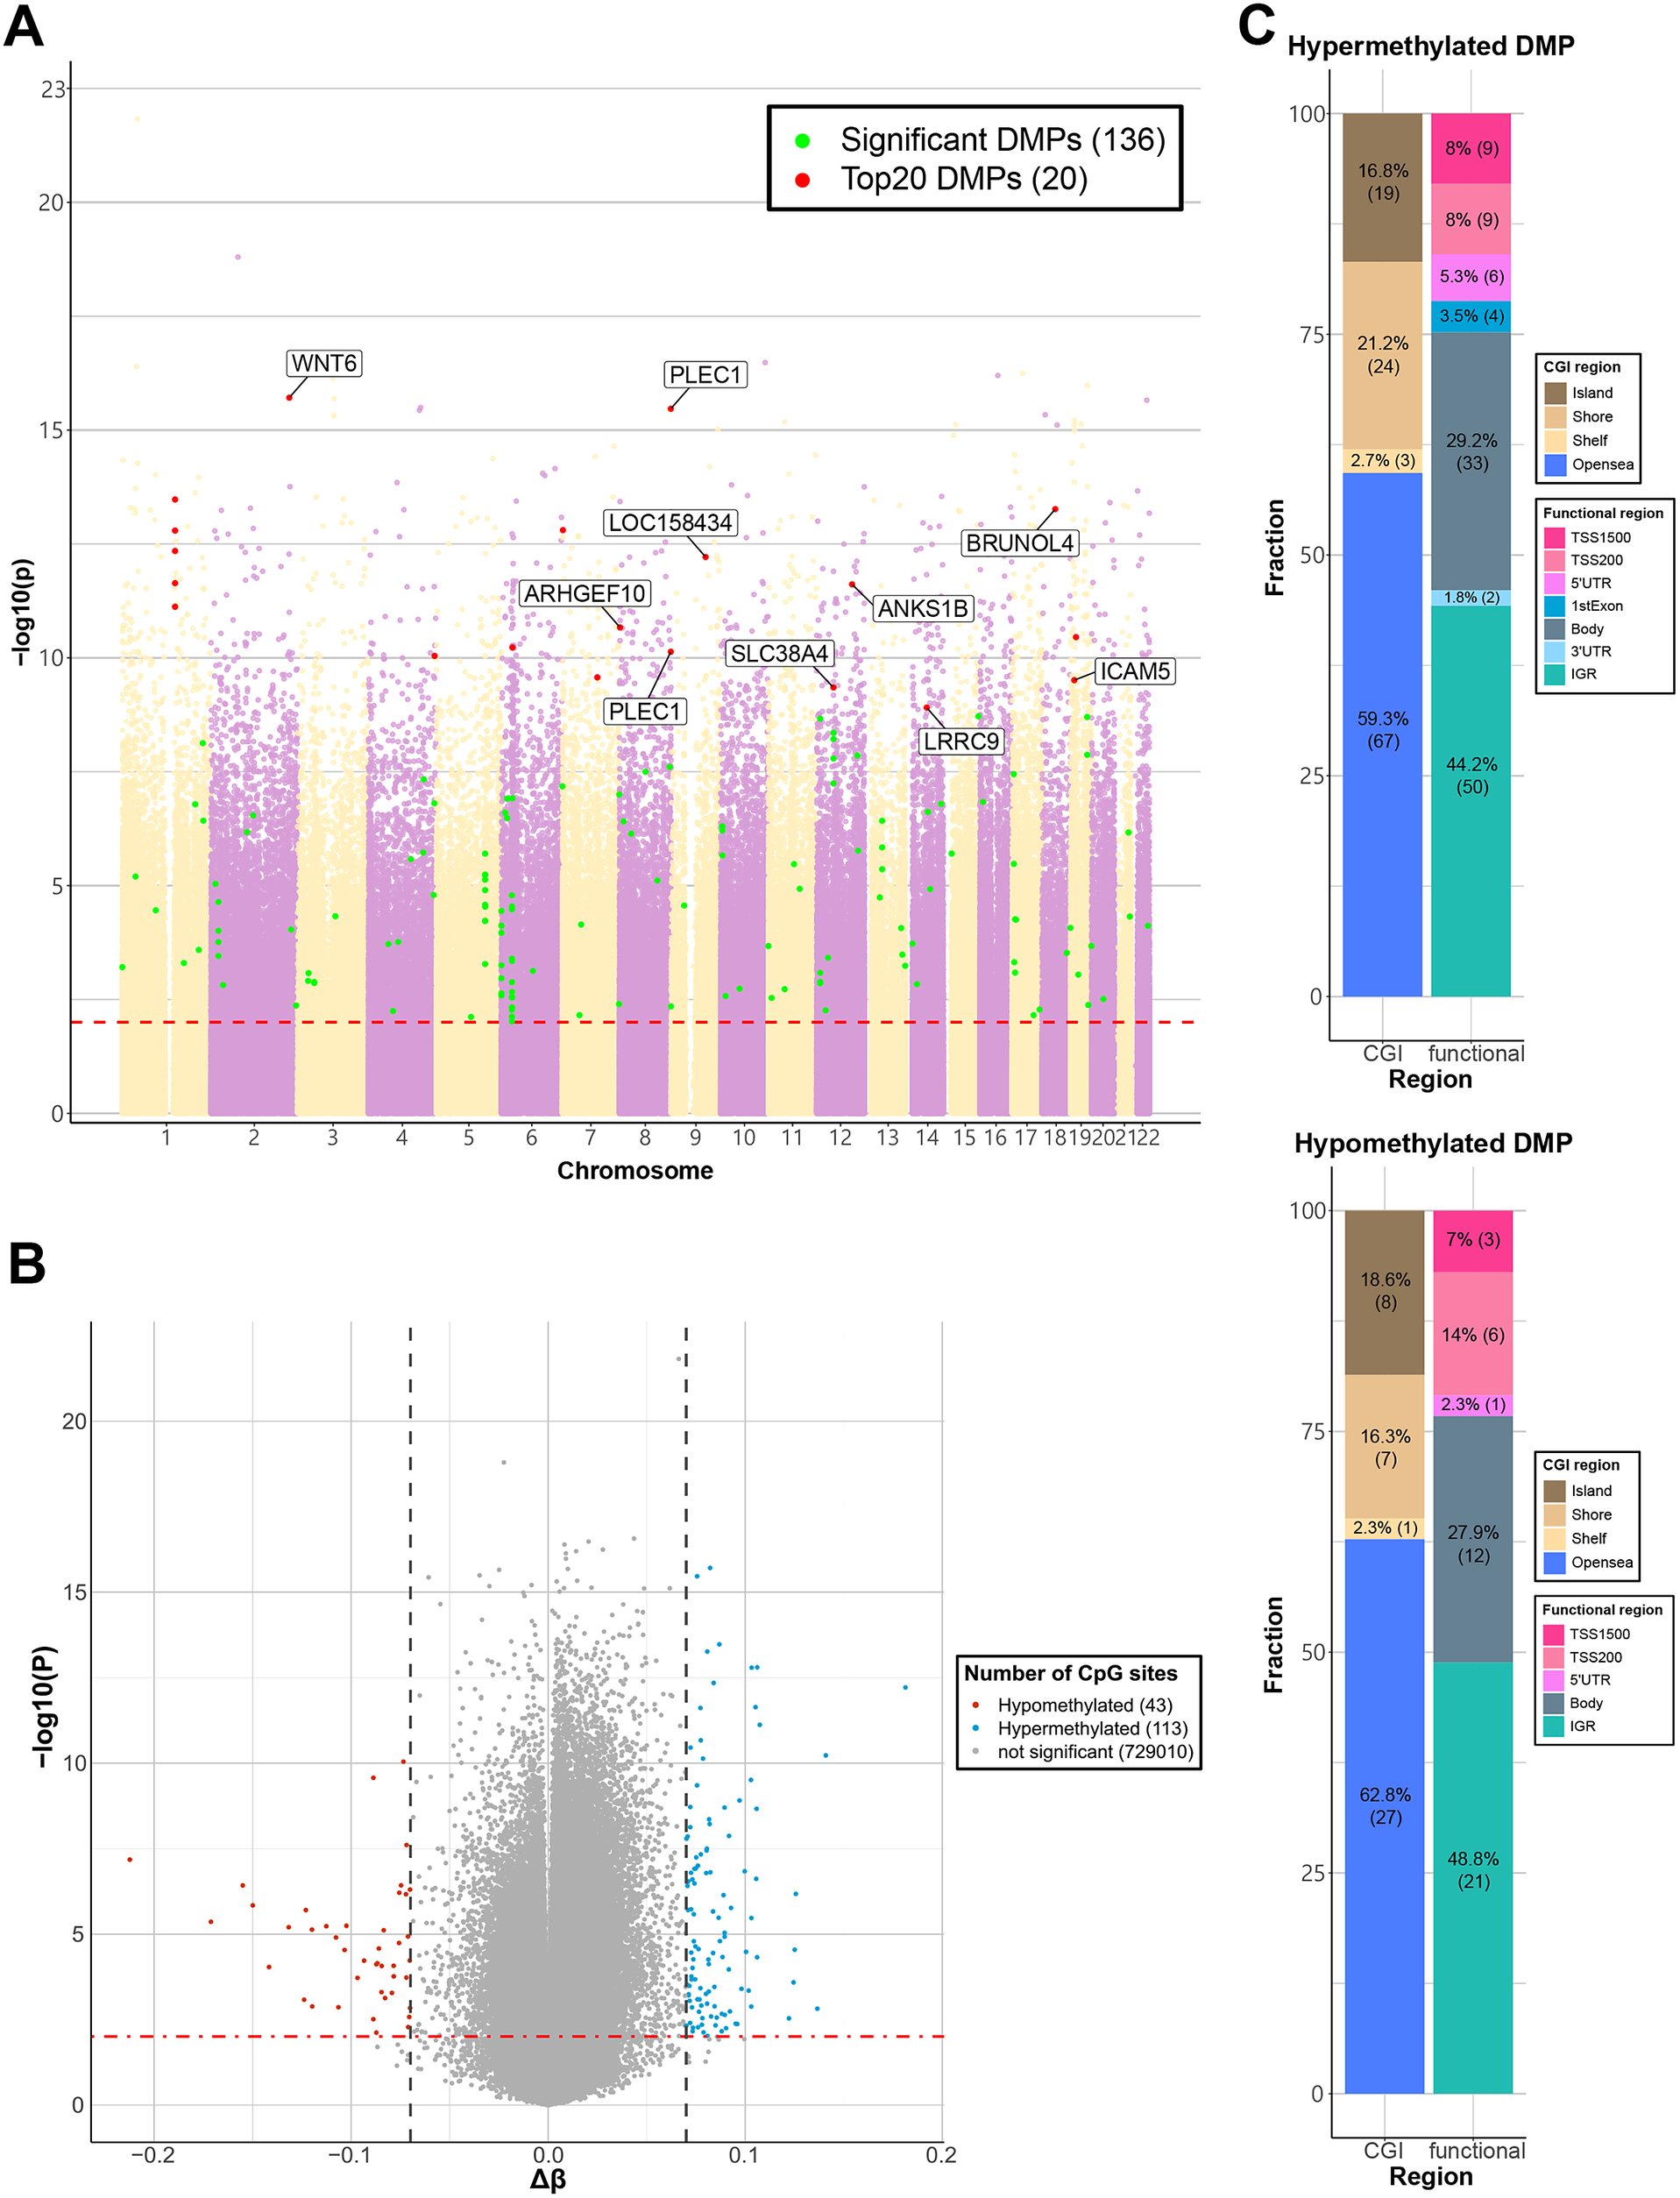
A total of 156 CpG sites were identified as significant DMPs in the EWAS comparing the BD and HC groups (Supplementary Table S1) (FDR ≤ 0.05, |Δβ| ≥ 0.07). The top-ranked DMPs included cg13903421 (WNT6), cg04255391 (PLEC1), cg13392957 (intergenic region), and cg03356492 (BRUNOL4). The top 20 DMPs are listed in Table 2 and highlighted in Figure 1a. Of the 156 DMPs, 113 were hypermethylated, and 43 were hypomethylated (Figure 1b). The fractions of genomic regions with hypermethylated and hypomethylated DMPs are shown in Figure 1c. Epigenetic variation at CpG sites located in gene bodies and promoters can affect transcription (Wang et al., Reference Wang, Xiong, Wu, Liu, Chen, Wang and Chen2022). The high proportion of DMPs in gene promoters and gene bodies (55.8% of hypermethylated and 51.2% of hypomethylated DMPs) suggests that the transcription of genes associated with these DMPs is altered in patients with BD (Figure 1c).
Top 20 DMPs obtained from EWAS

Note: DMP, differentially methylated probe; BD, bipolar disorder; HC, healthy control; Δβ, the average β value of patients with BD minus the average β value of HCs; CGI, CpG island; CHR, chromosome.
a The Benjamini–Hochberg (BH) approach was used (FDR≤0.05).
b UCSC GRCh38/hg38.
c CpGs located in functional genomic regions, TSS1500, 200–1500 bases upstream of the transcriptional start site; TSS200, 0–200 bases upstream of the transcriptional start site; Body, region between the ATG and stop codons; 3′UTR, region between the stop codon and the poly A signal; IGR, intergenic region.
d CpGs located in CpG islands, Shelf, 2–4 kb from a CpG island; Shore, 0–2 kb from a CpG island; OpenSea, >4 kb from a CpG island; Island, CpG island.
Visualization of EWAS results for the BD and HC groups. (a) Manhattan plot of EWAS results. The x-axis shows chromosomes using two different colors, while the y-axis shows −log10(P-value). The horizontal dashed red line indicates the Benjamini–Hochberg corrected P-value of 0.05 (FDR ≤ 0.05). The top 20 significant DMPs are represented as red dots, and the gene names associated with each CpG site are labeled. The remaining DMPs are represented as green dots. (b) Volcano plot of EWAS result. The Δβ and −log10(P-value) are shown on the x-axis and y-axis, respectively. The horizontal dot-dashed line indicates the Benjamini–Hochberg corrected P-value of 0.05 (FDR≤0.05). The vertical dashed dark gray lines indicate an absolute Δβ value of 0.07. Blue dots represent hypermethylated DMPs, and red dots represent hypomethylated DMPs, while gray dots represent non-significant probes. (c) Stacked box plot of 156 DMPs (FDR ≤ 0.05, |Δβ| ≥ 0.07). The percentage of functional and CGI regions for hypermethylated (top) and hypomethylated (bottom) DMPs are illustrated.
Differential methylation analysis at the region level identified 7 DMRs considering sex and age as covariates (Supplementary Table S2). The most significant DMR consisted of 12 CpG sites and was located between 1500 bases upstream of the transcriptional start site (TSS1500) and the first exon of the SLC38A4 gene (Stouffer P-value = 6.54 × 10−51; mean Δβ = 0.054).
Functional enrichment analysis
Functional enrichment analysis of the 156 DMPs identified by the EWAS showed that the genes associated with them are enriched in 86 GO terms, comprising 62 biological processes, 17 cellular components, seven molecular functions, and one pathway (Supplementary Table S3). However, after controlling for multiple testing errors, no ontology terms or pathways remained significant (FDR ≤ 0.05).
Identification of significant CNAs
Fifteen focal amplifications and fourteen focal deletions were identified using the GISTIC algorithm to detect frequently recurring focal CNAs (Supplementary Figure S2). The recurrent focal amplifications identified in patients with BD included human leukocyte antigen (HLA)-related regions (6p21.33, 6p22.1, 6p21.32), 8p23.1, and 1p13.3. With regard to focal deletions, 8p23.1, 1q31.3, and 16p12.2 were identified as the most frequently recurring regions (Supplementary Table S4).
CT alterations in BD
Brain MRI data from 82 of the 90 patients with BD and 154 of the 161 HCs were used to identify changes in CT in 76 brain regions (Supplementary Table S5). After adjusting for age, sex, TICV, and years of education, consistent CT thinning was observed in 49 cortical regions in patients with BD compared to that in HCs (FDR ≤ 0.05). Brain regions associated with the prefrontal cortex, such as the frontomarginal, transverse frontopolar, and straight gyri, were identified as those with the most significant thinning. Regions in the somatosensory cortex (e.g. the postcentral gyrus) showed a significant decrease in CT (Supplementary Table S6). None of the cortical regions showed significant thickening in the BD group compared to that in the HC group (Supplementary Table S6).
Neuroimaging–epigenetic analysis
Pearson’s partial correlation analysis was used to assess the relationships between brain structural variations and epigenetic variations, specifically the CTs of 76 brain regions and methylation levels of 156 DMPs associated with BD. We identified correlations between the CT of the right postcentral gyrus and the methylation levels of 12 DMPs (cg06536614, cg11608150, cg26896946, cg25340688, cg00124993, cg06478886, cg04481923, cg08745965, cg18678645, cg18797653, cg04255391, and cg10604476) and between the CT of the right pars triangularis (inferior frontal gyrus) and the methylation level of one DMP (cg20581874) (Table 3). None of these relationships were statistically significant in the HC group (Figure 2). According to the UCSC CpG island annotations, 10 of the 12 DMPs that correlated with the right postcentral gyrus CT are located near a CpG island in the upstream region of the miR886 gene (chr5:136,080,515–136,080,786).
Neuroimaging–epigenetic analysis in patients with BD

Note: BD, bipolar disorder; HC, healthy control; Δβ, the average β value of patients with BD minus the average beta value of HCs; FDR, false discovery rate; R, right hemisphere; CHR, chromosome.
a CpGs locate in functional genomic regions, TSS1500, 200–1500 bases upstream of the transcriptional start site; TSS200, 0–200 bases upstream of the transcriptional start site; Body, between the ATG and stop codon; IGR, intergenic region.
b UCSC GRCh38/hg38.
c the Benjamini–Hochberg (BH) approach was used (FDR ≤ 0.05).
Scatterplots and a brain image of neuroimaging–epigenetic analysis. Each scatterplot represents a significant correlation between the methylation level of CpG sites ((a) cg06536614, (b) cg11608150, (c) cg26896946, (d) cg25340688, (e) cg00124993, (f) cg06478886, (g) cg04481923, (h) cg08745965, (i) cg18678645, (j) cg18797653, (k) cg04255391, (l) cg10604476, and (m) cg20581874) and the cortical thickness of brain regions in patients with BD. The x-axis shows the methylation level of a CpG site, while the y-axis shows the cortical thickness of a brain region. Dots represent patients with BD (red) and HCs (gray), and lines represent the correlation between the methylation level of CpG sites and the cortical thickness of brain regions. The brain image represents cortical regions, based on the Destrieux atlas, that showed a significant correlation with the methylation levels of 13 DMPs in the neuroimaging–epigenetic analysis. The scatterplots of the corresponding cortical regions are denoted by letters ((a)–(l) right postcentral gyrus, (m) right pars triangularis).

Co-methylation analysis
Finally, we examined the co-methylation effects of the 13 DMPs identified using the neuroimaging–epigenetic analysis. A total of 11,677 CpG sites were included to estimate co-methylation effects (FDR ≤ 0.05 and |Δβ| ≥ 0.02). Eighteen modules were identified after merging similar modules (Supplementary Figure S3a). Of these, the MEs of four modules were observed to be correlated with the CTs of the right postcentral gyrus and right pars triangularis (P-value ≤ 2.78 × 10⁻³) (Supplementary Figure S3b). Of the 13 DMPs, 10 DMPs associated with the CpG island in the upstream region of the miR886 gene were included in the 12 hub CpG sites of the lightgreen module (Supplementary Figure S3c; Supplementary Table S7). Additionally, the lightgreen module did not show significant correlations with any of the following variables: two batch effects (slide and array); eight clinical measurements (age, sex, years of education, illness duration, HDRS score, YMRS score, remission status, and TICV); and the CTs of 75 brain regions (data not shown). Genes linked to CpG sites in the lightgreen module were annotated with gene sets related to neuronal apoptosis and synaptic transmission (Supplementary Table S8).
Discussion
This study provides the first comprehensive analysis to identify BD-specific epigenetic variations and their correlations with structural changes in the brain. Using strict criteria, we identified 156 DMPs and seven DMRs associated with either muscle hypertrophy or neuronal structure and function. Among them, 13 DMPs were significantly correlated with the CTs of the right postcentral gyrus and pars triangularis in patients with BD. These findings contribute significantly to a deeper understanding of the pathophysiology of BD and highlight genes that warrant further analysis.
Among the top 20 DMPs, the most significant CpG site was associated with the WNT6 gene, which encodes a hydrophobic glycoprotein belonging to the Wingless/integrase 1 (WNT) family (Yuan et al., Reference Yuan, Regel, Lian, Friedrich, Hitkova, Hofheinz and Burgermeister2013). WNT signaling is known to play a crucial role in the development, function, and structure of the central nervous system and is associated with BD, schizophrenia, and Alzheimer’s disease (AD) (Berwick & Harvey, Reference Berwick and Harvey2014; Folke, Pakkenberg, & Brudek, Reference Folke, Pakkenberg and Brudek2019; Hoseth et al., Reference Hoseth, Krull, Dieset, Mørch, Hope, Gardsjord and Ueland2018; Inestrosa & Arenas, Reference Inestrosa and Arenas2010). A CpG site associated with the PLEC1 gene showed a positive correlation with the right postcentral gyrus CT. This gene encodes plectin, a well-known cytoskeletal linker protein that is abundant in the brain, muscles, and epithelial cells. Changes in plectin expression are known to negatively impact the structure and function of the blood–brain barrier and the pial surface (Errante, Wiche, & Shaw, Reference Errante, Wiche and Shaw1994; Lie et al., Reference Lie, Schröder, Blümcke, Magin, Wiestler and Elger1998). Martins-de-Souza et al. have reported increased plectin expression in the brains of patients with schizophrenia (Martins-de-Souza et al., Reference Martins-de-Souza, Gattaz, Schmitt, Rewerts, Maccarrone, Dias-Neto and Turck2009). Thus, our results suggest that epigenetic variation in the PLEC1 gene may mediate structural changes in the brains of patients with BD. The BRUNOL4 gene, also known as CELF4, is abundantly expressed in the brain and plays a significant role in alternative splicing (Cahoy et al., Reference Cahoy, Emery, Kaushal, Foo, Zamanian, Christopherson and Barres2008). Salamon et al. have reported that the target mRNA of the BRUNOL4 gene is associated with genes that affect neurodevelopmental processes negatively (Salamon et al., Reference Salamon, Park, Miškić, Kopić, Matteson, Page and Rasin2023). Additionally, the BRUNOL4 gene has been reported to be associated with seizures and autism spectrum disorder (Gilling et al., Reference Gilling, Lauritsen, Møller, Henriksen, Vicente, Oliveira, Cintin, Eiberg, Andersen, Mors, Rosenberg, Brøndum-Nielsen, Cotterill, Lundsteen, Ropers, Ullmann, Bache, Tümer and Tommerup2008; Halgren et al., Reference Halgren, Bache, Bak, Myatt, Anderson, Brøndum-Nielsen and Tommerup2012). The SLC38A4 gene, which was associated with the most significant DMR, encodes a sodium-dependent neutral amino acid transporter belonging to the solute carrier (SLC) protein family. The instability of SLC proteins is known to be associated with various psychiatric and neurodegenerative disorders (e.g. depression, post-traumatic stress disorder [PTSD], Parkinson’s disease, and AD) (Aykac & Sehirli, Reference Aykac and Sehirli2020). In summary, epigenetic variations in these genes could play a crucial role in the pathophysiology of BD.
The functional enrichment analysis revealed biological processes related to neuronal structure and function (e.g. ‘regulation of delayed rectifier potassium channel activity’, ‘myelination in peripheral nervous system’, ‘regulation of Arp2/3 complex-mediated actin nucleation’, and ‘peripheral nervous system axon ensheathment’), and muscle hypertrophy (e.g. ‘regulation of muscle adaptation’, and ‘positive regulation of cardiac muscle hypertrophy’). Dysfunction of neural circuits and myelination is associated with psychiatric disorders, including BD and schizophrenia (Kim et al., Reference Kim, Racz, Wang, Burianek, Weinberg, Yasuda and Soderling2013; Stern et al., Reference Stern, Sarkar, Galor, Stern, Mei, Stern and Gage2020; Valdés-Tovar et al., Reference Valdés-Tovar, Rodríguez-Ramírez, Rodríguez-Cárdenas, Sotelo-Ramírez, Camarena, Sanabrais-Jiménez and López-Riquelme2022). Additionally, retinol metabolism has been identified as an important pathway that causes psychiatric side effects (Bremner, Shearer, & McCaffery, Reference Bremner, Shearer and McCaffery2012). Excessive exposure to vitamin A, which exists in retinoic acid, can result in various neurological and psychological symptoms, including depression, fatigue, irritability, and decreased interest (Bremner & McCaffery, Reference Bremner and McCaffery2008).
The CNA analysis identified 15 focal amplifications and 14 focal deletions. We observed recurrent focal amplifications and deletions in the HLA region (6p21.33, 6p22.1, and 6p21.32), which contains genes associated with immune responses. Moreover, genes in the HLA region play important roles in synaptic development and plasticity (Elmer & McAllister, Reference Elmer and McAllister2012; Huh et al., Reference Huh, Boulanger, Du, Riquelme, Brotz and Shatz2000). The 1p13.3 focal amplification region contains the glutathione S-transferase family (GSTM1, GSTM2, GSTM5), which is involved in the synthesis of glutathione and protection against oxidative stress (Do et al., Reference Do, Cabungcal, Frank, Steullet and Cuenod2009). These genes have been reported to be associated with schizophrenia, PTSD, and BD (Chaumette et al., Reference Chaumette, Kebir, Pouch, Ducos, Selimi and Krebs2019; Rezaei, Saadat, & Saadat, Reference Rezaei, Saadat and Saadat2012; Tylee et al., Reference Tylee, Chandler, Nievergelt, Liu, Pazol, Woelk and Tsuang2015). Overlapping focal amplification and deletion regions were observed at 8p23.1, which contains the FLJ10661 gene and is known to be part of a potential neuropsychiatric hub (Tabarés-Seisdedos & Rubenstein, Reference Tabarés-Seisdedos and Rubenstein2009). Duplication and deletion syndromes involving this region share several common phenotypes (e.g. developmental delays and heart defects) (Barber et al., Reference Barber, Bunyan, Curtis, Robinson, Morlot, Dermitzel and Maloney2010; Montenegro et al., Reference Montenegro, Camilotti, Quaio, Gasparini, Zanardo, Rangel-Santos and Kulikowski2023). Thus, the functions associated with this region should be investigated further.
We observed a significant reduction in CT across a broad area of the prefrontal cortex in patients with BD (e.g. the frontomarginal, transverse frontopolar, straight, and superior and middle frontal gyri). Consistent with previous findings, we observed evidence of a strong association between structural variations in the prefrontal cortex and the pathophysiology of BD; thinning of the somatosensory cortex, including the postcentral gyrus, was observed (Foland-Ross et al., Reference Foland-Ross, Thompson, Sugar, Madsen, Shen, Penfold and Altshuler2011; Hanford et al., Reference Hanford, Nazarov, Hall and Sassi2016; Lyoo et al., Reference Lyoo, Sung, Dager, Friedman, Lee, Kim and Renshaw2006). The postcentral gyrus processes sensory information from the body and senses internal bodily responses to emotional contexts and is known to be deeply involved in the recognition of facial emotions, affective-related activity, and emotion processing (Chen et al., Reference Chen, Babiloni, Ferretti, Perrucci, Romani, Rossini and Del Gratta2008; Minuzzi et al., Reference Minuzzi, Syan, Smith, Hall, Hall and Frey2018). A recent structural neuroimaging study by the ENIGMA Consortium using data from 2,447 patients with BD and 4,056 HCs reported significant cortical thinning in the bilateral postcentral gyri in patients with BD compared to HCs (Hibar et al., Reference Hibar, Westlye, Doan, Jahanshad, Cheung, Ching and Andreassen2018). Several studies have reported functional connectivity changes in the postcentral gyrus in BD, and a recent large-scale meta-analysis of resting-state functional MRI data from 1842 patients with BD and 2190 HCs observed that the BD group showed significantly decreased functional activity in the left postcentral gyrus compared with the HC group (G. Chen et al., Reference Chen, Wang, Gong, Qi, Fu, Tang and Wang2022; Liu et al., Reference Liu, Li, Li, Wang, Tie, Wu and Wang2012; Minuzzi et al., Reference Minuzzi, Syan, Smith, Hall, Hall and Frey2018). Investigating the associations between these brain regions and epigenetic loci could provide new insights into the complex pathophysiology of BD.
We identified significant correlations between the methylation levels of 13 DMPs associated with three genes (miR886, ICAM5, and PLEC1) and the CTs of the right postcentral gyrus and pars triangularis. Then, 10 of the 13 DMPs were linked to the miR886 gene and exhibited a negative correlation with the CT of the right postcentral gyrus. Mechanistically, the nc886/miR886 (vtRNA2-1) locus emerging from our analysis may influence CT by modulating intracellular stress signaling and synaptic integrity. nc886 encodes a small vault RNA that negatively regulates the protein kinase R (PKR) pathway, an important mediator of the cellular stress response (Calderon & Conn, Reference Calderon and Conn2017). When nc886 is expressed, it binds to PKR and prevents aberrant kinase activation (Calderon & Conn, Reference Calderon and Conn2017). Hypermethylation of the nc886 promoter in BD (as observed in our data) likely silences this regulatory RNA, leading to disinhibition of PKR activity. Elevated PKR, in turn, phosphorylates eIF2α and broadly reduces protein synthesis in neurons (Calderon & Conn, Reference Calderon and Conn2017), including the synthesis of proteins crucial for dendritic maintenance and synaptic plasticity. Consistent with this model, mice lacking PKR exhibit enhanced synaptic plasticity and memory, whereas PKR overactivation impairs synaptic function (Gal-Ben-Ari, Barrera, Ehrlich, & Rosenblum, Reference Gal-Ben-Ari, Barrera, Ehrlich and Rosenblum2018; Zhu et al., Reference Zhu, Huang, Kalikulov, Yoo, Placzek, Stoica and Costa-Mattioli2011). Chronic PKR activation can also trigger proapoptotic pathways and neuroinflammation (Lee, Kunkeaw, & Lee, Reference Lee, Kunkeaw and Lee2020). Therefore, in the brains of patients with BD, nc886 silencing could lead to excess PKR-mediated signaling, driving subtle neuronal loss, synaptic regression, and cortical thinning in regions like the postcentral gyrus. Supporting this, our co-methylation module analysis identified nc886-associated CpGs alongside genes involved in neuronal apoptosis and synaptic transmission, suggesting a convergent effect on these neurobiological processes. Furthermore, nc886 resides in a uniquely ‘tunable’ imprinted region subject to epigenetic polymorphism (Carpenter et al., Reference Carpenter, Zhou, Madaj, DeWitt, Ross, Grønbæk and Jones2018; Romanelli et al., Reference Romanelli, Nakabayashi, Vizoso, Moran, Iglesias-Platas, Sugahara and Monk2014). The nc886 allele from the mother is often methylated and inactive in the majority of individuals (Romanelli et al., Reference Romanelli, Nakabayashi, Vizoso, Moran, Iglesias-Platas, Sugahara and Monk2014), and importantly, this imprinting status can be influenced by maternal environment and can persist through development (Carpenter et al., Reference Carpenter, Zhou, Madaj, DeWitt, Ross, Grønbæk and Jones2018). Such heritable epigenetic variability in nc886 might help explain why only the BD group (and not HCs) showed a methylation–CT correlation in our study – the effect may manifest primarily against a background of other risk factors or inherited epigenetic marks in BD. In summary, we propose that nc886 methylation may contribute to cortical thinning in BD by releasing PKR-driven stress pathways that impair synaptic maintenance and promote inflammation/apoptosis, as well as by reflecting a familial epigenetic predisposition (through its imprinting mechanism) that makes the BD brain more susceptible to these effects. This hypothesis offers a testable neurobiological context for our finding of an association between miR886 methylation and cortical structure in BD.
DMP associated with the ICAM5 gene showed a positive correlation with the right postcentral gyrus CT. The ICAM5 gene is highly expressed in neurons, and its proper expression is crucial for synapse formation and immune responses (Matsuno et al., Reference Matsuno, Okabe, Mishina, Yanagida, Mori and Yoshihara2006; Mori et al., Reference Mori, Fujita, Watanabe, Obata and Hayaishi1987; Ning et al., Reference Ning, Tian, Smirnov, Vihinen, Llano, Vick and Gahmberg2013; Tian et al., Reference Tian, Lappalainen, Autero, Hänninen, Rauvala and Gahmberg2008). Studies using postmortem brain tissue have consistently confirmed an association between the development of BD and chronic, low-grade brain inflammation (Giridharan et al., Reference Giridharan, Sayana, Pinjari, Ahmad, da Rosa, Quevedo and Barichello2020). Thus, the ICAM5 gene could mediate the pathophysiology of BD and brain immune responses. The PLEC1 gene was discussed above because the same significant CpG site (cg04255391) was identified in both the DMP and neuroimaging–epigenetic analyses.
Of the 18 modules identified through co-methylation analysis, the lightgreen module showed a negative correlation with the CT of the right postcentral gyrus and contains 12 hub CpG sites associated with the upstream CpG island of the miR886 gene. Moreover, the lightgreen module was observed to be significantly enriched in genes associated with neuronal apoptosis and synaptic transmission (GRIK2, VPS54, VAMP2, and DLGAP2). These genes, along with the miR886 gene, could therefore be potential candidate genes relevant to structural alterations in the brains of patients with BD.
This study has several limitations. First, the potential effects of participants’ psychotropic medications on DNA methylation and brain structure must be considered, as prior work indicates that such drugs can induce epigenetic alterations and neuroanatomical changes (Chopra et al., Reference Chopra, Fornito, Francey, O’Donoghue, Cropley, Nelson and McGorry2021; Dubath et al., Reference Dubath, Porcu, Delacrétaz, Grosu, Laaboub, Piras and Eap2024). Second, the sample size of our EWAS is relatively modest, which reduces statistical power and likely captures only a fraction of the true differential methylation signals (Hesam-Shariati et al., Reference Hesam-Shariati, Overs, Roberts, Toma, Watkeys, Green and Fullerton2022; Mirza et al., Reference Mirza, Lima, Del Favero-Campbell, Rubinstein, Topolski, Cabrera-Mendoza and Fries2024; Mullins et al., Reference Mullins, Forstner, O’Connell, Coombes, Coleman, Qiao and Andreassen2021). As with many EWASs, replication in larger independent cohorts is needed to confirm these findings. Third, we were unable to account for all possible confounders or perform detailed subgroup analyses. Unmeasured factors – including family history of psychiatric illness, sex-specific differences, comorbid conditions, and environmental influences such as lifestyle or stress exposures – may have affected DNA methylation and brain outcomes in ways we could not assess (Hesam-Shariati et al., Reference Hesam-Shariati, Overs, Roberts, Toma, Watkeys, Green and Fullerton2022; Hibar et al., Reference Hibar, Westlye, Doan, Jahanshad, Cheung, Ching and Andreassen2018; Mirza et al., Reference Mirza, Lima, Del Favero-Campbell, Rubinstein, Topolski, Cabrera-Mendoza and Fries2024). Fourth, by enrolling only patients in euthymic or depressive states and excluding those in manic or hypomanic episodes, our findings may not generalize across the full spectrum of BP. In addition, structural MRI acquisition during (hypo)mania is often practically challenging and more susceptible to motion-related artifacts, which can bias CT/volume estimates (Reuter et al., Reference Reuter, Tisdall, Qureshi, Buckner, van der Kouwe and Fischl2015). State-dependent neurobiological and epigenetic dynamics characteristic of (hypo)manic phases may yield different methylation profiles or brain-structure associations, and their omission limits the breadth of our conclusions (Abé et al., Reference Abé, Ekman, Sellgren, Petrovic, Ingvar and Landén2015; Choi et al., Reference Choi, Han, Kim, Kang, Kang, Tae and Ham2022; Ludwig & Dwivedi, Reference Ludwig and Dwivedi2016). These limitations highlight the need for cautious interpretation of our results and should be addressed in future studies.
In summary, we applied the first neuroimaging–epigenetic analysis in an EWAS to identify novel epigenetic loci associated with structural changes in the brain in BD. The EWAS identified 156 DMPs associated with neuronal structure and function, and muscle hypertrophy. The neuroimaging–epigenetic analysis revealed 13 DMPs associated with the right postcentral gyrus and pars triangularis CT in patients with BD. Strong correlations were observed between the right postcentral gyrus CT and 10 DMPs associated with a CpG island in the upstream region of the miR886 gene, suggesting that epigenetic changes might play an important role in brain structural changes in patients with BD. Our findings provide deep insights into the pathophysiological mechanisms of BD. Future studies aiming to explore the molecular interactions associated with DMPs using comprehensive omics data will help to identify effective therapeutic targets for BD.
Note: BD, ‘bipolar disorder’; HC, ‘healthy control’; Δβ, ‘the average β value of patients with BD minus the average β value of HCs’; DMP, ‘differentially methylated probe’; FDR, ‘false discovery rate’; CGI, ‘CpG island’; TSS1500, ‘200–1500 bp upstream of the transcriptional start site’; TSS200, ‘0–200 bp upstream of the transcriptional start site’; 5′UTR, ‘between the transcriptional start site and the ATG start site’; 1stExon, ‘first exon’; Body, ‘region between the ATG and stop codons’; 3′UTR, ‘region between the stop codon and poly A signal’; IGR, ‘intergenic region’; Shelf, ‘2–4 kb from a CpG island’; Shore, ‘0–2 kb from a CpG island’; Opensea, ‘>4 kb from a CpG island’; Island, ‘CpG island’.
Note: BD, ‘bipolar disorder’; HC, ‘healthy control’; r, ‘Pearson’s partial correlation coefficient’; FDR, ‘false discovery rate’; R, ‘right hemisphere’.
Supplementary material
The supplementary material for this article can be found at http://doi.org/10.1017/S003329172610347X.
Acknowledgments
The authors are grateful to all the participants, interviewers, and technicians involved in this study.
Author contribution
BJH and MRH contributed to the study conception and design as co-corresponding authors. BJH and KMH contributed to data acquisition. BJH, MRH, HHY, KMH, WST, YK, and DS contributed to data interpretation. YK and WST contributed to the MRI data analysis. HHY and MRH performed the epigenetic analyses. BJH, MRH, and KMH contributed to funding acquisition. HHY and KMH wrote the manuscript as co-first authors. All authors contributed to drafting and approving the final version of the manuscript.
Funding statement
This work was supported by grants from the National Research Foundation of Korea (NRF) funded by the Korean government (Ministry of Science and ICT [MSIT]) (RS-2025-00523110, KMH; RS-2025-24873317, MRH; 2020M3E5D9080792, BJH; and NRF-2022R1A2C2093009, BJH), and by the Bio & Medical Technology Development Program of the NRF funded by the Korean government (MSIT) (RS-2025-02217919, KMH).
Competing interests
The authors declare no competing interests.
Ethical standard
The authors assert that all procedures contributing to this work complied with the ethical standards of the relevant national and institutional committees on human experimentation and the Declaration of Helsinki of 1975, as revised in 2008. This study was approved by the Institutional Review Board of Korea University Anam Hospital (protocol code: 2017AN0185, date of approval: June 5, 2017).


 Open access