

Introduction
Milk production losses caused by mastitis remain an economic burden for the dairy industry. During acute clinical mastitis, typically one mammary gland is affected with observably abnormal milk and the four cardinal signs of inflammation: heat, redness, edema, and pain. However, a fifth common symptom of inflammation, reduced function, can be observed in all mammary glands whether the other cardinal signs are present or absent in a particular gland. Thus, decreased milk production that develops in the mastitic gland is a local effect, i.e. it occurs in the same mammary gland, whereas decreased milk production in non-inflamed glands adjacent to the mastitic gland is a systemic effect (Mitterhuemer et al. Reference Mitterhuemer, Petzl and Krebs2010; Shangraw et al. Reference Shangraw, Rodrigues and Witzke2020; Shuster et al. Reference Shuster, Harmon and Jackson1991a). Milk composition is likewise affected in adjacent glands, although an inflamed mammary gland will typically produce less milk with a higher somatic cell count (SCC) and lower lactose concentration than those remaining non-inflamed (Shangraw et al. Reference Shangraw, Rodrigues and Witzke2020; Shuster et al. Reference Shuster, Harmon and Jackson1991b). At the transcriptional level, the local effect of mastitis in the inflamed gland is well-studied and shows a predictable immune response (Mitterhuemer et al. Reference Mitterhuemer, Petzl and Krebs2010; Shangraw et al. Reference Shangraw, Rodrigues and Choudhary2021). In contrast, little is understood of the transcriptional changes in non-inflamed glands neighboring the inflamed gland, which involve comparably fewer genes with lower magnitude changes in expression.
Our efforts to determine the mechanisms regulating mammary function in non-inflamed neighboring glands supported previous evidence that different milk components are differentially regulated. In agreement with Shuster et al. (Reference Shuster, Harmon and Jackson1991a), we found that milk fat was the earliest component affected in neighboring glands, such that fat concentrations were significantly lower in foremilk strippings from both mastitic and adjacent glands in lipopolysaccharide (LPS)-challenged cows than control glands in untreated cows 3 h after milking (Shangraw et al. Reference Shangraw, Rodrigues and Witzke2020). On the other hand, lactose concentrations declined more gradually in the adjacent gland than in the LPS-challenged gland (Shangraw et al. Reference Shangraw, Rodrigues and Witzke2020). This decline in lactose may partially explain the reduced milk yields because lactose is the major osmolyte in milk and a key driver of milk volume. However, small changes in milk fat and lactose concentrations are still poorly explained. For example, a change in lactose content could reflect decreasing secretory rates (Shuster et al. Reference Shuster, Harmon and Jackson1991b) or increasing tight junction permeability (Stelwagen et al. Reference Stelwagen, Farr and Mcfadden1999). One way to determine how milk fat, lactose, and other milk components are regulated in non-inflamed glands adjacent to an inflamed mammary gland is by studying mammary gene expression.
In our previous experiments, we identified several systemic factors that appear to play a role in regulating gene expression and reducing milk production in adjacent glands. The earliest response, 3 h after an immune challenge, implicated pro-inflammatory cytokines as mediators of the effects on adjacent glands. Pro-inflammatory cytokines, such as tumor necrosis factor alpha (TNFα) and IL-1β, are reported to affect the expression of genes in the lactose synthesis pathway and induce degradation of glucose transporters (Kobayashi et al. Reference Kobayashi, Kuki and Oyama2016). By 12 h, additional gene signatures in our previous study suggested that glucocorticoids and oxidative stress could also be involved in the reduced milk yields (Shangraw et al. Reference Shangraw, Rodrigues and Choudhary2021). Both of these mediators are immunomodulatory and could influence lactation; however, it remains debatable whether these observed changes in gene expression are the direct effect of systemic mediators on secretory tissue or the result of an influx of activated immune cells to all glands (Mitterhuemer et al. Reference Mitterhuemer, Petzl and Krebs2010). To our knowledge, there have been no investigations involving LPS-induced mastitis challenge that assessed gene expression in the adjacent mammary glands earlier than 3 h and prior to changes in milk composition. Thus, to obtain a more detailed timeline of early events without invasive sampling that could alter responses, we decided to isolate RNA from milk fat rather than mammary tissue.
Milk fat presents a unique and noninvasive source of RNA for studying mammary gene expression. Secreted milk fat globules from the mammary epithelial cells (MECs) often contain a cytoplasmic crescent formed when the membrane is pinched off and released from the cell. These milk fat globules contain RNA that is representative of the MEC transcriptome in healthy goats (Brenaut et al. Reference Brenaut, Bangera and Bevilacqua2012), cows (Cánovas et al. Reference Cánovas, Rincón and Bevilacqua2014), and water buffaloes (Sharma et al. Reference Sharma, Girdhar and Kaur2018). Moreover, milk fat RNA can be compared against the milk it was isolated from, allowing subsequent analyses to be examined in the context of simultaneous changes in milk yield and composition, including potential effects of infiltrating immune cells (Brenaut et al. Reference Brenaut, Lefèvre and Rau2014). Thus, milk fat presents an opportunity for more frequent sampling of RNA without compromising mammary function in contrast to the collection of RNA from multiple mammary tissue biopsies.
The anatomical position of an individual mammary gland in relation to an inflamed gland in the udder might also affect the response of the non-inflamed gland. For example, infusing a single gland with Escherichia coli resulted in increased blood flow to both glands on the challenged side but not to the glands of the control side (Potapow et al. Reference Potapow, Sauter-Louis and Schmauder2010). Moreover, Kimura et al. (Reference Kimura, Harp and Goff2005) reported that zymosan-activated lymphocytes can migrate out of one mammary gland into blood and lymph and be subsequently recovered from a different mammary gland. Thus, increased blood flow coupled with the interchange of activated immune cells and release of proinflammatory cytokines from the inflamed gland might be expected to expose an ipsilateral mammary gland to more inflammatory mediators than those to which a contralateral gland is exposed. More broadly, incidence rates of intramammary infections and high SCC can also be correlated within cows by mammary gland position, with higher rates in rear than front quarters and in right than left quarters (Adkinson et al. Reference Adkinson, Ingawa and Blouin1993; Barkema et al. Reference Barkema, Schukken and Tjgm1997). In this way, an ipsilateral mammary gland might be more affected than a contralateral gland. If so, this would hold serious implications for assuming independence of individual mammary glands in experimental designs.
We hypothesized that genes we previously identified as being differentially expressed in mammary tissue biopsies of neighboring glands in an LPS challenge model (Shangraw et al. Reference Shangraw, Rodrigues and Witzke2020) would be differentially expressed in RNA isolated from milk fat using a similar experimental design. These genes are associated with milk synthesis, immune, and stress pathways, and may be causally involved in mediating the systemic effects under study. Alternatively, they may serve as useful biomarkers. We further hypothesized that the non-inflamed gland ipsilateral to the mastitic gland would show greater changes in milk composition and gene expression than the contralateral gland. The objectives of this experiment were to (1) determine if genes previously identified as differentially expressed in mammary tissue are similarly differentially expressed in milk fat, (2) confirm and extend the temporal response of non-inflamed glands to localized mastitis via more frequent sampling than our previous study, and (3) determine if the position of a non-inflamed gland in relation to the mastitic gland causes a different response in milk composition and gene expression.
Materials and methods
Animals
All procedures involving animals were approved by the University of Missouri Institutional Animal Care and Use Committee (Protocol #9283). Pregnant Holstein cows (n = 8) were selected based on low cow-level SCC <200,000 cells/mL. Parity ranged from one to three lactations (1.75 ± 0.25; mean ± SEM). All cows were in late lactation (297 ± 21 DIM) averaging 27.1 ± 1.6 kg milk/d. Cows were moved from free-stall housing to a shaving-bedded pack barn with free access to water and a total mixed ration formulated to meet or exceed lactational requirements. All cows were milked in the parlor twice daily at 0630 and 1830.
Design
Three days prior to the experiment, milk SCC was determined per quarter. If all quarters had an SCC <100,000 cells/mL, the mammary gland (QLPS) to be challenged with an intramammary infusion of LPS was randomly assigned. However, for three cows with a greater SCC (range: 293–583,000 cells/mL) in one quarter, QLPS was assigned to the quarter diagonal to the high SCC quarter. Mammary glands contralateral (QC), ipsilateral (QI), and diagonal (QD) to QLPS remained unchallenged (Fig. 1). Each mammary gland position (left front, left rear, right front, right rear) was selected for LPS challenge in two of the eight cows.
Example layout for mammary gland designations. One mammary gland was randomly assigned to receive an intramammary injection of 50 µg LPS (QLPS). The ipsilateral (QI), contralateral (QC), and diagonal (QD) mammary glands remained unchallenged. The gland diagonal to QLPS was not analyzed for gene expression.

Milk sampling and challenge
Total milk yields were recorded per cow the day before (d-1) and day of (d-0) the LPS challenge. On d-1, immediately after the a.m. milking (0 h), at 1, 3, and 6 h, and immediately before the p.m. milking (12 h), a strip milk sample (10–30 mL) was collected from all mammary glands for determination of milk composition. An additional 20–40 mL strip sample of foremilk was collected for isolation of RNA from milk fat from only QLPS at 1, 3, and 12 h.
On d-0, immediately after a.m. milking, a 0 h strip sample of hindmilk was collected from all mammary glands for milk composition. Then, the QLPS teat was scrubbed twice with 70% ethanol prior to inserting a sterile teat cannula and injecting 50 µg LPS (E. coli serotype O55:B5, L6529, Sigma-Aldrich) in 5 mL 0.9% saline. Injections for all cows were completed within 11 min. Strip samples of foremilk for milk composition (all quarters) and for RNA isolation (QLPS, QC, and QI) were collected at 1, 3, 6, and 12 h post-challenge. After collecting 12 h samples, cows were milked. Additional strip samples were collected from all mammary glands for milk composition immediately after p.m. milking (12.5 h) and of foremilk just prior to a.m. milking (24 h) the next day. Our milk sampling schedule was designed to optimize milk fat sampling for RNA. Differences in milk composition between fore and hindmilk have been described (Bruckmaier et al. Reference Bruckmaier, Ontsouka and Blum2004). All milk composition samples were preserved with bronopol and stored at 4°C until shipment to Mid-South Dairy Records (Springfield, MO) for determination of fat, total protein, lactose, and SCC. Rectal temperatures were taken on d-0 at 1, 3, 6, 12, and 24 h post-challenge.
Milk fat RNA isolation and extraction
Methods for RNA isolation from milk fat were adapted from Brenaut et al. (Reference Brenaut, Bangera and Bevilacqua2012). Within 5 min of collection, milk was centrifuged at 2,500 g for 15 min at 4°C to separate milk fat. Then, 4–800 mg of the cream layer was transferred into a 5-mL sterile tube containing 2 mL TRIzol solution (Invitrogen, Life Technologies, Carlsbad, CA) using a clean metal spatula, whereupon the mixture was vortexed thoroughly to disrupt and mix samples, then immediately placed on dry ice before storage at −80°C. Most fat samples from QLPS on d-0 contained stringy clumps and did not fully mix despite prolonged vortexing. Sample processing was completed within 1 h after milk collection.
Total RNA was extracted from milk fat using a two-step TRIzol isolation and column purification process. Samples were thawed on ice if homogeneous or, if clots were evident, homogenized while frozen using a Tissue Tearor homogenizer (BioSpec, Bartlesville, OK). Next, samples were vortexed for 1 min, then centrifuged at 12,000 g for 10 min at 4°C to separate lipids. Avoiding the lipid layer and any cell debris, the clear pink infranatant was aspirated and divided equally into two RNase-free 2-mL microfuge tubes (∼1 mL supernatant each) and left for 5 min at room temperature. Next, after adding 200 µL chloroform to infranatant, tubes were vigorously shaken for 10 s, incubated on ice for 2–3 min, and centrifuged for 12 min at 12,000 g at 4°C. For each sample, the clear aqueous layers were pooled in a new RNase-free tube, to which an equal volume of 70% ethanol was added. RNA was purified from this mixture using the RNeasy Mini Kit (Qiagen Inc., Valencia, CA) following manufacturer’s instructions. RNA was eluted from the final column with 30 µL of nuclease-free water and stored at −80°C.
cDNA synthesis
RNA concentration was determined by NanoDrop (Thermo Scientific, Waltham, MA). Samples were diluted to 200 ng/µL, if necessary, prior to DNase treatment. Per 20 µL reaction, 17 µL sample was mixed with 1 µL DNase I and 2 µL 10× buffer (Ambion, Austin, TX). After incubating at 37°C for 30 min, 2 µL 110 mM EDTA was added and the enzyme was inactivated by heat treatment at 75°C for 10 min. After DNase treatment, the A260/A280 ratio averaged 2.08 ± 0.03 for all samples. In addition, because we anticipated some dilution of RNA from milk fat with RNA from infiltrating immune cells, we assessed a single representative sample of RNA from an untreated and an LPS challenged gland from one cow by Fragment Analyzer (Advanced Analytical Technologies Inc., Ankeny, IA); the RINs were 1.6 and 6.5 for the untreated and challenged glands, respectively. Treated RNA was stored at −80°C.
For cDNA synthesis, samples were diluted to 50 ng/µL with RNase-free water. Each 40 µL reaction contained 20 µL sample (1 µg RNA) and 20 µL master mix (High Capacity cDNA, Applied Biosystems, Foster City, CA): 4 µL 10× buffer, 1.6 µL 25× dNTPs, 4 µL random primers, 2 µL MultiScribe reverse transcriptase, and 8.4 µL nuclease-free water. The reaction was performed in a T100 thermal cycler (BioRad Laboratories, Inc., Hercules, CA), programmed to 25°C for 10 min, 37°C for 120 min, and 85°C for 5 min, then held at 4°C. After synthesis, 30 µL cDNA was diluted with 120 µL 10 mM Tris for storage at −20°C.
Quantitative PCR
Genes of interest and reference genes were selected based on results from our previous study (Shangraw et al. Reference Shangraw, Rodrigues and Choudhary2021) along with CD18 and CD68, which are markers of neutrophils and macrophages, respectively (Brenaut et al. Reference Brenaut, Bangera and Bevilacqua2012). Primers were designed across exon–exon junctions using Primer-BLAST (Ye et al. Reference Ye, Coulouris and Zaretskaya2012), as summarized in Table 1, and were purchased from Integrated DNA Technologies (Coralville, IA). Primer efficiency was validated using a 5-point (5 ng–5 pg) dilution series of a cDNA pool from all samples. A no template control was run as a negative control.
Primer list for genes expressed in milk fat

a FASN: fatty acid synthase; CSN2: beta casein; LALBA: alpha lactalbumin; NFKBIA: nuclear factor-κB inhibitor alpha; PTX3: pentraxin 3; MTHFD2: methylenetetrahydrofolate dehydrogenase 2; LPIN1: lipin 1; FKBP5: FK506 binding protein 51; HK1: hexokinase 1; FOLR1: folate receptor alpha; TSC22D3: TSC22 domain family protein 3; RPL4: ribosomal protein L4; RPS23: ribosomal protein S23; CD18: integrin beta chain-2; CD68: cluster of differentiation 68.
For real-time quantitative polymerase chain reaction (PCR), samples were diluted 1:2 (final dilution 1:10) with RNase-free water. Per gene, all samples were analyzed in duplicate against a standard curve made from the pooled cDNA, and plated in a 384-well plate. Each amplification reaction contained 5 µL PerfeCTa SYBR Green SuperMix (Quantabio, Beverly MA), 2 µL 50:50 mix of forward and reverse primers with an optimized final primer concentration of 200–800 nM (see Table 1), 1 µL water, and 2 µL standard or sample. Plates were run in a C1000 Touch thermal cycler (BioRad Laboratories, Inc., Hercules, CA) using the following cycling protocol: polymerase activation at 95°C for 3 min, then 40 cycles of 95°C for 15 s (denaturation), 60°C for 20 s (annealing), and 68°C for 20 s (extension), followed by a melting curve from 65°C to 95°C using an incremental temperature increase of 0.5°C every 10 s. Primer efficiency values ranged from 0.93 to 1.15 with standard curve R 2 ranging from 0.98 to 0.99. Quantification cycle values (C q) were imported into Microsoft Excel for further analyses. Arbitrary cDNA concentrations were determined from the C q of each sample and the slope of the standard curve by the following equation: 10^((C q-b)/m), where b is the intercept and m is the slope. To normalize expression, the arbitrary amount of the target gene was divided by the geometric mean amount of two reference genes, RPL4 and RPS23, in the same sample.
Statistics
All statistics were run using SAS 9.4 (SAS Institute Inc., Cary, NC). For each variable, data were tested for normality using the PROC UNIVARIATE procedure. Rectal temperature was analyzed as a one-way analysis of variance (ANOVA) using the PROC GLIMMIX procedure with repeated measures, with time as the fixed effect and cow the subject of repeated measures. Milk yield was analyzed as a two-way ANOVA using the PROC GLIMMIX procedure with repeated measures, with time and day as the fixed effects and cow the subject of repeated measures.
Milk composition data were analyzed as a three-way ANOVA using the PROC GLIMMIX procedure. SCC data were log10 transformed for analysis. The statistical model included the fixed effects of day, treatment, time, and their interactions. Quarter within cow was the subject of repeated measures. For variables with missing data, degrees of freedom were calculated using the Kenward–Roger approximation option.
For PCR gene expression, data were analyzed as a two-way ANOVA model using the PROC GLIMMIX procedure with repeated measures to determine the main effects of time, treatment, and their interaction, where quarter within cow was the subject of repeated measures. Where necessary, gene expression data were log10- or square root- transformed to achieve a normal distribution. For d-1 only, statistics were run on the missing 6 h samples using the average of 3 and 12 h for each cow. For this reason, no datapoints are presented for samples at 6 h on d-1. When the treatment effect or interaction was significant, preplanned comparisons of interest were (1) QLPS against d-1, QI or QC, (2) QI or QC against d-1 expression, and (3) QI against QC. For genes expressed by QLPS at magnitudes far greater than all other treatments (NFKBIA, PTX3, FKBP5, MTHFD2), a second dataset excluding QLPS was run to compare QI and QC against each other and to d-1 expression. All variables were modeled using the covariance structure that resulted in the smallest Akaike’s information criterion. Degrees of freedom were calculated using the Kenward–Roger approximation option and P-values adjusted using the adjdfe = row option. Data for MTHFD2 were non-normal even after transformation and the preplanned comparisons stated above were run using the Wilcoxon signed-rank test.
For all variables, treatment and interaction effects were considered significant at P ≤ 0.05 and results are reported as untransformed LSmeans and SEM unless specified.
Results
Cows displayed signs of clinical mastitis (fever, sickness behaviors, altered milk) 3 h after intramammary LPS infusion. Rectal temperature peaked at 6 h (40.2 ± 0.18°C; P < 0.001), returned to pre-challenge temperatures at 12 h, and was lower than pre-challenge at 24 h (37.5 ± 0.18°C; P < 0.01). Average combined milk yield of all quarters was significantly lower post-challenge compared to the a.m. yield just prior to challenge: at 12 h post-challenge, milk yield was 71 ± 8% (P < 0.01) of 0 h yields and partially recovered by 24 h to 82 ± 6% (P = 0.03).
Milk composition
Milk fat concentration post-challenge was significantly lower only in QLPS compared to d-1 (P < 0.05). Relative to d-1 samples, milk fat concentrations in QLPS were significantly lower at 3 and 6 h post-challenge but were not different immediately before the 12 h milking (Fig. 2A). Fat content of QLPS was also significantly lower than that of QC and QI at 3 h (Fig. 2I; P < 0.05) and immediately after the 12 h milking (P < 0.001). There was no difference in milk fat concentration over time in QC or QI post-challenge compared to d-1, QD, or to each other (Fig. 2C, E and I).
Milk fat and protein composition of LPS-treated and untreated adjacent mammary quarters. Strip milk samples collected on d-1 (pre-challenge) and d-0 (LPS challenge) immediately after a.m. milking, at 1, 3, and 6 h relative to a.m. milking, at 12 h relative to a.m. milking, which was immediately before p.m. milking, immediately after p.m. milking, and before d-1 a.m. milking (24 h). The break on the x-axis represents the 12 h milking. Legend represents: QLPS, injected with 50 µg LPS at 0 h on d-0; QI, untreated ipsilateral gland to QLPS; QC, untreated contralateral gland to QLPS; QD, untreated mammary gland diagonal to QLPS. Percentages of milk fat (A, C, E, G, I) and total protein (B, D, F, H, J). Rows A–H: * = significant difference within time between d-1 and d-0. Rows I and J: A, B = significant treatment difference within time between QLPS and either QC or QI. LSmeans ± SEM reported and significance determined at P ≤ 0.05.

Milk total protein concentration post-challenge was significantly greater in QLPS compared to d-1 (Fig. 2B; P < 0.001). Relative to d-1, QLPS showed two peaks, the first apparent at 3 h and plateauing to 6 h, then the second peak after the 12 h p.m. milking post-challenge which persisted to 24 h (Fig. 2B). There was no difference in total protein concentration over time in QC or QI post-challenge compared to d-1, QD, or to each other (Fig. 2D, F and J; P > 0.20).
Lactose concentration post-challenge declined significantly in QLPS by 3 h compared to d-1 and remained low thereafter (Fig. 3A). Relative to d-1, lactose concentration in QI was not different except at 12 h just before the p.m. milking, when lactose was lower in QI (Fig. 3C; P < 0.05). Lactose was also numerically lower in QC compared to d-1 at 3, 6, and 12 h before p.m. milking, though only significantly different at 6 h (Fig. 3E; P = 0.05). QC and QI were not different from each other or QD (Fig. 3I).
Milk lactose composition and SCC of LPS-treated and untreated adjacent mammary quarters. Strip milk samples collected on d-1 (pre-challenge) and d-0 (LPS challenge) immediately after a.m. milking, at 1, 3, and 6 h relative to a.m. milking, at 12 h relative to a.m. milking, which was immediately before p.m. milking, immediately after p.m. milking, and before d-1 a.m. milking (24 h). The break on the x-axis represents the 12 h milking. Legend represents: QLPS, injected with 50 µg LPS at 0 h on d-0; QI, untreated ipsilateral gland to QLPS; QC, untreated contralateral gland to QLPS; QD, untreated mammary gland diagonal to QLPS. Milk lactose percentage (A, C, E, G, I) and log10-transformed SCC (B, D, F, H, J). Rows A–H: * = significant difference within time between d-1 and d-0. Rows I and J: A, B = significant treatment difference within time between QLPS and either QC or QI; x, y = significant difference within time between QC and QI. LSmeans ± SEM reported and significance determined at P ≤ 0.05.

Milk SCC post-challenge increased significantly at 3 h in QLPS compared to d-1 (Fig. 3B; P < 0.05). Cells increased exponentially in QLPS, reaching the maximum detection limit of 10 million cells/mL at 6 h. Except at 12 h before p.m. milking, QLPS remained significantly greater than all other quarters thereafter (Fig. 3J). There was also a significant but smaller magnitude increase in the SCC of QC at 6 h compared to d-1 (Fig. 3F; P < 0.01). At 12 h, the SCC of both QI and QD, but not QC, were significantly greater than d-1 (Fig. 3D, F and H). Both QI and QD followed a similar pattern after the 12 h p.m. milking, with significantly lower SCC immediately after milking compared to QC (Fig. 3J; P < 0.001).
Milk fat RNA
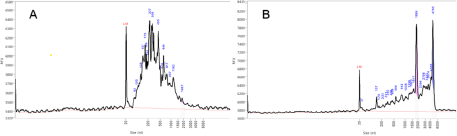
Yields of RNA isolated from milk fat of QI and QC glands were mostly low (<5 µg RNA/g of milk fat) and displayed the characteristics of exosomal RNA (Fig. 4A). However, milk fat from QLPS, particularly at 6 and 12 h post-challenge, yielded up to 10 times more RNA per gram of milk fat with an RNA profile resembling that of somatic cells (Fig. 4B), suggesting possible contamination of the RNA in milk fat with RNA from leukocytes infiltrating the gland. To assess this, we measured gene expression of the immune cell markers CD18 and CD68. Relative expression of both markers was low and stable over 12 h on d-1 before the LPS challenge, then increased significantly in QLPS at 6 and 12 h post-challenge compared to d-1 (Fig. 5, P < 0.01). Additionally, the mean expression of these genes over time was greater in QI than either d-1 or QC. However, only the difference between QI and d-1 approached statistical significance (P = 0.08).
Bioanalyzer results for milk fat RNA quality. RNA isolated from milk fat of one cow representing (A) untreated adjacent mammary gland and (B) 12 h post LPS-challenge gland.
Relative expression of immune cell and milk enzyme genes in LPS-treated and untreated adjacent mammary glands. RNA isolated from milk fat of strip milk samples was collected at the indicated times relative to a.m. milking on d-1 and d-0. Expression of each gene was normalized to the geometric mean expression of two reference genes. Legend: d-1, pre-challenge control from gland designated to receive LPS (QLPS); QLPS, gland injected with 50 µg LPS at 0 h on d-0; QI, untreated gland ipsilateral to QLPS; QC, untreated gland contralateral to QLPS. A,B = significant treatment difference within time between QLPS and either d-1, QC or QI. a,b = significant difference within time between d-1 and either QC or QI. No datapoint is shown for missing data on d-1 at 6 h, but comparisons against that datapoint were run using the average of data for d-1 at 3 and 12 h. LSmeans ± SEM reported and significance determined at P ≤ 0.05. CD18: integrin beta chain-2; CD68: cluster of differentiation 68; FASN: fatty acid synthase; CSN2: beta casein; LALBA: alpha lactalbumin.

Genes selected as markers for synthesis of milk fat (FASN), casein (CSN2), and lactose (LALBA) were significantly downregulated in QLPS compared to d-1 and both QC and QI (Fig. 5). In QLPS, compared to d-1, all milk synthesis markers were significantly downregulated at 6 h post-challenge (P < 0.05) and continued to decline in expression at 12 h. For FASN expression, QI and QC were not significantly different than d-1. There were significant differences in CSN2 expression at 1 h post-challenge in QI and QC compared to d-1; however, this appears to be driven by unaccountably higher expression of CSN2 at 1 h on d-1 in relation to all other timepoints on d-1. Otherwise, CSN2 expression in QI and QC was not significantly different compared to d-1. Expression of LALBA in QI, but not QC, was significantly lower than d-1 at 12 h post-challenge (P < 0.05). Lastly, the expression of all these genes related to milk component synthesis was not significantly different between QI and QC.
Several genes of interest were differentially expressed in QLPS, QC, and QI, with most revealing a significant time × treatment interaction. For LPIN1, expression in QLPS was downregulated compared to d-1 at 12 h post-challenge (Fig. 6; P < 0.05). Intriguingly, LPIN1 expression in both QC and QI was upregulated at 12 h post-challenge compared to QLPS (P < 0.001). QC also expressed significantly greater amounts of LPIN1 relative to d-1 at 12 h post-challenge (P < 0.05) but was not different compared to QI. The expression of HK1 was significantly higher in QLPS than either QC or QI at 6 and 12 h post-challenge (Fig. 6; P < 0.05). Further, both QC and QI expressed significantly greater levels of HK1 compared to d-1 at 12 h post-challenge (P < 0.05) but were not different from each other (P > 0.25).
Relative expression of selected genes in LPS-treated and untreated adjacent mammary glands. RNA isolated from milk fat of strip milk samples was collected at the indicated times relative to a.m. milking on d-1 and d-0. Expression of each gene was normalized to the geometric mean expression of two reference genes. Legend: d-1, pre-challenge control from gland designated to receive LPS (QLPS); QLPS, gland injected with 50 µg LPS at 0 h on d-0; QI, untreated gland ipsilateral to QLPS; QC, untreated gland contralateral to QLPS. A,B = significant treatment difference within time between QLPS and either d-1, QC or QI. a,b = significant difference within time between d-1 and either QC or QI. x, y = significant difference within time between QC and QI. # = significant main effect between QC and QI treatments. Genes with an extreme QLPS response are graphed with an inset. No datapoint is shown for missing data on d-1 at 6 h but comparisons against that datapoint were run using the average of data for d-1 at 3 and 12 h. LSmeans ± SEM reported and significance determined at P ≤ 0.05. LPIN1: lipin 1; HK1: hexokinase 1; NFKBIA: nuclear factor-κB inhibitor alpha; PTX3: pentraxin 3; FKBP5: FK506 binding protein 51; MTHFD2: methylenetetrahydrofolate dehydrogenase 2; TSC22D3: TSC22 domain family protein 3; FOLR1: folate receptor alpha.

Both immune-regulatory genes, NFKBIA and PTX3, were most highly expressed in QLPS (see Fig. 6 insets), being more than 2 and 4 orders of magnitude higher than all other glands at 6 h post-challenge, respectively. NFKBIA was more highly expressed overall in QI compared to d-1 and to QC (P < 0.01). Although the time × treatment interaction for NFKBIA was not significant (P = 0.26), expression in both QC and QI increased over time, being 20 and 50 times more highly expressed at 12 h compared to the same time pre-challenge, respectively. PTX3 was expressed more highly in QI and QC compared to d-1 at 3, 6 and 12 h post-challenge (P < 0.001). Although minor compared to the response in QLPS, QI and QC expressed 32 and 270 times more PTX3 at 12 h compared to the same time pre-challenge, respectively. Additionally, PTX3 expression was significantly upregulated in QI compared to QC at 6 h post-challenge (P < 0.05) and continued increasing to 12 h.
The final four genes related to two pathways of interest – glucocorticoid response (FKBP5, TSC22D3) and one-carbon metabolism (MTHFD2, FOLR1). Similar to the immune-regulatory genes, expression of FKBP5 and MTHFD2 significantly peaked in QLPS at 6 h compared to d-1 and both QC and QI (see Fig. 6 insets). Compared to d-1, FKBP5 expression at 3 h was slightly but significantly greater in both QC (P < 0.05) and QI (P = 0.06), then increased markedly and plateaued between 6 and 12 h, respectively (P < 0.001). There was no difference between QC and QI. MTHFD2 was also significantly upregulated in both QC and QI at 12 h compared to d-1 (P < 0.05). On the other hand, not all genes in these pathways showed differential gene expression in QC and QI. For TSC22D3, only QLPS was significantly downregulated compared to QC and QI (P < 0.01). The expression pattern of FOLR1 appeared remarkably similar to that of CSN2, with only QLPS significantly downregulated at 6 and 12 h post-challenge compared to QC (P < 0.01).
Discussion
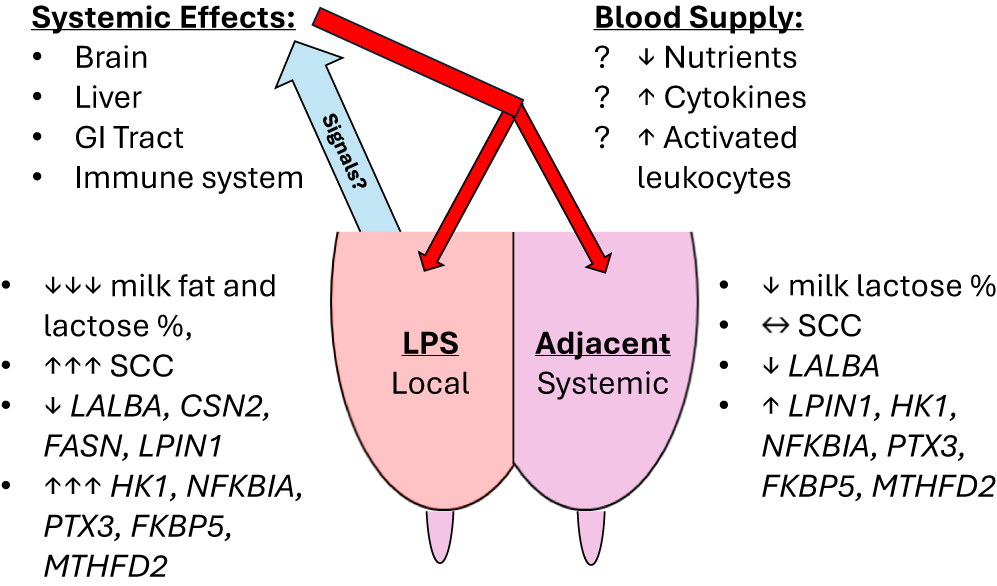
Our experiment confirmed several temporal and gland-specific responses in the expression of selected genes after a localized intramammary LPS challenge that corresponded with our prior biopsy results (Shangraw et al. Reference Shangraw, Rodrigues and Choudhary2021). On the other hand, few if any changes in milk composition were observed in contrast to the same previous experiment (Shangraw et al. Reference Shangraw, Rodrigues and Witzke2020). Despite some differences in experimental design and RNA source (milk fat vs. mammary tissue biopsy; Shangraw et al. Reference Shangraw, Rodrigues and Choudhary2021), we found similar responses in the expression of LALBA, LPIN1, HK1, NFKBIA, PTX3, FKBP5, and MTHFD2, along with the immune cell markers CD18 and CD68. The earliest responses seen in the adjacent, non-inflamed glands were found in immune- and stress-related genes by 6 h, prior to any minor changes in milk composition. These transcriptional responses, generally delayed and of lower magnitude in adjacent glands than in the mastitic gland, strongly suggest the action of systemic mediators of inflammation. A model summarizing our results and speculative sources of systemic mediators is included in Fig. 7. This argument for systemic mediators affecting non-inflamed mammary glands is further strengthened by the differences in expression between glands that were ipsi- and contralateral to the mastitic gland. Notably, this interdependence between mammary glands has largely been ignored in acute clinical mastitis studies, with some exceptions (Jensen et al. Reference Jensen, Günther and Talbot2013; Mitterhuemer et al. Reference Mitterhuemer, Petzl and Krebs2010; Shangraw et al. Reference Shangraw, Rodrigues and Choudhary2021). Lastly, our data provide further support and some caveats for using milk fat as a noninvasive source of RNA for studying mammary gene expression. The chief advantage is sampling more frequently while monitoring milk composition.
Summary of results. Model representing significant local and systemic effects of the intramammary LPS challenge on the LPS-challenged and adjacent glands, respectively. Milk composition and responsive genes are labeled with direction and magnitude of change. Speculative sources and mediators of these systemic effects are listed at the top. Blue arrow represents venous return of blood from the mammary gland carrying the signal or signals released by the LPS-challenged gland. Red arrows represent arterial supply to the mammary gland, which would distribute any systemic mediators to all glands.
In comparing our current results using RNA isolated from milk fat with our previous data using RNA isolated from mammary tissue, the most interesting result was our confirmation of the distinctly opposite response of LPIN1 in the untreated, adjacent mammary glands, QI and QC, relative to the LPS challenged gland, QLPS. As we found in our previous study (Shangraw et al. Reference Shangraw, Rodrigues and Choudhary2021), LPIN1 was highly upregulated in the adjacent glands but downregulated in QLPS. This contrasts with the more typical dose-dependent or graded response, seen for example in HK1 (Fig. 4), wherein the inflamed gland shows the greatest difference in expression due to a local effect and expression in adjacent glands is intermediate to the inflamed and control glands. LPIN1 encodes lipin-1, a Mg2+-dependent phosphatidate phosphatase which regulates fatty acid metabolism (Assaily et al., Reference Assaily, Rubinger and Wheaton2011). In cows, LPIN1 expression in mammary tissue is approximately 20 times greater at 60 DIM compared to nonlactating tissue prepartum (Bionaz and Loor Reference Bionaz and Loor2008). Recent genome-wide association studies in dairy cow breeds also found associations between several LPIN1 haplotypes and yields of milk, milk fat, and milk protein (Han et al. Reference Han, Yuan and Liang2019; Igoshin et al. Reference Igoshin, Mishakova and Aitnazarov2024). The actual role of this gene in the mammary gland remains unknown, considering the opposite change in LPIN1 expression between non-inflamed and inflamed glands. Based on our data, LPIN1 was differentially expressed in adjacent glands too late to be the cause of changes in milk composition but it may be involved in the protection, resolution or compensation of those glands in response to a mastitic gland. Indeed, milk yields were returning toward pre-challenge levels after 24 h and this recovery occurs first in the adjacent glands (Shuster et al. Reference Shuster, Harmon and Jackson1991c). Thus, LPIN1 expression may be a positive marker for a return to normal function in adjacent glands after mastitis, although longer-term sampling would be necessary to confirm if the LPS-challenged gland shows a similar pattern in LPIN1 expression as the inflammation subsides.
The expression of the immunoregulatory genes, NFKBIA and PTX3, and the stress-related genes, FKBP5 and MTHFD2, were most closely associated with the changes in milk composition in the LPS-challenged gland. These four genes were also significantly differentially expressed before the transient reduction in lactose content in the adjacent glands. FKBP5 encodes the immunophilin FKBP51, which modulates immune and glucocorticoid responses (Romano et al. Reference Romano, Xiao and Nakaya2015) and reduces glucose metabolism in mouse skeletal muscle (Balsevich et al. Reference Balsevich, Häusl and Meyer2017). MTHFD2 is an important enzyme both for folate metabolism and antioxidant generation (Ducker and Rabinowitz Reference Ducker and Rabinowitz2017). Of the two, upregulation of FKBP5 would theoretically have a greater impact on mammary function if it impairs glucose metabolism because glucose is necessary for the synthesis of lactose. Further evidence is required to determine if these changes in RNA abundance affect the translation and activity of either enzyme encoded by these genes during localized mastitis and whether they affect milk production.
The differential expression of NFKBIA, PTX3, and CD18 supported our second hypothesis concerning the location of an adjacent gland relative to a mastitic gland. As predicted, the ipsilateral gland showed significantly greater expression of these immune-related genes compared to both the contralateral and pre-challenge samples. NF-κB inhibitor α (NFKBIA) acts as a negative regulator of pro-inflammatory signaling (Kearns et al. Reference Kearns, Basak and Werner2006) while pentraxin 3 (PTX3) is an acute phase protein released by activated leukocytes that dampens the immune response by binding P-selectin to prevent neutrophil recruitment (Deban et al. Reference Deban, Russo and Sironi2010). Higher expression of these genes, in addition to the higher expression of the immune cell markers CD18 and CD68, indicates that ipsilateral glands were either exposed to more pro-inflammatory mediators or were infiltrated by more activated leukocytes than contralateral glands. Notably, the SCC in ipsilateral glands was lower or not different than in contralateral glands at all timepoints post-challenge. Thus, the position of the gland and not the greater concentration of somatic cells determined the expression of these genes. We note, however, that these differences in gene expression between ipsi- and contralateral mammary glands did not result in differences in milk composition between the two gland positions. During naturally occurring cases of clinical mastitis, gland position did not affect milk composition (Paixão et al. Reference Paixão, Abreu and Richert2017) or differential leukocyte proportions (Schwarz et al. Reference Schwarz, Diesterbeck and König2011) in milk from non-inflamed mammary glands. Whether or not anatomical position of a mammary gland affects milk, our data further highlight that non-inflamed glands cannot be considered independent when assessing gene expression in studies involving systemic effects of clinical mastitis.
An unresolved question is the potential contribution of RNA from non-MEC sources in non-inflamed glands. Bovine milk fat typically contains low molecular weight RNA with an RNA integrity number (RIN) of 2.6 ± 0.5 (Li et al. Reference Li, Dudemaine and Zhao2016). However, we noted a drastic change in RNA from the LPS-challenged gland, wherein SCC was several magnitudes higher than normal and significantly more RNA with a higher ribosomal RNA content (RIN > 5.0) was isolated from milk fat. The inflamed gland also expressed more markers of immune cells, CD18 and CD68. This increase in RNA and an upregulation of immune cell markers agreed with Brenaut et al. (Reference Brenaut, Lefèvre and Rau2014) and indicates that leukocytes may have been trapped in milk fat from mastitic glands. In contrast, the non-inflamed glands did not show a similar increase in milk SCC or RNA yield but did express higher amounts of leukocyte markers (Fig. 5). We suggest that these changes in non-inflamed glands may be due to (1) higher expression of immune cell markers by resident leukocytes or (2) the recruitment of activated leukocytes from the circulation without a change in the rate of cellular influx, i.e. no increase in SCC. Further research on changes in gene expression from milk somatic cells could be used to assess non-mammary cell contributions in the non-inflamed glands post-challenge.
Of the major milk components, we could only confirm changes in milk lactose concentrations in the non-inflamed adjacent glands compared to our previous study (Shangraw et al. Reference Shangraw, Rodrigues and Witzke2020). Lactose concentration is more strongly affected in mastitic glands with compromised tight junctions (Bruckmaier et al. Reference Bruckmaier, Ontsouka and Blum2004). However, lactose content was also reduced in non-inflamed adjacent glands (Paixão et al. Reference Paixão, Abreu and Richert2017; Shangraw et al. Reference Shangraw, Rodrigues and Witzke2020; Shuster et al. Reference Shuster, Harmon and Jackson1991b). We suggest that the reduction in lactose content of adjacent glands may be regulated by systemically released cytokines in circulation, such as TNFα, because transcription of pro-inflammatory cytokines was highly upregulated in inflamed glands but not in adjacent glands (Shangraw et al. Reference Shangraw, Rodrigues and Choudhary2021). Subcutaneous injections of recombinant bovine TNFα caused a 16% reduction in milk yield (Kushibiki et al. Reference Kushibiki, Shingu and Komatsu2006), mimicking the response of mammary glands during an intravenous LPS challenge (Shuster et al. Reference Shuster, Harmon and Jackson1991b). In mammary cell cultures, pro-inflammatory cytokines reduced the expression of lactose synthesis-related genes, including LALBA and HK1, and caused glucose transporters to be internalized (Kobayashi et al. Reference Kobayashi, Kuki and Oyama2016). Although our LALBA expression showed a similar down-regulation in the LPS-challenged glands, we found an increase in HK1 gene expression rather than a decrease. Thus, whereas some genes such as LALBA may consistently be associated with reduced lactose during lactation, others are not. For example, treatment of macrophages with LPS triggers increased expression of HK1 along with other genes needed for glucose metabolism (Tavakoli et al. Reference Tavakoli, Zamora and Ullevig2013). Considering that several immune- and stress-responsive genes were also upregulated in our study, it is more likely that HK1 expression is related to the immune response and not to lactose nor milk production.
Conclusion
Non-inflamed mammary glands adjacent to an LPS-challenged gland showed significant differential expression of several genes prior to and concurrent with minor changes in milk composition at 12 h post-challenge. In the adjacent glands, transcription of LALBA was downregulated while immunoregulatory (NFKBIA, PTX3), stress-responsive (FKBP5, MTHFD2), and metabolic genes (LPIN1, HK1) were upregulated compared to pre-challenge. Notably, LPIN1 expression appears to be a positive marker for a return to pre-challenge milk production in the adjacent glands. All responses in the adjacent glands occurred without a significant increase in SCC. Further, the adjacent gland ipsilateral to the LPS-challenged gland showed greater differential expression of several immune genes compared to the contralateral gland, indicating that non-inflamed glands should not be considered independent in studies involving systemic effects of clinical mastitis. Lastly, our study supported the use of milk fat for isolation of RNA when assessing transcriptional changes in the mammary gland.
Acknowledgements
ES and TM designed research; ES randomized treatments and performed research; ES and TM analyzed data; ES and TM wrote the manuscript.
Competing interest
The authors declare no conflicts of interest.


 Open access