


1. Introduction
Recent decades are characterized by a sharp rise in income inequality in many advanced economies (Piketty et al., Reference Piketty, Saez and Zucman2018). In response to calls for countering this trend, public debate has intensified over the policies governments should pursue to reduce income disparities. These policies often include social spending programs that favor the disadvantaged and various forms of progressive taxation (Alesina and Glaeser, Reference Alesina and Glaeser2004). The realization that governments’ ability to pursue such egalitarian policies depends on public support has spawned a great deal of research on individual attitudes toward inequality and redistribution.
For example, a slew of studies analyze public opinion data from major cross-national surveys (e.g., the European Social Survey (ESS) and the International Social Survey Program (ISSP)), which ask respondents whether or not they think it should be the government's responsibility to reduce income differences between rich and poor (e.g., Häusermann et al., Reference Häusermann, Kurer and Schwander2015; Beramendi and Rehm, Reference Beramendi and Rehm2016; Alt and Iversen, Reference Alt and Iversen2017; Dimick et al., Reference Dimick, Rueda and Stegmueller2017; Mosimann and Pontusson, Reference Mosimann and Pontusson2017; Rueda, Reference Rueda2018).Footnote 1 Almost invariably, such studies reveal that sizable majorities answer this question in the affirmative, with the most recent cross-national ISSP survey showing support ranging from 56 percent in the US to over 92 percent in Slovenia (See Appendix A.1). However, it remains unclear what people mean when expressing such preferences. Specifically, what policies do they have in mind when considering the government's role in countering income inequality?
We use data from an original national US survey designed to address this question. We find that only a small percentage of the public connects the broad goal of income inequality reduction with the main redistributive measures researchers typically assume as being in question. In fact, in response to an open-ended question, only a fraction of respondents cited progressive taxation and social assistance to low-income earners as the policies they had in mind when saying that the government is responsible for reducing income inequality. Even when this policy combination was presented to them in a fixed-choice question as one of the possible courses of action, less than 30 percent of respondents chose it as the option closest to what they had in mind. Instead, our analysis suggests that opinions about inequality reduction reflect thinking at a much more abstract level, and that when people do consider actual policies, raising of the minimum wage or investing in education is as likely to be what people consider as the relevant government measures.
In the second part of the study, we assess the implications of this disconnect between attitudes on the general issue of inequality reduction and views on its policy implications using an experiment embedded in another national US survey. In the experiment, we randomly assign respondents to one of four treatments, each prompting participants with slightly different versions of the standard ISSP/ESS survey question, ranging from the most abstract wording that asks about reducing income differences, to the most concrete version, which explicitly specifies the redistributive measures the government will use to reduce income differences. The experimental results show that informing people about concrete policy measures of redistribution increases support for government action. Furthermore, our findings suggest that explicitly specifying the policies under consideration helps clarify the potential implications on people's material standing, and thus increases the weight of self-interested considerations in shaping preferences on redistribution. Yet notably, even when the policy stakes are made clearer and self-interest seemingly plays a larger role, we still do not observe a full (or close to full) convergence in the preferences of liberals and conservatives with similar incomes. In fact, political ideology remains a dominant predictor of attitudes, even when asking about the issue of inequality reduction in more concrete policy terms.
Our study contributes to the literature on the relationship between inequality and mass support for redistribution. Recent empirical research shows and analyzes the multidimensional nature of preferences on redistribution, particularly the way the views vary as a function of the specific policy features in question. For example, Cavaillé and Trump (Reference Cavaillé and Trump2015) distinguish between the funding source and the spending target, showing that these two dimensions prime different rationales for supporting redistribution. Other recent studies have focused on variation within these dimensions, such as the impact of different tax schemes on the public's level of support (Bartels, Reference Bartels2005; Ballard-Rosa et al., Reference Ballard-Rosa, Martin and Scheve2017; Fernández-Albertos and Kuo, Reference Fernández-Albertos and Kuo2018). Yet these studies offer little insight into the types of policies that citizens think about when considering the goal of reducing income inequality. This article provides the first systematic evidence on what those policies are, demonstrating that, in fact, the vast majority of people do not have in mind the standard redistributive measures—taxing the wealthy, and social transfers to the poor—as the desired course of action for tackling inequality.
Our findings also speak to the widely discussed puzzle of why many low-income citizens—those who stand to benefit most from redistributive policies—choose to vote for parties on the right that often oppose income redistribution (Frank, Reference Frank2007; Gelman, Reference Gelman2009). One common explanation emphasizes the role of perceptions of fairness, focusing on issues such as whether citizens view the affluent as deserving of their wealth and the degree of responsibility they perceive individuals bear for their personal circumstances (Scheve and Stasavage, Reference Scheve and Stasavage2017). Other analysts emphasize the role of a second dimension in politics (e.g., religion, culture wars) as what draws the poor to vote for those parties (Cramer, Reference Cramer2016; Margalit et al., Reference Margalit, Raviv and Solodoch2023). Our findings point to another potentially relevant factor, namely the difficulty many people face in connecting abstract goals with concrete policies that advance those goals. Indeed, our analysis indicates that when citizens are asked for their views about concrete government measures to reduce income differences, respondents tend to hold positions that are much more in line with their material interests.
1.0.1. What do people have in mind when thinking about tackling inequality?
A sizable literature explores the link between individuals’ characteristics and their views on inequality and redistribution. Notably, in these investigations, little attention was given to the question of what information people possess on these matters and what knowledge they bring to bear when stating their views on inequality reduction. To provide insight on this question, we designed and fielded an online representative survey of a sample of 1,000 US adults (see Appendix B for additional details).
First, we asked the Main Question, i.e., the item asked in prominent cross-national surveys, and subsequently used by scholars of public opinion studying the topic. Specifically, respondents were asked to indicate whether they think it should be the government's responsibility to reduce income differences between the rich and poor, with answers ranging on a four-point scale from “definitely should be” to “definitely should not be.” Among all survey respondents, a substantial majority (67 percent) indicated that it definitely or probably should be the government's responsibility to reduce income differences between rich and poor (see Figure SI-4 for the distribution across countries). But to what extent does this majority have a clear conception of what government action on inequality might actually entail? Are those respondents willing to back policies that redistribute gains from the wealthy to the poor?
To get at these questions, we incorporated in the study both open-ended and fixed-choice items that immediately followed respondents’ answer to the aforementioned Main Question. Half of the sample was assigned to explain, in their own words, what government actions they had in mind when answering the question. Based on the central themes emerging from their answers, we hand-coded the open-ended responses into seven categories: ones that mentioned the main redistributive measures of raising taxes for higher earners and providing social services for those with lower incomes; responses that mentioned only one component of these measures (i.e., progressive taxation or social assistance); responses that mentioned an abstract principle to be pursued by governments; answers that mentioned specific government measures such as increased investment in public education or raising of the minimum wage; and another category that included references such as “don't know” or “not sure.” Finally, the category “other” included less common answers that did not fall into any of the major themes.Footnote 2 See Appendix B for details on the coding rules and examples of responses.
Figure 1 presents the distribution of responses to the open-ended question in each category. Notably, it shows that only a fraction of respondents (3 percent) mentioned progressive taxation and social services for low-income earners as the primary government actions they had in mind when expressing their position on government action on inequality reduction. Even when adding to this calculation respondents who mentioned just one of the components—either progressive taxation or social assistance to the poor—as the measures they had in mind, the total figure is still strikingly low (26 percent).Footnote 3
What reduction of inequality means: open-ended responses. Notes: The figure shows the distribution of open-ended responses (N = 566).
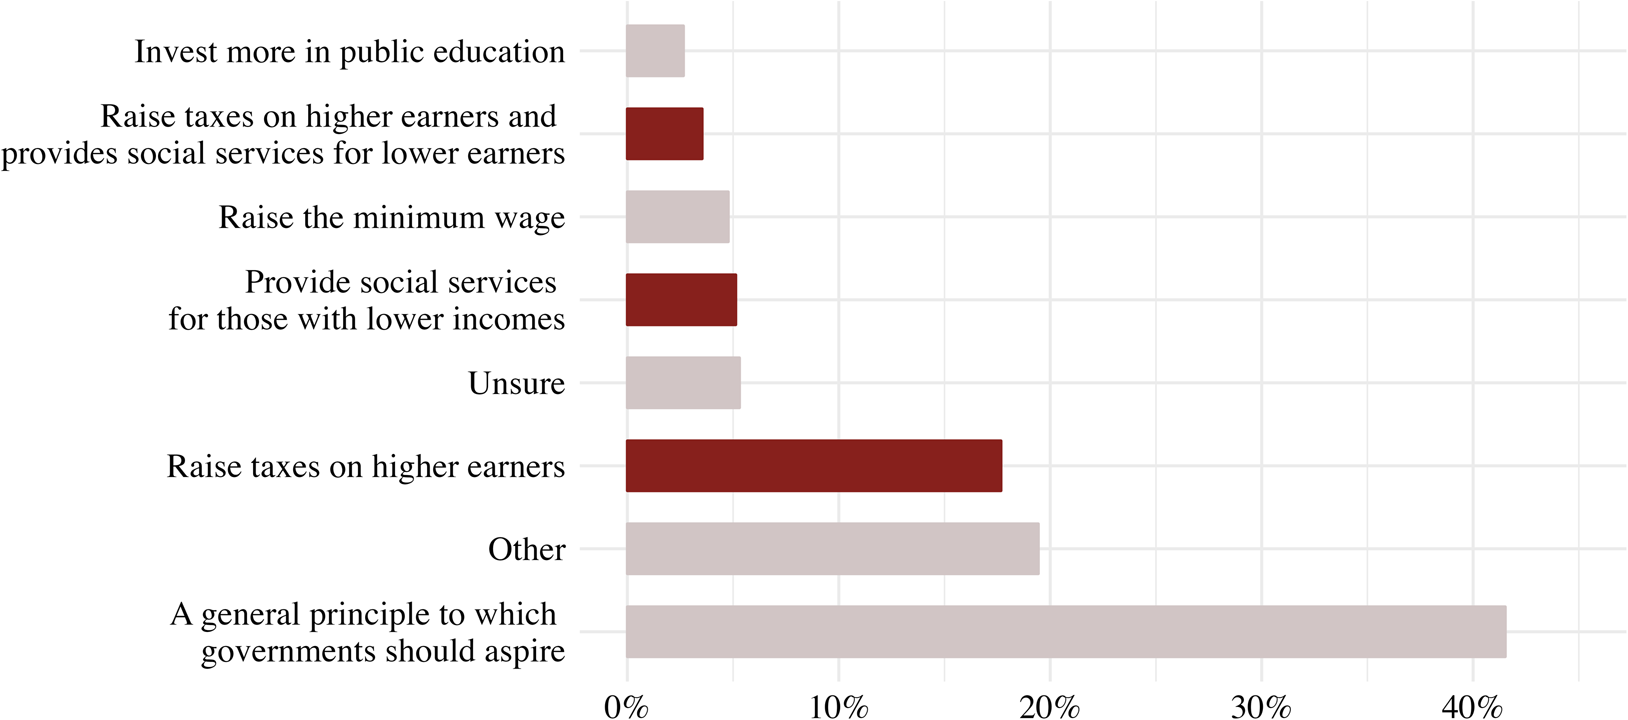
As the figure also indicates, 40 percent explained their prior response as merely referring to the general objective of lowering inequality, without a consideration of any specific policy measure.Footnote 4 This indicates that a sizable share of the public does not connect the goal of reducing income inequality to any concrete policy actions that achieving this goal may involve.
However, the fact that very few respondents mentioned standard tax-and-spend measures may be a sign of laziness of thought rather than a real disconnect in the way people think about the link between inequality reduction and standard redistributive policies. Perhaps if they were prompted with those policy measures as an option, they would have cited them as their reason for supporting (or opposing) government action on inequality. To assess this possibility, the other half of the sample was presented with a closed list of six potential responses, and asked to indicate which items on the list they had in mind when answering the Main Question (see Appendix B.2).
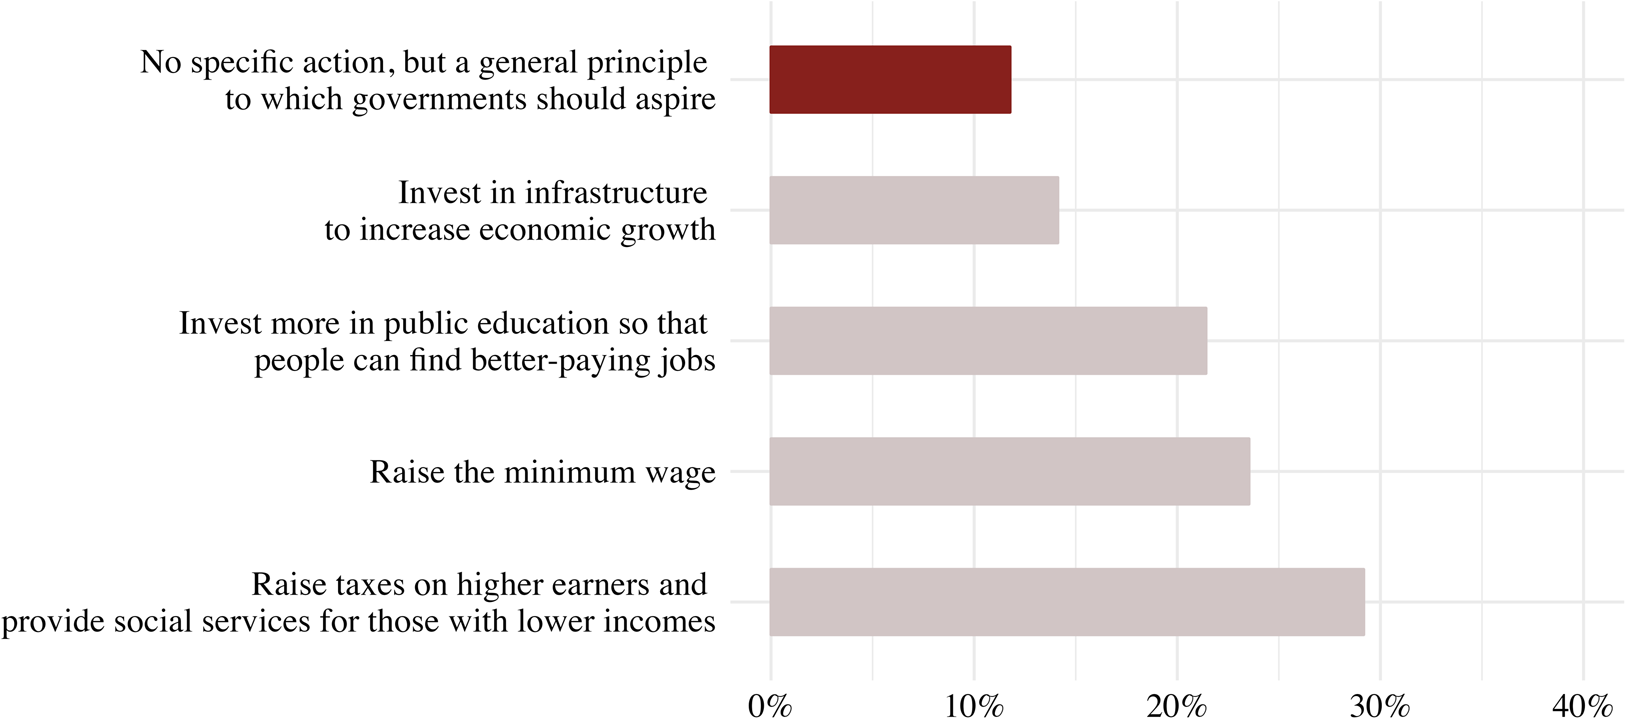
Figure 2 presents the share of responses in each category. The results for the closed-ended question are very much consistent with the pattern observed in the analysis of the open-ended responses: even when respondents were presented with the standard measure of progressive taxation with social assistance, less than 30 percent of them chose this option as the one that most closely matched what they had in mind. Furthermore, among those who did select a concrete policy, a substantial share cited an increase in the minimum wage or increased investment in public education. This suggests that people's views about inequality reduction reflect a broader conception of redistribution.
What reduction of inequality means: closed-ended responses. Notes: The figure shows the distribution of responses to the closed-ended question (N = 422).
1.0.2. Knowledge of policy and attitudes on redistribution
The results presented so far indicate that many people think about reduction of inequality in abstract terms and do not meaningfully connect this goal to practical policy measures. A pertinent question is what this finding means for the many studies that interpret support for government action on inequality reduction as an expression of support for redistributive measures. If rich and poor people were fully aware that the policy measures taken by the government to reduce inequality were progressive taxation and social programs that favored the disadvantaged, would their views on the Main Question be any different?
1.0.3. Experimental evidence
To assess this question, we embedded an experiment in another survey of a nationally representative sample of 1,500 US adults, administered in April 2020. Specifically, we randomly assigned respondents to receive one of four versions of the Main Question (see Appendix C for summary statistics and balance tests).
The four experimental conditions vary in terms of specificity. The most abstract version asked about (1) reduction of income differences between rich and poor, with no mention of the government; condition (2) was the Main Question in its original format, asking about the government's responsibility for the reduction of income differences; condition (3) referred to the government's active role in reducing income disparities specifically via intervention in the market; and condition (4) was the least abstract, and explicitly mentioned the redistributive measures to be used (i.e., progressive taxation and social assistance). As Table 1 shows, all treatments are similar in structure and offer the same four-point scale as answers. For ease of presentation, we code these answers into a binary variable that takes the value “1” if the respondent expresses support and “0” otherwise.
Experimental treatments
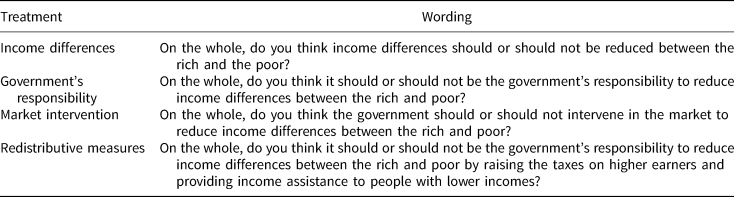
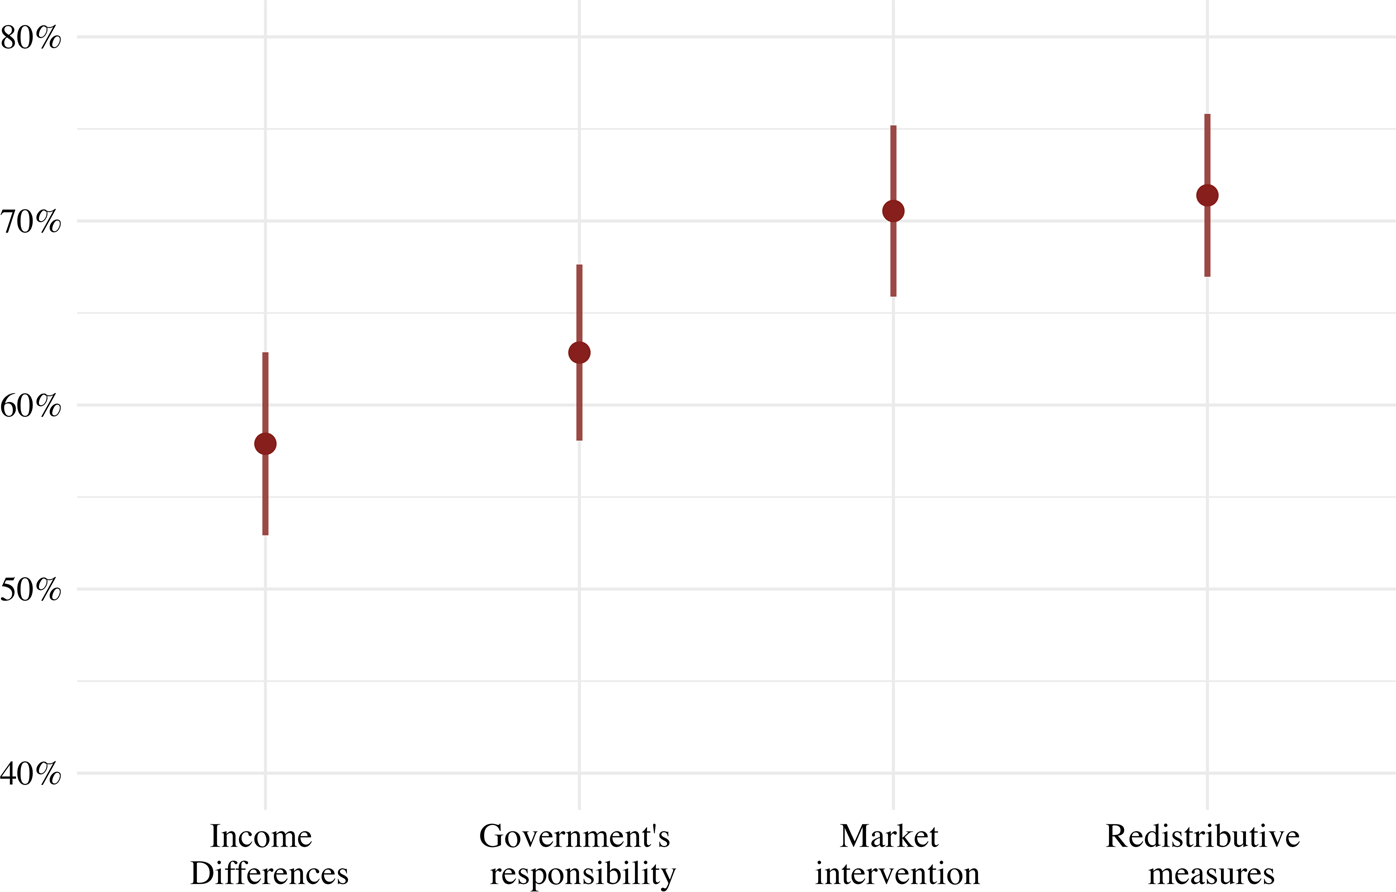
Figure 3 displays the average level of support across the four conditions. The results show that informing respondents about the practical measures of redistribution increased support for government action by about nine percentage points (to 72 percent) as compared to the Main Question, and by 13 percentage points when compared to the least concrete item. In both cases, these are statistically significant effects.Footnote 5
Average support for reducing income differences, by question's version. Notes: This figure presents average support for inequality reduction across the four conditions. Error bars indicate 95 percent CI.
This pattern is consistent with prior research that shows that Americans tend to embrace conservative principles in the abstract (e.g., minimal government intervention, maximal individual liberty), but at the same time are “operational liberals,” in that when asked about concrete policy questions they exhibit an affinity for liberal solutions (Ellis and Stimson, Reference Ellis and Stimson2012; Stimson, Reference Stimson2015). A possible explanation for the disconnect between these two tendencies—symbolic identification with conservative ideas but support for concrete liberal policies—could be related to considerations based on material self-interest, which perhaps become more prominent when debating issues at the policy level, i.e., when the personal stakes are clearer.
To assess this proposition, we examine whether and in what way the effect of the treatment—in this case, the specific question asked—varies as a function of different economic interests, as proxied by respondents’ income level. Figure 4 plots the predicted levels of support for each of the four conditions from the most abstract version, which asks about reducing income differences without mentioning the government as responsible for the policies used to attain this objective, to the least abstract version, which explicitly mentions government responsibility and the specific measures of progressive taxation and social assistance to the poor. The results are based on a linear probability model that regresses a binary measure of support for reducing income differences on indicator variables for the treatments, an indicator for high-income earners, and their interaction (see Table SI-6 for the full analysis).
Predicted support for reducing income differences, by income. Notes: The figure shows the predicted average support for reducing income differences, based on the regression presented in column 1 of Table SI-6. Thick bars represent 90 percent CIs; thin bars represent 95 percent CIs. Note that the Y-axis presents only part of the scale.
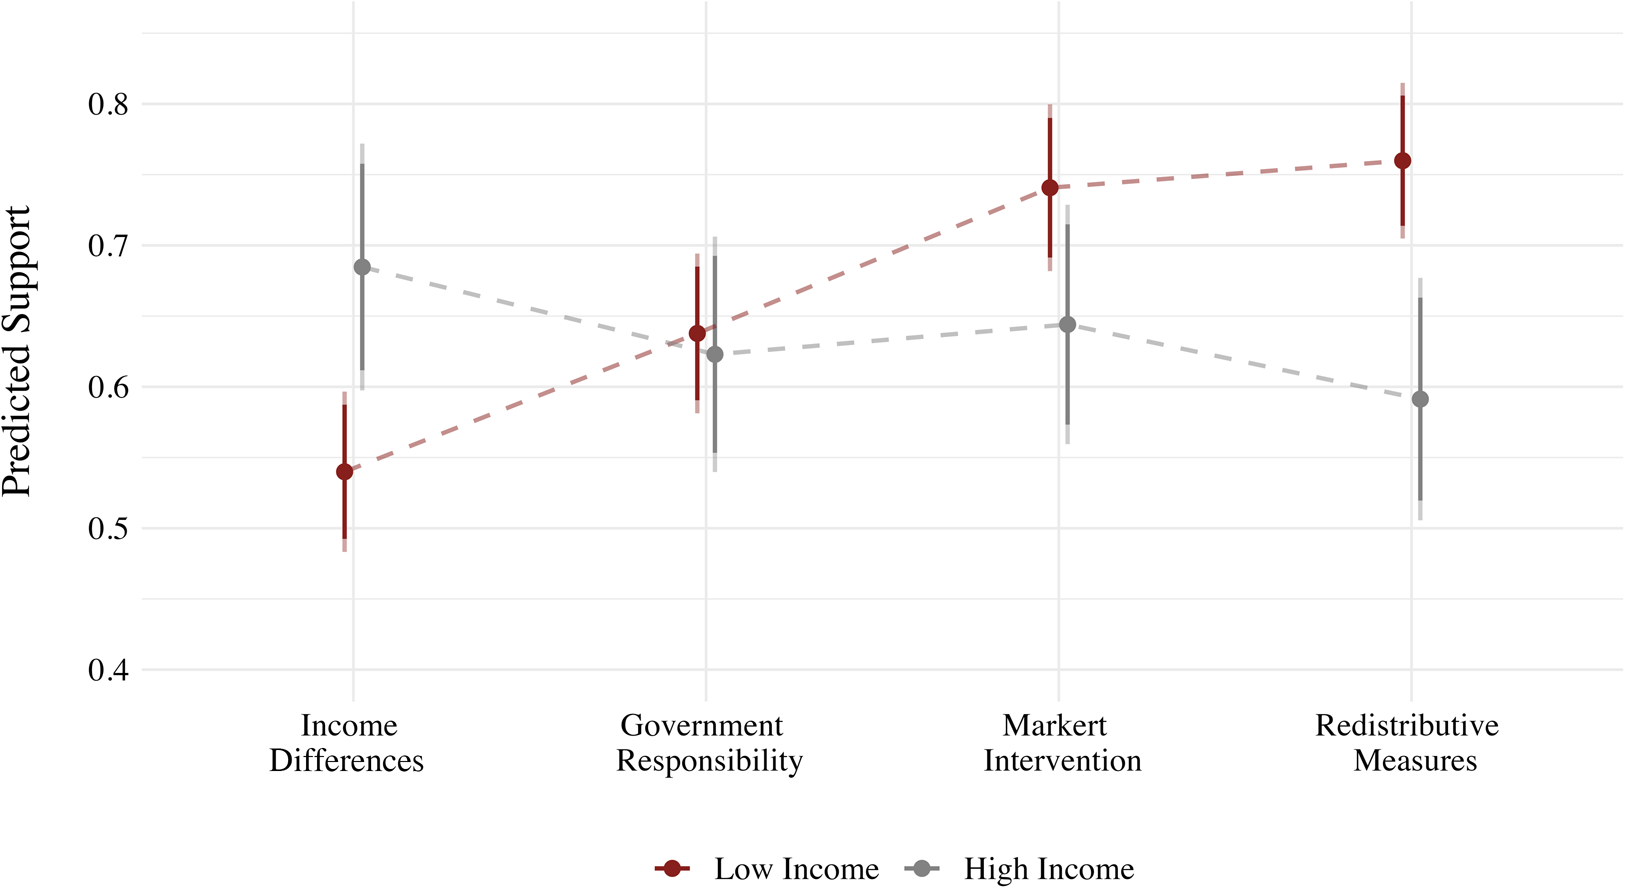
The figure shows that the Main Question—which asks about the responsibility of the government to reduce income differences without mentioning the explicit actions required—masks systematic differences in preferences between high- and low-income earners. The figure reveals a clear divide across income groups when asked about concrete redistributive measures, with high-income earners being 17 percentage points less likely to support the reduction of income differences than low-income respondents (p<0.01). Notably, we observe the opposite divide in the answers to the abstract question, where high-income earners are 14 percentage points more likely than low-income earners to support the general notion of reducing income differences between rich and poor (p<0.01). Put differently, the shift from the most abstract to the most concrete treatment produces a sizable reversal of 31 points in the support gap between low- and high-income earners.
These results indicate that large numbers of high earners support the general goal of reducing income disparities, but become distinctly less supportive when told about the concrete policy measures used to attain this goal. This may be because the likely implications of the policy on their material standing become either clearer or more salient. Notably, the exact same pattern of difference between high- and low-income respondents is present across the ideological divide. Using the same specification, we re-estimate the model separately for liberal and conservative respondents. While the results show the expected differences in the baseline level of support between respondents on the left and right, the pattern of difference across the income divide remains (see Appx Figure SI-5).Footnote 6
It is also worth noting that the material considerations induced by the different experimental treatments do not lead to a convergence in the attitudes of liberals and conservatives with similar incomes. Put differently, ideology remains a dominant predictor of attitudes on inequality reduction, irrespective of whether asking about inequality reduction as an abstract goal or in more concrete policy terms. This is consistent with recent studies suggesting that people form their preferences primarily based on their general intuition about what is fair. However, they may revise their views to account for their self-interest, depending on how much information they possess and how high the stakes are (for a more comprehensive discussion of this explanation, see Cavaille, Reference Cavaille2021).
One alternative interpretation for the differences we observe in the treatment effects between high- and low-income respondents is that they reflect gaps in knowledge rather than differences in material interests. The logic is that the more concrete the issue, the more difficult it is for people, especially the less politically sophisticated, to map it onto the general ideological (or partisan) divide. While plausible, further analysis suggests that this is not the case in this instance. In fact, when we control for sociodemographics, including respondents’ level of education, the negative association between high income and the concrete question about redistributive instruments remains unchanged.
Furthermore, the gap across the income divide does not appear to be masking a systematic difference in the cognitive engagement of high- and low-income respondents. Accounting for the least attentive respondents—those whose time to complete the survey was in the bottom quartile of the sample—produces almost identical results (see Table SI-9 in the Appendix). Thus, these results provide insight beyond the question of survey measurement, showing that people's lack of specificity on the policy measures used to reduce income inequality affects how they think about the government's responsibility for advancing this goal. However, when considering practical policy measures aimed at tackling income inequality, attitudes appear to correspond more closely with individuals’ own material interests.
1.1. Discussion
The study's results reveal that most ordinary citizens do not connect the goal of decreasing income inequality with the redistributive policies of progressive taxation and social transfers to the poor. In fact, people's views about inequality reduction reflect a broader conception of redistribution. As we show, general versus concrete questions induce among respondents different types of considerations. Attitudes on government action toward tackling inequality tend to reflect egalitarian sentiments and dispositions toward government intervention. In contrast, asking people about concrete redistributive measures makes the issue of inequality reduction less abstract, and induces considerations that are weighed more heavily toward people's own economic interests.
Figure SI-2 suggests that this pattern extends to other countries, showing that questions about concrete social policy issues tend to elicit quite different levels of support than more general questions that do not mention a concrete action. Whether that is the case will require administering a similar experimental study in other countries as well.
Our analysis indicates that there isn't only one way to correctly gauge preferences over redistribution. Instead, the correct approach depends on what the researcher is seeking to explain: If the issue under investigation is variation in levels of support for redistribution across countries or over time, using the question about inequality reduction appears to provide an appropriate measure. However, if the aim is to uncover the considerations shaping redistributive preferences, the analysis would be poorly served by items asking abstractly about inequality reduction, without referring to the concrete actions that governments would take to advance this goal.
Finally, a pertinent question arising from these findings is whether a similar disconnect characterizes the public debate over other ideologically charged issues. One prominent example may be the debate surrounding environmental policy to combat climate change. If our study's findings extend more broadly, a shift from the abstract level (i.e., whether the federal government should do more to protect the environment) to a debate over concrete policy steps may highlight other considerations that people bring to bear on the question. This, in turn, may narrow the ideological chasm that characterizes much of the discussion on climate issues (Egan and Mullin, Reference Egan and Mullin2017). Indeed, this study demonstrates the promise of our approach—utilizing open versus closed-ended items and randomizing policy options with varying levels of specificity—to detecting differences between the public's views on abstract policy goals versus concrete policy measures. Future work, we believe, could gainfully employ this approach to the study of other contested political domains.
Supplementary material
The supplementary material for this article can be found at https://doi.org/10.1017/psrm.2023.57. To obtain replication material for this article, please visit https://doi.org/10.7910/DVN/2MGYZT.
Acknowledgments
We thank Charlotte Cavaillé, Alex Kuo and Alon Yakter for helpful comments. We also thank participants at the APSA 2022 conference meetings. This research was supported by the Israel Science Foundation (grant 2079/19).


 Open access