


1. Introduction
Understanding climate change is of utmost importance when it comes to constructing sustainable societies and laying the foundation for future generations’ growth and stability. The conversations taking place on social media platforms represent public engagement on crucial topics. Social media has emerged as a powerful medium of communication in contemporary society, often referred to as a ‘new public address system’, and is increasingly embraced by leaders worldwide. Therefore, it is becoming increasingly critical for stakeholders such as policymakers, climate activists and the public to collect and analyse this abundant source of information from various perspectives.
There is a noticeable link between social media and public awareness and engagement regarding climate change. Public awareness plays a crucial role in shaping climate-related policies and their implementation (Wei et al., Reference Wei, Gong, Zhang and Wang2021). Clear and tailored communication is essential to reduce carbon dependency, as policymakers rely on public support to implement effective measures. Therefore, understanding the level of public engagement through social media can help policymakers devise strategies to elicit the desired social response. Topic modelling is a powerful tool in tracking public engagement in real-time, enabling us to propose ways in which effective communication can aid in tackling climate change and meeting the net-zeroFootnote 1 targets.
Kaushal et al. (Reference Kaushal, Acharjee and Mandal2022) comprehensively map climate change discussions on social media over 14 years. The study narrows down the focus to 10 critical areas within the overarching theme of climate change. By identifying and quantifying the key areas of discussion in real time, policymakers can bridge the gap between policy development and public response. For example, understanding public concerns regarding carbon taxation can inform the design of administrative programs that address those concerns and promote important factors from a policy and climate change perspective. This approach allows policymakers to assess the alignment of public concerns with climate change priorities and adjust strategies accordingly. In this article, we discuss these critical areas focusing on issues of policy focus arising from them.
The advantage of this social media-based system is its ability to capture real-time social responses and adjust processes accordingly. It also enables the assessment of public sentiment in various discussions, providing valuable input for decision-makers in policy formulation and public campaigns. Our study highlights that effective communication is an indispensable tool in the journey towards tackling climate change disruptions and achieving net-zero emissions. By fostering engagement, setting clear targets, educating stakeholders, promoting collaboration and addressing challenges, communication can drive collective action and accelerate the transition to a sustainable and net-zero future. We identify several key channels through which communication can play a vital role in supporting these efforts. Additionally, the article emphasises the significance of well-designed policies at local, national and global levels to create an integrated and comprehensive approach to tackling climate change.
The article is structured as follows: Section 2 presents the climate change discussions, followed by Section 3 discussing on policy implications and recommendations.
2. Climate change discussions
To map the climate change discussions, Kaushal et al. (Reference Kaushal, Acharjee and Mandal2022) mined 1.7 million climate-related posts from Reddit, a social media platform, spanned from January 2008 to June 2021, since its inception. Using the Universal Sentence Encoder (USE), a cutting-edge sentence encoding model (Cer et al., Reference Cer, Yang and Kong2018), the study developed a machine-learning pipeline to identify, process and classify climate-related posts on Reddit at scale. Unsupervised learning with K-means clustering identified distinct clusters within the collected posts over time. A supervised learning approach using a Random Forest binary classifier identified the underlying features of the discussions within each cluster. This method provides insights into how the general population interacts with and perceives climate-related information on social media. Understanding the underlying themes and their influence on discussions offers valuable knowledge about the shifting concerns, timing and extent of public engagement with climate change topics.
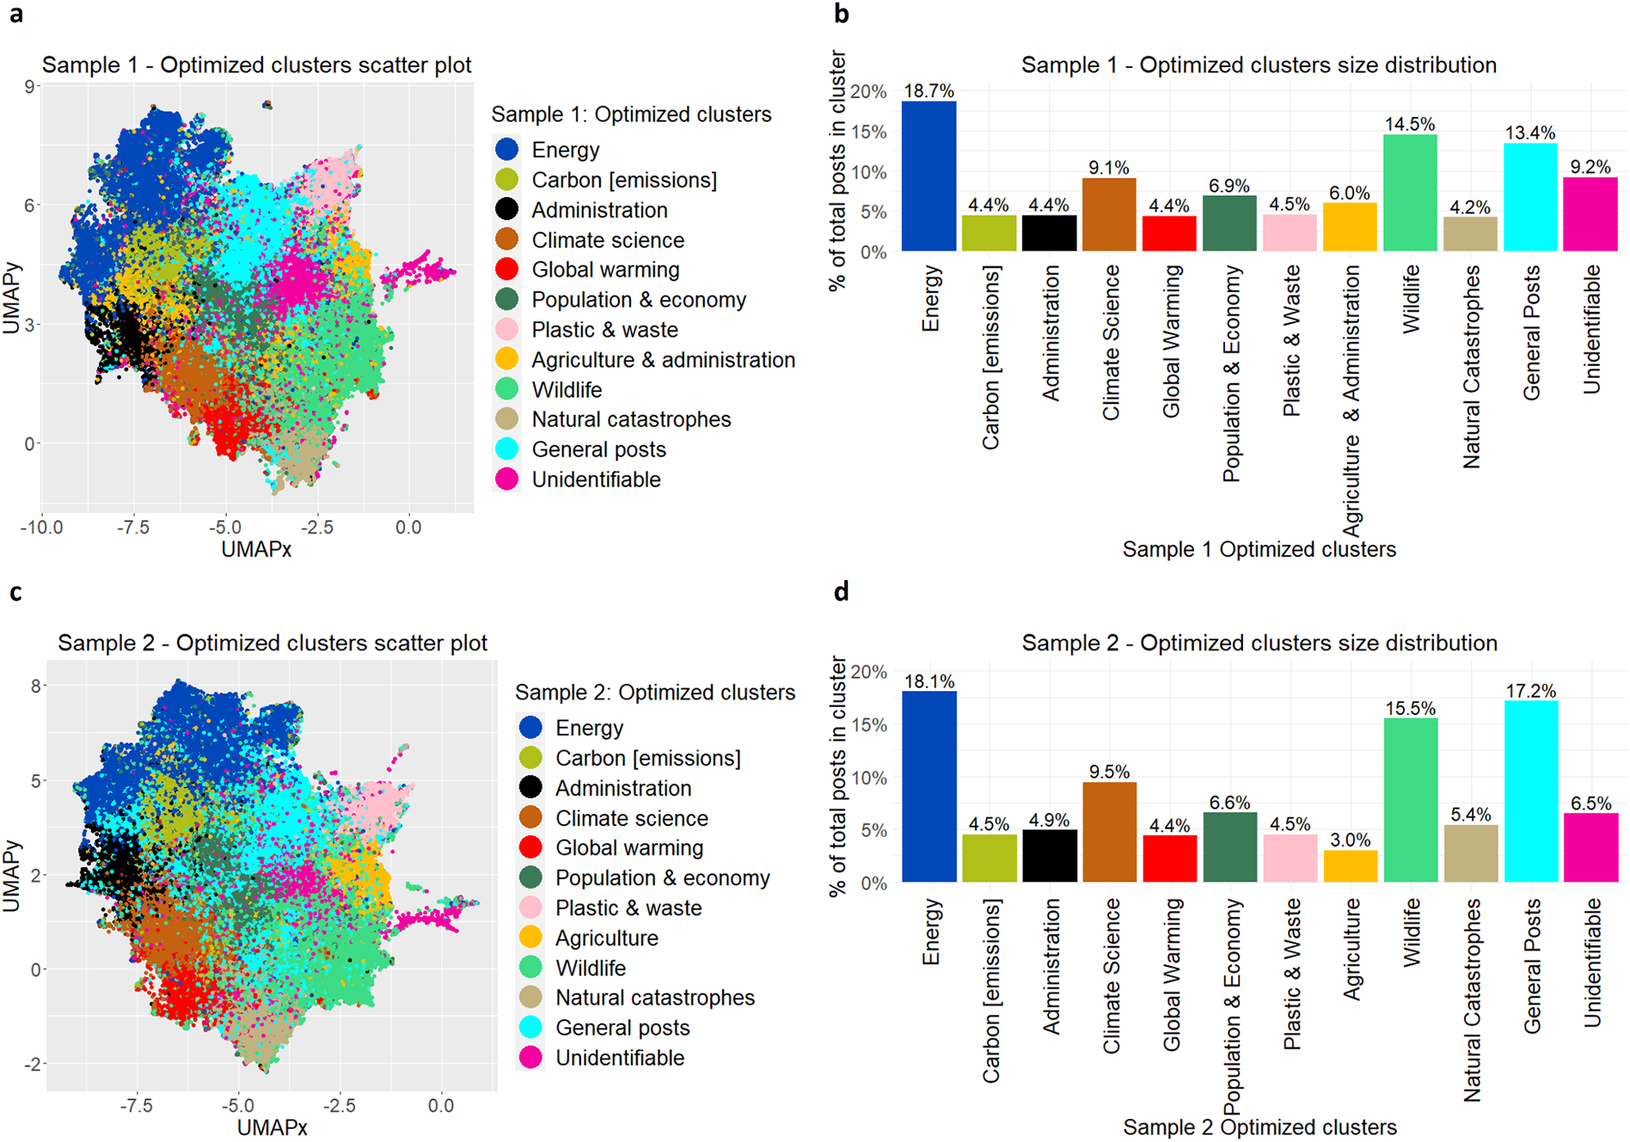
In total 10 distinct climate-related clusters/themes are extensively discussed on Reddit, each varying in proportion. In Figure 1, the dominant clusters include Energy (approximately 18%), Wildlife (approximately 15%), Climate science (approximately 9%), Population and economy (approximately 7%), Administration (approximately 5%), Natural catastrophes (approximately 5%), Carbon emissions (approximately 5%), Agriculture (approximately 5%), Global warming (approximately 4%) and Plastic and waste (approximately 4%). Additionally, two more clusters are identified: General posts (approximately 15%), which contain climate-related posts that discuss climate in a general context from a combination of perspectives, and Unidentifiable (approximately 8%), which includes posts that do not specifically discuss climate and do not belong to any of the identified climate-related clusters/themes. Within the Energy cluster, the discussions are largely dominated by Renewable energy (approximately 46%), with Solar energy accounting for approximately 16% and other renewable energy topics comprising approximately 30%. The cluster also includes discussions on Oil and gas (approximately 23%), Electric vehicles and alternative fuels (approximately 18%) and nuclear energy (approximately 13%).
Optimised clusters. The left-hand side shows the scatter plots. The right-hand side shows the size distribution column charts for the same optimised for the same sample.
Source: Kaushal et al. (Reference Kaushal, Acharjee and Mandal2022)
It is interesting to observe significant movements in users’ activity over time. For instance, in the Carbon emissions cluster, discussions typically fluctuate around the historical mean and mainly spike during key climate-related events (Figure 2). In 2009, there was a noticeable increase in the monthly proportion of discussions on Reddit, surpassing +1 standard deviation. This increase was partially attributed to West Virginia passing the Alternative and Renewable Energy Portfolio Act in June, which aimed to reduce coal dependence by requiring utilities with over 30,000 residential customers to obtain 25% of their electricity from renewables by 2025. Additionally, the launch of the US-India Partnership to Advance Clean Energy (PACE) in November further contributed to the discussions by promoting inclusive low-carbon growth and advancements in clean energy technologies (Figure 2a).
Proportion of monthly posts in optimised clusters (Jan 2008–Jun 2021). The figure shows the distribution of proportion of monthly posts for the optimised clusters over the entire study period. The solid horizontal line depicts the overall mean of the sample, and the dotted lines depict the ±1 sample standard deviations. Interestingly, we observe that the time-series break out of the one standard deviation above and below mean at different times in different clusters mainly signifying the unusually high or low activity of users during that time due to some of the key climate-related events as highlighted with solid arrows and encircled numbers in various sub-plots.
Source: Kaushal et al. (Reference Kaushal, Acharjee and Mandal2022)
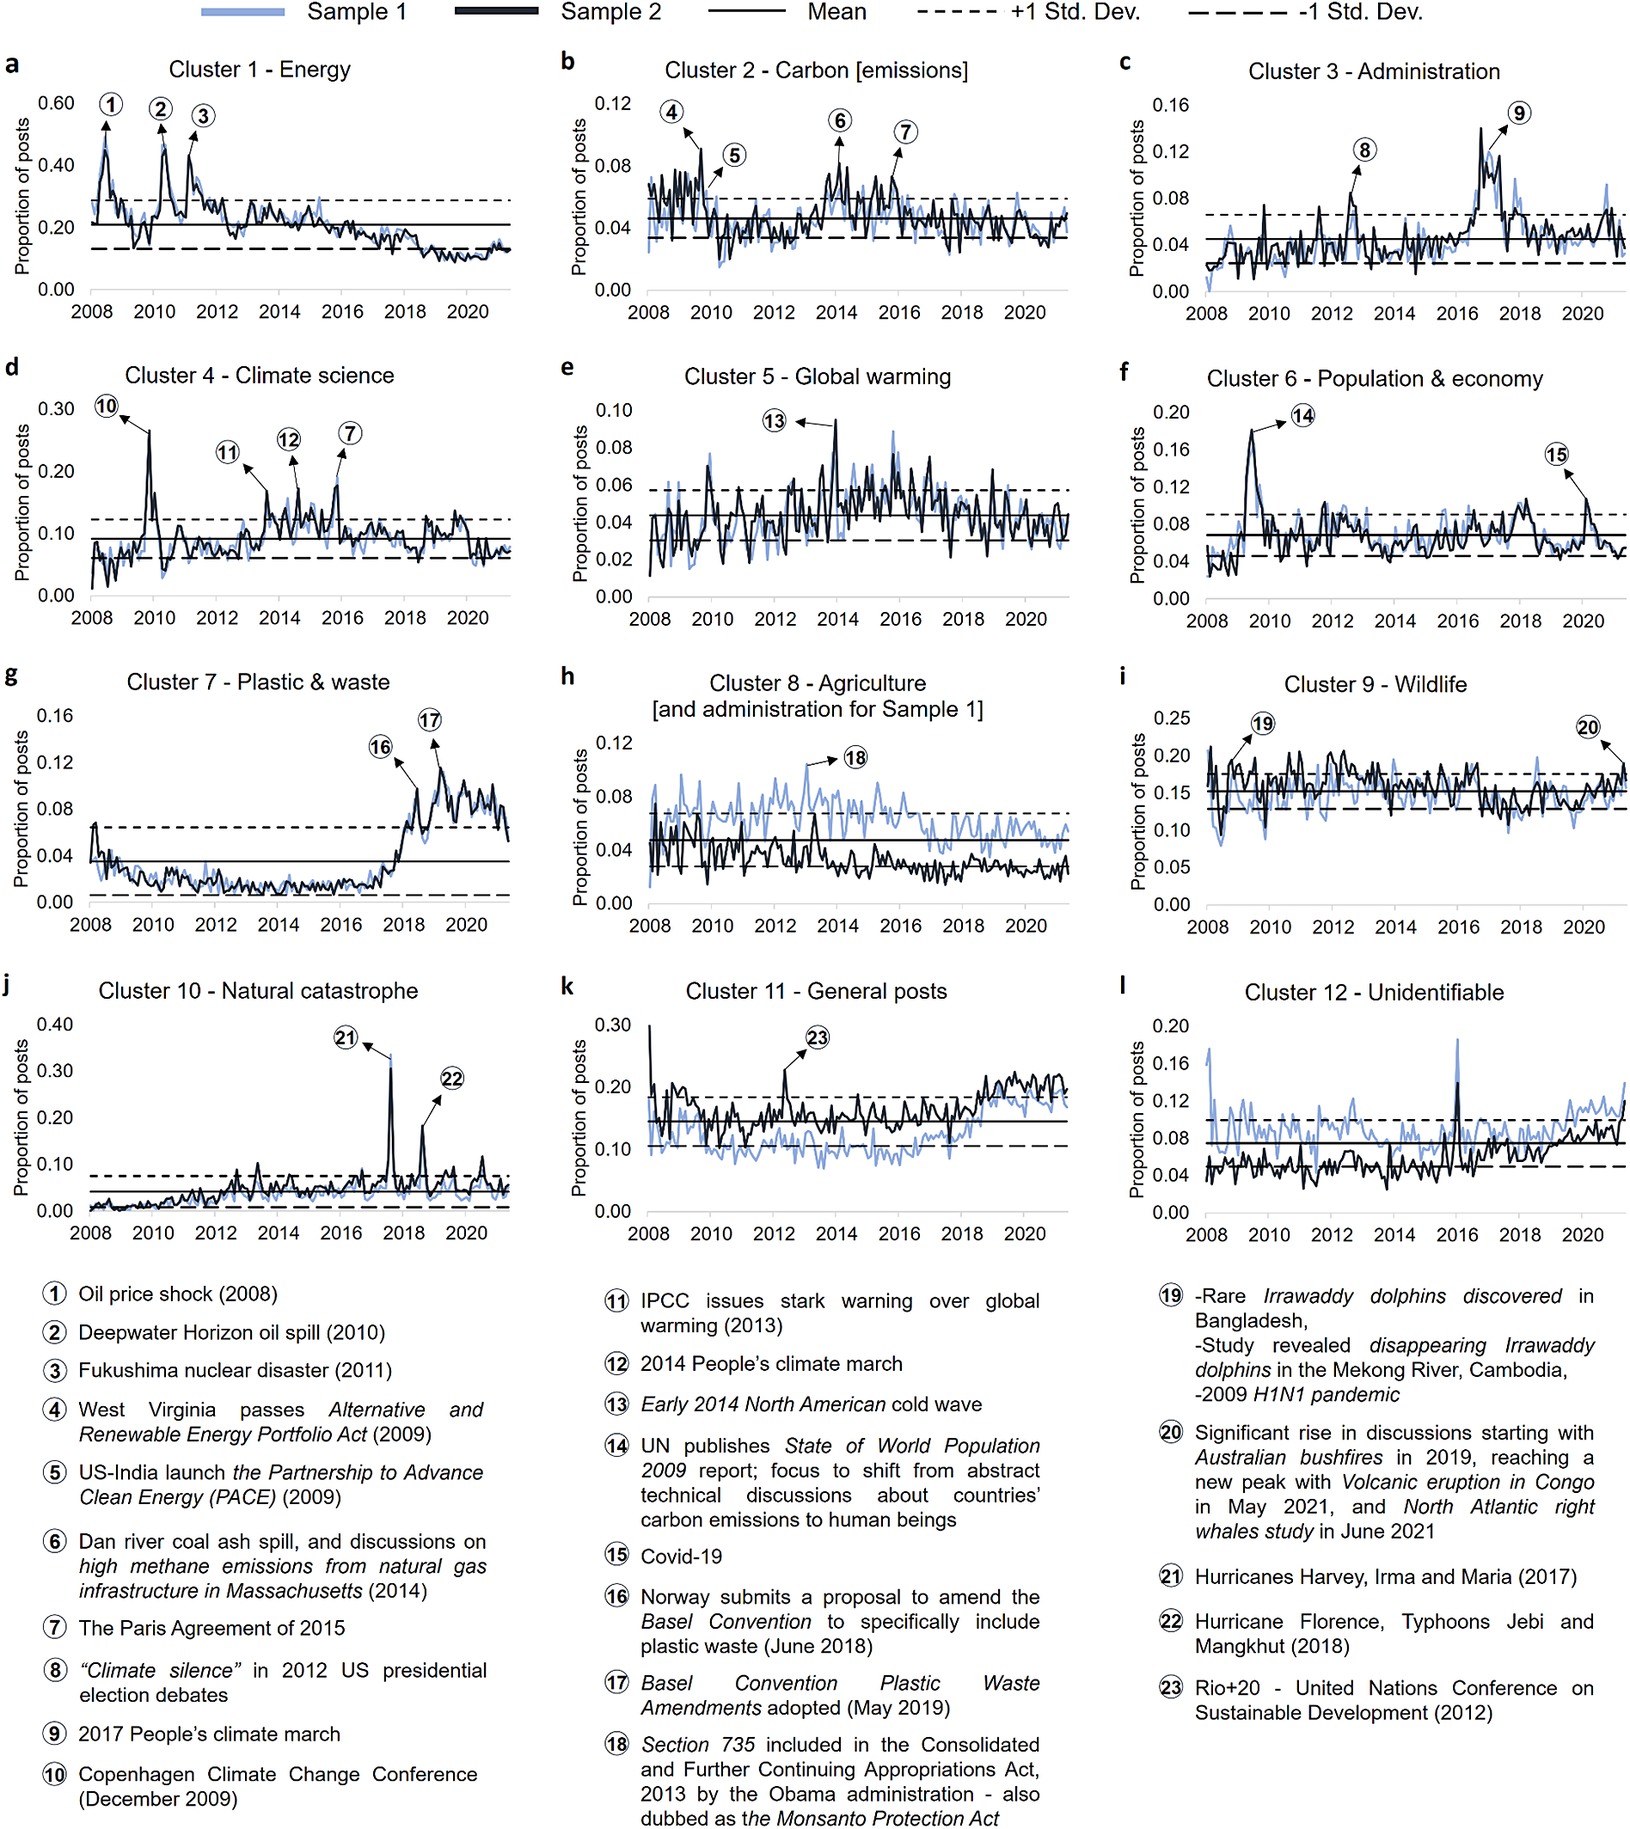
Following 2009, discussions related to carbon emissions remained relatively subdued until 2014 when a drainage pipe burst in North Carolina resulted in the spillage of 39,000 tons of coal ash into the Dan River. This incident prompted increased discussions on the topic (Figure 2b). Furthermore, in 2014, users expressed concerns about high methane emissions from natural gas infrastructure in Boston, Massachusetts. After a brief decline, discussions started to rise again and reached another peak at the end of December 2015 when users’ focus shifted significantly towards the Paris Agreement of 2015.
Apart from these specific events, discussions within the Carbon emissions cluster mostly remained within one standard deviation. However, occasional spikes occurred around events such as the California wildfires (2017–18), Australian bushfires (2019–20), and announcements of pledges for net-zero emissions by 2050 by many countries globally (2021).
We further observe that the discussions within the Carbon [emissions] cluster spiked in 2009 mainly as West Virginia passed the Alternative and Renewable Energy Portfolio Act and US-India launched the Partnership to Advance Clean Energy (PACE) (a). In 2014, the rise was attributable to Dan River coal ash spill and a report on high methane emissions from natural gas infrastructure in Massachusetts (b). Another peak was observed towards the end of 2015 mainly due to the discussions around The Paris Agreement of 2015 (c).
The analysis reveals intriguing patterns in the relationships between various themes within public discussions, shedding light on the dynamics of these interconnected topics. We will delve into each of the key findings in more detail to provide a comprehensive understanding of their implications.
2.1. Energy theme
The Energy theme displays a pervasive negative relationship with other themes. In essence, when discussions about energy-related topics intensify, there is a noticeable decrease in conversations surrounding other themes. This overarching negative correlation suggests that energy discussions tend to divert attention away from other subjects. The most robust negative correlation emerges when comparing the Energy theme with the Plastic and waste theme. This finding signifies that as discussions about plastic and waste grow in prominence, the focus on energy-related topics notably recedes, and vice versa. The implications of this result suggest that public discourse might shift between environmental concerns and energy matters, potentially reflecting the competing priorities and attention they receive.
2.2. Carbon Emissions theme
The Carbon Emissions theme exhibits a compelling pattern of relationships. It is characterised by statistically significant negative associations with the Administration, Wildlife and Natural Catastrophes themes. This implies that when carbon emissions discussions gain traction, discussions regarding themes such as administration, wildlife and natural catastrophes tend to diminish. Conversely, there is a positive relationship between the Carbon Emissions theme and the Climate Science theme. This suggests that as discussions related to climate science increase, the focus naturally shifts towards discussions on carbon emissions, highlighting a synergy between these two themes. An intriguing observation is the absence of a statistically significant linear relationship between Carbon Emissions and Global Warming discussions. This implies that public discourse differentiates between carbon emissions and global warming, and the two are not inherently linked in discussions.
2.3. Administration theme
The Administration theme reveals a distinct pattern of relationships with other themes. It is characterised by a statistically significant positive relationship with the Global Warming and Population and Economy themes. This finding suggests that when discussions related to administration and political matters intensify, they concurrently encourage discussions about rising global temperatures and the dynamics of population growth and economic health. In contrast, there is a slightly negative correlation between the Administration theme and both Agriculture and Wildlife themes. This indicates that as discussions about administration and politics become more prevalent, the focus tends to shift away from topics related to agriculture and wildlife. This pattern suggests that discussions about political matters tend to draw attention away from environmental and ecological concerns.
2.4. Global Warming theme
The Global Warming theme is characterised by a statistically significant positive relationship with the Wildlife theme. This observation implies that concerns related to rising global temperatures, sea level changes, forest conservation and biodiversity are positively associated with public discussions. These themes tend to co-occur, reflecting the recognition of their interconnectivity and mutual impact. Notably, there are slightly negative partial correlations between the Global Warming theme and both the Population and Economy and Plastic and Waste themes. This suggests that the public does not commonly associate global warming with overpopulation, economic health or the issue of waste management. This nuanced differentiation in public discourse signifies that global warming discussions are somewhat isolated from concerns about population growth, economic well-being and waste reduction.
In summary, the findings elucidate the intricate web of relationships between various themes in public discourse. These patterns reveal how discussions about one theme can influence or diverge from discussions about others, highlighting the complexities of public attention and the dynamics of these interconnected topics. The insights derived from these relationships provide valuable information for understanding the collective consciousness and priorities of society in relation to these pressing issues.
3. Policy implications and recommendations
Comparing attributions of climate-related scientific literature with social media discussions could help bridge gaps between scientific delivery and public opinions. In this article, we provide climate stakeholders with quantifiable insights from unstructured text data, allowing them to measure social responses to climate change events over time. This information can guide decision-making, resource allocation and targeted climate change efforts to achieve desirable social responses, meeting the net-zero targets.
An examination of the Administration and Policymakers theme in the context of climate discussions reveals intriguing patterns. There is a statistically significant positive relationship with the Global Warming and Population and Economy themes. This implies that when administration-related discussions gain prominence, they encourage and resonate with discussions surrounding rising global temperatures and the intricate dynamics of population growth and economic health. However, a noteworthy observation is the statistically significant negative relationship this theme has with the Carbon Emissions, Agriculture and Wildlife themes.
This intricate web of relationships suggests that while administration-related discourse effectively fosters conversations on global warming, overpopulation and economic well-being, it seems to have failed in communicating concerns related to critical factors in climate change, namely carbon emissions, sustainable agricultural practices and wildlife conservation. In essence, a communication gap exists in the public discourse driven by administration and policymakers, and this gap pertains to the primary drivers of climate change. To achieve the desired responses and a more informed and engaged public, this gap urgently requires addressing.
Shifting the focus to the Climate Science theme, a different picture emerges. This theme exhibits a statistically significant positive relationship with both the Carbon Emissions and Global Warming themes. This implies that climate science, as a topic, has been more successful than administration in influencing discussions that align with the goals of international climate agreements, such as the Paris Agreement (COP 26). Climate science discussions are resonating with the broader concerns related to carbon emissions and the overarching issue of global warming.
However, there is an interesting caveat. An increase in administration-related discussions appears to shift the focus of public discourse away from themes such as Energy, Agriculture and Wildlife, which are vital components of the ecosystem’s equilibrium. While climate science is driving discussions in the right direction, the policy and administrative discourse seems to be diverting attention away from critical areas like energy sustainability, sustainable agriculture and wildlife preservation.
Considering these findings, decision-makers, particularly within the administration and policy realms, should be acutely aware of the gaps in public communication and the potential consequences of shifting focus. To effectively address climate change and maintain the equilibrium of our ecosystems, a holistic approach is necessary. This approach should encompass not only the global warming and population aspects but also the essential elements of carbon emissions reduction, sustainable agriculture, wildlife conservation and energy sustainability.
In summary, the analysis underscores the importance of a comprehensive and well-balanced approach to climate discourse. Bridging the gap in public communication about the primary drivers of climate change and avoiding unintended shifts in focus are imperative to align public discussions with the global goals of mitigating climate change and maintaining ecological equilibrium.
Effective communication plays a pivotal role in addressing climate change and achieving net-zero targets. Climate change is a complex global issue that necessitates broad comprehension, support and cooperation to implement necessary solutions. We emphasise the ways in which effective communication can aid these efforts through various means:
-
i) Increasing Public Awareness: By effectively communicating the urgency of the issue, potential consequences, and the need for immediate action, the public can better understand their role in climate change and be motivated to participate in solutions,
-
ii) Building Political Will: Climate change is a political matter, and policymakers’ involvement is crucial in implementing climate policies and setting net-zero targets. Effective communication can mobilise public support, exerting political pressure that encourages leaders to take bold actions and prioritise climate action,
-
iii) Fostering International Cooperation: Climate change requires global cooperation, and effective communication can facilitate dialogue and collaboration between countries, encouraging joint efforts to achieve common climate goals, such as those outlined in the Paris Agreement,
-
iv) Engaging Businesses and Industries: The private sector significantly impacts greenhouse gas emissions. Effective communication can encourage businesses and industries to adopt sustainable practices, invest in clean technologies and set their own net-zero targets,
-
v) Scientific Communication: Climate science can be intricate and challenging for the public to grasp. Effective communication of scientific findings in a clear and accessible manner can bridge the gap between researchers and the public, enabling informed decision-making,
-
vi) Encouraging Innovation: Communication can stimulate innovation in clean technologies and sustainable practices. By showcasing successful examples and highlighting the benefits of innovation, it can encourage investment in research and development for climate solutions,
-
vii) Empowering Individuals: Communication can empower individuals to take climate action in their daily lives by providing information on sustainable lifestyle choices, energy conservation and ways to reduce personal carbon footprints, thereby contributing to collective efforts for net-zero emissions,
-
viii) Overcoming Resistance and Scepticism: Effective communication can address misinformation, scepticism, and resistance to climate action. By providing evidence-based information and addressing concerns, it can help build a common understanding and consensus,
-
ix) Tracking Progress: Communication is crucial for tracking progress towards meeting net-zero targets. Regular updates and transparent reporting on emissions reduction efforts hold stakeholders accountable and ensure transparency in the process, and
-
x) Inspiring Leadership: Effective communication can highlight climate leaders and their successes, inspiring others to follow suit and take bold climate actions in various sectors and regions.
In summary, effective communication is a powerful tool for driving action on climate change and achieving net-zero targets. By engaging and inspiring individuals, businesses, governments and international communities, it can create the necessary momentum and collaboration to address climate change effectively and build a sustainable future.
Further, tackling climate change and meeting net-zero targets requires a comprehensive and integrated approach that involves a range of policies at local, national and global levels. Based on the 10 key themes identified in the study, we propose some key policies that can contribute to these efforts:
-
i) Carbon Pricing: Implementing carbon pricing mechanisms, such as carbon taxes or cap-and-trade systems, can incentivise businesses and individuals to reduce their greenhouse gas emissions. By putting a price on carbon, these policies encourage the transition to low-carbon alternatives.
-
ii) Renewable Energy Incentives: Providing financial incentives and subsidies for renewable energy sources, such as solar, wind and hydroelectric power, can accelerate the shift away from fossil fuels and promote the use of clean energy.
-
iii) Energy Efficiency Standards: Establishing strict energy efficiency standards for buildings, appliances and industrial processes can lead to significant reductions in energy consumption and carbon emissions.
-
iv) Promotion of Electric Mobility: Encouraging the adoption of electric vehicles through incentives, infrastructure development and supportive policies can help reduce emissions from the transportation sector.
-
v) Deforestation and Forest Protection: Implementing policies to protect forests, promote afforestation and prevent deforestation can help preserve carbon sinks and reduce greenhouse gas emissions from land-use changes.
-
vi) Transitioning from Coal: Phasing out coal-fired power plants and replacing them with cleaner alternatives is essential for reducing emissions from the energy sector.
-
vii) Investment in Research and Development: Policies that promote research and development of clean technologies can lead to innovations that facilitate the transition to a low-carbon economy.
-
viii) Decarbonization of Industries: Encouraging industries to adopt low-carbon technologies, improve efficiency and implement carbon capture and storage (CCS) can significantly reduce industrial emissions.
-
ix) Building Codes and Standards: Implementing stringent building codes and green building standards can promote energy-efficient and sustainable construction practices.
-
x) Climate Education and Awareness: Policies aimed at promoting climate education and awareness can empower individuals to make informed choices and support climate-friendly initiatives.
-
xi) Climate Finance: Mobilising financial resources to support climate mitigation and adaptation projects in developing countries is essential for global climate action.
-
xii) National Climate Action Plans (NDCs): Countries can develop and update their NDCs, outlining their commitments and strategies to achieve net-zero emissions and contribute to the global effort under the Paris Agreement.
-
xiii) Carbon Removal and Negative Emissions Technologies: Policies that support research and deployment of carbon removal technologies, such as afforestation, reforestation and direct air capture, can help offset hard-to-abate emissions.
-
xiv) Just Transition Policies: Implementing just transition policies ensures that the transition to a low-carbon economy is fair and equitable for workers and communities affected by the shift away from high-emission industries.
-
xv) International Cooperation and Agreements: Collaborating with other countries through international agreements, such as the Paris Agreement, fosters global action and enables the sharing of best practices and technologies.
The above policies, when implemented collectively and in conjunction with effective communication strategies, can contribute significantly to global efforts in tackling climate change and achieving net-zero emissions. It is important to adapt these policies according to each country’s specific context and priorities while maintaining a cohesive and integrated approach at the international level.
Author contribution
Conceptualization: A.M.; Data curation: A.K.; Formal analysis: A.K., A.M., A.A.; Investigation: A.K., A.M., A.A.; Methodology: A.K., A.M., A.A.; Supervision: A.A., A.M.; Validation: A.K., A.M., A.A.; Visualisations: A.K.; Writing—Review and editing: A.M., A.K., A.A.
Funding statement
This work has not received any funding.


 Open access