

1. INTRODUCTION
Attempts to measure short duration pressure changes in the subglacial drainage system are rare, but in all cases where pressure has been measured at high frequency, transient pressure pulse behavior has been common. Kavanaugh (Reference Kavanaugh2009) and Kavanaugh and others (Reference Kavanaugh, Moore, Dow and Sanders2010) measured thousands of subglacial pressure pulses on Trapridge and West Washmawapta glaciers that were pervasive through both winter and summer seasons, and with magnitudes exceeding the local ice overburden pressure. In other studies, pulse behavior was not directly measured, but inferred from pressure changes that were large enough to permanently deform the pressure transducer measurement diaphragm (Kavanaugh and Clarke, Reference Kavanaugh and Clarke2000) or induce transducer failure (Kavanaugh and Clarke, Reference Kavanaugh and Clarke2001). All existing measurements have been made beneath Canadian alpine glaciers with till beds. Frequent pulse behavior therefore appears to be a robust feature of soft-bedded glaciers, and may be a potential indicator of basal conditions (Kavanaugh and others, Reference Kavanaugh, Moore, Dow and Sanders2010). Furthermore, such changes in water pressure may influence glacier erosion rates by changing basal stress conditions that drive quarrying processes (Iverson, Reference Iverson1991; Hallet, Reference Hallet1996; Cohen and others, Reference Cohen, Hooyer, Iverson, Thomason and Jackson2006). The relevance of short duration pressure pulses to these basal processes consequently motivates investigation of their presence and distribution on the larger Greenland ice sheet.
Here, we present observations of subglacial water pressure measured at high frequency in two boreholes penetrating the full ice column in western Greenland's ablation zone. The data provide a unique opportunity to compare the presence and magnitude of pulse behavior in the ice-sheet setting to the only other available observations on small alpine glaciers, which have shown pressure pulses to be common occurrences.
2. METHODS
During the 2014 and 2015 melt seasons, nine boreholes were drilled to the ice-sheet bed at a site ~34 km east of the land terminating Isunnguata Sermia outlet glacier (site 33 km-14 in Wright and others, Reference Wright, Harper, Humphrey and Meierbachtol2016; see Meierbachtol and others, Reference Meierbachtol, Harper and Humphrey2013 for borehole drilling methods) (Fig. 1). Temperature measurements in each borehole identify temperate conditions at the bed but no measurable temperate basal layer (Hills and others, Reference Hills, Harper, Humphrey and Meierbachtol2017). Cold ice reaching −12°C resulted in borehole freezing within days of drilling, effectively sealing the lower borehole column from the surface.
Site setting. Boreholes chosen for high-frequency pressure measurements are shown in red. Background is a Worldview image from July 2012 (copyright 2011, DigitalGlobe, Inc.).

Boreholes were instrumented with 2000 psi, Omega PX309 current output pressure transducers, installed at the ice-sheet bed as part of a downhole instrumentation package. In July 2015, transducers in two boreholes (hereafter referred to as 15-S and 15-CA) were continuously powered, sampled at 4 Hz frequency, and logged to a central Campbell Scientific CR6 datalogger. Two 12 V batteries, wired in series and charged by two 10 W solar panels, provided power to the logger and transducer measurement system. Factory reported transducer accuracy, including repeatability, linearity and hysteresis, is 0.25% of the full pressure span, or ~3.5 m. Ice depths from drilling were 678 and 673 m at 15-S and 15-CA, respectively (borehole depth uncertainty is <1.5%), and the holes were spaced 180 m apart (Fig. 1).
3. RESULTS
The pressure transducer in hole 15-S functioned for 52 d (day of year 192–244), resulting in a record composed of ~19 million measurements (Fig. 2). The 143 d record in hole 15-CA spanned 6 July 2015 to 11 April 2016 (an extended period without data is due to power loss during the winter when solar charging is absent), and contains nearly 49 million measurements (Fig. 2). Pressure persisted near or above local overburden level through the full time series in both boreholes.
Pressure record from boreholes GL15-CA (a), and GL15-S (b) with identified pressure events (red dots). Broken axes in (a) obscure the winter period for which there are no data. Horizontal dashed line is the local overburden pressure, assuming an ice density of 917 kg m−3. Note the different time and pressure scales in each panel.
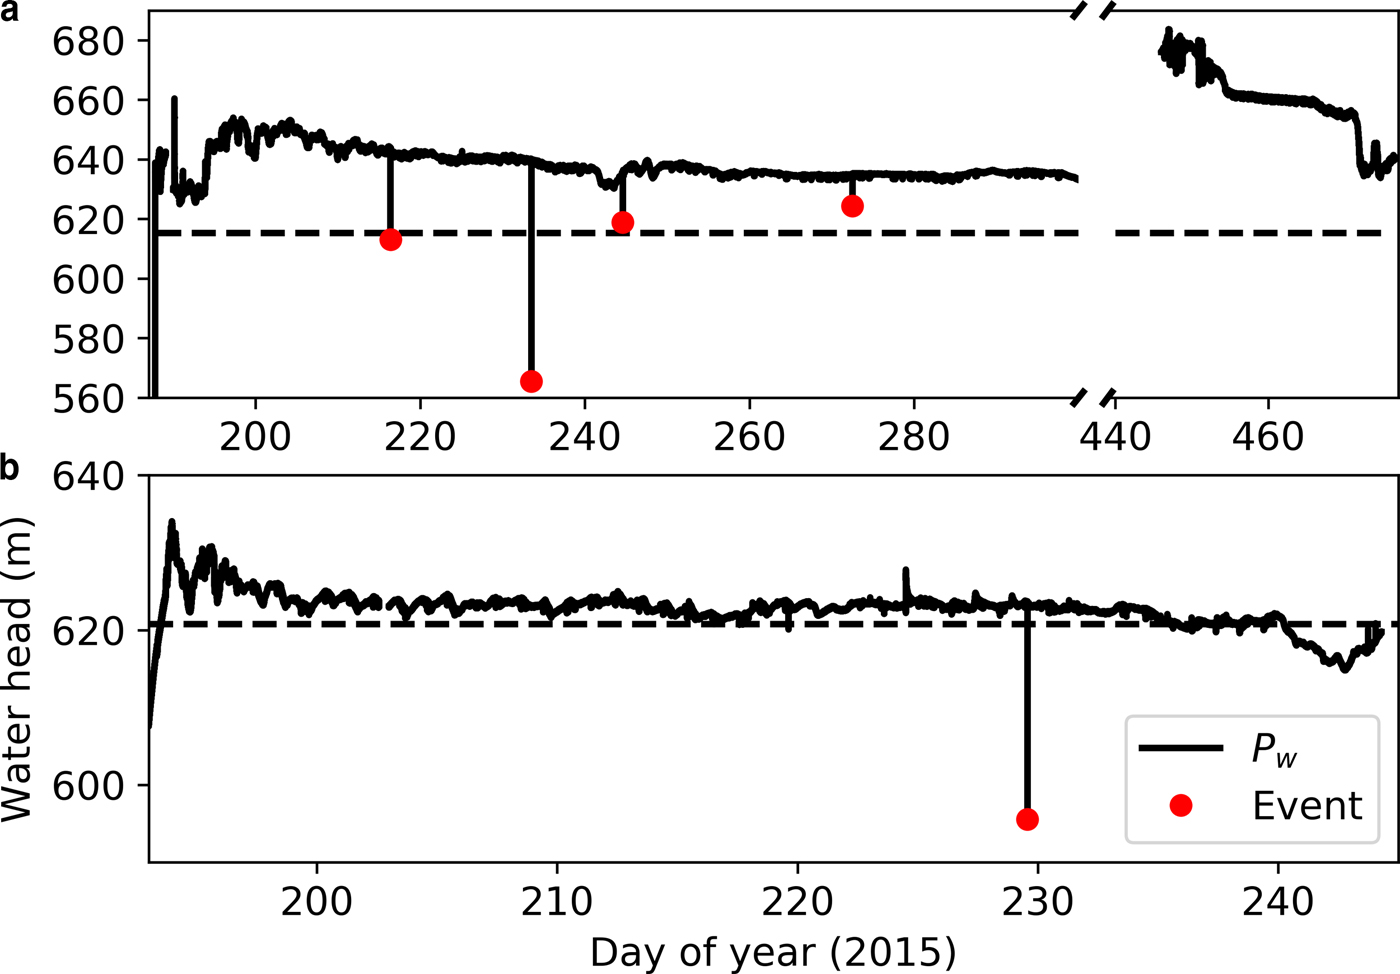
The definition of a pressure ‘pulse’ is somewhat arbitrary, but implies a pressure deviation from and recovery to a longer term trend over a short duration. Data records from the two boreholes show low amplitude noise of ~1 m (e.g. Fig. 3B). We arbitrarily define a pulse to be five times greater than this noise level, and define ‘short duration’ to be <1 min. We therefore consider pressure excursions with amplitudes of at least 5 m, and which return to the long-term trend within 1 min, to be pulses. Four pressure pulses are measured in hole 15-CA which meet our pulse criteria (an additional one on day of year 190 results from drainage of a nearby borehole during drilling and does not reflect a natural perturbation to the basal system) (Fig. 2, Table 1). One pulse event is measured in 15-S (Fig. 2, Table 1). A sharp increase in pressure is also observed on day of year 229 but subsequently decays over more than 8 h.
Pressure pulse examples from GL15-CA (a) and GL15-S (b), measured on days of year 233 and 229, respectively. X-axes are approximate time from the start of the pressure change.

Pressure pulse statistics for the five events measured in holes GL15-CA and GL15-S. Pulse magnitude as a percentage of overburden ice pressure (% OB) is computed assuming an ice density of 917 kg m−3.

All measured pulses occur as pressure drops with amplitudes ranging from 9.6 m to more than 73 m, equivalent to pressure changes of 0.09–0.72 MPa (Table 1). Diurnal pressure variations in the boreholes are no >5–7 m during the melt season; the pressure events can therefore be an order of magnitude larger than measured daily pressure variability.
The shape of pressure events is asymmetric; pressure falls in 1.5 s or less, and recovery is many seconds to tens of seconds (e.g. Fig. 3). While the sample size is small, there is no clear relationship between the magnitude of pressure decline and recovery time. The largest documented event also displays the longest recovery (26 s), but a pressure drop of 27.7 m recovers in 7 s, while a smaller pulse of magnitude 16.1 m recovers in 11 s. None of the pulse events are transmitted between boreholes.
4. DISCUSSION
During a 231 day period on Trapridge Glacier, Kavanaugh (Reference Kavanaugh2009) measured 1467 pressure pulses in one borehole with magnitudes >4.7 m; 70 of these had magnitudes greater than the local ice overburden pressure of 47.2 m. On West Washmawapta Glacier, a total of 199 260 pulses were measured in a single borehole with magnitudes >0.5 m over a 290 day period (Kavanaugh and others, Reference Kavanaugh, Moore, Dow and Sanders2010). Visual inspection shows that more than 1000 of these pulses had magnitudes >5 m (see Kavanaugh and others, Reference Kavanaugh, Moore, Dow and Sanders2010, Fig. 8c). The large numbers of pulses measured in the two studies that have focused on transient pressure variations may suggest that such pulse behavior is a characteristic feature of the basal drainage system. Common pressure sampling intervals of multiple minutes or more in Greenland borehole studies (e.g. Andrews and others, Reference Andrews2014; Wright and others, Reference Wright, Harper, Humphrey and Meierbachtol2016) could alias these variations, therefore failing to capture details of the system with implications for basal processes.
Our measurements in western Greenland do not record such ubiquitous pressure pulse behavior, confirming that frequent, rapid fluctuations in pressure are not universal occurrences at the bed. However, brief pressure deviations are not wholly absent from our time series either. Furthermore, our observations show that the magnitude of pulse events can be large.
4.1 Pressure pulse causality
Pulse behavior could arise from a multitude of processes, and there is no a priori reason to believe that events in a given record must be generated by just one mechanism. The primary aim of this manuscript is to report their presence on the GrIS; detailing the exact mechanism(s) generating pulse behavior is an unconstrained exercise. Nevertheless, their presence compels us to briefly explore potential processes, and our data allow some bounding constraints.
Importantly, none of the measured pulses are transmitted between two boreholes 180 m apart. This result demonstrates that measured pressure pulses are localized events occurring over length scales much less than an ice thickness, in contrast to widespread pressure waves that have been observed elsewhere and interpreted to reflect failure of a spatially extensive sticky spot (cf. Kavanaugh and Clarke, Reference Kavanaugh and Clarke2001).
The cause of local pressure events may depend on whether the immediate drainage system to which the boreholes are connected is open or closed. If the system is open, and drainage elements are transmitting water, pressure pulses could result from brief decreases in water flux. A change in water input from the surface is an unlikely cause, even in the situation of stream capture, because the events are so brief and spatially limited. A more likely scenario might be a nearly instantaneous change in hydraulic connection at the bed. We would expect temporary blockage of a water-transmitting orifice from loose sediment to yield a pressure curve that slowly declines as the orifice is blocked and rapidly recovers as the blockage is flushed. This conceptualized asymmetry is opposite of the measured pulse curves. Alternatively, pressure disturbances could be caused by connection to an adjacent cavity at lower pressure. In this scenario, the asymmetric pulse curve would reflect establishment of a hydrologic connection that occurred much more quickly than the subsequent pressure equilibration from water flow.
If the local system is closed, then it is possible to generate pulses through small volume changes in water cavity volume at the bed (Kavanaugh, Reference Kavanaugh2009; Kavanaugh and others, Reference Kavanaugh, Moore, Dow and Sanders2010). Explaining the pressure drops we measure through volume change requires an expansion of ~10−2%. The consistently high pressures we measure satisfy a critical requirement for basal crevassing (van der Veen, Reference van der Veen1998), but appealing to basal crevasses as a volume expansion mechanism is only reasonable if the crevasse volume is an extremely small fraction of the isolated drainage system. Direct observations in a different borehole at the site identified isolated cavity volumes on the order of 1–7 m3 (Meierbachtol and others, Reference Meierbachtol, Harper, Humphrey and Wright2016). If we assume that this volume is a characteristic of cavities at the site, then expansion by basal crevassing requires that fractures are much smaller than those previously observed on smaller alpine glaciers (e.g. Harper and others, Reference Harper, Bradford, Humphrey and Meierbachtol2010).
Rather than expanding the drainage system by generating new void space from basal crevasses, small volume expansion could occur from mechanical forcing through brief stress transients in the ice. Kavanaugh (Reference Kavanaugh2009) and Kavanaugh and others (Reference Kavanaugh, Moore, Dow and Sanders2010) interpreted the frequently observed pulses on Trapridge and West Washmawapta glaciers to reflect these stress transients, generated by episodic failure along the ice–bed interface. Both of these glaciers are underlain by soft sediment, implying that failure was controlled by coulomb-plastic behavior of the subglacial till. In contrast, drilling tests and borehole experiments at our site indicate predominantly hard bed conditions, with perhaps a thin and discontinuous mantle of sediment (Harper and others, Reference Harper, Humphrey, Meierbachtol, Graly and Fischer2017). There is no reason why stick–slip motion should not occur beneath hard-bedded glaciers as well (e.g. Hubbard, Reference Hubbard2002; Cohen and others, Reference Cohen2005). However, if slip-induced stress transients are the cause of observed pulses, this implies that local stick–slip behavior at the bed is rare, supporting Kavanaugh's (Reference Kavanaugh2009) assertion that frequent pulse behavior may be a characteristic of soft-bedded glaciers and can be revealing of bed conditions.
4.2 Implications for erosion processes
Regardless of their cause, considering that our data support a hard-bedded setting at our study site, then even the infrequent occurrence of pressure pulses may still have implications for bedrock quarrying processes. By controlling local basal water pressure beneath Engabreen, Norway through pumping experiments, Cohen and others (Reference Cohen, Hooyer, Iverson, Thomason and Jackson2006) showed that acoustic emissions associated with a known pre-existing fracture in a bedrock step increased in response to reductions in basal water pressure on the step's lee side. These results indicated that water pressure fluctuations promoted quarrying by causing stress requirements for bedrock fracture to be exceeded.
Cohen's findings supported earlier work by Iverson (Reference Iverson1991) and Hallet (Reference Hallet1996), who investigated the role of water pressure fluctuations in quarrying processes from modeling perspectives. Through finite element modeling of the stress state in a bedrock step with a water cavity in its lee side, Iverson (Reference Iverson1991) showed that a pressure reduction in the cavity removed back-stress on the bedrock lee face, and increased the normal ice pressure on the bedrock just upstream. This generated deviatoric stresses within the bedrock that were sufficient to overcome fracture criteria in pre-existing bedrock cracks.
Hallet (Reference Hallet1996) reached a similar conclusion using an analytical model based on the spatially averaged stress state of bedrock in contact with ice over a bedrock ledge. His results showed that the stress concentration in bedrock arising from the difference between ice normal pressure on the bedrock ledge and water pressure in its lee side cavity was sufficient to propagate bedrock fractures.
Model set-up in Iverson's (Reference Iverson1991) simulations was guided by field observations, and illustrated that conditions for bedrock fracture were reached when cavity pressure was reduced by 0.6 MPa. More generally, Hallet (Reference Hallet1996) indicated that a cavity water pressure reduction of 1 MPa could induce a deviatoric stress of nearly 10 MPa when basal water coverage is extensive. These values bound the largest pressure head drop we measure, at 0.72 MPa. The exact conditions required to exceed the bedrock fracture threshold are of course unknown and depend on local conditions such as water coverage along the bed. Nevertheless, combined with the observation that pulses are spatially discrete, the magnitude of pressure pulses we measure at the bed illustrate that it is plausible for such pressure transients to generate deviatoric stress conditions that are favorable to bedrock fracture propagation.
Crack growth rates in bedrock are a highly non-linear function of the stress state in the bedrock (Hallet, Reference Hallet1996). Hence, even rare water pressure deviations at the bed can influence long-term bedrock fracture rates, particularly when such deviations are large.
As an example, Hallet (Reference Hallet1996) found that for a given time period, long-term crack growth rates can be doubled when background tensile stresses in bedrock are perturbed by 25% for a small duration (10−4 as a fraction of the time). Extension of this result to our observations suggests that, despite their rare occurrence and short duration, the pressure transients we measure could enhance long-term fracture propagation rates.
Large pressure diurnals are commonly associated with active regions of the basal drainage system (e.g. Hubbard and others, Reference Hubbard, Sharp, Willis, Nielsen and Smart1995; Murray and Clarke, Reference Murray and Clarke1995). The presence of measured pulses over areas of the bed that are not prone to large diurnal pressure fluctuations suggests that pressure variations can occur in passive regions as well, indicating that significant pressure changes at the bed can be spatially widespread. Over time, the accumulated damage facilitated by pulse behavior could therefore provide a mechanism to enhance basal erosion over Greenland's ablation zone; a region where basal erosion rates have recently been estimated to be orders of magnitude greater than previously thought (Cowton and others, Reference Cowton, Nienow, Bartholomew, Sole and Mair2012).
ACKNOWLEDGEMENTS
Insightful reviews by P. Moore and J. Kavanaugh improved the clarity and content of this paper. This work is funded by SKB, Nagra, Posiva, NWMO and the US National Science Foundation (PP-ANS grants 0909495/1203451). Pressure data are available upon request to the authors.


 Open access