


Introduction
Stress is an integral part of everyday live and the confrontation with actual or perceived stressors disrupts the body’s homeostasis (Sapolsky, Reference Sapolsky2003), triggering both physiological and psychological stress responses (Herman et al., Reference Herman, Figueiredo, Mueller, Ulrich-Lai, Ostrander, Choi and Cullinan2003). Acute and chronic stress have been linked to a range of negative effects on physical and mental health (Chrousos, Reference Chrousos2009). Research conducted on animals and humans suggests that these harmful effects may stem, at least partly, from prolonged exposure to glucocorticoids such as corticosterone and cortisol (Lupien et al., Reference Lupien, De Leon, De Santi, Convit, Tarshish, Nair and Meaney1998; McEwen, Reference McEwen2002). Consequently, neural mechanisms underlying the (acute) cortisol stress response have gained much attention in human neuroscientific research in recent years. In this context, several psychosocial stress induction paradigms have been developed for laboratory use as well as imaging environments (functional magnetic resonance imaging, fMRI) and have been shown to reliably elicit increases in cortisol levels (Berretz, Packheiser, Kumsta, Wolf, & Ocklenburg, Reference Berretz, Packheiser, Kumsta, Wolf and Ocklenburg2021; Dickerson & Kemeny, Reference Dickerson and Kemeny2004; Henze et al., Reference Henze, Giglberger, Bärtl, Konzok, Neidhart, Krause, Serin, Waller, Peter, Kreuzpointner, Speicher, Streit, Veer, Kirsch, Nichols, Kudielka, Wüst, Erk and Walter2025; Noack, Nolte, Nieratschker, Habel, & Derntl, Reference Noack, Nolte, Nieratschker, Habel and Derntl2019; Qiu et al., Reference Qiu, Fan, Zhong, Yang, Wu, Huiqing and Huang2022). Most studies have focused on Blood-Oxygenation-Level-Dependent (BOLD) measures, such as resting state functional connectivity (rsFC) and task-based responses, though the exact nature of the reported effect patterns remains debated (Harrewijn et al., Reference Harrewijn, Vidal-Ribas, Clore-Gronenborn, Jackson, Pisano, Pine and Stringaris2020; Henze et al., Reference Henze, Konzok, Kreuzpointner, Bärtl, Giglberger, Peter and Wüst2021, Reference Henze, Konzok, Kreuzpointner, Bärtl, Peter, Giglberger and Wüst2020; Reference Henze, Giglberger, Bärtl, Konzok, Neidhart, Krause, Serin, Waller, Peter, Kreuzpointner, Speicher, Streit, Veer, Kirsch, Nichols, Kudielka, Wüst, Erk and Walter2025; Noack et al., Reference Noack, Nolte, Nieratschker, Habel and Derntl2019; Van Oort et al., Reference Van Oort, Tendolkar, Hermans, Mulders, Beckmann, Schene and van Eijndhoven2017). Although structural, that is, T1- and/or T2-weighted (T1w/T2w-) images are a by-product of such neuroimaging studies, few analyses have explored associations between structural measures of the brain and acute cortisol stress responses in healthy subjects (Henze et al., Reference Henze, Konzok, Kudielka, Wüst, Nichols and Kreuzpointner2023). Given that numerous studies indicate aberrant brain structural parameters in the context of stress-related disorders (Cardoner et al., Reference Cardoner, Andero, Cano, Marin-Blasco, Porta-Casteràs, Serra-Blasco and Portella2024; Kaul, Schwab, Mechawar, & Matosin, Reference Kaul, Schwab, Mechawar and Matosin2021; McEwen, Nasca, & Gray, Reference McEwen, Nasca and Gray2016; Radley & Morrison, Reference Radley and Morrison2005), it is surprising that the relationship between brain structure and stress-induced cortisol release in a healthy organism remains poorly understood.
Most studies on stress-induced changes in brain structure focus on the hippocampus due to its sensitivity to chronic stress and glucocorticoids, as well as its role in learning, memory, and hypothalamic–pituitary–adrenal (HPA) axis regulation (Herman et al., Reference Herman, Figueiredo, Mueller, Ulrich-Lai, Ostrander, Choi and Cullinan2003, Reference Herman, McKlveen, Ghosal, Kopp, Wulsin, Makinson and Myers2016; Herman, Ostrander, Mueller, & Figueiredo, Reference Herman, Ostrander, Mueller and Figueiredo2005; Jankord & Herman, Reference Jankord and Herman2008). Moreover, prolonged glucocorticoid-exposure, for example, due to chronic stress, has been linked to hippocampal volume reduction and neurotoxic effects on neurons involved in learning and memory (Cardoner et al., Reference Cardoner, Andero, Cano, Marin-Blasco, Porta-Casteràs, Serra-Blasco and Portella2024; Kaul et al., Reference Kaul, Schwab, Mechawar and Matosin2021; McEwen et al., Reference McEwen, Nasca and Gray2016; Radley & Morrison, Reference Radley and Morrison2005). Other regions, such as the medial prefrontal cortex (mPFC) and amygdala, have gained attention for their importance in orchestrating stress responses and the processing, acquisition, and extinction of fear memories (Alexandra Kredlow, Fenster, Laurent, Ressler, & Phelps, Reference Alexandra Kredlow, Fenster, Laurent, Ressler and Phelps2022; Herman et al., Reference Herman, McKlveen, Ghosal, Kopp, Wulsin, Makinson and Myers2016; Jankord & Herman, Reference Jankord and Herman2008; Van Oort et al., Reference Van Oort, Tendolkar, Hermans, Mulders, Beckmann, Schene and van Eijndhoven2017). Thus, volume and thickness reductions in these areas appear to be more likely depending on the stress-related condition (e.g. post-traumatic stress disorder, PTSD; major depressive; and anxiety disorder; 16, 17). The few studies reporting on associations between brain structure and acute cortisol stress reactions in response to psychosocial stressors in healthy human subjects also focused on these regions (Henze et al., Reference Henze, Konzok, Kudielka, Wüst, Nichols and Kreuzpointner2023). However, it is becoming increasingly clear that other striato-limbic structures also deserve significant attention (Cardoner et al., Reference Cardoner, Andero, Cano, Marin-Blasco, Porta-Casteràs, Serra-Blasco and Portella2024; Henze et al., Reference Henze, Konzok, Kudielka, Wüst, Nichols and Kreuzpointner2023; Kaul et al., Reference Kaul, Schwab, Mechawar and Matosin2021). Moreover, while much of the existing literature has focused on cortical thickness and regional volume, cortical surface area provides complementary and non-redundant information for several reasons. First, cortical surface area and cortical thickness have largely distinct genetic determinants, with studies consistently reporting near-zero genetic correlation between the two measures. This genetic dissociation is reflected in spatially distinct cortical topographies, supporting the view that surface area and thickness index separable neurodevelopmental and biological processes (Y. Huang et al., Reference Huang, Wu, Li, Wang, Wang, Xing and Li2023; Panizzon et al., Reference Panizzon, Fennema-Notestine, Eyler, Jernigan, Prom-Wormley, Neale and Kremen2009; Winkler et al., Reference Winkler, Kochunov, Blangero, Almasy, Zilles, Fox and Glahn2010). Second, although regional volume is mathematically related to both surface area and thickness, it conflates these two largely orthogonal dimensions. As a result, volumetric measures may obscure effects that are specific to surface area–related cortical organization, potentially masking distinct neurobiological mechanisms underlying stress-related cortical changes. Third, cortical surface area has been repeatedly associated with various affective disorders and stress-related phenotypes, suggesting that surface area may be particularly sensitive to processes relevant for stress exposure and stress vulnerability (Fowler & Gaffrey, Reference Fowler and Gaffrey2022; Hu et al., Reference Hu, Sun, Su, Wang, Qiu, Yang and Wang2018; Rimol et al., Reference Rimol, Nesvåg, Hagler, Bergmann, Fennema-Notestine, Hartberg and Dale2012; Stomby et al., Reference Stomby, Boraxbekk, Lundquist, Nordin, Nilsson, Adolfsson and Olsson2016; Sun et al., Reference Sun, Wang, Wang, Dong, Lu, Scheininger and Han2019).
To our knowledge, 12 studies have applied psychosocial stressors in humans to elicit acute cortisol responses and studied their associations with structural brain measures. Of these, only two studies conducted a whole-brain analysis (J. Liu et al., Reference Liu, Chaplin, Wang, Sinha, Mayes and Blumberg2012; Uhlig et al., Reference Uhlig, Reinelt, Lauckner, Kumral, Schaare, Mildner and Gaebler2023), while the rest carried out region of interest (ROI) analyses on two, hippocampus and amygdala (Admon et al., Reference Admon, Treadway, Valeri, Mehta, Douglas and Pizzagalli2017; Fowler & Gaffrey, Reference Fowler and Gaffrey2022), or even just one ROI: hippocampus (Blankenship, Chad-Friedman, Riggins, & Dougherty, Reference Blankenship, Chad-Friedman, Riggins and Dougherty2019; Degering, Linz, Puhlmann, Singer, & Engert, Reference Degering, Linz, Puhlmann, Singer and Engert2023; J. C. Pruessner et al., Reference Pruessner, Dedovic, Khalili-Mahani, Engert, Pruessner, Buss and Lupien2008; M. Pruessner, Pruessner, Hellhammer, Bruce Pike, & Lupien, Reference Pruessner, Pruessner, Hellhammer, Bruce Pike and Lupien2007), amygdala (Barry et al., Reference Barry, Murray, Fearon, Moutsiana, Johnstone and Halligan2017; Klimes-Dougan et al., Reference Klimes-Dougan, Eberly, Westlund Schreiner, Kurkiewicz, Houri, Schlesinger and Cullen2014), and perigenual ACC (pACC; Boehringer et al., Reference Boehringer, Tost, Haddad, Lederbogen, Wüst, Schwarz and Meyer-Lindenberg2015). Only one study examined more than two ROIs and thereby considered both subcortical volume and cortical thickness (Henze et al., Reference Henze, Konzok, Kudielka, Wüst, Nichols and Kreuzpointner2023). However, no consistent pattern of association emerges from these studies, which is probably due to several factors: Variations in focus on different aspects of the cortisol response (such as total cortisol release, acute increase, recovery phase, or distinct response types), small sample sizes (average $ n=54 $
), and unaccounted factors like age, sex, gender, or, in females, menstrual cycle phase, hormonal contraception, and reproductive status. Additionally, differences in stress induction paradigms (e.g. Trier Social Stress Test or similar methods) and methodological inconsistencies (such as timing of stress induction or assessing cortisol and structural data on different days) further contributed to the discrepancies.
$ n=54 $
), and unaccounted factors like age, sex, gender, or, in females, menstrual cycle phase, hormonal contraception, and reproductive status. Additionally, differences in stress induction paradigms (e.g. Trier Social Stress Test or similar methods) and methodological inconsistencies (such as timing of stress induction or assessing cortisol and structural data on different days) further contributed to the discrepancies.
In a recent study (Henze et al., Reference Henze, Konzok, Kudielka, Wüst, Nichols and Kreuzpointner2023), we have addressed some of these aspects using Permutation Analysis of Linear Models (PALM), controlling for age, sex, and total brain volume (TBV), to investigate the relationship between (sex-specific) cortisol increases to acute psychosocial stress and anatomical variables of 12 striato-limbic structures (i.e. volume and thickness, lateralized). ScanSTRESS, a psychosocial stress induction paradigm for imaging environments based on the Trier Social Stress Test (TSST; Henze et al., Reference Henze, Konzok, Kreuzpointner, Bärtl, Peter, Giglberger and Wüst2020; Streit et al., Reference Streit, Haddad, Paul, Frank, Schafer, Nikitopoulos and Wüst2014), was completed in the afternoon by 66 healthy and young (18–33 years) subjects (31 females taking oral contraceptives; this sample was first described elsewhere, Henze et al., Reference Henze, Konzok, Kreuzpointner, Bärtl, Peter, Giglberger and Wüst2020). This exploratory study indicated sex-specific associations between brain structure and increases in cortisol levels, particularly in striatal and frontal regions. With the current study, we aimed at confirming these findings by including additional ScanSTRESS samples comprised of healthy subjects (Bärtl et al., Reference Bärtl, Henze, Peter, Giglberger, Bohmann, Speicher and Kudielka2024; Giglberger et al., Reference Giglberger, Peter, Henze, Kraus, Bärtl, Konzok and Wüst2023; Konzok et al., Reference Konzok, Henze, Peter, Giglberger, Bärtl, Massau and Kudielka2021; Speicher et al., Reference Speicher, Henze, Bärtl, Böhm, Sommer, Wüst and Kudielka2023), increasing the total sample size to 291 subjects (157 females). Beyond replication, the present study aimed to systematically examine the relationship between acute cortisol stress responsivity and cortical morphology across multiple analytical scales. To this end, the present work follows a staged analytical approach: First, we conducted a confirmatory analysis in which we reapplied PALM to test the robustness of previously reported cortisol–brain structure associations (Henze et al., Reference Henze, Konzok, Kudielka, Wüst, Nichols and Kreuzpointner2023) in a substantially larger sample. Second, we extended this confirmatory analysis using a data-driven, hypothesis-free whole-brain approach implemented in FreeSurfer, enabling a comprehensive assessment of cortisol-related structural variation across the cortisol surface. Ultimately, we employed a multivariate machine learning (ML) framework to predict individual cortisol responses from whole-brain structural measures. Together, this progression of analyses (from confirmatory group-level inference to exploratory whole-brain mapping and multivariate individual-level prediction) enables assessment of the robustness, spatial specificity, and predictive relevance of cortisol–brain structure associations.
Methods and materials
Subjects
This study is based on samples of five independent studies that implemented the ScanSTRESS protocol on the same scanner with identical parameters and used the same assay for cortisol determination across all studies (Bärtl et al., Reference Bärtl, Henze, Peter, Giglberger, Bohmann, Speicher and Kudielka2024; Giglberger et al., Reference Giglberger, Peter, Henze, Kraus, Bärtl, Konzok and Wüst2023; Henze et al., Reference Henze, Konzok, Kreuzpointner, Bärtl, Peter, Giglberger and Wüst2020; Konzok et al., Reference Konzok, Henze, Peter, Giglberger, Bärtl, Massau and Kudielka2021; Speicher et al., Reference Speicher, Henze, Bärtl, Böhm, Sommer, Wüst and Kudielka2023). From the Regensburg Burnout Project sample, only healthy subjects were included (Bärtl et al., Reference Bärtl, Henze, Peter, Giglberger, Bohmann, Speicher and Kudielka2024). Additionally, we included data exclusively from subjects who underwent the original version of ScanSTRESS (Speicher et al., Reference Speicher, Henze, Bärtl, Böhm, Sommer, Wüst and Kudielka2023). In total, $ 291 $
subjects
$ 291 $
subjects $ \left(18-62\hskip0.42em \mathrm{years},\mathrm{mean}\hskip0.52em \mathrm{age}\hskip0.52em 26.16\pm 8.95\right) $
were analyzed, comprising 134 males
$ \left(18-62\hskip0.42em \mathrm{years},\mathrm{mean}\hskip0.52em \mathrm{age}\hskip0.52em 26.16\pm 8.95\right) $
were analyzed, comprising 134 males $ \left(18-60\hskip0.5em \mathrm{years},\mathrm{mean}\hskip0.5em \mathrm{age}\hskip0.5em 26.65\pm 8.23\right) $
and 157 females
$ \left(18-60\hskip0.5em \mathrm{years},\mathrm{mean}\hskip0.5em \mathrm{age}\hskip0.5em 26.65\pm 8.23\right) $
and 157 females $ \left(18-62\hskip0.42em \mathrm{years},\mathrm{mean}\hskip0.42em \mathrm{age}\hskip0.42em 25.74\pm 9.53\right) $
. Of those female subjects,
$ \left(18-62\hskip0.42em \mathrm{years},\mathrm{mean}\hskip0.42em \mathrm{age}\hskip0.42em 25.74\pm 9.53\right) $
. Of those female subjects, $ 81 $
were tested during their luteal phase of the menstrual cycle,
$ 81 $
were tested during their luteal phase of the menstrual cycle, $ 64 $
were taking hormonal contraceptives, and
$ 64 $
were taking hormonal contraceptives, and $ 12 $
were post-menopausal.
$ 12 $
were post-menopausal.
Subjects were recruited via flyers and social media platforms. General exclusion criteria across all studies comprised the following: self-reported history of one or more current psychiatric, neurological, or endocrine disorders; treatment with psychotropic drugs or other medications affecting central nervous system or endocrine function; daily alcohol consumption; incompatibilities with MRI (e.g. metal parts, pregnancy); and regular night shifts. Study-specific exclusion criteria are detailed in the original research reports. All subjects provided written informed consent and received financial compensation for their participation. All studies were approved by the local ethics committee of the University of Regensburg.
General procedure
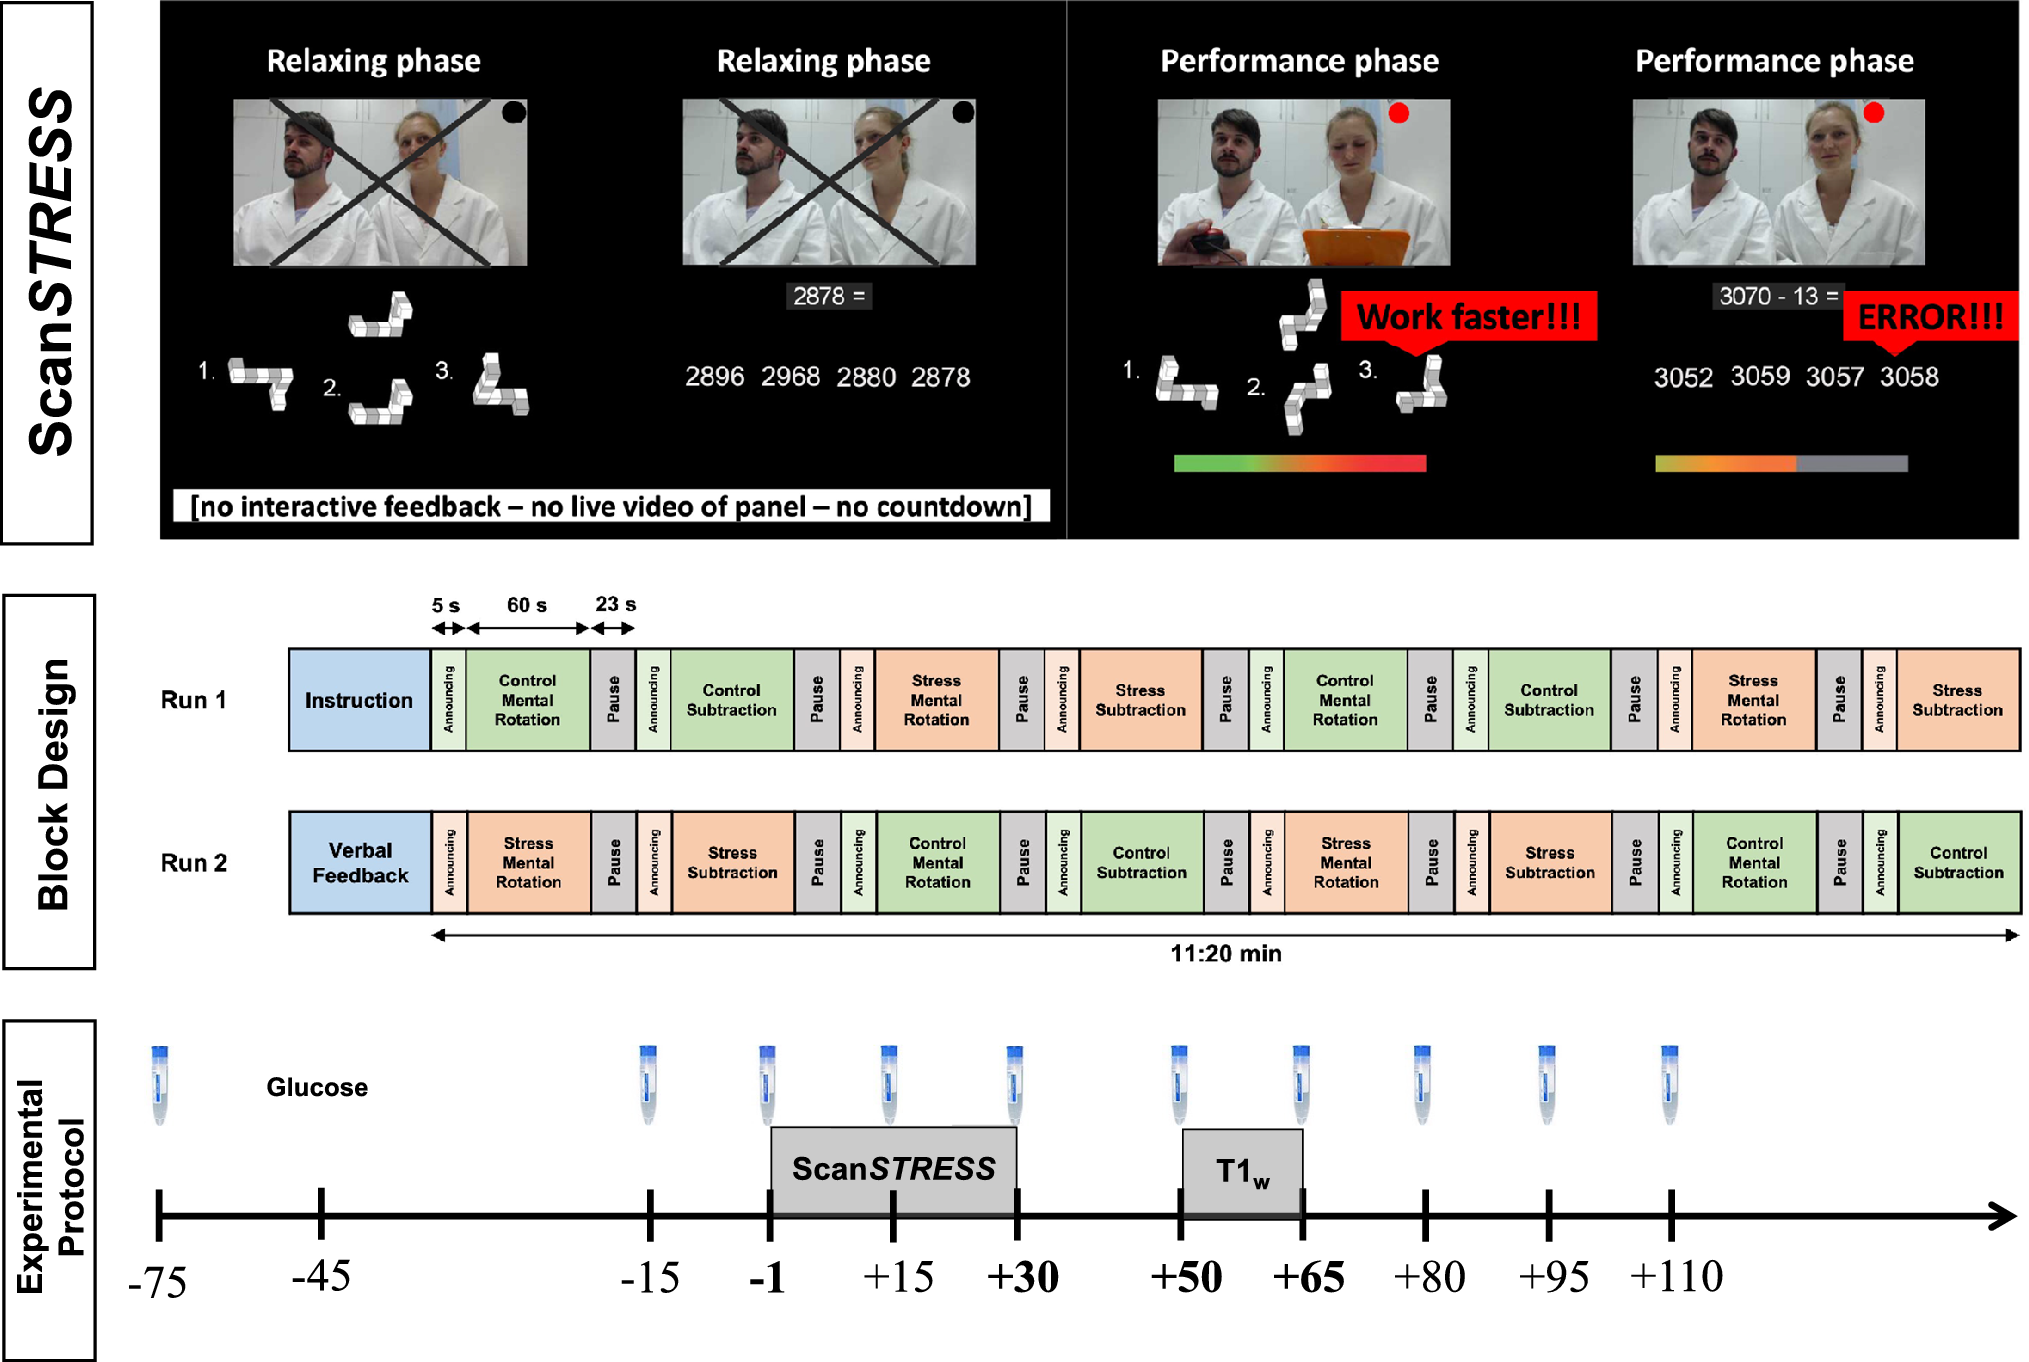
The test protocol sequence, an overview of ScanSTRESS, and its block design are shown in Figure 1. Test sessions took place between 1 and 6 pm to minimize the influence of the circadian rhythm of cortisol secretion (Kudielka, Schommer, Hellhammer, & Kirschbaum, Reference Kudielka, Schommer, Hellhammer and Kirschbaum2004; Zänkert, Bellingrath, Wüst, & Kudielka, Reference Zänkert, Bellingrath, Wüst and Kudielka2019). Subjects arrived at the laboratory 75 minutes before the stress induction followed by a relaxation phase after the first saliva sample was taken to measure cortisol. A total of ten saliva samples were collected $ \Big(-75,-15,-1,+15,+30,+50,+65,+80,+95,\mathrm{and}+110\hskip0.5em \min $
) using ‘cortisol salivettes’ (Sarstedt, Nuembrecht, Germany); three before, one during, and further six after ScanSTRESS, with sample −1 referring to stress onset. The saliva samples were analyzed using a time-resolved fluorescence immunoassay with fluorometric endpoint detection (dissociation-enhanced lanthanide fluorescence immunoassay, DELFIA, Dressendörfer et al., Reference Dressendörfer, Kirschbaum, Rohde, Stahl and Strasburger1992) with an intra-assay coefficient of variation between
$ \Big(-75,-15,-1,+15,+30,+50,+65,+80,+95,\mathrm{and}+110\hskip0.5em \min $
) using ‘cortisol salivettes’ (Sarstedt, Nuembrecht, Germany); three before, one during, and further six after ScanSTRESS, with sample −1 referring to stress onset. The saliva samples were analyzed using a time-resolved fluorescence immunoassay with fluorometric endpoint detection (dissociation-enhanced lanthanide fluorescence immunoassay, DELFIA, Dressendörfer et al., Reference Dressendörfer, Kirschbaum, Rohde, Stahl and Strasburger1992) with an intra-assay coefficient of variation between $ 4.0\%\hskip0.5em \mathrm{and}\hskip0.5em 6.7\% $
and an inter-assay coefficient of variation between
$ 4.0\%\hskip0.5em \mathrm{and}\hskip0.5em 6.7\% $
and an inter-assay coefficient of variation between $ 7.1\%\hskip0.5em \mathrm{and}\hskip0.5em 9.0\% $
.
$ 7.1\%\hskip0.5em \mathrm{and}\hskip0.5em 9.0\% $
.
Experimental protocol. Illustration of ScanSTRESS and its block design, repeated collection of salivary cortisol, glucose administration, and acquisition of ScanSTRESS-responses as well as T1-weighted (T1w-) images.

The ScanSTRESS paradigm is a block-designed protocol with alternating stress and control blocks presented in two runs. During control blocks, subjects perform simple figure and number matching tasks, while stress blocks involve rotation and arithmetic tasks under the supervision of a panel in professional attire, under time pressure, and with constant negative feedback. We used an improved version of the original protocol (Streit et al., Reference Streit, Haddad, Paul, Frank, Schafer, Nikitopoulos and Wüst2014) across all included studies to enhance the stress-induced responses without changing the paradigm (Henze et al., Reference Henze, Konzok, Kreuzpointner, Bärtl, Peter, Giglberger and Wüst2020). This improvement included: First, a 45-min relaxation phase was introduced to ensure low baseline cortisol levels, along with a detailed explanation of the scanning procedure to reduce pre-scan anxiety (McGlynn, Smitherman, Hammel, & Lazarte, Reference McGlynn, Smitherman, Hammel and Lazarte2007; Thorpe, Salkovskis, & Dittner, Reference Thorpe, Salkovskis and Dittner2008). Second, subjects received a sugary drink (75 g glucose in 200 ml herbal tea) to boost cortisol reactivity (Zänkert, Kudielka, & Wüst, Reference Zänkert, Kudielka and Wüst2020). Third, the interval between the end of the relaxation period and the onset of the stress task inside the MRI scanner was kept below 10 min, ensuring a more abrupt transition from relaxation to stress exposure (Henze et al., Reference Henze, Konzok, Kreuzpointner, Bärtl, Peter, Giglberger and Wüst2020). After ScanSTRESS exposure, study-specific acquisitions were conducted (i.e. a resting state sequence in all studies except one in which a moral decision paradigm was conducted, Speicher et al., Reference Speicher, Henze, Bärtl, Böhm, Sommer, Wüst and Kudielka2023), followed by an anatomical assessment for all subjects.
Data analysis
To determine potential relationships between acute cortisol stress responses and neural structural measures, we preprocessed both variables as follows. A cortisol increase was defined as the difference between the peak cortisol level $ \left(\mathrm{sample}\hskip0.52em +30,\hskip0.52em ,+50,\hskip0.52em ,+65\right) $
and the pre-stress cortisol level
$ \left(\mathrm{sample}\hskip0.52em +30,\hskip0.52em ,+50,\hskip0.52em ,+65\right) $
and the pre-stress cortisol level $ \left(\mathrm{sample}-1\right) $
, as marked in bold in Figure 1. We focused on cortisol increase as it captures acute stress exposure and HPA axis reactivity-latency (Dickerson & Kemeny, Reference Dickerson and Kemeny2004), while area under the curve measures includes pre-stress and recovery phases, reflecting total cortisol release.
$ \left(\mathrm{sample}-1\right) $
, as marked in bold in Figure 1. We focused on cortisol increase as it captures acute stress exposure and HPA axis reactivity-latency (Dickerson & Kemeny, Reference Dickerson and Kemeny2004), while area under the curve measures includes pre-stress and recovery phases, reflecting total cortisol release.
Neuroimaging data were collected using a Siemens MAGNETOM Prisma $ 3T $
MRI (Siemens Healthcare, Erlangen, Germany) with a 64-channel head coil. Two series of planar BOLD echo sequences (ScanSTRESS), multiband resting state (results to be published), and anatomical sequences were performed. Anatomical measurements included a 3D structural T1w-image
$ 3T $
MRI (Siemens Healthcare, Erlangen, Germany) with a 64-channel head coil. Two series of planar BOLD echo sequences (ScanSTRESS), multiband resting state (results to be published), and anatomical sequences were performed. Anatomical measurements included a 3D structural T1w-image $ \hskip0.5em \left(\mathrm{T}1/\mathrm{TR}/\mathrm{TE}=1200/2400/2.18\hskip0.42em \mathrm{ms},\mathrm{flip}\ \mathrm{angle}=8,\mathrm{distance}\ \mathrm{factor}=50\%\right) $
. Anatomical images were initially segmented using SynthSeg, a convolutional neural network-based technique robust to variations in contrast and resolution (Billot et al., Reference Billot, Greve, Puonti, Thielscher, Van Leemput, Fischl and Iglesias2023). Further preprocessing was conducted using ENIGMA HALFpipe (Waller et al., Reference Waller, Erk, Pozzi, Toenders, Haswell, Büttner and Veer2022), which integrates fMRIprep, FSL, and FreeSurfer. FreeSurfer was used for cortical parcellation and subcortical segmentation of the T1w-volume, including estimation of TBV (‘BrainSegVolNotVent’). Preprocessing steps included non-brain tissue removal, automatic Talairach transformation, segmentation, intensity normalization, gray/white matter boundary tessellation, topology correction, and surface shaping. Additionally, the structural output of each subject was visually inspected before extracting subcortical volume, cortical thickness, and surface area measurements of pre-limbic structures for each hemisphere using asegstats2table and aparcstats2table.
$ \hskip0.5em \left(\mathrm{T}1/\mathrm{TR}/\mathrm{TE}=1200/2400/2.18\hskip0.42em \mathrm{ms},\mathrm{flip}\ \mathrm{angle}=8,\mathrm{distance}\ \mathrm{factor}=50\%\right) $
. Anatomical images were initially segmented using SynthSeg, a convolutional neural network-based technique robust to variations in contrast and resolution (Billot et al., Reference Billot, Greve, Puonti, Thielscher, Van Leemput, Fischl and Iglesias2023). Further preprocessing was conducted using ENIGMA HALFpipe (Waller et al., Reference Waller, Erk, Pozzi, Toenders, Haswell, Büttner and Veer2022), which integrates fMRIprep, FSL, and FreeSurfer. FreeSurfer was used for cortical parcellation and subcortical segmentation of the T1w-volume, including estimation of TBV (‘BrainSegVolNotVent’). Preprocessing steps included non-brain tissue removal, automatic Talairach transformation, segmentation, intensity normalization, gray/white matter boundary tessellation, topology correction, and surface shaping. Additionally, the structural output of each subject was visually inspected before extracting subcortical volume, cortical thickness, and surface area measurements of pre-limbic structures for each hemisphere using asegstats2table and aparcstats2table.
In confirmatory analysis, PALM (Winkler, Ridgway, Webster, Smith, & Nichols, Reference Winkler, Ridgway, Webster, Smith and Nichols2014) was used to investigate potential relationships between individual cortisol stress responses and structural measures of the limbic system. As described in our previous study (Henze et al., Reference Henze, Konzok, Kudielka, Wüst, Nichols and Kreuzpointner2023), the following ROIs were selected based on the current literature on the interaction between neural substrates and acute HPA axis responses (Harrewijn et al., Reference Harrewijn, Vidal-Ribas, Clore-Gronenborn, Jackson, Pisano, Pine and Stringaris2020; Henze et al., Reference Henze, Giglberger, Bärtl, Konzok, Neidhart, Krause, Serin, Waller, Peter, Kreuzpointner, Speicher, Streit, Veer, Kirsch, Nichols, Kudielka, Wüst, Erk and Walter2025; Van Oort et al., Reference Van Oort, Tendolkar, Hermans, Mulders, Beckmann, Schene and van Eijndhoven2017): volumes were extracted for the thalamus, striatum (ncl. caudatus, ncl. accumbens, and putamen), hippocampus, and amygdala. Cortical thickness and surface area were measured for the cingulate cortex (CC: rostral anterior cingulate cortex, rACC; caudal anterior cingulate cortex, cACC; and posterior cingulate cortex, PCC), parahippocampus, the orbitofrontal cortex (OFC: lateral OFC, lOFC; and medial OFC, mOFC), insula, and precuneus. Note that, we use the terminology based on Destrieux- and Desikan-Killiany atlases (Desikan et al., Reference Desikan, Ségonne, Fischl, Quinn, Dickerson, Blacker and Killiany2006; Destrieux, Fischl, Dale, & Halgren, Reference Destrieux, Fischl, Dale and Halgren2010). However, in other literature (Shackman et al., Reference Shackman, Salomons, Slagter, Fox, Winter and Davidson2011), the rACC is often split into subgenual and pACC, the cACC is called anterior mid-CC (aMCC) or commonly dACC, and the PCC is referred to as posterior mid-CC (pMCC). Six models were tested, where lateralized structural measures (volume, thickness, and surface area) of the left and right hemispheres were separately used as dependent variables, given the assumption that HPA axis regulation may be lateralized (Cerqueira, Almeida, & Sousa, Reference Cerqueira, Almeida and Sousa2008) and following our preliminary results (Henze et al., Reference Henze, Konzok, Kudielka, Wüst, Nichols and Kreuzpointner2023). Since sex, age, and TBV can influence structural brain measures (Giedd et al., Reference Giedd, Blumenthal, Jeffries, Castellanos, Liu, Zijdenbos and Rapoport1999; Moog et al., Reference Moog, Nolvi, Kleih, Styner, Gilmore, Rasmussen and Buss2021), these variables were included as covariates, with TBV considered only in volumetric models. In addition, menstrual cycle phase, hormonal contraceptive use, and reproductive status also influence brain structure (Brønnick, Økland, Graugaard, & Brønnick, Reference Brønnick, Økland, Graugaard and Brønnick2020; B. Pletzer, Winkler-Crepaz, & Hillerer, Reference Pletzer, Winkler-Crepaz and Hillerer2023; Song et al., Reference Song, Patton, Friedman, Mahajan, Nordlicht, Sayed and Lipton2023). Therefore, each of the six models with lateralized structural measures as dependent variables included cycle (male, luteal phase, contraception, post-menopause; dummy-coded with male as reference), age (continuous), and TBV (continuous, where appropriate) as control variables, along with individual (sex-specific) cortisol increases (continuous) as predictors. This grouping variable was implemented as follows, for instance, male cortisol increase was coded to contain the actual cortisol increase value for male subjects and 0 for female subjects; the same procedure was applied for female cortisol increase, but in a reverse order. This approach allowed us to correct for and investigate the possible influence of sex-specific cortisol responses. To test for the general relationship between cortisol increase and brain structure (independent of sex), the influence of both variables, male and female cortisol increase, was tested simultaneously (see Supplementary Methods for tested statistical model, Henze et al., Reference Henze, Konzok, Kudielka, Wüst, Nichols and Kreuzpointner2023). We did not create a variable to differentiate cortisol increases based on the cycle categories, even though such differences were reported (Zänkert et al., Reference Zänkert, Bellingrath, Wüst and Kudielka2019), because although there was significant variation among groups $ F\left(3,287\right)=13.70,p<.000\Big) $
, this was driven by significant differences between males compared to two female categories (luteal phase,
$ F\left(3,287\right)=13.70,p<.000\Big) $
, this was driven by significant differences between males compared to two female categories (luteal phase, $ p<.000 $
; contraceptive users,
$ p<.000 $
; contraceptive users, $ p<.000\Big) $
, but not among the female categories
$ p<.000\Big) $
, but not among the female categories $ \left(p>.637\right) $
(Supplementary Table S1). Multiple comparisons were corrected for each modality (e.g. left hemisphere cortical thickness) across all ROIs using the False Discovery Rate (FDR) -fdr option.
$ \left(p>.637\right) $
(Supplementary Table S1). Multiple comparisons were corrected for each modality (e.g. left hemisphere cortical thickness) across all ROIs using the False Discovery Rate (FDR) -fdr option.
In the first stage of exploratory analyses, FreeSurfer’s (version 7.4.1) vertex-wise general linear model (GLM)-based group analyses were performed to investigate the relationship between sex-specific cortisol responses and structural measures of the entire cortex without prior assumptions about regions. Subjects’ cortical surface was first mapped onto the fsaverage template, smoothed with a $ 10\hskip0.5em \mathrm{mm} $
full width at half-maximum kernel and concatenated into a single data set for each hemisphere (mris_preproc). In the GLM (mri_glmfit, Different Offset, Different Slope), volume, thickness, and surface area were dependent variables, while sex-specific cortisol increase was the predictor, and the confounding effects of cycle and age were controlled. As in PALM analyses, sex-independent and sex-specific cortisol increase were evaluated separately using corresponding contrast matrices in vertex-based analyses. Monte Carlo Simulation cluster analyses at a significance level of
$ 10\hskip0.5em \mathrm{mm} $
full width at half-maximum kernel and concatenated into a single data set for each hemisphere (mris_preproc). In the GLM (mri_glmfit, Different Offset, Different Slope), volume, thickness, and surface area were dependent variables, while sex-specific cortisol increase was the predictor, and the confounding effects of cycle and age were controlled. As in PALM analyses, sex-independent and sex-specific cortisol increase were evaluated separately using corresponding contrast matrices in vertex-based analyses. Monte Carlo Simulation cluster analyses at a significance level of $ p=.050 $
were used to correct for multiple comparisons (mri_glmfit-sim –2spaces). The cluster-forming threshold was set to 3.0 to prevent inflated false positives (Greve & Fischl, Reference Greve and Fischl2018).
$ p=.050 $
were used to correct for multiple comparisons (mri_glmfit-sim –2spaces). The cluster-forming threshold was set to 3.0 to prevent inflated false positives (Greve & Fischl, Reference Greve and Fischl2018).
As further exploratory analyses, a ML approach, ridge regression, was employed to predict subjects’ cortisol stress response from their volume, thickness, and surface area measures (158 features in total). Although the GLM is a standard method for localizing the relationship between cortisol increase and structural brain measures, evaluating the generalizability of these associations is not straightforward. However, ML inherently enables out-of-sample evaluation, which is essential for evaluating generalizability (Kriegeskorte, Simmons, Bellgowan, & Baker, Reference Kriegeskorte, Simmons, Bellgowan and Baker2009). Additionally, as the generative process is reversed in ML compared to GLM, it allows for the extraction of complex multivariate patterns in brain measures to predict cortisol response, thereby enabling the identification of the physiological stress state at the subject level. Briefly, ridge regression was fit and evaluated within a ten-repeated nested cross-validation framework: ten outer folds for model evaluation and five inner folds for hyperparameter optimization. Ridge regression is a type of multivariate linear regression that incorporates regularization, which shrinks the coefficients of uninformative features, thereby making it more robust to multicollinearity (Hoerl & Kennard, Reference Hoerl and Kennard1970). Cross-validation is a standard approach for evaluating the predictive performance of a model by splitting the data into training and test sets recursively. As cross-validation is a stochastic approach (i.e. the data are split randomly), we repeated the cross-validation ten times to reduce arbitrariness (Varoquaux et al., Reference Varoquaux, Raamana, Engemann, Hoyos-Idrobo, Schwartz and Thirion2017). Additionally, the potential confounding effect of cycle was corrected using a cross-validated confound-correction technique to avoid any possible data leakage (Snoek, Miletić, & Scholte, Reference Snoek, Miletić and Scholte2019). Age was not corrected as it was not found to be associated with cortisol increase $ \left(F\left(289,1\right)=.819,\hskip0.5em p=.366\right) $
. The model performance was evaluated using correlation coefficient (r) and tested against a null distribution using permutation testing (Ojala & Garriga, Reference Ojala and Garriga2009) with 1000 permutations for significance. Shapley additive explanations (SHAP) were used to evaluate the contributions of brain measures to the prediction performance (Lundberg & Lee, Reference Lundberg and Lee2017). Details of model interpretation are given in Supplementary Methods.
$ \left(F\left(289,1\right)=.819,\hskip0.5em p=.366\right) $
. The model performance was evaluated using correlation coefficient (r) and tested against a null distribution using permutation testing (Ojala & Garriga, Reference Ojala and Garriga2009) with 1000 permutations for significance. Shapley additive explanations (SHAP) were used to evaluate the contributions of brain measures to the prediction performance (Lundberg & Lee, Reference Lundberg and Lee2017). Details of model interpretation are given in Supplementary Methods.
Results
Sample characteristics of sex-specific cortisol increase and TBV are given in Supplementary Table S2. Female subjects showed a significantly lower cortisol response to the stress stimulus than males $ \left(t(290)=-6.291,\hskip0.5em p=.001\right) $
and exhibited lower TBV
$ \left(t(290)=-6.291,\hskip0.5em p=.001\right) $
and exhibited lower TBV $ \left(t(290)=-14.226,\hskip0.5em p=.001\right) $
.
$ \left(t(290)=-14.226,\hskip0.5em p=.001\right) $
.
Permutation analysis of linear models (PALM) results
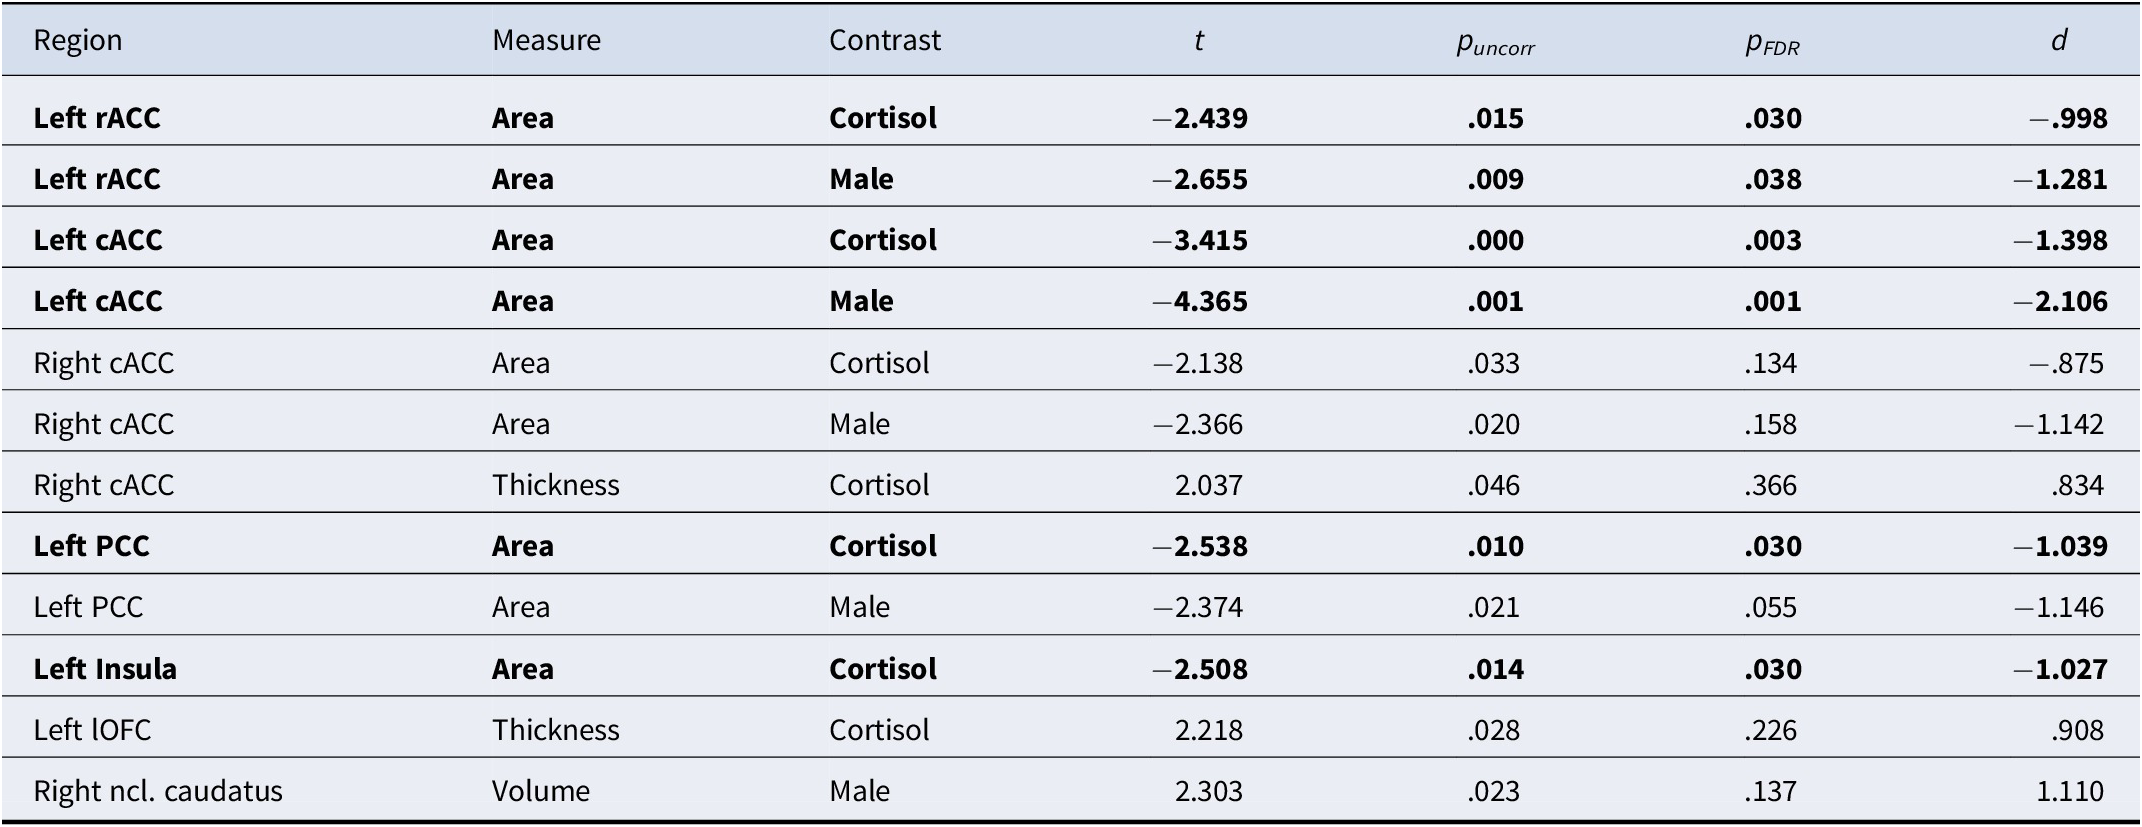
The significant results, both uncorrected and FDR-corrected, from PALM analyses are presented in Table 1, whereas full results are provided in Supplementary Tables S4–9.
Summary of significant PALM calculations for surface area, thickness, and volume

Note: puncorr, uncorrected p-values; pFDR, FDR-corrected p-values; d, Cohen’s d. Cortisol contrast represents a sex-independent cortisol increase using the whole sample. FDR-corrected significant results are shown in bold.
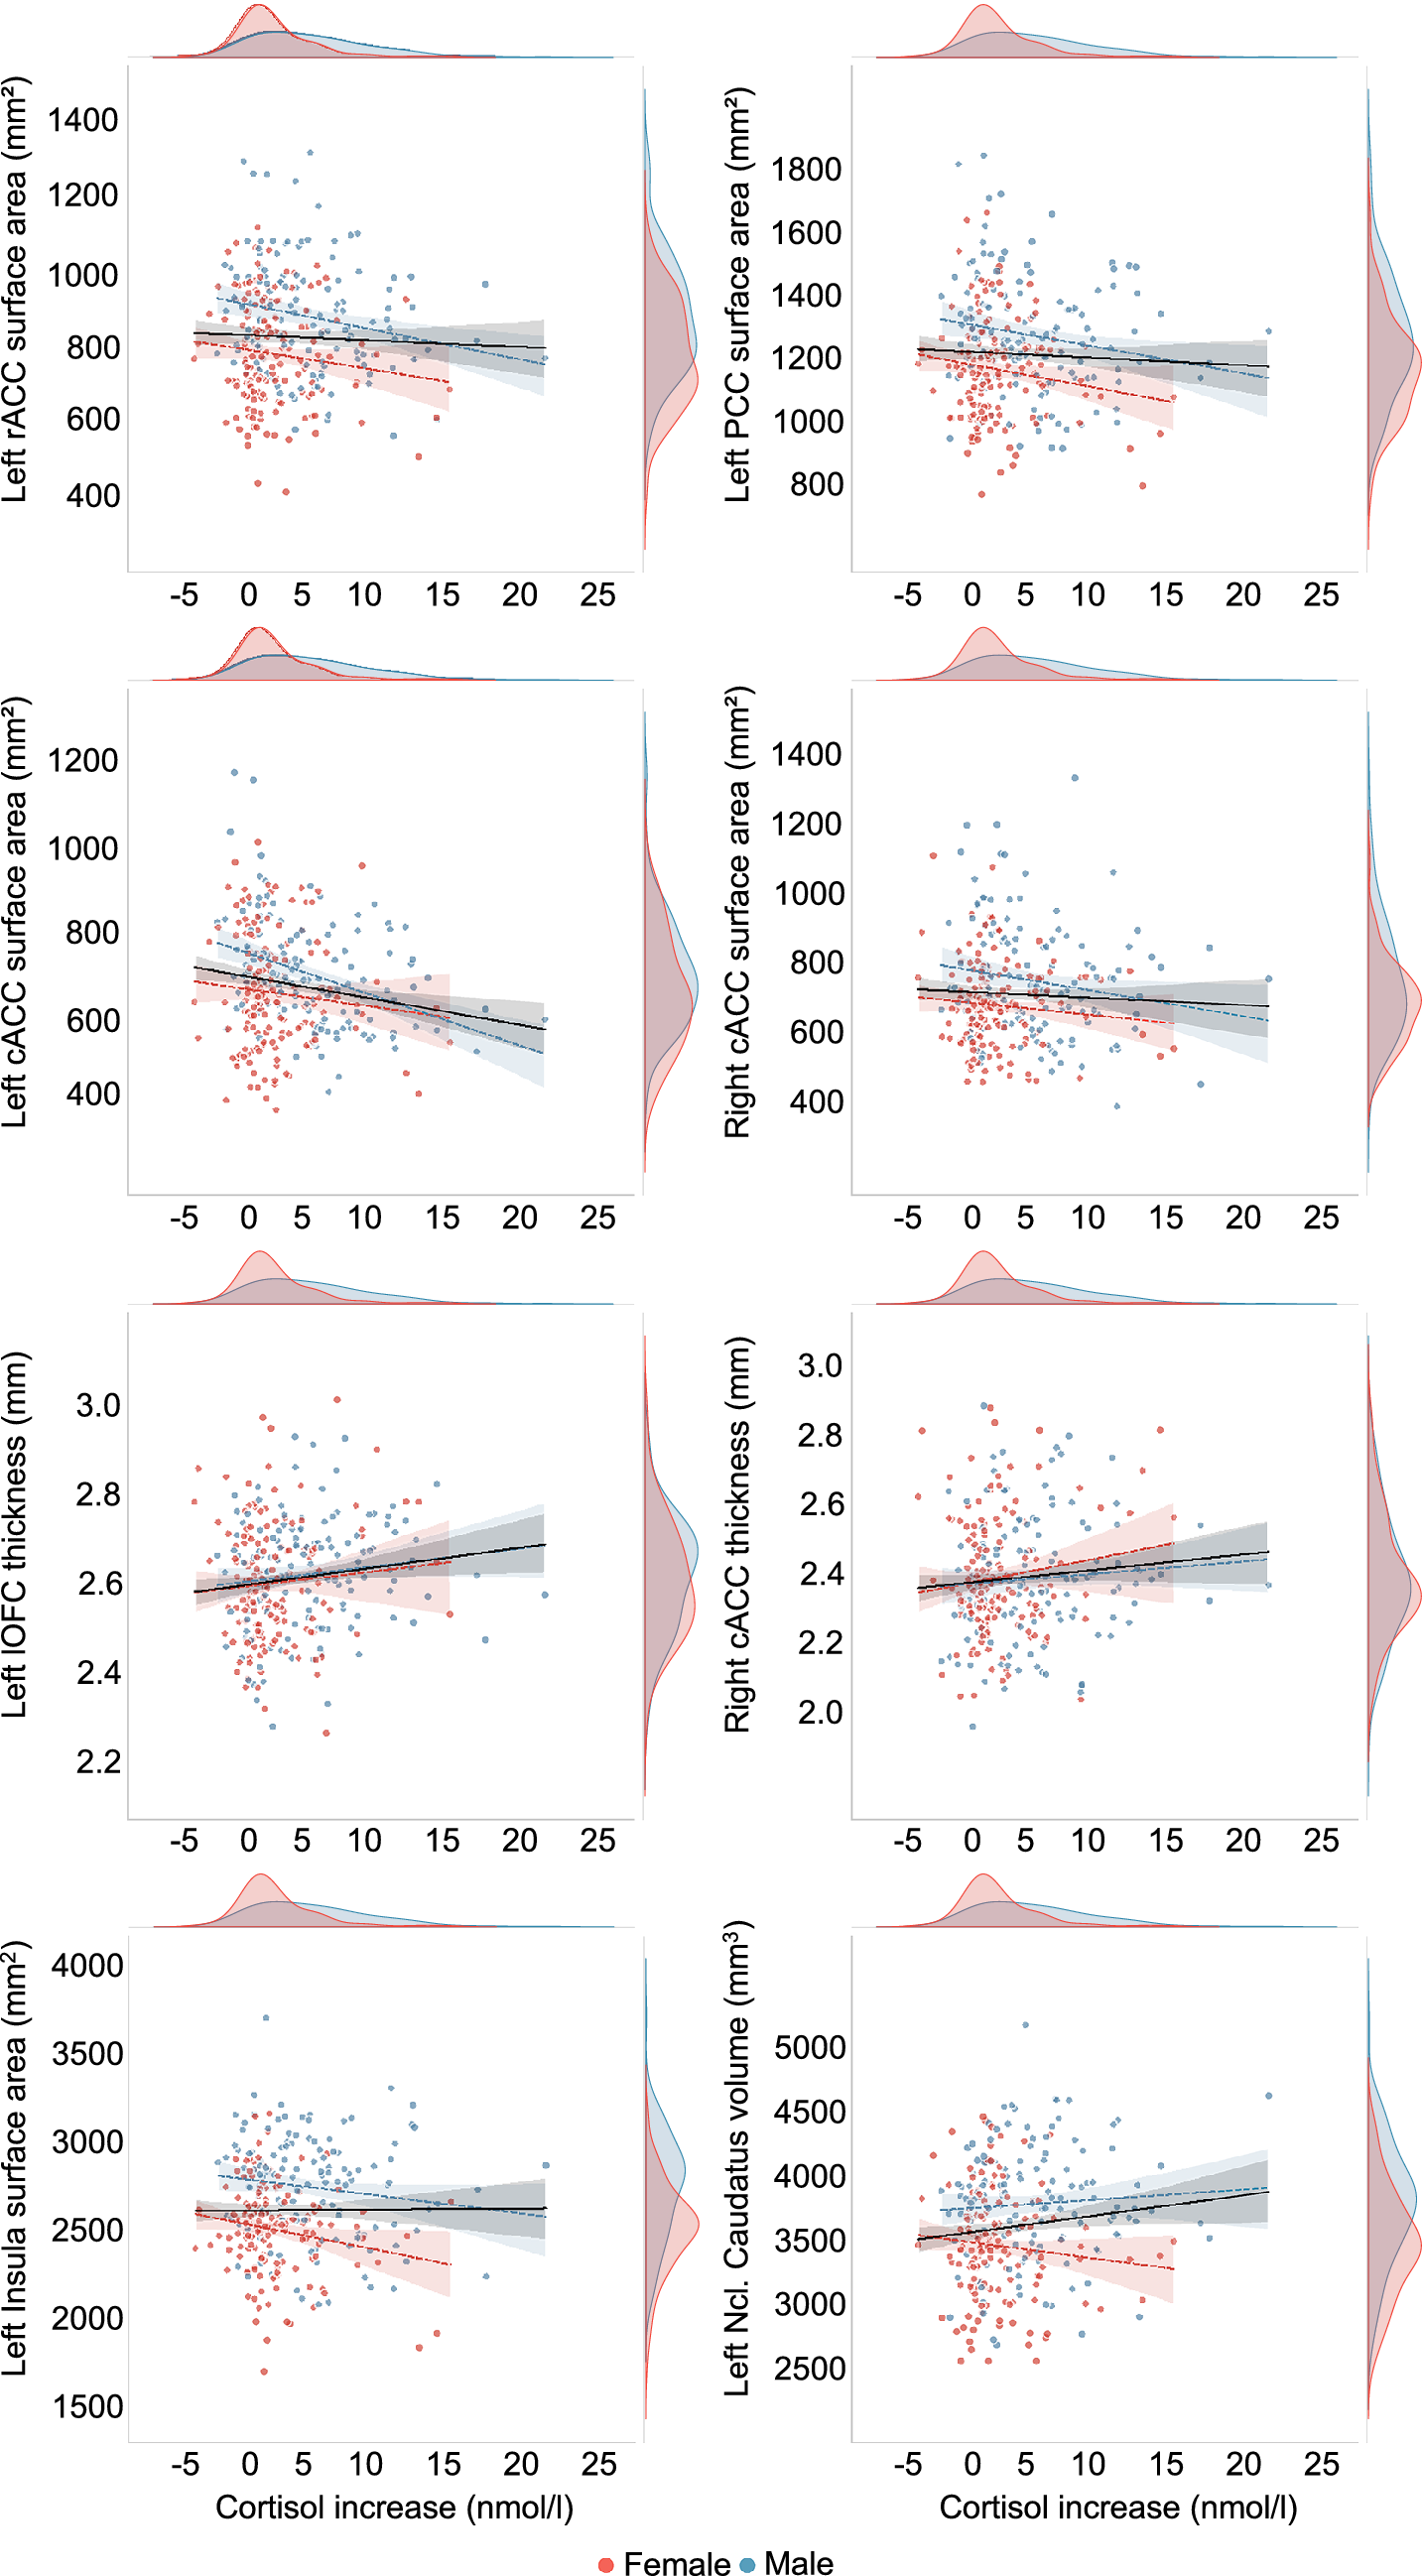
The CC was found to be consistently negatively associated with cortisol increase across hemispheres and certain brain measures. Specifically, a reduced surface area in the left hemisphere of rACC, cACC, PCC, and insula was significantly associated with sex-independent cortisol increase. Of these regions, surface area of rACC, cACC, and PCC was also negatively associated with cortisol increase in males. In the right hemisphere, only the surface area of cACC showed a marginally significant association with sex-independent and male-specific cortisol increase, though, these did not survive FDR correction. For cortical thickness, positive relationships between sex-independent cortisol increase and right cACC as well as left lOFC were observed. In the subcortex, a marginally positive association between right ncl. caudatus volume and cortisol increase in males was found. However, none of these associations withstand FDR correction. Figure 2 depicts scatterplots of associations between (sex-specific) cortisol increases and structural brain measures.
Scatterplots of associations between individual cortisol increase (nmol/L) and structural brain measures of the rostral anterior cingulate cortex (rACC), posterior cingulate cortex (PCC), caudal anterior cingulate cortex (cACC), lateral orbitofrontal cortex (lOFC), insula, and ncl. caudatus. Male and female subjects are represented by blue and red colors, respectively. The linear gray line represents a model fit to the total sample, while sex-specific models are depicted with respective colored dotted lines. The density plots illustrate the distribution of cortisol increase and the brain measures for each sex.

FreeSurfer’s vertex-wise group analyses
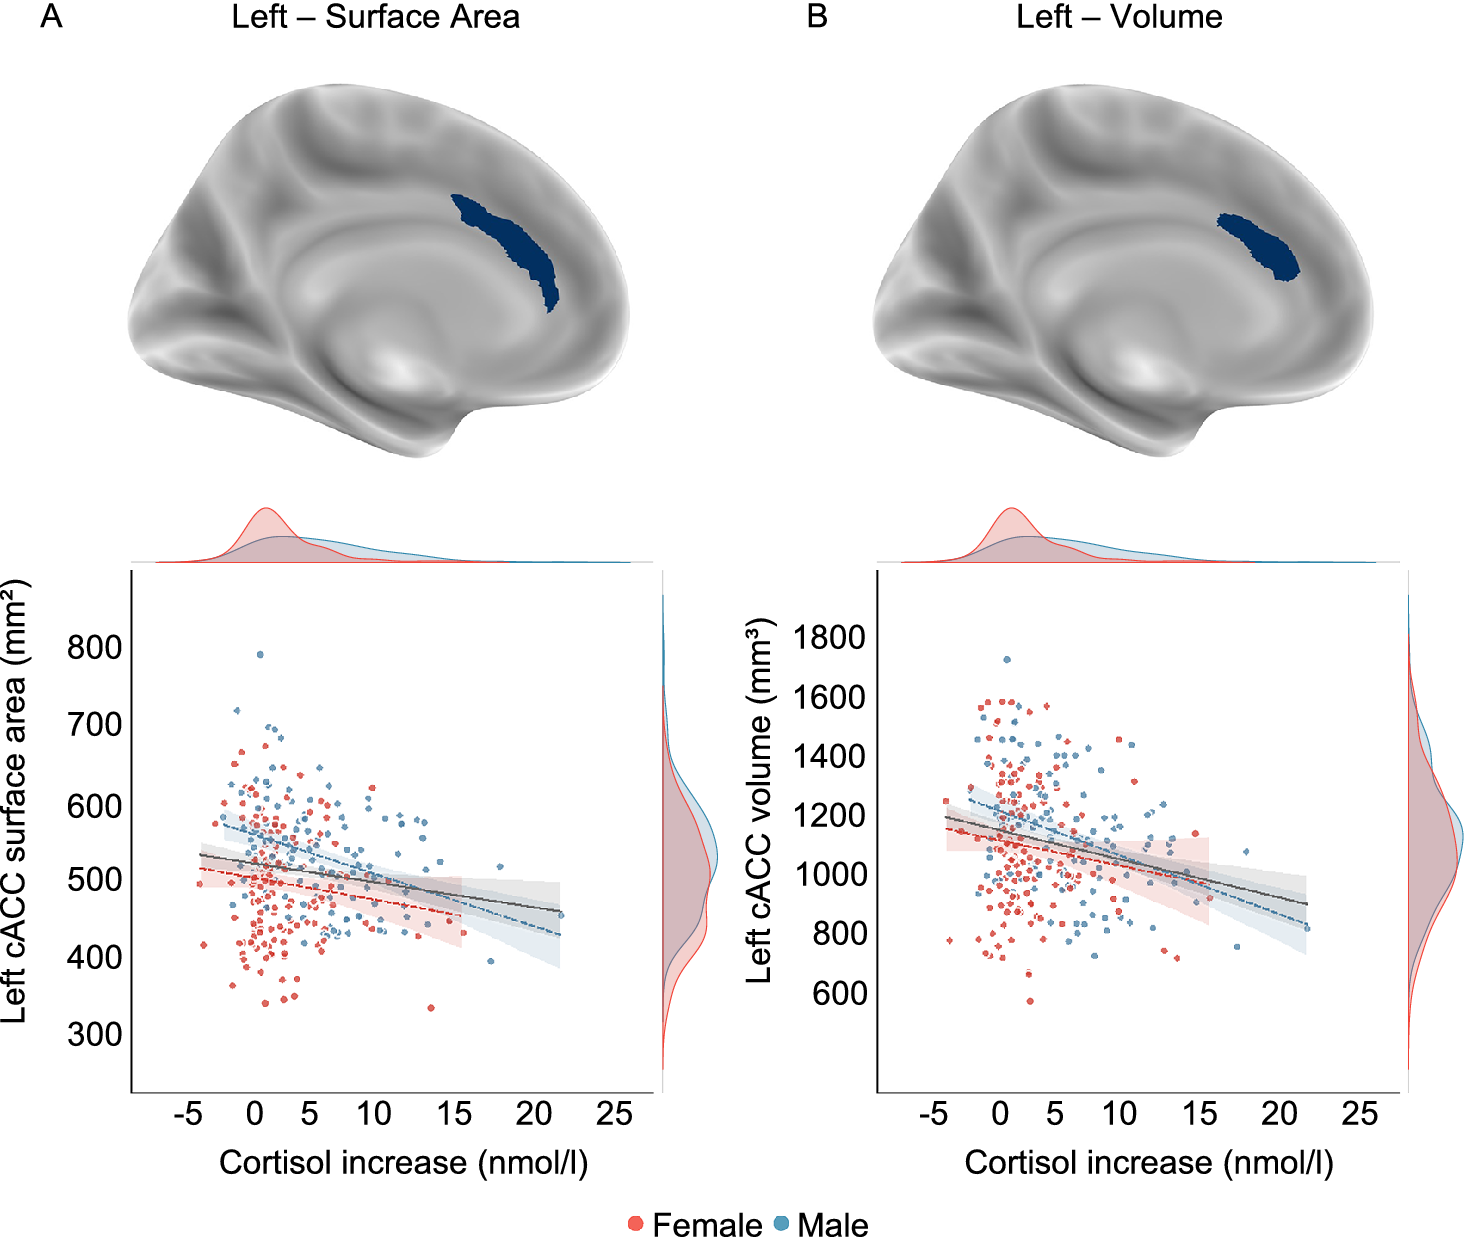
In line with the results from PALM analysis, vertex-wise group analyses revealed a significant negative association between surface area of the left cACC and cortisol increase in males, which was also observed in volume (Figure 3 and Supplementary Table 3).
Whole-brain vertex-wise association results surviving multiple comparison correction (cluster-wise pcorrected < .05) and scatter plots depicting corresponding associations with cortisol increase, which are only negative. In the scatter plots, sex groups are depicted with distinct colors. The linear gray slope represents a model fit to the total sample, while sex-specific models are depicted with colored dotted lines. The density plots represent the distribution of cortisol increase and the brain measures for each sex. A lower surface area and volume of the caudal anterior cingulate cortex (cACC) were significantly associated with a greater cortisol increase in males.

Machine-learning analysis
Ridge regression with hyperparameter optimization significantly predicted subjects’ cortisol increase based on their cortical surface area and thickness, as well as subcortical volume measures, with out-of-sample scores yielding a correlation coefficient of $ r=.124\hskip0.5em \left(p=.039\right) $
.
$ r=.124\hskip0.5em \left(p=.039\right) $
.
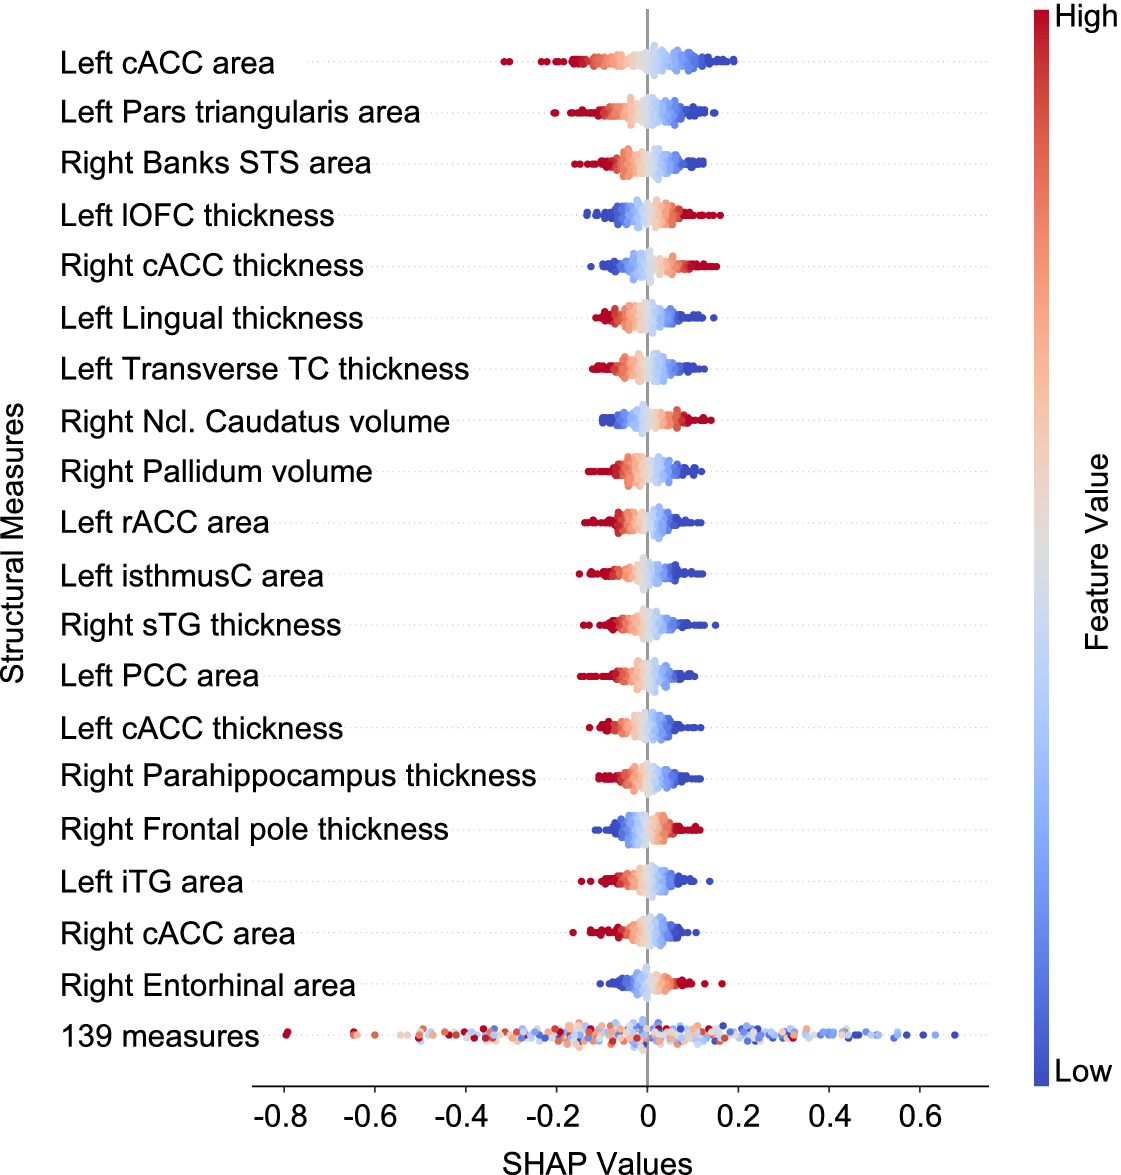
Figure 4 depicts the most informative structural measures for predicting individuals’ cortisol increase. Most of the brain measures reported in the previous analyses were also found to be informative in predicting cortisol increase, such as cACC, PCC, lOFC, as well as ncl. caudatus, along with additional areas from frontal, temporal, and limbic regions. Left cACC surface area was found to be the most informative feature in predicting cortisol increase. Additionally, the direction of the impact of brain measures on outcome cortisol increase values was found to be mostly negative, indicating a negative association between these measures and cortisol increase. Moreover, these informative brain measures were found to be stable across cross-validation folds, indicating their generalizability (Supplementary Figure S1).
The most informative structural measures, as measured by SHAP values derived from a trained ridge regression model, are indicative of their impact on the final prediction scores. The direction and extent of the SHAP values indicate the direction and magnitude of the features’ effects on the final prediction scores. The feature values are represented by colors (or symbols in grayscale), with blue indicating low values and red (or + in grayscale) indicating high values. cACC, caudal anterior cingulate cortex; STS, superior temporal sulcus; lOFC, lateral orbitofrontal cortex; TC, temporal cortex; Ncl. caudatus, nucleus caudatus; isthmusC, isthmus cingulate; sTG, superior temporal gyrus; PCC, posterior cingulate cortex; iTG, inferior temporal gyrus; 139 regions, the sum of remaining 139 brain measures.

Discussion
The present study revealed consistent negative associations between structural measures of the CC and acute cortisol increases in response to psychosocial stress, across three independent analyses: ROI-based PALM-analysis, whole-brain with Freesurfer’s vertex-wise group analysis, and out-of-sample prediction using ridge regression (i.e. regularized multivariate linear regression). Specifically, smaller surface area of the left rACC, cACC, and PCC, as well as the right cACC, was significantly associated with higher cortisol increase, regardless of sex. These effects were also found in the male sub-sample. The negative relationship between left cACC surface area and cortisol increase in males was further validated through whole-brain analysis and extended to the volume measure of the cACC. Notably, the surface area of left cACC also emerged as the most promising predictor of stress-induced cortisol increases in prediction analysis (independent of sex and cycle). These findings highlight the predominantly negative association between cingulate surface area and stress-induced cortisol release. Additionally, our results suggest that structural measures of other cortical and subcortical areas (e.g. lOFC, insula, ncl. caudatus) are also associated with or predictive of acute cortisol increases in response to stress.
These findings complement previous task-based and rsFC studies showing that the CC is closely linked to the HPA axis and stress processing (Berretz et al., Reference Berretz, Packheiser, Kumsta, Wolf and Ocklenburg2021; Harrewijn et al., Reference Harrewijn, Vidal-Ribas, Clore-Gronenborn, Jackson, Pisano, Pine and Stringaris2020; Noack et al., Reference Noack, Nolte, Nieratschker, Habel and Derntl2019; Qiu et al., Reference Qiu, Fan, Zhong, Yang, Wu, Huiqing and Huang2022; Van Oort et al., Reference Van Oort, Tendolkar, Hermans, Mulders, Beckmann, Schene and van Eijndhoven2017): For instance, ScanSTRESS studies have reported positive associations between cortisol responses and activations in the PCC (Henze et al., Reference Henze, Konzok, Kreuzpointner, Bärtl, Peter, Giglberger and Wüst2020) and cACC (Sandner et al., Reference Sandner, Lois, Streit, Zeier, Kirsch, Wüst and Wessa2020; referred to as dACC), as well as in the pACC (Akdeniz et al., Reference Akdeniz, Tost, Streit, Haddad, Wüst, Schäfer and Meyer-Lindenberg2014, acting as rACC-cACC transition zone). Additionally, a study using another psychosocial stress paradigm – the Montreal Imaging Stress Task (MIST; Dedovic et al., Reference Dedovic, Renwick, Mahani, Engert, Lupien and Pruessner2005; J. C. Pruessner et al., Reference Pruessner, Dedovic, Khalili-Mahani, Engert, Pruessner, Buss and Lupien2008) – confirmed this positive relationship for the pACC (Boehringer et al., Reference Boehringer, Tost, Haddad, Lederbogen, Wüst, Schwarz and Meyer-Lindenberg2015). Another study showed that activation-habituation in the bilateral ACC was accompanied by blunted cortisol release induced by ScanSTRESS and MIST (Y. Liu et al., Reference Liu, Zhao, Hu, Ren, Wei, Ren and Yang2023). Interestingly, Neurexan® (Nx4), a natural pharmacological agent, has been shown to reduce cortisol responses to psychosocial stress (Doering et al., Reference Doering, Wegner, Hadamitzky, Engler, Rief and Schedlowski2016) and lower stress-induced activation, particularly in the supracallosal ACC (functionally part of the cACC, Nanni-Zepeda et al., Reference Nanni-Zepeda, Alizadeh, Chand, Kasties, Fan, van der Meer and Walter2022). This study also found a significant association between trait anxiety and the Nx4-effect on stress-induced rsFC-changes. Notably, subjects with above-average trait anxiety exhibited marked improvement in stress-related rsFC changes between the right amygdala and pACC.
The relevance of cingulate structures is also reflected in the few studies on structural measures and HPA axis reactivity: For example, rapid volumetric changes following acute psychosocial stress induction (TSST) have been observed in anterior and mid-cingulate regions with increases in volume being positively related to stress-elicited state anxiety elevations (Uhlig et al., Reference Uhlig, Reinelt, Lauckner, Kumral, Schaare, Mildner and Gaebler2023). Moreover, reduced volume and heightened stress-related brain activity in the pACC were linked to a lower cortisol awakening response (CAR). Interestingly, rsFC between the pACC and hypothalamus – the primary regulator of HPA axis activity – also exhibited a negative association with the CAR (Boehringer et al., Reference Boehringer, Tost, Haddad, Lederbogen, Wüst, Schwarz and Meyer-Lindenberg2015).
Taken together, both functional and structural studies suggest that the CC plays a crucial role in emotional and cognitive appraisal of stressful stimuli. Positive correlations between stress-induced cortisol responses and the activation of CC structures, as well as their functional connections to other stress-relevant brain regions, emphasize its importance as an integrator of stress processes. Specifically, our findings suggest that structural differences, particularly smaller surface area or volume (Boehringer et al., Reference Boehringer, Tost, Haddad, Lederbogen, Wüst, Schwarz and Meyer-Lindenberg2015), may impair the ability to effectively regulate stress, as reflected in increased cortisol responses to acute stress. This positions the CC, not specifically for cortical measures but across modalities, as a potential relevant region for stress susceptibility and HPA axis reactivity, which is relevant for stress-related disorders (Hinojosa, Kaur, VanElzakker, & Shin, Reference Hinojosa, Kaur, VanElzakker and Shin2019; H. Huang et al., Reference Huang, Chen, Rong, Zhou, Yuan, Peng and Wang2024; Misquitta et al., Reference Misquitta, Miles, Prevot, Knoch, Fee, Newton and Banasr2021; Simmons et al., Reference Simmons, Matthews, Feinstein, Hitchcock, Paulus and Stein2008; Yang et al., Reference Yang, Duan, Lei, Liu, Zhang, Li and Zhang2022; Yucel et al., Reference Yucel, McKinnon, Chahal, Taylor, Macdonald, Joffe and MacQueen2008; H. Zhang et al., Reference Zhang, Zhao, Zhang, Luo, Liu and Gong2024). Furthermore, initial studies suggest that markers for resilience and treatment responses can be localized in these neural regions (Alagapan et al., Reference Alagapan, Choi, Heisig, Riva-Posse, Crowell, Tiruvadi and Rozell2023; Carnevali, Koenig, Sgoifo, & Ottaviani, Reference Carnevali, Koenig, Sgoifo and Ottaviani2018; Pizzagalli et al., Reference Pizzagalli, Pascual-Marqui, Nitschke, Oakes, Larson, Abercrombie and Davidson2001; Webb et al., Reference Webb, Olson, Killgore, Pizzagalli, Rauch and Rosso2018). However, it should be noted that different patterns of effects and functions may prevail depending on the specific subregion, as confirmed by inconsistent anatomical labeling in studies (Shackman et al., Reference Shackman, Salomons, Slagter, Fox, Winter and Davidson2011). This highlights the need for specific investigations of the stress-specific functionality of cingulate substructures (Bubb, Metzler-Baddeley, & Aggleton, Reference Bubb, Metzler-Baddeley and Aggleton2018; Rolls, Reference Rolls2019).
Moreover, the current results support and extend our previous findings (Henze et al., Reference Henze, Konzok, Kudielka, Wüst, Nichols and Kreuzpointner2023): In this larger sample, we also observed a positive association between frontal cortex morphology and stress-induced cortisol release, specifically for the thickness of right cACC and left lOFC. This suggests that frontal regions may play a key role in stress perception, engaging in top-down processing that incorporates limbic circuits (e.g. amygdala, hippocampus) to regulate stress response systems like the HPA axis (Herman et al., Reference Herman, McKlveen, Ghosal, Kopp, Wulsin, Makinson and Myers2016, Reference Herman, Ostrander, Mueller and Figueiredo2005; Hermans, Hendler, & Kalisch, Reference Hermans, Hendler and Kalisch2024; Jankord & Herman, Reference Jankord and Herman2008; Van Oort et al., Reference Van Oort, Tendolkar, Hermans, Mulders, Beckmann, Schene and van Eijndhoven2017). We once again observed a positive association between right ncl. caudatus volume and cortisol levels in males, further reinforcing the existence of sex-specific patterns in hormonal stress responses involving striatal structures (Henze et al., Reference Henze, Konzok, Kreuzpointner, Bärtl, Giglberger, Peter and Wüst2021, Reference Henze, Giglberger, Bärtl, Konzok, Neidhart, Krause, Serin, Waller, Peter, Kreuzpointner, Speicher, Streit, Veer, Kirsch, Nichols, Kudielka, Wüst, Erk and Walter2025). The difference between male and female brain-stress correlations was, however, not significant likely due to the broader sample composition and the need for statistical control of the variable cycle. It is well-established that both the cortisol stress response and brain morphology are influenced by factors such as menstrual cycle phase, hormonal contraception, and reproductive status (Brønnick et al., Reference Brønnick, Økland, Graugaard and Brønnick2020; Childs, Dlugos, & De Wit, Reference Childs, Dlugos and De Wit2010; Goldstein, Jerram, Abbs, Whitfield-Gabrieli, & Makris, Reference Goldstein, Jerram, Abbs, Whitfield-Gabrieli and Makris2010; Hidalgo-Lopez et al., Reference Hidalgo-Lopez, Mueller, Harris, Aichhorn, Sacher and Pletzer2020; Klusmann et al., Reference Klusmann, Schulze, Engel, Bücklein, Daehn, Lozza-Fiacco and Schumacher2022; B. A. Pletzer & Kerschbaum, Reference Pletzer and Kerschbaum2014; B. Pletzer, Harris, & Hidalgo-Lopez, Reference Pletzer, Harris and Hidalgo-Lopez2018; B. Pletzer et al., Reference Pletzer, Kronbichler, Aichhorn, Bergmann, Ladurner and Kerschbaum2010; B. Pletzer, Harris, & Hidalgo-Lopez, Reference Pletzer, Harris and Hidalgo-Lopez2019a; B. Pletzer, Harris, Scheuringer, & Hidalgo-Lopez, Reference Pletzer, Harris, Scheuringer and Hidalgo-Lopez2019b; Rincon-Cortes, Herman, Lupien, Maguire, & Shansky, Reference Rincon-Cortes, Herman, Lupien, Maguire and Shansky2019; Yoest, Quigley, & Becker, Reference Yoest, Quigley and Becker2018). For the structural data, we therefore applied a non-binary correction (i.e. cycle), but we distinguished cortisol responses dichotomously between males and females, as there were no significant differences between female subgroups regarding cortisol, despite potential underlying variations (Klusmann et al., Reference Klusmann, Schulze, Engel, Bücklein, Daehn, Lozza-Fiacco and Schumacher2022; Zänkert et al., Reference Zänkert, Bellingrath, Wüst and Kudielka2019). This emphasizes the need for larger studies on female subgroups and more comprehensive data in this area.
Our ML model achieved modest but significant prediction performance for cortisol increases based on structural measures. While this is the first ML study in this context, similar low correlations have been reported in studies predicting PTSD symptoms and cortisol from rsFC and acute stress responses (W. Zhang et al., Reference Zhang, Kaldewaij, Hashemi, Koch, Smit, van Ast and Roelofs2022, Reference Zhang, Llera, Hashemi, Kaldewaij, Koch, Beckmann and Roelofs2020). Despite these parallels, our model’s $ r $
is not high enough for clinical application and should be interpreted cautiously. Additionally, SHAP analysis highlighted the importance of surface area alongside volume and thickness, consistent with the findings from PALM and whole-brain analyses. Re-fitting the model without surface area resulted in significantly lower prediction performance, emphasizing its necessity in future stress studies (Supplementary Table S10). This is further supported by the observed negative association between insular surface area and cortisol increase. Although the insula has shown high relevance in functional stress studies (Berretz et al., Reference Berretz, Packheiser, Kumsta, Wolf and Ocklenburg2021; Noack et al., Reference Noack, Nolte, Nieratschker, Habel and Derntl2019; Van Oort et al., Reference Van Oort, Tendolkar, Hermans, Mulders, Beckmann, Schene and van Eijndhoven2017), it has so far been neglected in structural studies. Our findings indicate that its involvement may correspond to that of the CC (Bahamonde et al., Reference Bahamonde, Quintana-Donoso, Linsambarth, Jerez-Baraona, Peña, Tamburini and Stehberg2023; Hu et al., Reference Hu, Sun, Su, Wang, Qiu, Yang and Wang2018; Kang, Lee, & Lee, Reference Kang, Lee and Lee2017; Shao, Lau, Leung, & Lee, Reference Shao, Lau, Leung and Lee2018).
$ r $
is not high enough for clinical application and should be interpreted cautiously. Additionally, SHAP analysis highlighted the importance of surface area alongside volume and thickness, consistent with the findings from PALM and whole-brain analyses. Re-fitting the model without surface area resulted in significantly lower prediction performance, emphasizing its necessity in future stress studies (Supplementary Table S10). This is further supported by the observed negative association between insular surface area and cortisol increase. Although the insula has shown high relevance in functional stress studies (Berretz et al., Reference Berretz, Packheiser, Kumsta, Wolf and Ocklenburg2021; Noack et al., Reference Noack, Nolte, Nieratschker, Habel and Derntl2019; Van Oort et al., Reference Van Oort, Tendolkar, Hermans, Mulders, Beckmann, Schene and van Eijndhoven2017), it has so far been neglected in structural studies. Our findings indicate that its involvement may correspond to that of the CC (Bahamonde et al., Reference Bahamonde, Quintana-Donoso, Linsambarth, Jerez-Baraona, Peña, Tamburini and Stehberg2023; Hu et al., Reference Hu, Sun, Su, Wang, Qiu, Yang and Wang2018; Kang, Lee, & Lee, Reference Kang, Lee and Lee2017; Shao, Lau, Leung, & Lee, Reference Shao, Lau, Leung and Lee2018).
In conclusion, our findings demonstrate that surface area, thickness, and volume of both cortical and subcortical structures can serve as predictors of hormonal stress responses, expanding our understanding of key brain regions and the importance of various structural metrics. Future studies should leverage even larger samples to capture more variance in sex- and potentially also gender-specific effects and facilitate the application of advanced ML methods. Considering these findings, smaller surface areas of the CC may favor a higher HPA axis stress reactivity. Specifically, the left cACC emerges as a crucial predictor of stress-induced cortisol release. The present study robustly supports previous findings, indicating a multimodal association of the ACC (e.g. rsFC, task-based activations) with stress-related processes and further highlighting its non-trivial role in the etiology of stress-related disorders.
Supplementary material
The supplementary material for this article can be found at http://doi.org/10.1017/S0033291726104103.
Data availability statement
The data sets generated during and/or analyzed during the current study are available from the corresponding author on reasonable request. Analysis codes can be found at https://github.com/eminSerin/stress-fs-paper. A repository of studies that have already used and published these data is available here: https://osf.io/echja/.
Author contribution
Conceptualization: E. S., G.-I. H.; Data curation: E. S., L. S. S., G.-I. H.; Formal analysis: E. S., G.-I. H.; Funding acquisition: H. W., G.-I. H.; Investigation: C. B., M. G., J. K., H. L. P., N. S., G.-I. H.; Methodology: E. S., G.-I. H.; Project administration: G.-I. H.; Resources: H. W., G.-I. H.; Software: E. S., G.-I. H.; Supervision: H. W.; Validation: E. S., G.-I. H.; Visualization: E. S., G.-I. H.; Writing – original draft: E. S., G.-I. H.; Writing – review and editing: E. S., L. S. S., C. B., M. G., J. K., H. L. P., N.S., L. K., B. M. K., S. W., H. W., G.-I. H.
Funding statement
This study was supported by German Research Foundation Grants No. HE9212/1-1 (to G-IH, project number 513531314) and FOR5187 (project number 442075332).
Competing interests
None.


 Open access