


1. Introduction
Stable water isotopes of oxygen and hydrogen of snow/firn and ice from glaciated areas have been used for paleoclimate studies (Thompson and others, Reference Thompson1998; Masson-Delmotte and others, Reference Masson-Delmotte2008; Hou and others, Reference Hou2013). These studies entail that the isotopic compositions of precipitation track the surface temperature, that the isotopic compositions are preserved sequentially in a snow or ice profile, and that the modifications of the isotopic composition by vapor and water movement in a snowpack and ice are insignificant (Masson-Delmotte and others, Reference Masson-Delmotte2008; Steen-Larsen and others, Reference Steen-Larsen2011). Only a few studies have examined how the isotopic composition of glacier snow and firn is changed by water or vapor flow (Taylor and others, Reference Taylor2001; Earman and others, Reference Earman, Campbell, Phillips and Newman2006). The process by which snow is transformed into firn smooths out the variations in the profile of the isotopic composition as a function of the depth. Visible melt layers in ice cores indicate the presence of surface-generated water percolating through the snowpack, firn and ice (Koerner, Reference Koerner1997; Pohjola and others, Reference Pohjola2002; Moran and Marshall, Reference Moran and Marshall2009; Moran and others, Reference Moran, Marshall and Sharp2011). The magnitude of the possible consequences of these processes, such as enrichment of isotopic values of snow/firn/ice by percolating water, must be determined and the accuracy of the use of stable water isotopes in the ice cores as a proxy for past temperature should be assessed.
The effect of meltwater infiltration can be: (1) a reduction of seasonal isotopic signals and the elution of chemical species; (2) an isotopic enrichment of snowpack, firn and ice by the subsequent percolation of meltwater through recrystallization; and (3) an introduction of time gaps. Meltwater modification of seasonal isotopic signals has been reported by some studies (Taylor and others, Reference Taylor2001; Goto-Azuma and others, Reference Goto-Azuma, Koerner and Fisher2002; Moore and others, Reference Moore, Grinsted, Kekonen and Pohjola2005; Zhou and others, Reference Zhou, Nakawo, Hashimoto and Sakai2008a; Lee and others, Reference Lee2008a, Reference Lee2008b, Reference Lee2010a, Reference Lee, Han, Ham and Na2015a, Reference Lee2015b). Meltwater alterations of seasonal isotopic signals have traditionally been minimized by drilling ice cores in regions that experience little or no summertime melt, such as central Greenland and interior regions of Antarctica (Moran and others, Reference Moran, Marshall and Sharp2011). Recently, studies conducted on past sea ice extension or environmental studies based on ice core records in coastal areas that experience occasional periods of summertime melt have led to a better understanding of meltwater effects on the isotopic ratio of snow, firn and ice (Kaczmarska and others, Reference Kaczmarska2006; Moran and others, Reference Moran, Marshall and Sharp2011).
To predict the isotopic modification of meltwater from ice, we used a 1-D model developed by Feng and others (Reference Feng, Taylor, Renshaw and Kirchner2002) and used by Lee and others (Reference Lee, Feng, Posmentier, Faiia and Taylor2009) and Lee and others (Reference Lee2010a). To simulate the isotopic variations of ice by melting process, the model requires key parameters, the isotopic exchange rate constant between the ice and liquid water for oxygen and hydrogen (how fast the isotopic reaction reaches the isotopic equilibrium) and the amount of ice (or surface area) involved in the isotopic exchange. These parameters can only be tuned by controlled melting experiments, in which other physical and chemical parameters can be measured and their variations need to be controlled. In ice-melt systems, there are few works that quantitatively explain the isotopic variations of meltwater. In this paper, we first report on four ice-melt experiments conducted to estimate the rate constant of ice–water isotopic exchange by melting ice columns of various heights using different melt rates and measurements of the meltwater isotopic compositions for both hydrogen and oxygen. The isotopic results were compared to the model calculation results and the model parameters were adjusted to obtain the best fit. Then, the isotopic rate constant and the amount of ice involved in the reaction were calculated from the fit parameters.
2. Methods
2.1. Melt experiments
We made four experiments where we varied the percolation velocity. These experiments were conducted in a −1°C cold room at Ewha Womans University in order to eliminate additional melt by air temperature (Fig. 1). For the experiment, we used a Plexiglas column (90 cm high with an internal diameter of 12.5 cm) that was placed on top of a perforated disk and funnel. The column was filled with ice cubes (each cube had the dimension of 3 cm × 3 cm × 3 cm = 27 cm3) previously prepared using distilled water and was stored in a freezer for isotopic homogeneity. The bulk density of the ice was determined by measuring the volume inside the column and weight of the ice cubes in the column between 1 and 2 kg. It was assumed that the isotopic compositions of ice are homogeneous for the ice cubes used in the experiment.
(a) A schematic diagram of melting experiment, (b) a photo of melting experiment installed. Numbers are expressed in mm.
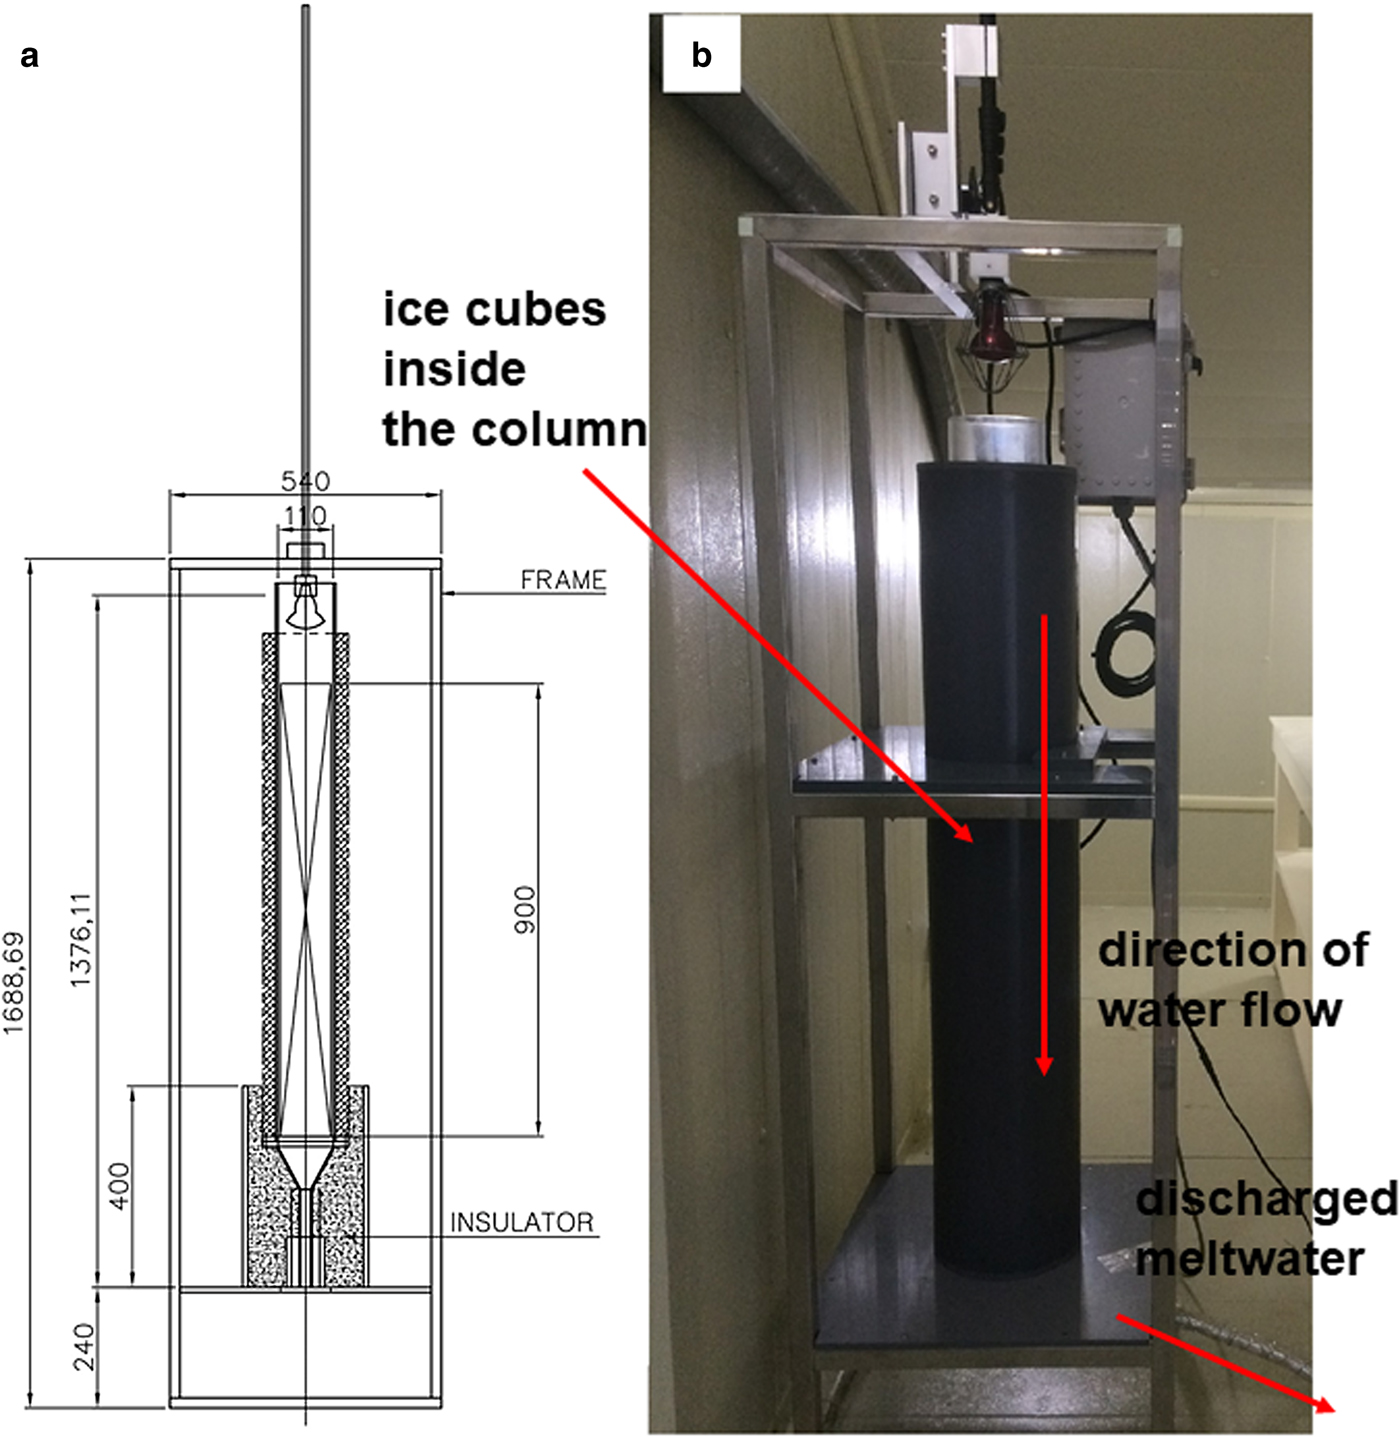
For each experiment (four cases), we used an infrared heat lamp (50 or 75 W) to melt the ice at the top of a column. The lamp was suspended in the Plexiglas column and moved down to maintain a fixed distance between the ice surface and the lamp. The ice in the column was melted at a relatively constant rate for constant specific discharge at the bottom of the column. The Plexiglas column and tubes were wrapped in insulation to prevent meltwater from freezing inside the column and tubes. The melt rate was controlled by both the power of the used lamp and by the distance between the lamp and the ice surface. Meltwater arriving at the base of the column flowed through the perforated disk, into the funnel and to a rotating disk loaded with low-density polyethylene bottles through the tube. Meltwater was collected every 5–10 min after the first meltwater sample, depending on the melt rate and the height of the ice. We can determine (1) the mass of the recovered meltwater as a fraction of the total mass of the initial ice, (2) the mean flow rate at a given time, (3) the volume of meltwater as a function of time and (4) the time at which the first meltwater arrived at the end of the tube.
2.2. Isotope analysis
The samples were analyzed at the Korea Polar Research Institute and the isotopic compositions of hydrogen and oxygen were determined by a wavelength-scanned cavity ring-down spectroscopy (CRDS, L-2120-I, Picarro), which is a type of isotope ratio infrared spectroscopy. The D/H and 18O/16O ratios were expressed in the δ notation as part per thousand differences relative to the Vienna Standard Mean Ocean Water (VSMOW). Memory effects between samples in the CRDS were corrected as suggested by Penna and others (Reference Penna2012) and the precisions of oxygen and hydrogen were 0.08 and 0.6‰, respectively (1σ).
2.3. Numerical model
We use the model developed by Taylor and others (Reference Taylor2001) and Feng and others (Reference Feng, Taylor, Renshaw and Kirchner2002) and investigated by Taylor and others (Reference Taylor, Feng, Renshaw and Kirchner2002), Lee and others (Reference Lee, Feng, Posmentier, Faiia and Taylor2009) and Lee and others (Reference Lee2010a). The model assumes a constant melt rate, and incorporates the advection of percolating water and ice–water isotopic exchange, but neglects the diffusion. Boundary conditions and numerical solutions are described in detail in Feng and others (Reference Feng, Taylor, Renshaw and Kirchner2002). Assuming a homogeneous ice column being melted by a constant rate, the isotopic governing equations for the liquid water and ice are,


where R liq and R ice are the 2H/1H or 18O/16O ratio in the liquid water and ice, respectively. The dimensionless z is the depth below the ice surface (normalized by the initial depth of the ice column) and t is the time since onset of the melt (normalized by the time required for the meltwater to percolate through the initial depth of the ice column). The constant a eq is the equilibrium fractionation factor for the isotopic exchange between ice and water at 0°C. At equilibrium, the δ 18O and δD of the water are expected to be 3.1 and 19.5‰ lower than those of the ice, respectively (O'Neil, Reference O’Neil1968). The parameter γ quantifies the fraction of the ice in the ice–water isotopic exchange system,

where a and b are the masses of liquid water and ice, respectively. The parameter f denotes the fraction of ice involved in the isotopic reaction; f will be dependent on the size and surface roughness of ice grains, the accessibility of the ice surface to the percolating water and the degree of melt and refreezing at the ice surface. In practice, this microscopic variable cannot be measured (Feng and others, Reference Feng, Taylor, Renshaw and Kirchner2002). The parameter ψ is the dimensionless rate of isotopic exchange and is given by,


where k r is the isotopic exchange rate constant (with the dimension of time–1), Z is the initial ice column depth and u* is the infiltration velocity. The two parameters (γ and ψ) were determined by fitting the model to the experimental data; we then calculated the isotopic exchange rate constant (k r) using Eqn (4). Both the two parameters are calculated by water saturation (S), which is assumed constant at constant melt rate. Water saturation is defined as S = (S w–S i)/(1–S i), where S w is the total water volume over the pore volume and S i is the irreducible water content (S i = 0.04, Jordan, Reference Jordan1991). Using these values and the height of the ice column (see Eqn 4), the rate constant k r was calculated as Hibberd (Reference Hibberd1984) suggested,

The pore volume was calculated from the column porosity, which was calculated using the measured initial bulk density by the following equation (Feng and others, Reference Feng, Taylor, Renshaw and Kirchner2002):

We used the oxygen and hydrogen isotopic compositions of the original ice as the initial isotopic composition of both the ice and the irreducible water for model calculations. For each experiment, we calculated the values of ψ and f for the best fit that minimize the sum of squares of the differences between the modeled and analyzed isotopic compositions of the meltwater.
3. Results
The four ice-melt experiments were carried out with the column heights of 37.5, 37.5, 38.5 and 18.5 cm, respectively. The corresponding durations of each experiment (the time required for the entire column to melt) were 13.05, 19.67, 26.72 and 25.13 h, respectively. The values for the bulk density of the ice inside the column (the weight of the ice used in the experiment divided by the volume of the column) for the four experiments were 0.56, 0.56, 0.55 and 0.57 g cm–3, respectively, and the weighted mean specific discharge values (bin size, 0.2 cm h−1) were 1.96, 1.40, 1.01 and 0.48 cm h–1, respectively (see Table 1 and Fig. 2) and the times required to obtain the first meltwater sample were 90, 190, 245 and 373 min, respectively.
Summary of the cryosphere laboratory experiments

(a)–(d) Probability density distributions for specific discharge with various melt rates. The percentage of total melt at equally spaced specific discharge intervals was plotted for experiments 1–4. (e) Variations of specific discharge as a function of fraction melted (F).

To parameterize the 1-D model, it is necessary to obtain a good estimate of the flow discharge. We estimated this value from the data measured by the fraction collector that is plotted as the specific discharge (water equivalent depth per unit time, see Fig. 2). For experiment 1, 58% of the meltwater had a specific discharge rate between 1.8 and 2.2 cm h–1, 79% of the meltwater had a specific discharge rate between 1.2 and 1.6 cm h–1 for experiment 2, 69% of the meltwater had a specific discharge rate between 0.9 and 1.2 cm h–1 for experiment 3 and 79% of the meltwater had a specific discharge rate between 0.4 and 0.65 cm h–1 for experiment 4. The weighted mean values of 1.96, 1.40, 1.01 and 0.48 cm h–1 were used as the model flow rates for experiments 1, 2, 3 and 4, respectively.
The oxygen and hydrogen isotopic compositions of the meltwater are illustrated as a function of the cumulative melt volume divided by the total melt volume (F) measured at the bottom of the melt apparatus (Fig. 3). The isotopic values were scaled for plotting as the relative isotopic difference between each sample and the initial ice by subtracting the average initial isotopic compositions of the ice from all of the analyzed values.
Isotopic compositions of ice-melt (points) and model results (dashed line) plotted vs F, the fraction of ice melted: (a) and (b) experiment 1, (c) and (d) experiment 2, (e) and (f) experiment 3 and (g) and (h) experiment 4.

All of the performed measurements and simulations showed that the δ 18O and δD values for the first 5% of melt decrease and then increased until the end of each experiment. The isotopic decrease for the first 5% of the melt can be explained by the fact that the initial pore water is isotopically similar to the bulk ice (Feng and others, Reference Feng, Taylor, Renshaw and Kirchner2002; Taylor and others, Reference Taylor, Feng, Renshaw and Kirchner2002; Lee and others, Reference Lee2010a). We also simulate the trend by assuming the isotopic composition of the initial pore water equal to that of the bulk ice. The isotopic depletion values for experiments 1–4 were 0.8, 1.4, 1.5 and 1.0‰ and 5.1, 10.0, 7.7 and 6.4‰ for δ 18O and δD, respectively. The isotopic increase after the first 5% of the melt follows a non-linear trend for experiment 2, but linear trends were observed for experiments 1, 3 and 4.
To obtain the isotopic compositions of meltwater from ice, Eqns (1) and (2) were solved simultaneously for the parameters γ and ψ. In each experiment, a significant fraction of the ice column was melted before the meltwater first appeared at the base of the column and the discharge was relatively constant from this time until the end of the experiment. At the time of the first meltwater appearance, the meltwater must have been held in the unmelted area of the ice column as pore water. We calculated the effective water content, S, by assuming this meltwater is evenly distributed. The mass of ice (b) and water (a) is linked with the effective water content in Eqns (5) and (6).
As shown in Figure 3, the model results fit the data reasonably well. The optimized parameters for each calculation are listed in Table 2. The best fit values of ψ of the oxygen isotopes are 0.34, 1.12, 0.57 and 0.34 and 0.46, 1.19, 0.45 and 0.35 of hydrogen isotopes for experiments 1, 2, 3 and 4, respectively. The calculated oxygen k r values were 0.30, 0.77, 0.29 and 0.21 h–1 and the hydrogen k r values were 0.41, 0.82, 0.21 and 0.22 h–1 for experiments 1, 2, 3 and 4, respectively (see Eqn 4 and 7). The best fit f values for the oxygen isotope were 0.275, 0.100, 0.550 and 0.525 and those for the hydrogen isotopes were 0.200, 0.150, 0.325 and 0.575 for experiments 1, 2, 3 and 4, respectively.
Model parameters used and obtained from the column experiments

4. Discussion
4.1. Isotopic modification by melt process
Mass-balance calculations show that 98.8, 99.0, 99.6 and 95.0% of the meltwater was retrieved from experiments 1, 2, 3 and 4, respectively. During the experiments, there may be some evaporation or sublimation, giving rise to the loss of water (<5%). These mass losses are within the range found by Herrmann and others (Reference Herrmann, Lehrer and Stichler1981) (4 ~ 13%) and Taylor and others (Reference Taylor, Feng, Renshaw and Kirchner2002) (4 ~ 8%) in snow experiments. An enrichment in isotopic values compared to the original ice (see Table 2) suggests evaporation or sublimation (Sokratov and Golubev, Reference Sokratov and Golubev2009). Since we did not analyze the whole samples of meltwater, the isotopic mass balance is more difficult to constrain. We interpolated the values for the unanalyzed samples from the δ 18O and δD values of the similar samples. Except for experiment 3, the volume-weighted average δ 18O and δD values of the meltwater from the experiments compared to the isotopic compositions of original ice were less than the experimental precision by 0.02 and 0.60‰ for experiment 1, by −0.01 and −0.72‰ for experiment 2, by −0.25 and −1.32‰ for experiment 3 and by 0.04 and 0.09‰ for experiment 4, respectively. Therefore, isotopic change caused by evaporation or sublimation can be ignored in the subsequent discussion.
Investigation of the slope of the δ 18O vs δD regression line is a widely used technique in isotope hydrology (Clark and Fritz, Reference Clark and Fritz1997; Earman and others, Reference Earman, Campbell, Phillips and Newman2006; Lee and others, Reference Lee2010a; Bush and others, Reference Bush, Berke and Jacobson2017). This slope from the regression line provides information about whether water has experienced significant evaporation, sublimation and isotopic exchange between liquid water, ice and water vapor (Earman and others, Reference Earman, Campbell, Phillips and Newman2006; Zhou and others, Reference Zhou, Nakawo, Hashimoto and Sakai2008a, Reference Zhou, Nakawo, Hashimoto and Sakai2008b; Lee and others, Reference Lee, Feng, Posmentier, Faiia and Taylor2009; Sokratov and Golubev, Reference Sokratov and Golubev2009; Lee, Reference Lee2014). Since the isotopic fractionation between liquid water and ice is 3.1 and 19.5‰ for oxygen and hydrogen, respectively, Zhou and others (Reference Zhou, Nakawo, Hashimoto and Sakai2008a) and Lee and others (Reference Lee2010a) stated that the slope of δ 18O vs δD of meltwater should be different from that of the meteoric waterline (MWL) of 8. Theoretically, the slope should be close to 19.5/3.1~6.3 (ratio of hydrogen and oxygen isotopic fractionation between ice and liquid water).
The δ 18O–δD plots obtained in this work are shown in Figure 4. The slopes of the δD–δ 18O plots for experiments 1–4 are 6.64, 6.84, 4.36 and 6.85, respectively. The slopes of the δD–δ 18O plots for the model for experiments 1–4 are 6.80, 8.32, 4.15 and 6.61, respectively. This result suggests that a slope of significantly <8 can be obtained without considering the sublimation process (Earman and others, Reference Earman, Campbell, Phillips and Newman2006; Lee and others, Reference Lee, Feng, Posmentier, Faiia and Taylor2009). Near the surface, snow or ice exchanges with atmospheric water vapor and this exchange modify the linear relationship to 88.2/11.4 ~ 7.7 (Earman and others, Reference Earman, Campbell, Phillips and Newman2006). Sokratov and Golubev (Reference Sokratov and Golubev2009) found that the isotopic compositions of snow became more enriched by sublimation and the ratio between the two water isotopes deviated from the MWL. Zhou and others (Reference Zhou, Nakawo, Hashimoto and Sakai2008a) investigated the isotopic compositions of pore water and snowpack using two water isotopes and reported that the slope of the liquid phase was lower than that of the solid phase. Then the refreezing process would cause the slope of the solid phase to decrease because of the discrepancy between the slopes of the two phases, snow and liquid water.
δD vs δ 18O plots for four melt experiments. The gray solid line indicates the global meteoric waterline (GMWL) in each figure. All of the δD vs δ 18O slopes of meltwater are <8.

When meltwater infiltrates through ice, isotopic exchange occurs between liquid water and ice, giving rise to isotopic redistribution in ice (Lee and others, Reference Lee2010b; Dahlke and Lyon, Reference Dahlke and Lyon2013). Only a few studies have investigated how snow, firn and ice change isotopically by water or vapor flow (Stichler and others, Reference Stichler2001; Moran and Marshall, Reference Moran and Marshall2009; Moran and others, Reference Moran, Marshall and Sharp2011). Moran and Marshall (Reference Moran and Marshall2009) discussed the processes that affect the isotopic compositions of liquid and solid phases in open and closed systems. In open systems, in particular, the exchange of the mass with the surrounding environment results in the enrichment of the solid phases because the light isotopes are preferentially removed from the systems via sublimation and melt processes. They also concluded that the overestimation of the annual temperature from stable isotopes is likely to result from the ice cores experiencing moderate to high melts. The good fit obtained with the model parameterized in the present work indicates that our model captures the physical processes that control the isotopic compositions of meltwater. In addition, constraining the value of k r is critical when this model is extended to field conditions.
4.2. Parameters depending on hydrological conditions
The range of isotopic exchange rate constant (k r) values, from 0.21 (experiment 4 of oxygen) to 0.82 (experiment 2 for hydrogen), is much larger than that obtained by Taylor and others (Reference Taylor, Feng, Renshaw and Kirchner2002) and Lee and others (Reference Lee2010a) from snowmelt, where the range was reported to be from 0.07 to 0.20 h–1. To examine whether the ranges of the k r and f values are statistically different between the two isotopes, we present the calculated 95% confidence regions based on the sum of squares errors in the k r–f plane for each of the calculations in Figure 5 (Seber and Wild, Reference Seber and Wild1989; Feng and Savin, Reference Feng and Savin1993; Lee and others, Reference Lee, Feng, Posmentier, Faiia and Taylor2009). As noted by Lee and others (Reference Lee, Feng, Posmentier, Faiia and Taylor2009), the isotopic exchange rate constant, k r and the fraction of ice involved in the isotopic exchange, f, may differ from one column to another, depending on the melt conditions. All confidence regions exhibit a diagonal shape, indicating that the best fit of k r is fairly correlated with the best fit of f.
Confidence regions (95%) for the estimates of parameters k r and f from oxygen and hydrogen isotopic measurements. In each panel, closed and open symbols represent the best fit for oxygen and hydrogen, respectively.

Next, we examine the confidence regions to determine whether or not the rates of oxygen and hydrogen isotopic exchange between liquid water and ice are significantly different. When the confidence regions overlap, such as in experiments 1, 2 and 4, the k r and f values estimated from each of the two simulations are not significantly different, even though the best fit k r values for hydrogen greater than those for oxygen (see Table 1 and Fig. 5). For experiment 3, although the confidence regions do not overlap, the individual values of k r and f do overlap. If one argues that the f values should not differ for oxygen and hydrogen isotopic results (because they are obtained from the same experiment), then the k r value for hydrogen isotopic exchange would be significantly greater by 28% (0.29 for hydrogen vs 0.21 for oxygen). It still remains inconclusive whether the two exchange rate constants are the same or different under a wide range of flow conditions, but a 28% difference in this parameter may not be physically significant.
Isotopic exchange is correlated with the surface area of the contact between liquid water and ice and the rate of melt and recrystallization that are associated with the moisture inside the ice. Compared to the effective saturation in ice, the f values decrease with increasing moisture content, which is not consistent with what Lee and others (Reference Lee, Feng, Posmentier, Faiia and Taylor2009) found (Fig. 6a). Lee and others (Reference Lee, Feng, Posmentier, Faiia and Taylor2009) argued that isotopic exchange between liquid water and ice increases with increasing wetness. When the wetness increases, the isotopic exchange between liquid water and ice increases due to the increasing surface area of contact and recrystallization. However, in this experiment, water flows through the ice with a high velocity when the melt rate is relatively high, limiting the time of contact between liquid water and ice and thus the fraction of ice involved in the isotopic exchange decreases with increasing wetness in ice. The surface area available for the direct interaction between liquid water and ice is reduced when the water content increases. This is reasonable because there may be water only in the small pores or bypass some of the water that has exchanged with ice, which decreases the effective surface area over which the isotopic exchange can occur.
(a) Effective water saturation (S) vs fraction of ice in the liquid water–ice isotopic exchange system (f). (b) Isotopic exchange rate constant (k r) vs pore water velocity (u*). Gray dashed lines are presented as in Lee and others (Reference Lee, Feng, Posmentier, Faiia and Taylor2009) for comparison. (c) Effective water saturation (S) vs pore water velocity (u*) by linear (gray) and quadratic (black) function.

Figure 6b illustrates the relationship between the isotopic exchange rate constant and the pore water velocity that is closely correlated with the effective water saturation (see Fig. 6c). The isotopic exchange rate constant (k r) increases exponentially with the mean water velocity (u*). What causes the dependency of k r on pore water velocity is not clear, but it can be explained that the water bypasses some of the water that has exchanged with the ice and thus not all of the isotopically exchanged water appears in the discharge (Fig. 6a), which the model does not consider. The model, thus, results in a lower-best fit exchange rate constant than during a higher flow. Therefore, the variable k r may be an outcome of model assumption that does not apply to the actual flow in the ice.
5. Conclusion
The rate constants for isotopic exchange between liquid water and ice were examined using four melt experiments and a physically based 1-D model. We found that the rate constant for the hydrogen isotopic exchange between liquid water and ice may be greater than that for oxygen isotopic exchange (up to 40%). The range of the rate constant obtained from four melt experiments range from 0.21 to 0.82 h–1. The model results also suggest that f, the fraction of ice involved in the isotopic exchange, decreases with increasing wetness of ice. This is because with increasing water saturation in ice, there may be water only in the small pores or bypass some of the water that has exchanged with ice, which decreases the effective surface area over which isotopic exchange can occur.
The observation and simulation results yielded δD–δ 18O slopes of <8 and close to the theoretical value of 6.3. This slope is similar to the ratio of hydrogen and oxygen isotopic fractionation between ice and liquid water and different from the slope of the MWL. We note that these slopes were obtained from the laboratory experiments and model calculations without considering the sublimation process.
Meltwater influences on snow and ice need to be further examined and quantified to better constrain potentially large impact on isotope thermometry. Percolation of water during warm events will tend to diffuse downward and advect the isotopic signal in the snow/ice strata, which smooths the isotopic variations in the record of isotopes vs depth. Our work may help in controlling the magnitude of the possible consequences of these processes and in evaluating the accuracy of isotopes in ice cores as a proxy for temperature.
Acknowledgements
This work was financially supported by KOPRI research grants (PE19040 and KIMST20190361). We appreciate the scientific editor and two anonymous reviewers, whose comments led to significant improvements.


 Open access

