


1 The Problem
Confidence intervals are ubiquitous in the presentation of data, models, and effects in the social sciences.Footnote 1 Consider, for example, Gibson’s Gibson’s (Reference Gibson2024) Figure 1(b) where he shows the proportion of people agreeing with the proposition that it might be better to do away with the US Supreme Court when it starts making decisions that most people disagree with. We reproduce this figure below in Figure 1.
Proportion agreeing —do away with the Supreme Court for unpopular decisions.
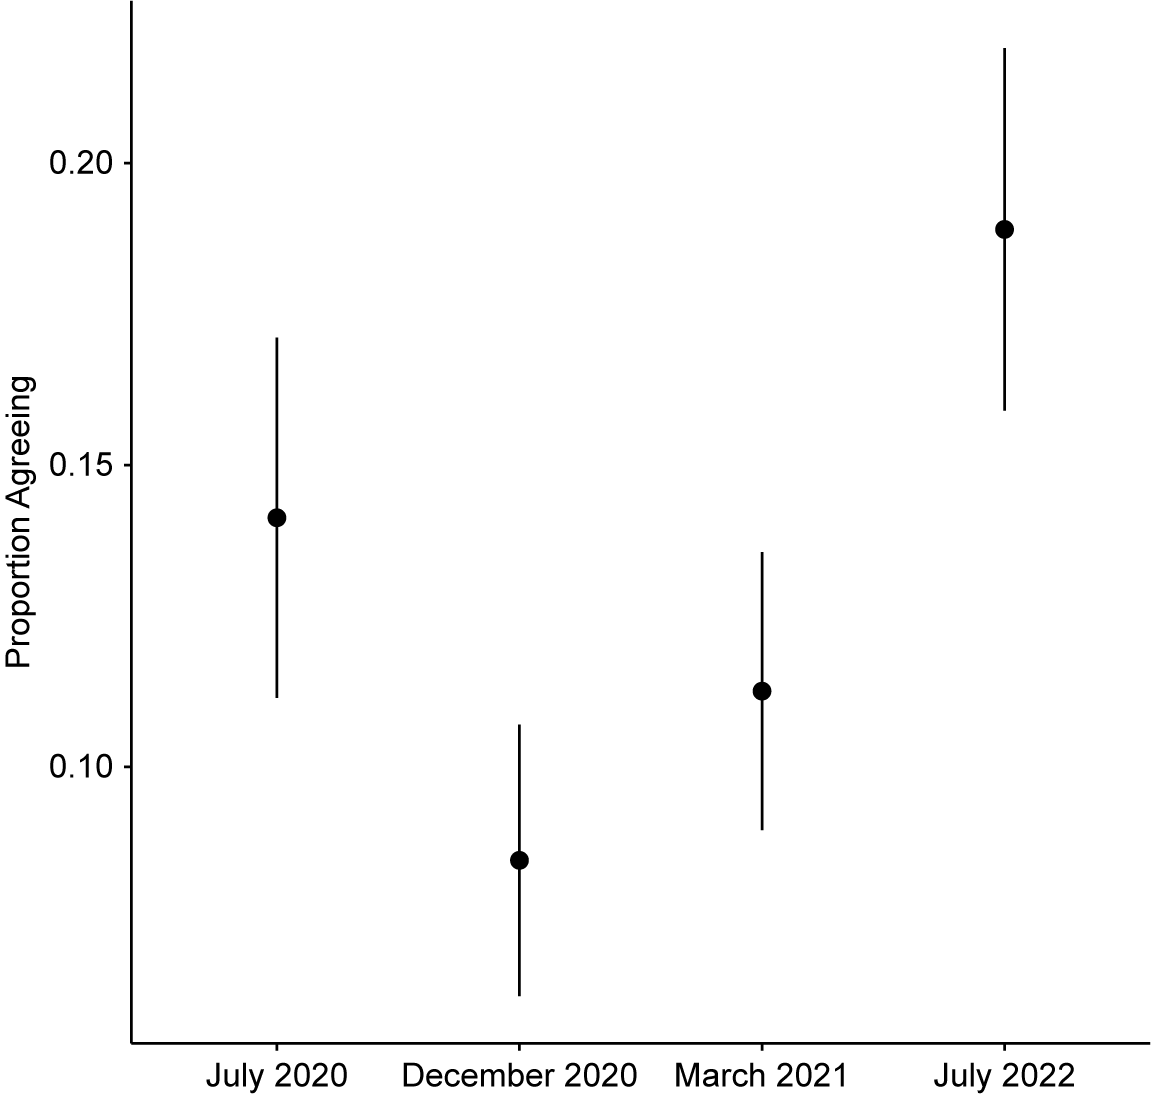
While we can see how the proportion agreeing decreases from mid to late 2020 and then increases into July 2022, we might wonder which of these estimates are different from the others. For example, is the change from July 2020 to March 2021 significant? Ideally, we could look at whether the confidence intervals for the two estimates overlap—if they do, the difference between the two estimates is not significant, if they do not, the difference is significant. Unfortunately, this will not always lead us to the right conclusion. Often, the difference between two confidence intervals that greatly overlap is insignificant. Conversely, the difference between two confidence intervals that do not overlap is significant. The problem lies in between those extremes. Appendix 1 of the Supplementary Material describes the problem in greater detail. The 95% confidence intervals for July 2020 and March 2021 do overlap and the difference between those two proportions is not significant. However, the confidence intervals for July 2020 and July 2022 also overlap, but those two estimates are statistically different from each other.Footnote 2 What we know is that when two 95% confidence intervals do not overlap, the difference between the two estimates is significant, but when the intervals overlap somewhat, we cannot necessarily conclude that the two estimates represented by the two confidence intervals are statistically indistinguishable from each other (Browne Reference Browne1979; Radean Reference Radean2023; Schenker and Gentleman Reference Schenker and Gentleman2001). How then can we allow readers to visually compare confidence intervals while retaining their statistical properties as much as possible?
1.1 Previous Attempts at Visual Testing
We refer to the procedure of judging the statistical significance of the difference between two estimates by whether their confidence intervals overlap as visual testing. Below, we use the term inferential confidence interval, coined by Tyron (Reference Tyron2001), to refer to $(1-\gamma )\times 100\%$
confidence intervals whose (non-)overlaps correspond with tests at the level
$(1-\gamma )\times 100\%$
confidence intervals whose (non-)overlaps correspond with tests at the level $\alpha $
, where generally
$\alpha $
, where generally $\gamma \neq \alpha $
. For nearly a century, scholars have grappled with the idea that readers will try to make inferences about differences in estimates using confidence intervals (Dice and Laraas Reference Dice and Laraas1936; Simpson and Roe Reference Simpson and Roe1939).Footnote 3 The first systematic scholarship here identified 84% confidence intervals as useful to represent tests at the 5% level in a narrow set of circumstances (Browne Reference Browne1979; Tukey Reference Tukey1991).Footnote 4 The ensuing decades saw several attempts to generalize this procedure to take account of differences in sample size, uncertainty, covariance and the functional form of the distribution of the difference (Afshartous and Preston Reference Afshartous and Preston2010; Goldstein and Healy Reference Goldstein and Healy1995; Payton, Greenstone, and Schenker Reference Payton, Greenstone and Schenker2003; Radean Reference Radean2023).
$\gamma \neq \alpha $
. For nearly a century, scholars have grappled with the idea that readers will try to make inferences about differences in estimates using confidence intervals (Dice and Laraas Reference Dice and Laraas1936; Simpson and Roe Reference Simpson and Roe1939).Footnote 3 The first systematic scholarship here identified 84% confidence intervals as useful to represent tests at the 5% level in a narrow set of circumstances (Browne Reference Browne1979; Tukey Reference Tukey1991).Footnote 4 The ensuing decades saw several attempts to generalize this procedure to take account of differences in sample size, uncertainty, covariance and the functional form of the distribution of the difference (Afshartous and Preston Reference Afshartous and Preston2010; Goldstein and Healy Reference Goldstein and Healy1995; Payton, Greenstone, and Schenker Reference Payton, Greenstone and Schenker2003; Radean Reference Radean2023).
The main takeaway from the line of research discussed above is that for approximately normally distributed estimates, we can identify an appropriate confidence level ( $1-\gamma $
) such that two confidence intervals do not overlap with a given probability,
$1-\gamma $
) such that two confidence intervals do not overlap with a given probability, $\alpha $
, under the null hypothesis. Following Afshartous and Preston (Reference Afshartous and Preston2010) and Radean (Reference Radean2023), we compute the inferential confidence level required for any pair of estimates.
$\alpha $
, under the null hypothesis. Following Afshartous and Preston (Reference Afshartous and Preston2010) and Radean (Reference Radean2023), we compute the inferential confidence level required for any pair of estimates.
 $$ \begin{align} Z_\gamma &= \left[\frac{F^{-1}\left(\frac{\alpha}{2}\right)}{\frac{\theta}{\sqrt{\theta^{2} +1 - 2\rho\theta}} + \frac{\frac{1}{\theta}}{\sqrt{1 + \theta^{-2} - 2\rho\theta^{-1}}}}\right] \end{align} $$
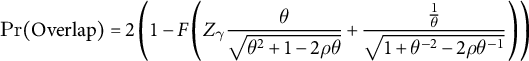 $$ \begin{align} \Pr(\text{Overlap}) &= 2\left(1-F\left(Z_\gamma \frac{\theta}{\sqrt{\theta^{2} +1 - 2\rho\theta}} + \frac{\frac{1}{\theta}}{\sqrt{1 + \theta^{-2} - 2\rho\theta^{-1}}}\right)\right) \end{align} $$
where $\theta $
is the ratio of standard errors for the two estimates,
$\theta $
is the ratio of standard errors for the two estimates, $\rho $
is the correlation between the two estimates,
$\rho $
is the correlation between the two estimates, $Z_\gamma $
is the multiplier for the standard error for the inferential confidence level
$Z_\gamma $
is the multiplier for the standard error for the inferential confidence level $(1-\gamma )$
,
$(1-\gamma )$
, $F()$
is the CDF of the appropriate t or normal distribution and
$F()$
is the CDF of the appropriate t or normal distribution and $F^{-1}()$
is its quantile function.
$F^{-1}()$
is its quantile function.
For any pair of estimates, the appropriate value of $Z_\gamma $
will differ depending on the ratio of their variances and their covariance. To the extent that we are trying to find a single value of
$Z_\gamma $
will differ depending on the ratio of their variances and their covariance. To the extent that we are trying to find a single value of $Z_\gamma $
that appropriately represents all pairwise tests, this variation is problematic. If multiple pairs are present, Afshartous and Preston (Reference Afshartous and Preston2010) would have us average over the values of
$Z_\gamma $
that appropriately represents all pairwise tests, this variation is problematic. If multiple pairs are present, Afshartous and Preston (Reference Afshartous and Preston2010) would have us average over the values of $Z_{\gamma }$
. In all but the most optimistic cases, the tests produced will not all have the same type I error rate. This leaves the user in essentially the same situation in which she started—not knowing whether estimates are different at a particular level of
$Z_{\gamma }$
. In all but the most optimistic cases, the tests produced will not all have the same type I error rate. This leaves the user in essentially the same situation in which she started—not knowing whether estimates are different at a particular level of $\alpha $
. Below, we develop a procedure that 1) works on an arbitrarily large collection of intervals, 2) directly identifies tests that are not appropriately captured by the inferential confidence intervals, and 3) is agnostic to inferential paradigm.Footnote 5
$\alpha $
. Below, we develop a procedure that 1) works on an arbitrarily large collection of intervals, 2) directly identifies tests that are not appropriately captured by the inferential confidence intervals, and 3) is agnostic to inferential paradigm.Footnote 5
2 Inferential Confidence Intervals
The main goal of previous research in this field is to identify an inferential confidence level $(1-\gamma )$
such that intervals overlap with probability
$(1-\gamma )$
such that intervals overlap with probability $\alpha $
under the null hypothesis. This couples the testing procedure to the visualization. Our innovation is to decouple the testing from the visualization. For most quantities of interest in social science, it is easy to compute pairwise tests of difference. We suggest using the appropriate tests to make pairwise inferences and then attempt to identify the inferential confidence level (or levels) such that overlapping intervals correspond with insignificant differences and non-overlapping intervals correspond with significant differences. Since we are not using the confidence intervals to do the test, the probability with which any pair of intervals overlaps under the null hypothesis is of no real concern.
$\alpha $
under the null hypothesis. This couples the testing procedure to the visualization. Our innovation is to decouple the testing from the visualization. For most quantities of interest in social science, it is easy to compute pairwise tests of difference. We suggest using the appropriate tests to make pairwise inferences and then attempt to identify the inferential confidence level (or levels) such that overlapping intervals correspond with insignificant differences and non-overlapping intervals correspond with significant differences. Since we are not using the confidence intervals to do the test, the probability with which any pair of intervals overlaps under the null hypothesis is of no real concern.
Importantly, the main beneficiary of this kind of display is not the researcher. We imagine that researchers will have a good sense, through investigation of their models, which of their intended inferences are significant and which are not. Instead, this tool empowers readers to use published results to make valid inferences about comparisons that may not have been anticipated by or important to the researcher. If we acknowledge that readers are already engaging in this kind of visual analysis as a matter of course, our procedure will allow them to do so in a constructive and inferentially valid fashion.
In any situation where visual testing is desirable, the following steps may be implemented.
-
1. Conduct all pairwise tests between estimates. Use whatever method you like to identify significant/interesting from insignificant/uninteresting differences.Footnote 6 The tests could include a reference estimate of zero, with sampling variability equal to zero and with zero covariance with all other estimates. This would ensure that all univariate tests against zero are also respected by the procedure. Once the appropriate p-values ( $p_{ij}$
’s) are calculated for
$b_{j} - b_i \hspace{.05in} \forall \hspace {.05in} i < j$
, we define
$s_{ij}$
as 1 if
$p_{ij} < \alpha $
(the desired type I error rate for the test) and 0 otherwise;
$\mathbf {s}$
is a vector of
$s_{ij}$
values.Footnote 7
$p_{ij}$
’s) are calculated for
$b_{j} - b_i \hspace{.05in} \forall \hspace {.05in} i < j$
, we define
$s_{ij}$
as 1 if
$p_{ij} < \alpha $
(the desired type I error rate for the test) and 0 otherwise;
$\mathbf {s}$
is a vector of
$s_{ij}$
values.Footnote 7 -
2. Find the inferential confidence level(s). Once the baseline results of pairwise tests are computed, we find (1-
$\gamma $
) (the inferential confidence level) as the solution(s) to the following optimization: (2.1)where
$$ \begin{align} \underset{(1-\gamma)}{\arg\max} \sum_{j=2}^{J}\sum_{i=1}^{j-1}I(s_{ij} = s_{ij}^{*}) \end{align} $$
$s_{ij}^*$
is 0 if the
$(1-\gamma )\times 100$
% confidence intervals for
$b_i$
and
$b_j$
overlap and 1 if they do not (where
$\mathbf {b}$
, the vector of estimates, is ordered from largest to smallest). That is, we find the value(s) of
$\gamma $
that maximizes the agreement between
$s_{ij}$
the “correct” indicator of significance for the difference between
$b_{i}$
and
$b_{j}$
based on a pairwise test and
$s_{ij}^{*}$
, the indicator of (non-)overlapping of the inferential confidence intervals for
$b_{i}$
and
$b_{j}$
.
-
3. Pick the inferential confidence level that is most useful. If there are multiple levels identified by step 2, we should try to identify which one is most useful. In Appendix 4 of the Supplementary Material, we discuss several different options, but any of the identified values would work. As a good place to start, we suggest using the value halfway between smallest and largest acceptable values.


If we can find a level such that all the pairwise tests are appropriately represented by whether or not the inferential confidence intervals overlap, then using that interval in a coefficient plot or similar display would produce the desired result—readers could easily identify whether pairs of estimates are different from each other based on whether or not the intervals overlap. We produced software in R and Stata to perform these calculations easily after most models. The vignettes and help pages for the software provide examples and guides for use and interpretation. A brief software demonstration for both R and Stata can be found in Appendix 7 of the Supplementary Material.
3 Case Study: Iyengar and Westwood (2014)
Below, we describe a case where the inferential confidence intervals provide much more clarity in testing.Footnote 8 Iyengar and Westwood (Reference Iyengar and Westwood2015) provide implicit, explicit, and behavioral indicators of affective polarization in the US. Of interest here is their second experiment where they explicitly asked respondents to choose a high school senior to receive a scholarship. The GPA of the two students were randomly varied (either 3.5 or 4.0). Each student was either identified as being president of the Young Republicans or Young Democrats as a partisan identity marker. The two students could either be equally qualified (with a 3.5 or 4.0 GPA) or one could be more qualified than the other. The authors construct a binary dependent variable for whether the respondent chose the Democrat candidate (0) or the Republican candidate (1), a treatment condition variable with three levels (Democrat more qualified, both equally qualified, Republican more qualified), and the respondent’s partisan identification (Democrat, Lean Democrat, Independent, Lean Republican, Republican). Figure 6 of Iyengar and Westwood (Reference Iyengar and Westwood2015) presents the predicted probabilities computed from a logistic regression model where the respondent’s choice is regressed on an interaction between the respondent’s partisan identification and her received treatment condition.
The top panels of Figure 2 reproduces Iyengar and Westwood (Reference Iyengar and Westwood2015)’s results with their original 95% confidence intervals. There are five estimates and 10 possible pairwise tests in each panel resulting in 30 pairwise tests of potential interest. Using 95% confidence intervals to do these tests, we would get seven of them wrong. Using our method, we find that there are a range of confidence intervals that perfectly account for all 30 tests (Equally Qualified: [0.590, 0.863], Republican More Qualified: [0.817, 0.878], Democrat Most Qualified: [0.744, 0.869]). All tests across all three panels can be accommodated by any value in the range [.817, .863]. This range includes (and is centered on) the 84% confidence interval that is often used.Footnote 9 Our procedure ensures the appropriate type I error rate then optimizes the display to correspond with the tests.
Iyengar and Westwood (Reference Iyengar and Westwood2015)’s predicted probabilities for Partisan Winner selection.
Note:Inferential confidence intervals at 84% level visually representing results of all 95% level pairwise tests between same treatment party ID. Red x's mark comparisons where the overlaps and test results diverge.
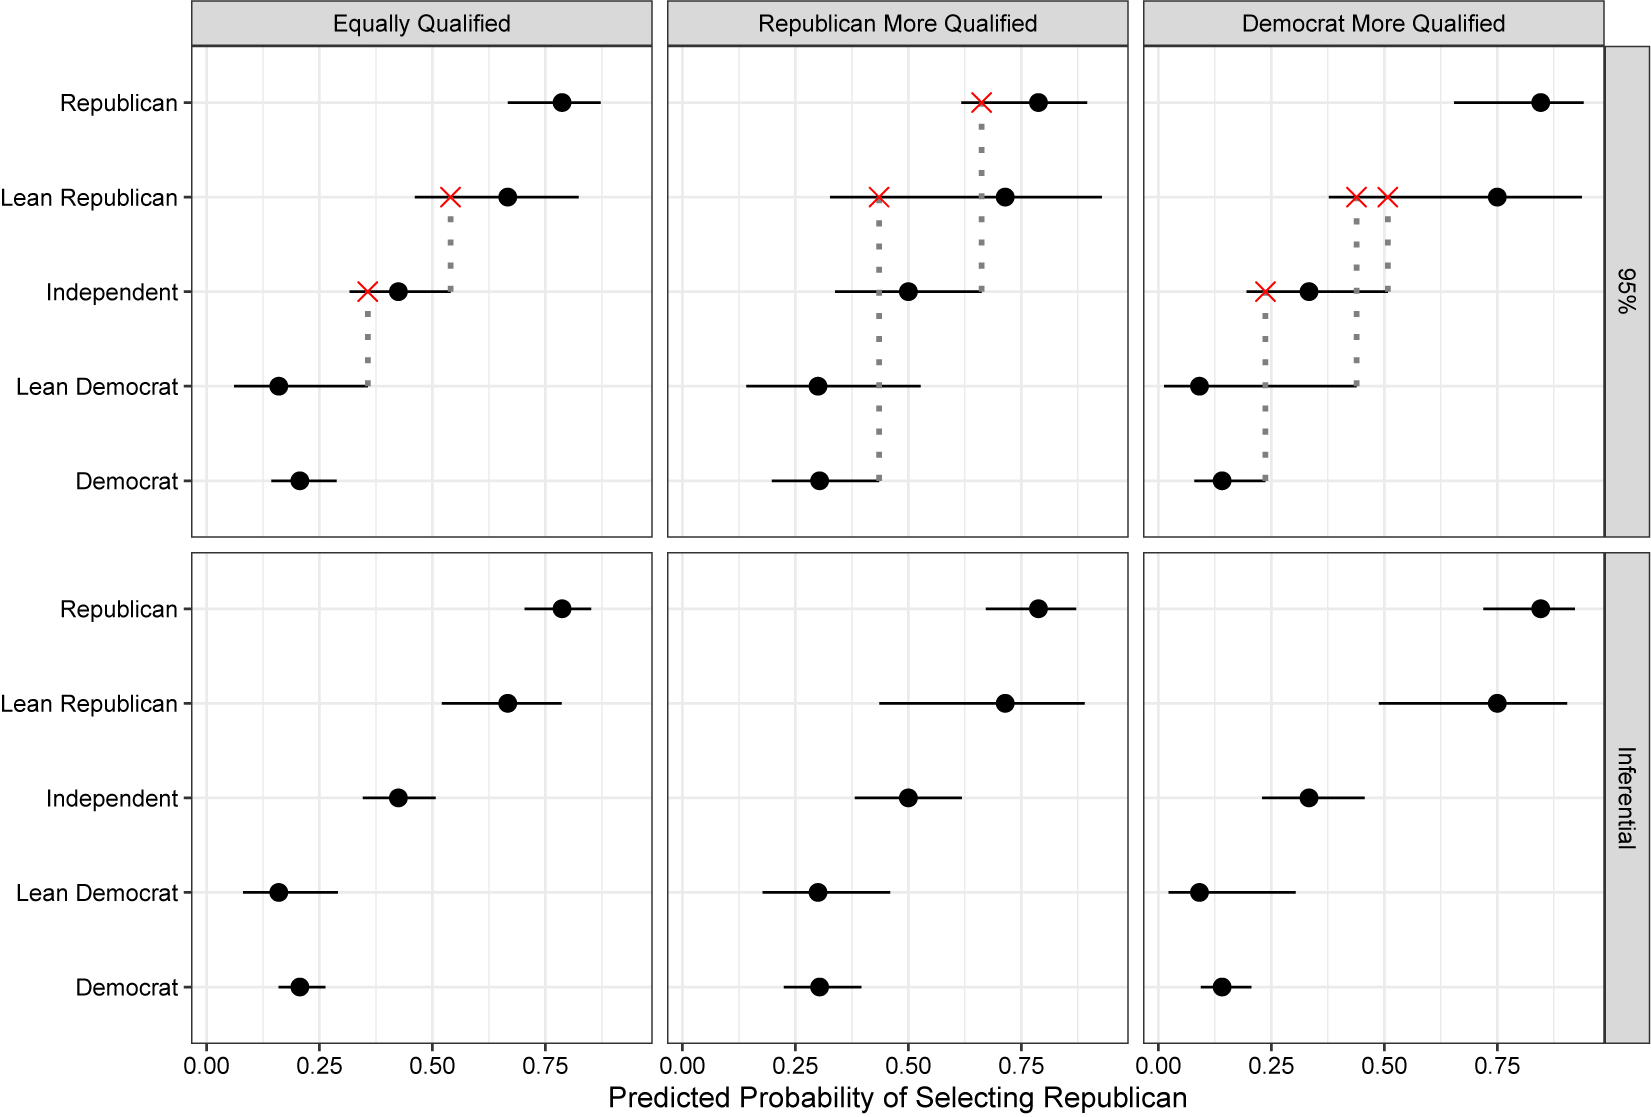
For example, we can see from the inferential confidence intervals that the estimates for Republicans and Independents are statistically different when the Republican was most qualified, but the 95% intervals overlap.
4 Conclusion
There is a long literature in statistics and more recently in political science that identifies inferential confidence intervals—intervals meant to permit visual testing with the desired type I error rate. Despite continued development and refinement, all attempts continue to suffer from an important flaw—the inferential intervals are only defined for a single pair and vary (perhaps interestingly) across pairs of estimates from the same analysis. Rather than grafting an inferential framework onto the overlaps of confidence intervals, our approach is to focus on the full set of tests to identify the inferential confidence level that maximally corresponds with properly done pairwise tests. Our approach is sufficiently flexible that “properly done” could take on any number of meanings across inferential paradigms, multiplicity corrections and operationalizations of the variance–covariance matrix of the estimates. When tests are inappropriately characterized by our procedure, those tests are directly identified and can be flagged by the analyst; see Appendix 6 of the Supplementary Material for an example. Ultimately, this benefits readers who will be able to make valid inferences about comparisons that may not have been anticipated by the researcher.
Acknowledgments
We would like to thank Matt Lebo, Ryan Bakker, and Arthur Spirling for helpful comments and suggestions.
Funding
This project was funded by the Social Sciences and Humanities Research Council of Canada, grant CRC-2022-00299.
Data Availability Statement
Replication code and data for this article have been published in the Political Analysis Dataverse at https://doi.org/10.7910/DVN/GFLSLH (dataverse).
Supplementary Material
For supplementary material accompanying this paper, please visit https://doi.org/10.1017/pan.2024.24.


 Open access