


Introduction
The status of groundwater in the crystalline upper crust is of profound significance for the safe storage of radioactive waste, however it is not well understood. Proposals for the storage of waste in crystalline rocks commonly take into account the diffusion of radionuclides released from a geological disposal facility (GDF) into the enclosing rock matrix as a factor contributing to the safety case. The hypothesis that such Rock Matrix Diffusion (RMD) can take place to a significant degree is based on an assumption that rocks below the water table will have a porosity that is both interconnected and fully saturated with water, and can interact with fracture fluid by diffusion. Laboratory measurements of RMD are always made under water-saturated conditions, generally with fluid pressure equal to confining pressure, thereby maximising porosity. However, the preservation of readily-hydrated high-temperature minerals, for example biotite, in many igneous and metamorphic rocks, casts doubt on the assumption that all deep crystalline rocks are pervasively wet.
This study was carried out to look for evidence that water flowing in fractures is able to interact with pre-existing pore waters in low permeability crystalline wallrocks. Figure 1 illustrates two possible models for interactions between fluid flowing in a fracture and its wallrocks. Figure 1a illustrates the classic diffusion model for RMD (Alexander et al., Reference Alexander, Mackenzie, Scott and McKinley1990; Baker et al., Reference Baker, Jackson, Jefferies and Lineham2002; Jakob, Reference Jakob2004; Lever and Bradbury, Reference Lever and Bradbury1985; Neretnieks, Reference Neretnieks1980, Reference Neretnieks2017). In this model, both fracture and wallrocks are fully saturated with water and the model predicts that species diffuse towards or away from the fracture at a rate that depends on the intrinsic properties of each species. Figure 1b is an alternative model (Alexander et al., Reference Alexander, Mackenzie, Scott and McKinley1990; Wogelius et al., Reference Wogelius, Milodowski, Field, Metcalfe, Lowe, van Veelen, Carpenter, Norris and Yardley2020; Metcalfe et al., Reference Metcalfe, Milodowski, Field, Wogelius, Carpenter, Yardley and Norris2021), in which the fracture is surrounded by a damage zone with microcracks and enhanced porosity due to mineral reactions, resulting in higher permeability. Away from the fracture wall, the water content, saturation and transport properties of the wallrock change rapidly through the damage zone. This model implies that the fronts for the migration of all mobile species introduced in the fracture will be clustered at the edge of the damage zone, due to the abrupt change in transport properties on passing from the damage zone into fresh rock, rather than being smeared out according to the different diffusivities of different species. This model does not assume that the wallrocks are initially wet, although if they are lacking a continuous pore fluid film then diffusion beyond the damage zone will be negligible.
Alternative models for interaction between fluid flowing in a fracture and surrounding igneous or metamorphic wallrock. (a) Rock Matrix Diffusion model based on Baker et al. (Reference Baker, Jackson, Jefferies and Lineham2002); the wallrocks are assumed to be water saturated throughout, permitting diffusive exchange between wallrock pores and fracture fluid. (b) Fracture Damage Zone model simplified from Metcalfe et al. (Reference Metcalfe, Milodowski, Field, Wogelius, Carpenter, Yardley and Norris2021). Water flows through microcracks and pores in a damage zone around the main fracture, as well as in the fracture itself. Alteration reactions in the damage zone create secondary porosity and permit enhanced diffusion, however there is an abrupt transition from the altered damage zone to unaltered wallrock with little evidence for the introduction of water.

We have set about trying to identify a wallrock pore-water component in fractured crystalline rocks by analysing the oxygen isotopic composition of samples of igneous and metamorphic rocks that host low-temperature veins. We specifically investigated secondary calcite, occurring in veins and as a replacement phase in their wallrocks, utilising secondary ion mass spectrometry (SIMS) analysis to obtain the highest possible spatial resolution (Valley and Graham, Reference Valley and Graham1991; Hervig et al., Reference Hervig, Williams, Thomas, Schauers and Steele1992; Eiler et al., Reference Eiler, Graham and Valley1997; Allan and Yardley, Reference Allan and Yardley2007), enabling analysis of grains only a few tens of micrometres across. Figure 1a predicts a progressive change in calcite δ18O values as infiltrated water grades into wallrock water. If, however, wallrock pore water was sparse, and wallrock reactions were sluggish relative to flow through the vein (Fig. 1b), then the calcite δ18O values should be very similar in both vein and wallrock. Water oxygen composition reflects the fluid source and in turn, with temperature, dictates calcite oxygen composition. Though our results do not directly address the possible exchange of contaminants between fracture and wallrocks, models for RMD make assumptions about the connectivity of water between fractures and wall-rock pores which can be addressed by data on water oxygen composition.
Samples
Three samples were selected for detailed study, two were veined metavolcanic rocks from deep boreholes in the Borrowdale Volcanic Group of Cumbria, drilled as part of the UK Nirex investigations at Longlands Farm near Sellafield, UK and one was from the Mountsorrel Granodiorite, Leicestershire, UK, collected in a deep quarry. All three veins were formed in discrete fracturing events late in the local veining history, as discussed below, and while the host rocks resided in the upper few kilometres of the crust. Thus, they give an insight into the state of the upper crust a little below the likely depth for construction of a waste repository.
Borrowdale Volcanic Group samples
The Borrowdale Volcanic Group samples were collected from archive samples (held by the National Geological Repository, British Geological Survey (BGS)) that were originally taken from two of the cored boreholes drilled as part of UK Nirex Limited site investigations near Sellafield, west Cumbria, UK (Shaw et al., Reference Shaw, Fortey, Turner, Kemp, Wheatley, Rowley and Baker2002; Bowden et al., Reference Bowden, Bumpus and Littleboy1998). These samples are examples of fractures with carbonate mineralisation and well-developed wallrock alteration. The carbonate mineralisation corresponds to Mineralisation Episode ME6 of Milodowski et al. (Reference Milodowski, Gillespie, Naden, Fortey, Shepherd, Pearce and Metcalfe1998, Reference Milodowski, Bath and Norris2018) who showed that it is probably of Triassic or early Jurassic age, formed as a result of the infiltration of brines linked to Permo–Triassic evaporites in the cover.
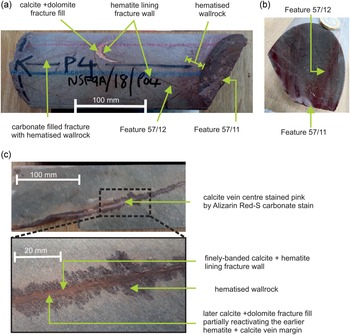
NSF-9A (Fig. 2a,b) was taken from BGS archive core sample NSF9A/18/P4, recovered from borehole NSF9A, and is a sample of fine-grained meta-andesite from a depth of 80 m below the surface. The very fine silicified matrix is crowded with small (1–2 mm) sericite pseudomorphs after euhedral plagioclase phenocrysts. It is cut by several thin, steeply-inclined planar fractures, typically <0.5 mm in width, containing calcite and dolomite, sometimes with minor K-feldspar and sericite and commonly flanked by a zone of reddened wallrock around 1–10 mm in width (although more general reddening is also present in parts of the sample). Secondary carbonates are present in the reddened fracture walls as well as in the vein. The veins show evidence of poly-episodic reactivation and mineralisation. Typically they display an early lining of very fine banded hematite and calcite which has been reactivated by subsequent fracture movement and mineralised by later ferroan dolomite and calcite (Fig. 2a,b). Two of the fractures are locally vuggy and have a thin coating of very late-stage euhedral calcite crystals.
Samples of late-formed (ME 6) carbonate veins with hematitic altered margins, cutting metavolcanic Borrowdale Volcanic Group host rocks (see Figs 4 and 5 for further detail). (a) Sample NSF-9A showing several carbonate–hematite mineralised fractures. This includes a prominent steeply-inclined vein (feature 57/12) with a red hematitic margin, partially mineralised by a fill of calcite and dolomite. One end of the core sample is defined by an open fracture (feature 57/11), which is patchily coated by dolomite and displays a prominent reddened wallrock alteration zone. (b) Section across core sample NSF-9A showing narrow reddened wallrock alteration zones adjacent to fracture features 57/11 and 57/12. (c) Sample RCF-1 showing thin carbonate–hematite vein displaying narrow reddened zones of wallrock alteration. The centre of the vein (upper image) is locally mineralised by coarser calcite (stained pink by Alizarin Red-S dye). The vein margins comprise finely laminated hematite and calcite (lower image). The ‘Feature’ numbers refer to specific fractures recorded in the original UK Nirex Limited borehole core logs.

RCF-1 (Fig. 2c) was taken from BGS archive core sample RCF1/90/P4, recovered from borehole RCF1 and is a metavolcanic rock from a depth of 735 m below the surface. It contains pseudomorphs of sericite and K-feldspar after plagioclase phenocrysts in a foliated, silicified matrix with sericite. One side of the sample is a complex, steeply-inclined hematite-carbonate vein. The edge of the vein comprises interlaminated thin layers of calcite and hematite, with the iron oxide patchily replacing some of the carbonate layers and extending locally as veinlets into the adjacent wallrocks. The vein interior contains intergrown carbonates and iron oxides, within which sporadic coarser vugs are lined by ferroan dolomite and calcite, speared by hematite needles. This later dolomite and calcite locally cross-cuts calcite–hematite vein margins (Fig. 2c). Outside the vein, calcite also occurs in thin lenses, possibly veinlets, that have opened up in shear zones adjacent to the main vein, however it is finely intergrown with dolomite and silicates, which hampered analysis.
Mountsorrel granodiorite sample
The Mountsorrel Complex comprises mainly xenolithic granodiorite, with smaller masses of hornblende gabbro and quartz diorite. It is part of a larger Caledonian intrusive igneous complex that was emplaced into Cambrian to Ordovician slates in the northern part of Charnwood Massif, which forms part of the Late Precambrian to Lower Palaeozoic basement of the Wales–London–Brabant Massif that underlies the English Midlands, UK (Millward, Reference Millward, Brenchley and Rawson2006; Carney et al., Reference Carney, Ambrose, Cheney and Hobbs2009; Hough et al., Reference Hough, Schofield, Pharaoh, Haslam, Loveless, Bloomfield, Lee, Baptie, Shaw, Bide and McEvoy2018).
MSG-1 (Fig. 3) is a granodiorite sampled from a depth of ~120 m below sea level, in the Tarmac Mountsorrel Quarry open pit. The sample has a vein a few mm thick along one side, composed of calcite, dolomite and K-feldspar, sometimes with minor phengite or saponite clay. Away from the vein, the rock is a typical Caledonian granite, made up of quartz, weakly sericitised plagioclase and perthitic alkali-feldspar grains typically several mm across, with minor biotite and hornblende both showing a small degree of chloritisation. Adjacent to the vein there is typically intense alteration of plagioclase cores to secondary K-feldspar, phyllosilicates and open pores. Less-altered plagioclase may develop pores partially infilled with calcite. Overall, the observed changes reflect introduction of water and carbon dioxide to vein wallrocks, with redistribution of at least Ca, Mg K and Na. The coarse grain size of the wallrock makes it difficult to quantify the scale of alteration, however the most intense alteration is of grains cut by the vein, and development of calcite with associated chlorite can occur in elongate patches 2–3 grain diameters from the vein. These may represent healed microfractures.
BSE images of a late-stage carbonate – K-feldspar vein in Mountsorrel Granodiorite (Sample MSG-1). (a) Overview with the vein forming the upper edge of the field of view, and primary minerals (‘1ry’) dominant in the wallrock except where the calcic core of a large plagioclase grain (plag) has been intersected by the vein resulting in extensive alteration to secondary (‘2ry’) products. Yellow boxes denote the areas shown in b and c. (b) Detail of the edge of the altered plagioclase shown in a, the outer albite (ab) rim of the plagioclase is unaltered but internally the plagioclase is replaced by secondary K-feldspar (K-fsp) and dark-grey clay minerals. Black areas are holes and include small secondary pores with the clay and larger holes formed by plucking during preparation. (c) Detail of the vein and its margin. The constituent minerals are calcite (cte, lightest grey), dolomite (dol, darkest grey) and K-feldspar. These are intergrown throughout the vein; K-feldspar also mantles the contact with original plagioclase.

The age, temperature and depth of formation of the sampled veins in MSG-1 are not known, though they all belong to the latest stages of veining and fracturing (King and Ford, Reference King, Ford, Sylvester-Bradley and Ford1968). The mineralogy is also similar with calcite, dolomite and K-feldspar present in all veins. Detailed investigation of sample MSG-1 demonstrated that these minerals have compositions close to the pure end-members indicative of low-temperature growth, below 250°C.
Analysis
Initial sample characterisation was carried out on polished thin sections of fractures and their wallrocks, using a Tescan VEGA3XM scanning electron microscope (SEM) at the Leeds Electron Microscopy and Spectroscopy Centre in the University of Leeds (LEMAS). Polished blocks for use in the ion micro-probe were prepared using rock chips from a parallel slice to the polished section, together with a piece of calcite standard. The polished blocks were imaged in back-scattered electron (BSE) mode using a FEI QUANTA 650 FEG SEM with environmental capability, also at LEMAS, to avoid the risk of damage to the surface layers to be analysed by SIMS. This allows images to be collected for use in locating analysis points without applying a conductive coating to the blocks before they are gold-coated for SIMS analysis. Figs 4–6 are BSE images of each of the samples, showing textural relationships and examples of analysis spots.
BSE image of the altered margin of intersecting carbonate veins (below and left), Sample NSF-9A. Fine white grains are the iron oxides that cause reddening of the vein margin (see Fig. 2a). White circles are sites of individual ion probe analyses of calcite; the associated numbers are the values of δ18O determined at each spot.

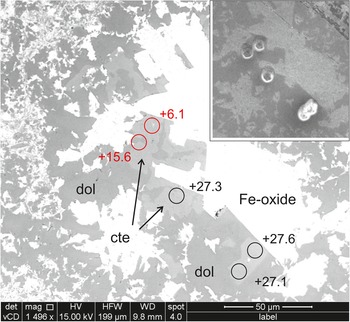
BSE image of a coarse patch in the analysed carbonate vein, Sample RCF-1 (Fig. 2b); the inset shows the same area reimaged after analysis. Iron oxide (Fe-oxide) grains are white, calcite (cte) is slightly lighter grey than dolomite (dol). Circles are sites of individual ion probe analyses of calcite; the associated numbers are the values of δ18O determined at each spot. Points shown in red are anomalously light values, probably due to contamination with iron oxide, which were rejected (see Supplementary Table S1). Inset shows the same area after analysis with the analysis pits. Note that this area is texturally identical to other parts of the vein which give significantly different values (see text).

BSE images of sample MSG-1 (Fig. 3) with examples of ion probe spot analyses of δ18O in calcite. (a) Calcite partially replacing plagioclase in wallrock close to the vein edge. Inset is a SEM image of the same area after analysis showing the ion probe pits. (b) Calcite–dolomite–K-feldspar vein with analyses of calcite from both sides of an altered wallrock fragment.

The oxygen isotopic composition of calcite was determined using the Cameca IMS 1270 secondary ion mass spectrometer at the Edinburgh Ion Micro-Probe Facility, under the guidance of Dr John Craven. Calibration of this technique is very sensitive and each sample must be mounted with a standard that is as close as possible in composition to the unknowns. Hence only calcite analyses were attempted, using a University of Wisconsin calcite standard. The hydrothermal calcites investigated were checked for purity and sample MSG-1 calcites were analysed quantitatively. MgO contents are generally below 0.5 wt.% with FeO normally below 0.1%. The SIMS technique is destructive with small pits being sputtered into the mineral surface, c.15 μm across (see insets to Figs 5 and 6a). Blocks of analyses of the standard were made at regular intervals through the analysis session and used to correct for drift. The standard deviation of the analyses of each standard block was ca. 0.25‰ after correction for drift, with a standard error ca. 0.15‰. Points for analysis were identified with the aid of BSE images, and the samples were subsequently re-imaged by SEM to confirm the location of the pits left by each analysis.
Results
In each of the samples, analyses were made of at least one cluster of points in both vein and matrix calcite. In each case, several distinct grains were analysed. The great majority of the data yielded compositions of the order of δ18O = +20‰, substantially heavier than the likely original composition of the igneous or meta-igneous host rocks, and consistent with growth from a surface-derived water at low temperature. A small number of points gave significantly lighter or heavier values and though in some cases this was probably due to analytical issues such as surface irregularities or overlap of adjacent minerals, some points may reflect genuine variation as discussed below. The wallrocks are of igneous origin and are unlikely to have had primary compositions significantly heavier than +12‰.
The data obtained from each sample is summarised in Table 1, and this is illustrated graphically in Fig. 7 and presented in full in Supplementary Table S1. The results from samples NSF-9A and RCF-1 are within the range of data presented previously by Milodowski et al. (Reference Milodowski, Gillespie, Naden, Fortey, Shepherd, Pearce and Metcalfe1998) for microdrilled vein calcite samples among a data set of 639 characterised carbonates from the Sellafield area. For this large and varied data set, they reported that vein calcites belonging to the Triassic–Jurassic Mineralization Episode (ME6) have δ18O = +13.4 to +31‰.
Summary of ion probe oxygen-isotope analyses of vein and matrix calcite. Examples of individual analyses are shown in Figs 4–7 and the full data set is presented in Supplementary Table S1.

n = number of individual analyses.
Matrix (circle) and vein (diamond) calcite oxygen compositions, summarised in Table 1 and included in Table S1. Each sample has two groups of vein analyses from different portions of the vein.

NSF-9A has calcite finely intergrown with dolomite in both veins and matrix. Figure 4 illustrates the bulk of the area investigated, with parts of two analysed veins near the left and bottom margins. There is a small difference in mean composition between the two veinlets seen in the image, δ18O = 20.6‰ and δ18O = 21.3‰, however two points were distinctly heavier than this and may represents parts of the vein formed from influx of fluid from a different source or at a cooler temperature, as discussed for sample RCF-1, below. Matrix grains suitable for analysis were difficult to locate, however five points, all shown in Fig. 4, gave a mean matrix calcite composition of δ18O = 21.2‰, very similar to vein compositions.
RFC-1 has coarse vein calcite that was located and analysed easily, however matrix calcite proved elusive. In this sample, two populations of vein calcite were distinguished. Vein calcite with dimensions of 10–30 μm are intergrown with similar sized dolomite and iron oxide in the central part of the vein (Fig. 5). The small grain size means that some analyses were contaminated by ‘light’ iron oxide, however the remainder gave δ18O = 28.0‰ (see Table S1 for details). In a nearby part of the vein, the same minerals occur in a coarse patch with carbonate grain sizes of 50–100 μm. Here, the composition is quite distinct with δ18O = 20.6‰. Matrix carbonate grains were small, generally with minimum dimensions close to spot size, intergrown with silicates, and predominantly of dolomite, however two points on one calcite grain gave δ18O = 18.3‰ (see Table S1 for details). This sample indicates that mineralogically similar parts of the vein formed either from different composition fluids or at a different temperature. Matrix calcite data are too limited for definitive conclusions, but much closer to vein calcite than to probable wallrock compositions.
MSG-1 was the most straightforward sample to investigate as vein calcite grains were less intergrown with other minerals, and the analyses show much less variation. Two vein areas a few mm apart were investigated and proved internally homogeneous, though one was distinctly lighter at δ18O = 19.0‰ compared to δ18O = 20.9‰. Matrix calcite grains occurred as replacements for plagioclase (Fig. 6a), and showed slight variability between grains within a single former plagioclase (δ18O = 18.2‰ to 24.0‰). A second matrix area contained dolomite as well as calcite, however the range of calcite compositions overlapped (δ18O = 17.3‰ to 20.4‰) and both areas gave compositions indistinguishable from the vein calcites.
Interpretation
The oxygen isotopic composition of calcite reflects both the composition of the water from which it has grown and the temperature at which it grew (Chacko et al., Reference Chacko, Cole, Horita, Cygan and Kubicki2001). The signature of vein and matrix calcites is significantly heavier than igneous rocks, but overlaps values typical of diagenetic calcite (Taylor, Reference Taylor1968; Hoefs, Reference Hoefs2021).
The fractionation of oxygen isotopes between calcite and fluid is strongly sensitive to temperature at low temperatures (Fig. 8). It is therefore remarkable that the bulk of the vein calcites we have studied lie within a very narrow range of values around δ18O = +18 to +21‰. This suggests that both the composition of the fluid from which they grew, and the temperature of growth, were similar.
Oxygen isotope fractionation between calcite and water, from the data compilation of Vho et al. (Reference Vho, Lanari and Rubatto2019).

If the fluid from which calcite grew was pore water with a long residence time in the wallrocks, we would expect its oxygen composition to be buffered by the reactive components of the host rock. For the granite sample MSG-1 the pattern of alteration shows that these would have been dominated by plagioclase feldspar. At equilibrium, plagioclase feldspar has a similar oxygen isotopic composition (within 1‰) to coexisting calcite at upper crustal temperatures (Vho et al., Reference Vho, Lanari and Rubatto2019), and so if calcite grew from water which was reacting with primary igneous feldspar nearby, we would expect it to inherit a similar isotopic composition to the igneous feldspar. We were not able to analyse feldspar from our samples, so in the absence of data for the specific parent rocks, we made a comparison with literature data on similarly fresh Caledonian and other granites (Harmon, Reference Harmon1984; Hoefs, Reference Hoefs2021). MSG-1 is likely to have had an oxygen composition around +10‰ to +12‰. Similarly, Borrowdale Volcanic Group rocks typically have mineral compositions lighter than +10‰ (Thomas et al., Reference Thomas, Harmon and Oliver1985), precluding them as a major source for the oxygen in analysed calcite from the Borrowdale Volcanic Group samples.
Alternatively, if all the calcites grew from water that was infiltrating along fractures (Fig. 1b), their compositions should reflect groundwaters from younger sediments, and the temperature of the water–rock interaction. Information on the oxygen composition of calcites grown from UK groundwaters has been included in the review by Milodowski et al. (Reference Milodowski, Bath and Norris2018) and bracket the data presented here. If we take seawater as the likely heaviest groundwater composition (δ18O = 0‰) and assume that our analysed calcite grew from it, then we can deduce from the calcite–water fractionation curve (Fig. 8) that the likely maximum temperature of growth of most calcite was 65–85°C. However the heaviest calcites from the Borrowdale Volcanic Group samples would then require even lower temperatures, below 40°C and within the range of modern UK spring waters (Edmunds, Reference Edmunds and Mather2004; Darling, Reference Darling2019). It is likely, as noted earlier, that the veining was related to infiltration by basinal brines linked to Triassic evaporites, and strongly evaporated brines can have oxygen compositions heavier than seawater, up to δ18O = +6‰ (Lloyd, Reference Lloyd1966). With the data available, we cannot distinguish whether the heavy oxygen values of some late-stage calcite is due to infiltration of more strongly evaporated brines or results from cooling of the top of the basement due to circulation of deep-penetrating groundwater, however the heaviest calcite values are found in the internal parts of veins from the Borrowdale Volcanic Group samples which may indicate a local fluid event rather than low-temperature growth.
According to the diffusion model (Fig. 1a), we might expect vein calcite composition to reflect the introduced vein fluid and matrix calcite composition to converge on lighter, rock-buffered values away from the vein. None of the calcites analysed have compositions approaching rock-buffered values, however the lightest individual analyses of matrix calcite are lighter than the vein analyses in all samples (Table 1). Nevertheless, only in RCF-1 are the matrix calcites significantly lighter (by just 2‰) than those from veins. This may reflect a matrix pore-water contribution, but does not prove one. This is because the alteration of the wallrocks releases a low δ18O population into the fluid, which will tend to give rise to lighter composition secondary calcite as a part of the replacement process, irrespective of whether matrix pore water contributed.
Discussion
The oxygen isotope data presented here indicates that the growth of calcite in late-stage veins, and in their immediate wallrocks, is dominated by the infiltration of deep groundwater, with no unequivocal evidence of interaction with pore waters from the wallrocks. This indicates that pore water, if present, is sufficiently overwhelmed by the infiltrating groundwater to leave little trace in the composition of secondary calcite growing near the vein. Combined with the existence of unaltered igneous minerals (minerals that are potentially reactive with water) throughout sample MSG-1 except for thin vein – wallrock boundary regions, our evidence suggests that the common assumption used for modelling RMD, that crystalline rocks below the water table have water-saturated pores with which infiltrating fracture water can exchange material by diffusion, might not be valid. Instead, the oxygen isotope data and the distribution of calcite in the samples both fit the damage zone model illustrated in Fig. 1b, with no evidence that these rather abundant fluid components penetrated more than a short distance beyond the fracture walls.
The veins we have studied formed in the top few kilometres of the crust as their host rocks were being exhumed. The age and complexity of these basement rocks mean that they may have undergone multiple episodes of exhumation and burial, however the similarity of the calcite oxygen compositions in late-formed, low-temperature veins from two distinct regions implies that both the groundwater composition and temperature of veining were similar throughout. This suggests that veining probably took place near the lower limit of groundwater penetration, with the wallrocks initially undersaturated with pore water or even dry. It is possible that all the veins studied are of similar age.
The presence of some vugs in the centre of the vein in RCF-1 with identical mineralogy but a distinctly heavier oxygen isotopic composition to the rest of the vein, may be due to a distinct fluid or a lower temperature of formation. The fluid was almost certainly a highly evaporated bittern brine with δ18O heavier than seawater, as otherwise the temperature of mineral growth seems unreasonably low, though this does not preclude a change in temperature as the vein grew. As cool deep groundwater first penetrates into previously impermeable warm basement rocks, it will be heated by them, however as more groundwater flows through the cracks, the crack walls may be cooled. It is possible that the vein grew initially at a temperature close to the original rock temperature, but later growth may have taken place at a lower temperature reflecting the groundwater source.
This study suggests that the transition from basement crystalline rocks that are water saturated, present immediately below the water table, to essentially dry crystalline rocks deep in the crust, may take place in the uppermost crust. In particular, tight crystalline rocks with suitable characteristics to host a geological repository showed evidence of introduced water in discrete fractures and their immediate wallrocks, with evidence of hydration, carbonation and oxidation. The data do not provide evidence of interactions between the introduced water in fractures and any existing pore water in the intervening rock mass. Careful characterisation of the host rocks at a specific site is evidently required before RMD can be invoked as part of the Safety Case.
Acknowledgements
The Ion Probe analyses reported here were carried out at the Edinburgh Ion Probe Laboratory with the guidance and generous assistance of Dr John Craven. We are also grateful to Richard Walshaw for assistance with the SEM work. An earlier version of the manuscript benefitted from the comments of two anonymous reviewers. This work is part of a project funded by Nuclear Waste Services, formerly Radioactive Waste Management.
Supplementary material
The supplementary material for this article can be found at https://doi.org/10.1180/mgm.2023.46.
Competing interests
The authors declare none


 Open access