


INTRODUCTION
Experimental studies (Zazzo et al. Reference Zazzo, Saliège, Person and Boucher2009, Reference Zazzo, Saliège, Lebon, Lepetz and Moreau2012; Hüls et al. Reference Hüls, Erlenkeuser, Nadeau, Grootes and Andersen2010; Van Strydonck et al. Reference Van Strydonck, Boudin and Mulder2010) have shown that only a fraction of original bone apatite carbon remains in the bone after cremation, but that there is a significant carbon uptake from the pyre atmosphere, which is derived mainly from the burning fuel. This was not realized almost two decades ago when a pioneering study on radiocarbon (14C) dating cremated bone (CB) demonstrated that dates on the bio-apatite of fully calcined bone were comparable to those on associated charcoal (Lanting et al. Reference Lanting, Aerts-Bijma and van der Plicht2001). As other studies tested the validity of dating CB using charcoal and other contemporaneous organic materials, they obtained similar results, and cases of charcoal dates being older than their associated CB were attributed to the “old-wood effect” (Lanting et al. Reference Lanting, Aerts-Bijma and van der Plicht2001; De Mulder et al. Reference De Mulder, Van Strydonck and Boudin2009). Research continue investigating what isotopic changes bone undergoes when cremated (Van Strydonck et al. Reference Van Strydonck, Boudin, Hoefkens and De Mulder2005, Reference Van Strydonck, Boudin and Mulder2010; Naysmith et al. Reference Naysmith, Scott, Cook, Heinemeier, Van der Plicht, Van Strydonck, Bronk Ramsey, Grootes and Freeman2007; Olsen et al. Reference Olsen, Heinemeier, Bennike, Krause, Margrethe Hornstrup and Thrane2008; Zazzo et al. Reference Zazzo, Saliège, Person and Boucher2009; Snoeck et al. Reference Snoeck, Schulting, Lee-Thorp, Lebon and Zazzo2016a). Experimental studies on the origin of CB apatite carbon demonstrated that bone exchanges carbon with the combustion atmosphere during cremation, giving calcined bone a mixed carbon signal. Hüls et al. (Reference Hüls, Erlenkeuser, Nadeau, Grootes and Andersen2010) cremated modern bone in a sealed furnace filled with 14C-free CO2 obtained from fossil fuel, and by dating the CB found that 53–86% of carbon in re-crystallized bio-apatite was derived from the cremation atmosphere. This was confirmed by open-air experiments under natural conditions, where Zazzo et al. (Reference Zazzo, Saliège, Lebon, Lepetz and Moreau2012) using archaeological bone and recent wood measured a carbon exchange of 48–91%, while Snoeck et al. (Reference Snoeck, Brock and Schulting2014), using modern bone and old wood of known-age, measured a carbon exchange of 39–95%. Carbon exchange between the bone and the combustion atmosphere will cause a calendar date offset between the calibrated 14C measurement and the main event of interest (the date of cremation), which we will in the present paper refer to as a wood-age offset.
Unless a body is cremated with recent, short-lived fuel, the wood-age offset will always make the CB date older than original unburned bio-apatite. From an archaeological perspective, cremation is a separate event occurring after death and before burial, but they are here regarded as the same event, as their total duration is shorter than the resolution of the 14C calibration curve for the Holocene (true in most but not all cultures). However, what is dated is a 14C event, i.e. when atmospheric CO2 is sequestered as organic carbon in a living organism, and the time over which this occurs (i.e. from formation to death) is here defined as the intrinsic age (IA) of any given material. We note that unburned bio-apatite also has an unknown IA, which may vary between individuals (depending on e.g. their age at death) and between bones of the same individual (due to differences in bio-apatite remodeling rates). Beside a lack of empirical data on bio-apatite remodeling rates, both age-at-death and skeletal element sampled are more difficult to determine in cremations than in inhumation burials. Nevertheless, given expected mortality patterns, we assume that the IA of unburned bio-apatite in prehistoric cremations seldom exceeds 1–2 decades.
The Importance of Fuel
The consequence of carbon exchange taking place between the bone and the pyre atmosphere is that dating CB is equivalent to or at least close to directly dating the fuel used on the pyre. If the pyre wood has a low IA, even a high degree of carbon exchange will lead to limited wood-age offsets, but conversely even low degrees of carbon exchange may cause significant wood-age offsets if the wood has a high IA. Another possible scenario is that the IA of fuel and bone may be close, causing constant CB 14C ages, regardless of the degree of carbon exchange. It has long been recognized that charcoal might have a high IA, making the chronological relationship between the sample and the context from which it is recovered difficult to interpret (Bayliss Reference Bayliss and Evin1999). There is however little information about the IA of the vast majority of archaeological charcoal samples, which is not only problematic when wood-age offsets are transferred to CB, but also when charcoal is used as known-age reference material.
It is clear that the choice of pyre wood is of concern when 14C dating CB. Modern open-air experiments indicate cremation of a human body takes 5–7 hr and requires 1–2 m3 of firewood, but with large variation dependent on wood type and quality, weather conditions, maintenance of the fire, etc. (Henriksen Reference Henriksen2016). Prehistoric cremation graves are abundant worldwide, but actual pyre sites are rarely located, leaving only limited information on processes prior to interment, e.g. fuel procurement strategies and pyrotechnical operations of a cremation pyre. Even when pyre sites are located, they hold limited information, as the cremation process will have destroyed most of the fuel. Moreover, anthracological studies of pyre charcoal often only identify the wood taxa, without discussing wood-age. Hornstrup et al. (Reference Hornstrup, Glintborg Overgaard, Andersen, Bennike, Hambro Mikkelsen and Malmros2005) analyzed charcoals from 16 cremation graves from Late Bronze Age to Early Iron Age in North and West Jutland showing a predominance of oak (75% Quercus sp.), followed by pine (25% Pinus sp.), alder (12.5% Alnus sp.), birch (12.5% Betula sp.), hazel (12.5% Corylus sp.) and willow (6% Salix sp.). Heather (C. vulgaris) was present in low frequencies in the majority of cremation graves at Hellegård in Central Jutland, demonstrating the practice of maintaining heath plains in the area. A similar distribution of wood species was used at contemporaneous settlement sites in the area, probably reflecting the local vegetation, but with a clear preference for oak. Although it requires seasoning for a few years, oak wood can produce long-lasting fires with high temperatures, and was widely used as a funerary fuel (e.g. Hissel et al. Reference Hissel, Parlevliet and Verspay2007; Henriksen Reference Henriksen2009; Moskal-del Hoyo Reference Moskal-del Hoyo2012; O’Donnell Reference O’Donnell2016; Martín-Seijo and César Vila Reference Martín-Seijo and César Vila2018; Henriksen Reference Henriksen, Cieśliński and Kontny2019). Anthracological studies of charcoal from prehistoric burial and settlement sites in Denmark show a fuel procurement strategy with a preference for gathering deadwood with limited branch diameters, whereas actual production of fire wood was a later phenomenon associated with the establishment of towns in a time when cremation was no longer practiced (Hornstrup et al. Reference Hornstrup, Glintborg Overgaard, Andersen, Bennike, Hambro Mikkelsen and Malmros2005).
In this paper we analyze archaeological material from Aarre urnfield cemetery in West Jutland, Denmark. The archaeobotanical analyses of material from 11 urn graves at Aarre show a dominance of oak charcoal, followed by alder and maple (Acer sp.) (Online Supplementary Information 3, Effenberger Reference Effenberger2017a, Reference Effenberger2017b, Reference Effenberger2019), corresponding well to the expected taxonomic availability in the area (Iversen Reference Iversen1974). All elements of the trees are represented, from twig to heartwood, with no apparent differences between graves. There would have been few oak trees in the open landscape around Aarre and wood gathering must have extended beyond the immediate surroundings (Iversen Reference Iversen1974). Alder is surprisingly common, given that it produces little heat and does not burn for long, but this may reflect the local abundance of the species. All elements of the trees were used, possibly reflecting gathering of deadwood or felling of younger trees, creating a combination of low IA for the young wood and IA ranging from ≥ 50 and up to 80 yr for alder and probably up to a few centuries for oak. Small caliber wood might have been used as kindling material, but might also reflect a landscape with few larger trees (Iversen Reference Iversen1974). The strategies for wood procurement at Aarre were probably determined by a combination of different factors, where wood availability both in close proximity and beyond seems to have played a large role.
Approaching the Issue of Wood-Age Offsets
There is limited empirical data available on the scale of wood-age offsets in CB, although multiple studies report 14C dates on paired CB and charcoal (e.g. Lanting et al. Reference Lanting, Aerts-Bijma and van der Plicht2001; Van Strydonck et al. Reference Van Strydonck, Boudin, Hoefkens and De Mulder2005; Olsen et al. Reference Olsen, Heinemeier, Bennike, Krause, Margrethe Hornstrup and Thrane2008; De Mulder et al. Reference De Mulder, Van Strydonck and Boudin2009; Chatters et al. Reference Chatters, Brown, Hackenberger, McCutcheon and Adler2017). As charcoal can be affected by variable wood-age offsets, it is difficult to infer what offset is transferred from the cremation fuel to the CB. To assess the scale of wood-age offsets in CB, it is desirable to focus on associated material with no IA, e.g. charred twigs or cereal grains, but such samples are often difficult to obtain from an archaeological context. Olsen et al. (Reference Olsen, Heinemeier, Bennike, Krause, Margrethe Hornstrup and Thrane2008) reported five pairs of 14C dates on CB and pitch (wood resin with negligible IA) from the Danish Bronze Age, with a mean difference (CB – pitch 14C age) of 26 ± 26 14C yr (ranging from 8 to 92 yr). In another paper, two combined CB 14C ages were compared to a dendrochronological date, indicating that the CB was 73 ± 26 14C yr older than the date of cremation (Olsen et al. Reference Olsen, Heinemeier, Hornstrup, Bennike and Thrane2013). In a recent study of a historically attested Buddhist monk from medieval Japan, Minami et al. (Reference Minami, Mukumoto, Wakaki and Nakamura2019) 14C dated three samples of fully cremated white bone and a combination of the dates shows them to correspond well with the lifetime of the monk. As wood-age offsets are on the calendar scale (“type t” offsets: Bronk Ramsey Reference Bronk Ramsey2009b), we calibrate these dates before comparing them using the Difference function in OxCal v4.3 (Bronk Ramsey Reference Bronk Ramsey2009a). We model all the differences from Olsen et al. (2008; Reference Olsen, Heinemeier, Hornstrup, Bennike and Thrane2013) and Minami et al. (Reference Minami, Mukumoto, Wakaki and Nakamura2019) in a bounded phase starting at zero (i.e. requiring the CB to have a wood-age offset) and summarize the now-constrained wood-age offsets using the KDE_Plot function (Bronk Ramsey Reference Bronk Ramsey2017). Assuming an exponential distribution of wood-age offsets (i.e. applying a Tau_Boundary (Bronk Ramsey Reference Bronk Ramsey2009a) to the end of the bounded phase), the posterior estimates of the offsets have a 22 yr median and a 1-σ range of 32 yr (Online Supplementary Information 1, Part 1). Based on this limited empirical data set, wood-age offsets in CB appear to be relatively small.
When bone is cremated, isotopic fractionation of carbon takes place as a function of time and temperature (Olsen et al. Reference Olsen, Heinemeier, Bennike, Krause, Margrethe Hornstrup and Thrane2008; Zazzo et al. Reference Zazzo, Saliège, Person and Boucher2009), which in effect means there are no proxies available (e.g. δ13C values) for assessing the scale of wood-age offsets in individual CB samples. Because of this, 14C dates on CB are sometimes used as simple termini post quem, but this means discarding information about the dates of cremations and will be close to useless in cases where only CB dates are available. We propose to instead handle CB dates statistically using the Outlier_Model function of OxCal v4.3 (Bronk Ramsey Reference Bronk Ramsey2009b)(OM), which allows dates to be weighted according to a prior probability for how likely they are to be misleading, and allows the user to specify a distribution for potential offsets. Calendar age offsets in samples susceptible to IA, e.g. charcoal from trunk wood, are assumed to approximately follow an exponential probability density function, i.e. most samples will date close to the event in question, but a diminishing number of dates will be increasingly older (Nicholls and Jones Reference Nicholls and Jones2001; Dee and Bronk Ramsey Reference Dee and Bronk Ramsey2014). This assumption can be modeled using the default Charcoal OM (Bronk Ramsey Reference Bronk Ramsey2009b; Dee and Bronk Ramsey Reference Dee and Bronk Ramsey2014), developed to reduce the impact of wood-age offsets in dates of charcoal, and it has been suggested to also apply this with varying scales to 14C dates on CB (Garrow et al. Reference Garrow, Meadows, Evans and Tabor2014; Fitzpatrick et al. Reference Fitzpatrick, Hamilton and Haselgrove2017). We will in this study take a step back and empirically investigate the scale of wood-age offsets and their underlying distribution, before finally proposing a suitable OM for 14C dates on CB.
MATERIAL AND METHODS
Archaeological Material
CB and context associated organic samples were selected from an archaeological site in West Jutland, Denmark. Aarre urnfield cemetery (sandy soil with low carbonate levels, ca. 8°dH) is a large and well-documented site, with originally up to ca. 1000 burials. The cremated human remains were interred in funerary urns and covered by small earthen mounds enclosed by a ditch. A minority of the graves contained metal artifacts, which can be approximately dated by seriation of typological traits (Becker Reference Becker1961; Jensen Reference Jensen1996). No cremation pyres have been located in the area and all graves are secondary deposits (Lorange Reference Lorange, Foss and Møller2015). Samples from 10 graves were selected for this study, comprising CB, charcoal and other charred plant material. The graves were excavated over the last decade and the contents of the cremation urns were excavated in a controlled indoor environment. Charcoal is interpreted as remains of pyre fuel, whereas cereal grains and seeds might have accompanied the deceased on the pyre. Grass (stems and a bulb of Arrhenatherum elatius ssp. bulbosum) and stems of heather (Calluna vulgaris) probably came from the area underneath or surrounding the pyre, and might have been used as kindling material, but might also have an altogether unintentional relationship to the cremation (Roehrs et al. Reference Roehrs, Klooss and Kirleis2013). All charcoal dates are susceptible to IA, and individual wood-age offsets were therefore estimated based on the typical lifespan of the species and the sampled section of the plant (e.g. trunk wood or twig).
Experimental Material
The third author carried out four separate open-air cremation experiments over the period 2014–2017, cremating modern animal bone using either recent wood or old wood of known age. The experiments took place in the author’s garden on Funen in central Denmark. They were designed to mimic a prehistoric cremation pyre, albeit in a scaled down version, and did not allow close control of environmental parameters. Comparable amounts of bone and wood (ca. 6–7 kg wood per pyre) were burned in an iron brazier, which protected the fire from the wind and ensured the bones were in close contact with the fuel until the fires burned down after 2–2.5 hr. Beyond igniting the fires, no additional wood was added (Henriksen Reference Henriksen2016). Snoeck et al. (Reference Snoeck, Brock and Schulting2014) conducted similar experiments, albeit with fleshed modern bone. The new contribution of our experiment is the dating of multiple bone fragments from the same bone, from the same pyre, thereby documenting variable uptake of exogenous carbon during cremation.
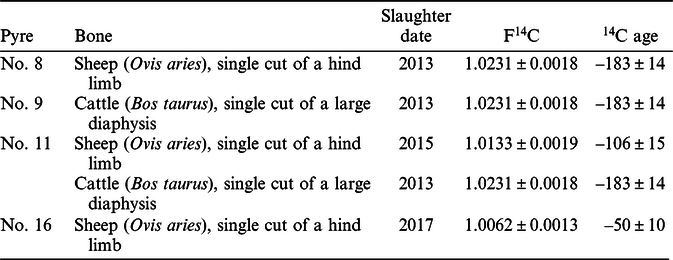
Pyres no. 8 and no. 11 used recent wood and pyres no. 9 and no. 16 used old dendro-dated wood (Table 1) (Daly Reference Daly2011; Daly Reference Daly2014). To obtain F14C values and 14C ages for the old wood, the mean was calculated of the raw curve points over the dendro-dated growth periods (pyre no. 9: 850–670 cal BP, pyre no. 16: 1915–1700 cal BP) in the IntCal13 Northern Hemisphere atmospheric 14C data set (Reimer et al. Reference Reimer, Bard, Bayliss, Beck, Blackwell, Ramsey, Buck, Cheng, Edwards, Friedrich, Grootes, Guilderson, Haflidason, Hajdas, Hatté, Heaton, Hoffmann, Hogg, Hughen, Kaiser, Kromer, Manning, Niu, Reimer, Richards, Scott, Southon, Staff, Turney and van der Plicht2013). For the recent wood, data from the Bomb13NH1 (AD1650–2010) calibration curve (Hua et al. Reference Hua, Barbetti and Rakowski2013) was combined with additional data points from the Hammer and Levin datasets of atmospheric 14C activity from Jungfraujoch in the Swiss Alps (Online Supplementary Information 4) (Levin et al. Reference Levin, Kromer and Hammer2013; Hammer and Levin Reference Hammer and Levin2017). Wood will have an inhomogeneous 14C signal, but our approach effectively assumes that it was fully homogenized by combustion, and any differences in CB 14C ages from each pyre are therefore due to differential carbon exchange. Cuts of cattle (Bos taurus) and sheep (Ovis aries) reared in Denmark were cooked and defleshed prior to cremation (Table 2). Although we assume that prehistoric humans were not defleshed before cremation, skin and flesh will combust at lower temperatures before bio-apatite recrystallization occurs (Zazzo et al. Reference Zazzo, Saliège, Person and Boucher2009; Snoeck et al. Reference Snoeck, Brock and Schulting2014). Collagen from the bones themselves might however contribute to the carbon composition of the pyre atmosphere, but must be burnt out before recrystallization can begin, and should therefore have little effect on the CB 14C age. The animals were all young specimens, so the slaughter dates are compared with recent measurements of atmospheric 14C activity to obtain values of F14C and 14C age before cremation (Levin et al. Reference Levin, Kromer and Hammer2013; Hammer and Levin Reference Hammer and Levin2017). No measurements are yet available for 2017, but because the decline in atmospheric 14C in recent years was relatively steady, we extrapolate a value from the trend over the previous decade. 14C units were converted using Stuiver and Polach (Reference Stuiver and Polach1977), but as we report post-bomb 14C data indicative of 14C activity of the atmosphere rather than radioactive decay, we use the F14C convention rather than pMC (Reimer et al. Reference Reimer, Brown and Reimer2004).
Pyre fuel for experimental pyres with dendro dates and values of F14C and 14C age (Hua et al. Reference Hua, Barbetti and Rakowski2013; Levin et al. Reference Levin, Kromer and Hammer2013; Reimer et al. Reference Reimer, Bard, Bayliss, Beck, Blackwell, Ramsey, Buck, Cheng, Edwards, Friedrich, Grootes, Guilderson, Haflidason, Hajdas, Hatté, Heaton, Hoffmann, Hogg, Hughen, Kaiser, Kromer, Manning, Niu, Reimer, Richards, Scott, Southon, Staff, Turney and van der Plicht2013; Hammer and Levin Reference Hammer and Levin2017).

Animal bone for experimental pyres with slaughter dates and values of F14C and 14C years. 2017 values are extrapolated from the 14C activity of the previous decade (Hua et al. Reference Hua, Barbetti and Rakowski2013; Levin et al. Reference Levin, Kromer and Hammer2013; Hammer and Levin Reference Hammer and Levin2017).
Laboratory Methods
Only samples of white CB were selected. To confirm they were fully calcined, aliquots of powdered untreated CB were analyzed by Fourier-transform infrared spectroscopy (FTIR). The crystallinity index (CI) was estimated as the splitting factor between the two absorption bands at ca. 603 and ca. 565 cm–1 (CI = (A603 + A565)/Avalley) (Person et al. Reference Person, Bocherens, Saliège, Paris, Zeitoun and Gérard1995; Olsen et al. Reference Olsen, Heinemeier, Bennike, Krause, Margrethe Hornstrup and Thrane2008). CB samples were sent to the Centre for Isotope Research (CIO) in Groningen, the Leibniz Laboratory (KIA) in Kiel and the Laboratory for Radiocarbon Dating (RICH) in Brussels for 14C dating. As part of a comparison study, two CB samples were replicated between CIO and KIA; they were pretreated in Groningen following the CIO protocol, but were subsequently converted to CO2 and dated in Kiel (Rose et al. Reference Rose, Meadows, Palstra, Hamann, Boudin and Hüls2019). It has been suggested that it may be unnecessary to bleach CB samples with e.g. sodium hypochlorite to remove any organic material (Snoeck et al. Reference Snoeck, Staff and Brock2016b), but Groningen maintains the procedure as initially introduced by Lanting et al. (Reference Lanting, Aerts-Bijma and van der Plicht2001). Samples of context-associated organic material were sent for archaeobotanical analysis (Effenberger Reference Effenberger2017a, Reference Effenberger2017b, Reference Effenberger2019) and identified single fragments were 14C dated in Brussels or Kiel.
Pretreatment and Combustion
Samples of charred organics were extracted in Kiel and Brussels following standard acid–alkali–acid procedures (Grootes et al. Reference Grootes, Nadeau and Rieck2004; Boudin et al. Reference Boudin, Van Strydonck, van den Brande, Synal and Wacker2015). Samples of CB were extracted using different pretreatment procedures at the three laboratories (Rose et al. Reference Rose, Meadows, Palstra, Hamann, Boudin and Hüls2019). Brussels leached ca. 30% by weight of each solid CB sample in 1% hydrochloric acid, before it was powdered and treated with 1% acetic acid (24 hr) to remove calcite (Van Strydonck et al. Reference Van Strydonck, Boudin and De Mulder2009). Kiel crushed each CB sample before treating it with 0.6% acetic acid (5 × 30 min) and leaching ca. 50% with 1% hydrochloric acid (Hüls et al. Reference Hüls, Erlenkeuser, Nadeau, Grootes and Andersen2010). Groningen treated CB samples with 1.5% sodium hypochlorite (48 hr, 20°C), followed by 6% (1M) acetic acid (24 hr, 20°C) (Dee et al. Reference Dee, Palstra, Aerts-Bijma, Bleeker, de Bruijn, Ghebru, Jansen, Kuitems, Paul, Richie, Spriensma, Scifo, van Zonneveld, Verstappen-Dumoulin, Wietzes-Land and Meijer2019). Kiel hydrolyzed two aliquots of the extracted apatite for five CB samples to increase measurement precision. All CB extracts were reacted with phosphoric acid to produce CO2 and combusted to remove sulfur compounds.
Graphitization and AMS Measurement
Purified CO2 of charred organics and CB was reduced to graphite for AMS measurement. Measurements in Brussels were performed on a Micadas (195.5 kV) AMS system (Boudin et al. Reference Boudin, Van Strydonck, van den Brande, Synal and Wacker2015). Kiel used a HVEE 3 MV Tandetron 4130 AMS system (Nadeau et al. Reference Nadeau, Grootes, Schleicher, Hasselberg, Rieck and Bitterling1997) and Groningen used a Micadas (180 kV) AMS system (Dee et al. Reference Dee, Palstra, Aerts-Bijma, Bleeker, de Bruijn, Ghebru, Jansen, Kuitems, Paul, Richie, Spriensma, Scifo, van Zonneveld, Verstappen-Dumoulin, Wietzes-Land and Meijer2019). The laboratories corrected the resulting 14C-contents for fractionation using the simultaneously AMS-measured 14C/12C and 13C/12C isotope ratios (Stuiver and Polach Reference Stuiver and Polach1977).
Calculating Carbon Exchange
14C ages of CB have been shown to plot along or close to a mixing line between the end-members unburned apatite and burning atmosphere (CO2 AIR + CO2 FUEL) (Hüls et al. Reference Hüls, Erlenkeuser, Nadeau, Grootes and Andersen2010; Zazzo et al. Reference Zazzo, Saliège, Lebon, Lepetz and Moreau2012). Bone organic matter does not contribute to the CB carbon signal, as it degrades at lower temperatures before apatite recrystallization takes place (Zazzo et al. Reference Zazzo, Saliège, Person and Boucher2009; Snoeck et al. Reference Snoeck, Brock and Schulting2014). The percent carbon exchange between unburned apatite and the pyre atmosphere, as indicated by F14C, can be calculated using mass balance Equation (1), assuming the F14C content to be evenly distributed throughout the wood and animals.
 $$\% carbon\ exchange = {{\rm{F}}^{14}{\rm{C}}_{{\rm{unburned}}\ {\rm{apatite}}} - {\rm{F}}^{14}{\rm{C}}_{\rm{CB}}\over {\rm{F}}^{14}{\rm{C}}_{{\rm{unburned}}\ {\rm{apatite}}} -{\rm{F}}^{14}{\rm{C}}_{\rm{pyre\ atmosphere}}}*100(\% )$$
Where F14Cunburned apatite is the atmospheric F14C when the animal was slaughtered, F14CCB is the F14C concentration in cremated bone, and F14Cpyre atmosphere is the mean F14C over the period of wood growth, as it will be dominated by CO2 generated by the wood combustion (Tables 1 and 2) (Zazzo et al. Reference Zazzo, Saliège, Lebon, Lepetz and Moreau2012). % carbon exchange uncertainties for individual samples can be calculated using Equation (2), where σbone is the uncertainty in unburned apatite F14C, σCB is the uncertainty in cremated bone F14C, σfuel is the uncertainty in wood (fuel) F14C, and F14CCB is the F14C concentration in cremated bone. The uncertainties are however relatively trivial (ca. ± 0.5%) compared to the observed range of values.
 $$\% uncertainty = {{\sqrt {{{\rm{\sigma }}_{{\rm{bone}}}}^2 + {{\rm{\sigma }}_{{\rm{CB}}}}^2 + {{\rm{\sigma }}_{{\rm{bone}}}}^2 + {{\rm{\sigma }}_{{\rm{fuel}}}}^2} \over {{\rm{F}}^{14}}{{\rm{C}}_{{\rm{CB}}}}}}*100\left( \% \right)$$
RESULTS
Archaeological Dataset
We report a total of 43 AMS dates measured on 36 unique samples from 10 individual urnfield graves (Table 3). These include measurements on CB, charcoal and short-lived charred plant material (cereal grains and fragments of grass). CI values of CB are all acceptable (>5) and CB δ13C values (mean = –23.2 ± 1.9 δ13C) and %C (mean = 0.19 ± 0.09 %C) fall within expected ranges. Values of δ13C are measured by AMS and the results will be affected by fractionation during acid extraction, graphitization and AMS measurement. Also %C is not strictly comparable between laboratories, as pretreatment methods vary and %C is calculated at different steps in the process (Rose et al. Reference Rose, Meadows, Palstra, Hamann, Boudin and Hüls2019). Archaeobotanical results are provided in Online Supplementary Information 3.
Radiocarbon results on the archaeological data set from Aarre urnfield cemetery (West Jutland, Denmark). Replicate measurements have been tested for consistency and combined following Ward and Wilson (Reference Ward and Wilson1978).

2 Two CB samples were replicated between CIO and KIA; they were pretreated in Groningen following the CIO protocol, but were subsequently converted to CO2 and dated in Kiel (Rose et al. Reference Rose, Meadows, Palstra, Hamann, Boudin and Hüls2019).
AMS dates are calibrated in OxCal v4.3 using the IntCal13 calibration curve (Bronk Ramsey Reference Bronk Ramsey2009a; Reimer et al. Reference Reimer, Bard, Bayliss, Beck, Blackwell, Ramsey, Buck, Cheng, Edwards, Friedrich, Grootes, Guilderson, Haflidason, Hajdas, Hatté, Heaton, Hoffmann, Hogg, Hughen, Kaiser, Kromer, Manning, Niu, Reimer, Richards, Scott, Southon, Staff, Turney and van der Plicht2013) and differences between context associated material and CB are calculated (Figure 1, Online Supplementary Information 1, Part 2). As expected, differences cluster around zero (indicated by the vertical line), but are strongly skewed towards positive values, i.e. associated samples often date older than the CB. The large majority of charcoal samples are much older than the CB dates, however, and might be derived from residual material relating to documented extensive Bronze Age activities in the area (Lorange Reference Lorange, Foss and Møller2015), notwithstanding the excavation of these urns under laboratory conditions. The pyre site or sites have not been located and there is no information on whether a new area was used for each pyre, or whether the same area was used repeatedly. It is possible that some pyres have been constructed on top of older cooking pits from the Bronze Age. All kinds of re-use of an area will severely increase the risk of residual material being re-deposited in a younger context, which appears to have occurred frequently in Aarre. This also underlines the risk of testing the validity of CB dates using associated charcoal dates as “known-age reference material.”
Differences (yr) between calibrated 14C results on context-associated material and CB. Archaeological data set from Aarre urnfield cemetery, grouped by grave. Distributions in black are differences relative to short-lived samples and gray distributions are differences relative to medium- to long-lived samples. Differences that plot on or to the right of the vertical zero line imply that a sample is contemporaneous with or more recent than the CB calibrated date.

Four single cereal grains from the pit and within the urn of grave A393 are considerably older than the associated CB date. Only a single cereal date (KIA-53946, grave A130) is close to its associated CB date. Out of four samples of charred grass, only two (KIA-53953-54) are similar to the associated CB dates or possibly even slightly younger, while the remainder are older. Three dates on charred twigs (KIA-53984-85; RICH-25069) are similar to or younger than their associated CB dates, whereas a date on alder branch sapwood (KIA-52414) is 138–521 yr older (95.4% probability) than the CB. Single entity, short-lived samples from secure, in situ deposits are in general preferred for 14C dating, but as illustrated here the taphonomic processes might be more complicated than otherwise indicated by the archaeological interpretation, and samples with negligible IA do not necessarily offer the best estimate of the date of the cremation event.
Experimental Dataset
We report 20 new AMS dates from four separate experimental pyres (Table 4). CI values are generally acceptable (>5), except for pyre no. 16, with three out of four samples having CI values <5, indicating they are not fully calcined. Experiments using archaeological wood proved challenging, as it was difficult to ignite. Pyre no. 9 burned with unusual low, bluish flames omitting an unpleasant sulfurous odor. Even though pyre no. 16 was conducted in the same way as the others, it failed to fully cremate the bone and results from this pyre are not included in the discussion. We suspect the old wood was altered by diagenetic contamination from the burial environment, influencing the pyrotechnical process and complicating the interpretation of 14C measurements. Nevertheless, CB δ13C (mean = –24.3 ± 2.1 δ13C) and %C (mean = 0.15 ± 0.09 %C) from pyre no. 16 fall within expected ranges and correspond to results observed in archaeological CB (e.g. Olsen et al. Reference Olsen, Heinemeier, Bennike, Krause, Margrethe Hornstrup and Thrane2008). Again, values of δ13C (measured by AMS) and %C are not directly comparable between laboratories (Rose et al. Reference Rose, Meadows, Palstra, Hamann, Boudin and Hüls2019).
Radiocarbon results on the experimental data set.

1 Measured by AMS. Values are not the true 13C values of the investigated materials, as they are affected by isotope fractionation during acid extraction, graphitization and AMS measurement.
CB 14C ages from individual pyres are statistically inconsistentFootnote 1 (Figure 2) (Ward and Wilson Reference Ward and Wilson1978). Pyre no. 11 includes both sheep and cattle bone, however, and the combined results on sheep bones are consistent (weighted mean = –442 ± 14 BP), whereas results on cattle bones remain inconsistent, albeit approaching acceptable test valuesFootnote 2. The maximum difference between 14C ages from individual pyres are highly significant, ranging from 120 ± 28 yr (> 4 σ) to 169 ± 39 yr (> 4 σ). This is an example of how the shape of the 14C calibration curve has an impact on the magnitude of offsets measured in 14C ages. The post-bomb curve is especially steep, thus a small difference in calendar-age offsets between samples will have a large effect on the 14C determinations. The maximum differences between results among sheep or cattle bone samples from pyre no. 11 are smaller but are still significantly different (> 2 σ). These samples come from the same animals, but it is not possible to reconcile the 14C dates from individual experiments without accounting for wood-age offsets in the CB.
Calibrated 14C results on the experimental data set. Results from pyre no. 9 are calibrated using the IntCal13 Northern Hemisphere atmospheric 14C data set (Reimer et al. Reference Reimer, Bard, Bayliss, Beck, Blackwell, Ramsey, Buck, Cheng, Edwards, Friedrich, Grootes, Guilderson, Haflidason, Hajdas, Hatté, Heaton, Hoffmann, Hogg, Hughen, Kaiser, Kromer, Manning, Niu, Reimer, Richards, Scott, Southon, Staff, Turney and van der Plicht2013). Results from pyres no. 8 and 11 are calibrated using the Bomb13NH1 (AD1650–2010) calibration curve (Hua et al. Reference Hua, Barbetti and Rakowski2013) with additional data points from the Hammer and Levin datasets of atmospheric 14C activity from Jungfraujoch in the Swiss Alps (Levin et al. Reference Levin, Kromer and Hammer2013; Hammer and Levin Reference Hammer and Levin2017).

Samples from pyres no. 8 and no. 11, using recent wood, have F14C values >1, indicating the presence of bomb 14C (Figure 3a–c), and thus negative 14C ages, whereas samples from pyre no. 9, using medieval wood, have F14C values <1 and positive 14C ages, as a result of mixing carbon reservoirs with different 14C activities (Figure 3d). 14C ages are calibrated in OxCal v4.3 using multiple calibration curves (Bronk Ramsey Reference Bronk Ramsey2009a). Negative 14C ages are calibrated using the Bomb13NH1 (AD 1650–2010) calibration curve with a 0.5-yr resolution (Hua et al. Reference Hua, Barbetti and Rakowski2013), with additional data points from the Hammer and Levin datasets (Online Supplementary Information 4) (Levin et al. Reference Levin, Kromer and Hammer2013; Hammer and Levin Reference Hammer and Levin2017). Positive 14C ages are calibrated using the IntCal13 Northern Hemisphere atmospheric 14C calibration curve (Reimer et al. Reference Reimer, Bard, Bayliss, Beck, Blackwell, Ramsey, Buck, Cheng, Edwards, Friedrich, Grootes, Guilderson, Haflidason, Hajdas, Hatté, Heaton, Hoffmann, Hogg, Hughen, Kaiser, Kromer, Manning, Niu, Reimer, Richards, Scott, Southon, Staff, Turney and van der Plicht2013).
Experimental F14C results with 1σ uncertainties: (a) pyre no. 8 sheep, (b) pyre no. 11 sheep, (c) pyre no. 11 cattle and (d) pyre no. 9 cattle. Endmember values of animal and wood indicated directly in the figures.

Carbon exchange results range from 29.3 ± 0.5% to 83.5 ± 0.4% and have an overall mean of 58.6 ± 14.8%. Samples cremated using recent wood have a mean exchange of 52.2 ± 10.9%, ranging from 29.3 ± 0.5% to 67.5 ± 0.5%, whereas experimental pyre no. 9 has a mean exchange of 77.5 ± 5.0%, with a narrower range from 72.3 ± 0.4% to 83.5 ± 0.4%. There appears to be no correlation between % carbon exchange and CI values (Figure 4a), but there is a clear relationship between % carbon exchange and duration of the cremations (hr) (Figure 4b). Pyre no. 9 was burning for ca. 30 min longer than the others and produced higher carbon exchange percentages, but it is difficult to ascertain whether this apparent difference in range is caused by the longer cremation duration itself or by possible differences in temperatures (not measured) and type of fuel wood. The bone apatite, bone collagen and wood from pyres no. 8 and no. 11 have similar ages, and we cannot rule out collagen might have contributed to the carbon composition of the pyre atmosphere. This could possibly explain the smaller % carbon exchange, as compared to pyre no. 9. Values of % carbon exchange and δ13C appear to be related, but do not suggest a clear linear mixing model between unburned apatite and wood (Figure 4c).
Results of % carbon exchange plotted against different measurement parameters of the experimental data set: (a) % carbon exchange plotted against CI, (b) % carbon exchange plotted against cremation duration (hr) and (c) % carbon exchange plotted against δ13C values.

DISCUSSION
We have presented results from 10 archaeological graves with a combination of 14C dated CB and associated material. Charcoal samples from oak trunk wood can have considerable IA, and even trunk wood samples of shorter-lived alder and maple have an average 14C signal predating the cremation event and can, with a high % carbon exchange, cause a significant wood-age offset in the CB. Two charcoal samples of alder trunk wood from grave A99 have calibrated dates agreeing with the CB date, whereas a charred twig dates younger. A charcoal sample of oak trunk wood from the same grave predating the other samples by approximately a millennium is probably residual and unrelated to the grave. In this scenario the twig with negligible IA will best reflect the date of the cremation event. In the following, we will focus on graves containing short-lived samples (i.e. with negligible IA). Furthermore, because wood-age offsets can only make the CB older (unless old bone is cremated with young wood, which is an unlikely archaeological scenario), we ignore short-lived samples dating older than the CB, and only discuss samples whose dates are similar to or later than the date of the associated CB (i.e. differences plot on or to the right of the zero line in Figure 1). We regard the calibrated dates of these short-lived samples as dating the cremation event, and thus indicating possible wood-age offsets in the CB samples.
Graves A95, A99, A130 and A278 contain material meeting these criteria. Graves A95 and A278 each provided two such short-lived samples with statistically consistent 14C ages, whose weighted means (A95: 2399 ± 19 BP, df = 1, T’ = 2.8 (5% = 3.8); A278: 2423 ± 18 BP, df = 1, T’ = 1.6 (5% = 3.8)) provide better estimates of the dates of the respective cremations. The calibrated date differences between CB and short-lived samples are assumed to be exponentially distributed and modeled in a bounded phase starting at zero and ending with a Tau_Boundary (Bronk Ramsey Reference Bronk Ramsey2009a). Results are summarized in a KDE_Plot in Figure 5 (Bronk Ramsey Reference Bronk Ramsey2017). The posterior distribution estimate differences to have a median of 62 yr and a 1-σ range of 173 yr (Online Supplementary Information 1, Part 2). The median offset is larger than we have just modeled for combined legacy dates from Bronze Age Denmark and medieval Japan (median = 22 yr, 1-σ range = 32 yr), although they do overlap within 1-σ ranges (Olsen et al. Reference Olsen, Heinemeier, Bennike, Krause, Margrethe Hornstrup and Thrane2008; Olsen et al. Reference Olsen, Heinemeier, Hornstrup, Bennike and Thrane2013; Minami et al. Reference Minami, Mukumoto, Wakaki and Nakamura2019). The median of the archaeological differences falls within the 50–100 yr offset that has been suggested in the literature, although this now looks to underestimate the total range (Hüls et al. Reference Hüls, Erlenkeuser, Nadeau, Grootes and Andersen2010; Van Strydonck et al. Reference Van Strydonck, Boudin and Mulder2010; Zazzo and Saliège Reference Zazzo and Saliège2011; Snoeck et al. Reference Snoeck, Brock and Schulting2014).
Constrained differences between selected short-lived samples and CB (see text) summarized in a KDE_Plot. Differences calculated using weighted means of short-lived samples from grave A95 (2399 ± 19 14C yr, df = 1, T’ = 2.8 (5% = 3.8) and grave A278 (2423 ± 18 14C yr, df = 1, T’ = 1.6 (5% = 3.8)). Median offset of 62 yr and a 1-σ range of 173 yr. Black bar indicates the 1σ range and crosses the median values of individual differences.

Experimental cremation studies have documented a high degree of carbon substitution both in laboratory and open-air experimental setups (Hüls et al. Reference Hüls, Erlenkeuser, Nadeau, Grootes and Andersen2010; Van Strydonck et al. Reference Van Strydonck, Boudin and Mulder2010; Zazzo et al. Reference Zazzo, Saliège, Lebon, Lepetz and Moreau2012; Snoeck et al. Reference Snoeck, Brock and Schulting2014). Our open-air experimental results show similarly wide substitution ranges in samples from the same individual (animal cut) when the pyre is fueled by recent wood (pyre no. 8 and no. 11: from 29.3 ± 0.5% to 67.5 ± 0.5% with mean exchange 52.2 ± 10.9%), whereas using old wood (pyre no. 9: from 72.3 ± 0.4% to 83.5 ± 0.4% with mean exchange 77.5 ± 5.0%) produce slightly more consistent results. The variability in CB F14C within each pyre is exaggerated due to large differences in 14C content of the old wood and modern bone amplifying the effect of % carbon exchange differences between bone fragments, and perhaps due to the 14C inhomogeneity of the recent wood affected by the 14C bomb spike. We would therefore expect less variation in CB 14C ages from real prehistoric cremations. Figure 3b indicates a possible correlation of % carbon exchange and cremation duration, which requires further investigation. However, a density plot of % carbon exchange (Figure 6) closely resembles a normal distribution, suggesting that the expected wood-age offsets in CB within individual pyres will be normally distributed.
Density plot of % carbon exchange from the experimental data set (gray bars). The added curve depicts 1000 random numbers drawn from a normal distribution with mean and standard deviation derived from the experimental data set.

The only source of carbon in bio-apatite is carbonate ions formed through energy production in cells, which can substitute with hydroxyl (OH, A-type carbonates) or phosphate (PO4, B-type carbonates) in the bone-matrix (Lee-Thorp Reference Lee-Thorp2008; Hüls et al. Reference Hüls, Erlenkeuser, Nadeau, Grootes and Andersen2010). This results in an IA of the bio-apatite equal to the turn-over rate of the bone-matrix, probably comparable to turn-over rates in bone-collagen (Hedges et al. Reference Hedges, Clement, Thomas and O’Connell2007). This leads us to expect IA of the carbon in the original bio-apatite to be unevenly distributed throughout a human skeleton, but given the short lifespan of the animals used in our experiments, their 14C contents must be fairly homogenous. Thus, the large dispersion of % carbon exchange results in CB from a single pyre must here reflect a differential uptake of exogenous carbon, but also variations in temperature and CO2 concentration within a small pyre might play a role. Our % carbon exchange results underline a certain degree of dispersion is to be expected when 14C dating CB, which again points to the need of handling these offsets statistically.
Outlier Modeling
We consider the calibrated offsets between CB and selected short-lived samples from the archaeological data set, and find the distribution in Figure 5 to visually resemble the exponentially distribution otherwise expected for charcoal dates, i.e. most samples dating close to the event in question, but a diminishing number of samples dating increasingly older (Nicholls and Jones Reference Nicholls and Jones2001; Dee and Bronk Ramsey Reference Dee and Bronk Ramsey2014). OxCal’s default Charcoal OM may therefore be a reasonable model for dealing with wood-age offsets in CB, as proposed by Garrow et al. (Reference Garrow, Meadows, Evans and Tabor2014) and Fitzpatrick et al. (Reference Fitzpatrick, Hamilton and Haselgrove2017). All modeling is conducted in OxCal v4.3 (Bronk Ramsey Reference Bronk Ramsey2009a, Reference Bronk Ramsey2009b).
To test this idea, we model the archaeological results from Aarre urnfield cemetery as a bounded phase of activity. Individual graves are modeled as phases including dates on CB and selected short-lived samples, except graves A95, A99, A130 and A278 where CB dates are combined with dates on contemporaneous, short-lived samples. Dates of charcoal samples with potentially significant IA are modeled as terminus post quem (TPQ) dates. In Model 1 (Online Supplementary Information 1, Part 3, Model 1), we apply the Charcoal OM to all CB dates, with a prior probability of 1 (i.e. all CB dates are assumed to be affected by wood-age offsets). The Charcoal OM posterior estimates the CB dates to date 2–91 yr or 0–252 yr older than their cremation events (68.2% and 95.4% probabilities), with a median of 55 yr. The offsets agree within the 68.2% probability range with the offsets otherwise indicated by the calibrated differences between selected short-lived material and CB (median 62 yr and 1-σ range 173 yr), although the Charcoal OM might underestimate the offsets slightly.
Based on our experimental results, the CB dates should always fall between the short-lived sample dates and the average age of charcoal, although individual fragments of charcoal can be younger than the CB. The pyre wood will have an IA some years older than the cremation event, as will carbon in the unburned bio-apatite. Both are type-t offsets (on the calendar scale, as opposed to “type-r” offsets in 14C space, such as dietary reservoir effects). In Model 2 (Figure 7a) we apply a minimum offset to all CB dates, by creating a “Cremation OM” (Online Supplementary Information 1, Part 3, Model 2). This uses the same exponential distribution as the default Charcoal OM, but with an exponential constant of 0.9 and running from –10 to –0.1 to ensure the peak of the OM posterior distribution is shifted away from zero. The scale parameter is set to U(1,3), rather than U(0,3), i.e. offsets can vary between 101 and 103 rather than 100–103 yr, reducing the chances of sub-decadal offsets. We apply the Cremation OM to all CB dates, with a prior probability of 1, and otherwise construct Model 2 as Model 1. The Cremation OM estimates the CB dates to date 5–98 yr or 2–252 yr older than their cremation events (68.2% and 95.4% probabilities), with a median of 61 yr (Figure 7b–d). The Cremation OM estimates larger offsets than the Charcoal OM does, and the offset median is very close to the median suggested by our archaeological material.
Chronological Model 2 of all 14C results from Aarre urnfield cemetery (a) with a bespoke cremation outlier model applied to CB dates. In the middle left plot (b) is the posterior distribution of the outlier offsets (5–98 yr with 68% probability). In the middle right plot (c) is the effective prior and in the lower plot (d) the estimated timescale for wood-age offset in CB (posterior distribution in gray and uniform prior shown in outline).

Next we test the suitability of both Charcoal and Cremation OM for estimating wood-age offsets in our experimental data set using recent wood (pyres no. 8 and no. 11). In Model 3 (Online Supplementary Information 1, Part 4, Model 3), we treat the CB dates as representing a bounded phase of activity and apply a Charcoal OM to the CB dates with a probability of 1. The model estimates activity to start AD 2004–2010 and end AD 2008–2012 (95.4% probability, Amodel = 96) and the posterior distribution of the OM estimate the CB dates to date 0–2 yr or 0–5 yr older than their cremation events (68.2% and 95.4% probabilities). Model 3 estimates the cremation events to have occurred before the actual event (AD 2013 and 2015), meaning that the Charcoal OM underestimate the wood-age offsets.
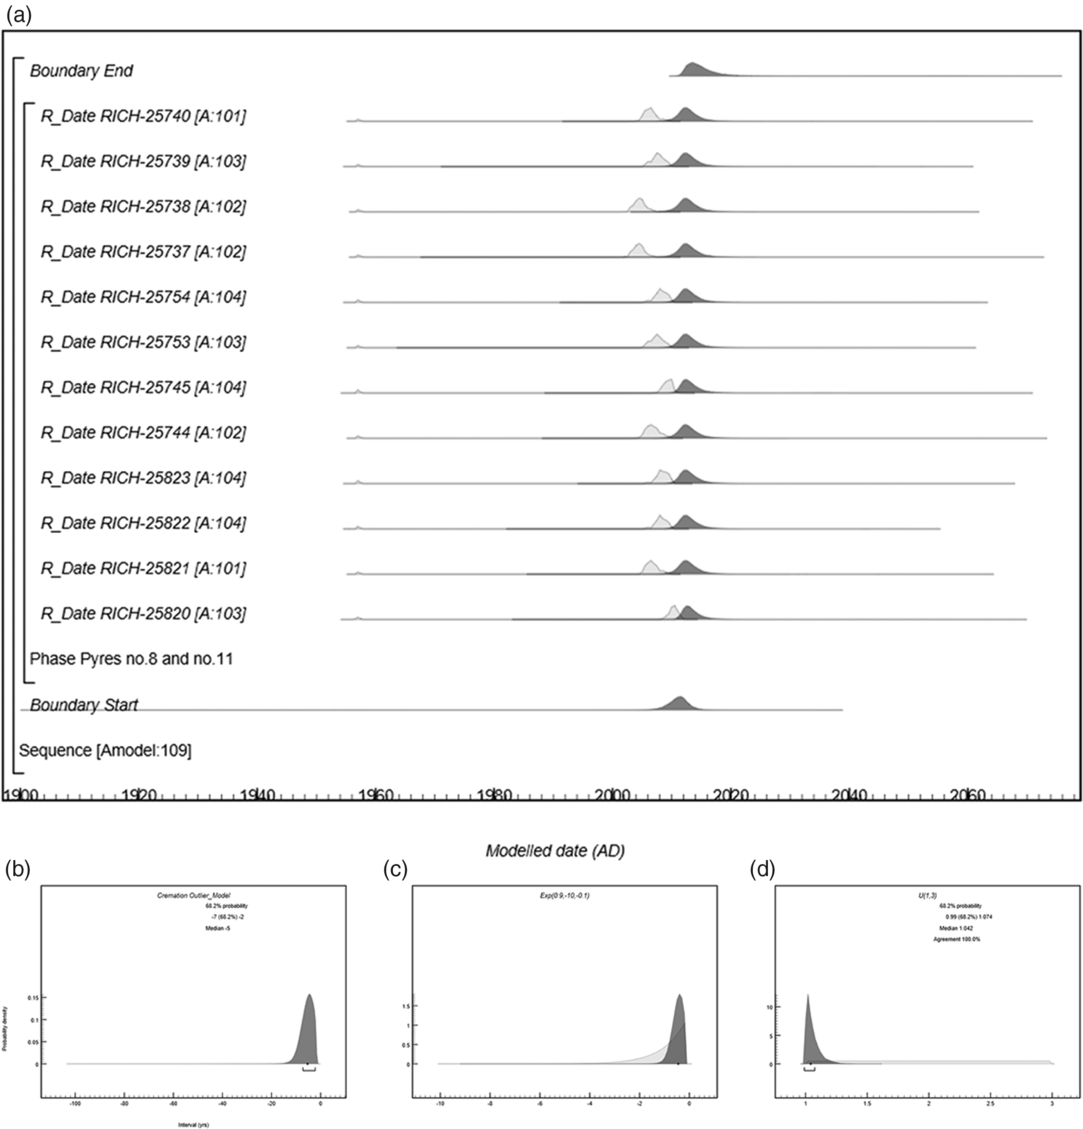
Given the short lifespans of the experimental material it will have a shorter residence time of the unburned bio-apatite, compared to the human CB from the archaeological material. The IA of the pyre wood will however still cause a minimum wood-age offset, why we create Model 4 with the same chronological construction as described above. We apply the bespoke Cremation OM to the CB dates, with a prior probability of 1 (Figure 8a, Online Supplementary Information 1, Part 4, Model 4). The OM takes all adjusted parameters as described for Model 2. Model 4 (Amodel = 109) estimates activity to start AD 2006–2014 and end AD 2011–2021 (95.4% probability). The posterior distribution of the Cremation OM estimates the CB dates to date 2–7 yr or 1–11 yr older than their cremation events (68.2% and 95.4% probabilities, Figure 8b–d). These offsets are larger than calculated by the Charcoal OM and enable Model 4 to estimate start and end boundaries encompassing the true dates of the cremation events.
Chronological Model 4 applying a Cremation OM to experimentally CB (a). In the middle left plot (b) is the posterior distribution of the outlier offsets (2–7 yr with 68.2% probability). In the middle right plot (c) is the effective prior and in the lower plot (d) the estimated timescale for wood-age offset in CB (posterior distribution in gray and uniform prior shown in outline).
It is difficult to assess which OM model is best suited for the archaeological data set, as we do not know the true cremation dates. But we find it to be a convincing argument, that the Cremation OM yields a median offset similar to that suggested by differences between the calibrated dates of short-lived material and associated CB. For the experimental data set, the Charcoal OM underestimates the observed offsets, whereas the Cremation OM enables the chronological model to accurately date the cremation events. Earlier studies (Garrow et al. Reference Garrow, Meadows, Evans and Tabor2014; Fitzpatrick et al. Reference Fitzpatrick, Hamilton and Haselgrove2017) have used outlier modeling to handle wood-age offsets in CB, but with new empirical data on the scale and distribution of these offsets we can suggest a bespoke Cremation OM with a minimum offset to be better suited to our purposes than the default Charcoal OM.
CONCLUSION AND IMPLICATIONS FOR ARCHAEOLOGY
We have demonstrated significant variation in carbon exchange in experimentally CB, with % carbon exchange among samples from single pyres ranging from 29.3 ± 0.5% to 83.5 ± 0.4% (mean 58.6 ± 14.8%). We have confirmed that wood-age offsets in archaeological CB are significant, with a 62 yr median calibrated date offset between short-lived, context associated material and CB (1-σ range of 173 yr). The distribution of wood-age offsets appears to follow an exponential distribution and we test if the default Charcoal OM is applicable for estimating such offsets in archaeological and experimental CB but find that it slightly underestimates apparent offsets. To counter the intrinsic age of both pyre fuel and unburned bio-apatite we instead propose a bespoke Cremation OM, which combines an exponential distribution of calendar age offsets with a minimum offset, and provides better estimates of the actual dates of cremations.
It is important to stress that carbon exchange can vary even within a single cremated bone, and that the shape of the 14C calibration curve can have great impact on the magnitude of these offsets measured in 14C age. Instead of trying to quantify and correct for the offset individually, we urge that they be treated statistically using formal outlier modeling.
ACKNOWLEDGMENTS
Analyses were funded through the Center for Baltic and Scandinavian Archaeology (ZBSA)’s Man and Environment research theme and by the Deutsche Forschungsgemeinschaft (DFG, German Research Foundation – Project number 2901391021 – SFB 1266) subproject G1: Timescales of Change – Chronology of cultural and environmental transformations of the Collaborative Research Center “Scales of Transformation: Human-environmental Interaction in Prehistoric and Archaic Societies”. The authors would like to thank Odense City Museums and ARKVEST – Arkæologi Vestjylland for access to material. We are thankful to Ingeborg Levin and Samuel Hammer from the Institute of Environmental Physics at Heidelberg University for letting us work with their recent measurements of atmospheric 14C activity from Jungfraujoch in the Swiss Alps. Without this it would not have been possible to analyze our post-bomb data.
Supplementary material
To view supplementary material for this article, please visit https://doi.org/10.1017/RDC.2020.3


 Open access