1 INTRODUCTION
Theoretical considerations indicate that planets can survive the evolution of their stars if they avoid engulfment and/or evaporation during the Red Giant Branch and the Asymptotic Giant Branch stages (Mustill & Villaver Reference Mustill and Villaver2012; Villaver et al. Reference Villaver, Livio, Mustill and Siess2014; Ogilvie Reference Ogilvie2014; Veras Reference Veras2016, and references therein). There are observational evidences supporting this prediction (Farihi et al. Reference Farihi2016; Wittenmyer et al. Reference Wittenmyer2016). The observed pollution of 25–50% of all white dwarfs with metals could be explained by planetary systems that survive giant branch evolution of their parent stars (Koester, Gnsicke, B. T., & Farihi Reference Koester, Gnsicke and Farihi2014). The composition of the pollutants is consistent with the accretion of material from rocky objects (Farihi, Gansicke, & Koester Reference Farihi, Gansicke and Koester2013). A smaller fraction (around 4%) of the polluted white dwarfs are also found to have infrared excess suggestive of dusty disks orbiting them (Rocchetto et al. Reference Rocchetto, Farihi, Gnsicke and Bergfors2015).
Comets, moons, asteroids, and small planets may impact the white dwarf directly (Stone et al. Reference Stone, Metzger and Loeb2015; Payne et al. Reference Payne, Veras, Holman and Gansicke2016; Debes, Walsh, & Stark Reference Debes, Walsh and Stark2012) or alternatively, upon entering the Roche (or disruption) radius, to break up (tidally disrupted; Veras et al. Reference Veras, Leinhardt, Bonsor and Gansicke2014, Reference Veras, Leinhardt, Eggl and Gansicke2015, Reference Veras, Carter, Leinhardt and Gansicke2017), forming a disc that accretes onto the white dwarf (Bochkarev & Rafikov Reference Bochkarev and Rafikov2011). However, the process of disrupting planetary material has not yet been observed.
2 WD 1145+017
A significant step in our understanding of the fate of planetary systems was made by the discovery of periodic transits of the white dwarf WD 1145+017 (hereafter, WD 1145) using data from the Kepler K2 mission (Howell et al. Reference Howell2014). Vanderburg et al. (Reference Vanderburg2015) detected six distinct periodicities ranging from 4.5 to 4.85 h (designated as ‘A’ through ‘F’). The light curves exhibited 1–2 h long dips with depths ranging up to 2% of the mean flux.
Due to low time-resolution of the K2 data, Vanderburg et al. (Reference Vanderburg2015) initiated follow-up ground-based photometry. The earlier of these observations (during 2015 April and May) found transits with depths up to 40% and durations of 5–10 min whose periodicity did not phase up to any of the K2 periodicities (Vanderburg et al. Reference Vanderburg2015; Croll et al. Reference Croll2017). The later observations of Gänsicke et al. (Reference Gänsicke2016), Rappaport et al. (Reference Rappaport2016), and Gary et al. (Reference Gary, Rappaport, Kaye, Alonso and Hambschs2017) found a much higher rate of dip activity with a pattern that repeated at 4.5-h intervals. These dips reached depths of 60% and were sometimes so numerous that they overlapped to produce broad, i.e., hour-long, depressions in the flux.
Xu et al. (Reference Xu, Jura, Dufour and Zuckerman2016) discovered numerous circumstellar metal absorption lines with widths corresponding to velocities up to 300 km s−1 providing independent confirmation for the presence of circumstellar material around the target. Observations of Redfield et al. (Reference Redfield2017) showed variability of circumstellar absorption in the gas disk surrounding WD 1145 on timescales of minutes to months.
Croll et al. (Reference Croll2017), Alonso et al. (Reference Alonso, Rappaport, Deeg and Palle2016), and Zhou et al. (Reference Zhou2016) measured no difference in the dip depths of WD 1145 at several wavelengths and derived that the dust particles had to be in the range 0.5–1 μm. However, recent observations of Hallakoun et al. (Reference Hallakoun2017) revealed that the transits are deeper in the redder bands. They interpreted this effect as a result of reduced circumstellar absorption during transits.
The observed occultations of WD 1145 with variable transit depths, asymmetric transit profile, sharp ingress, and gradual egress are similar to observed single-planet transits of KIC 12557548 (Rappaport et al. Reference Rappaport2012; Croll et al. Reference Croll2014), KOI-2700b (Rappaport et al. Reference Rappaport, Barclay, DeVore, Rowe, Sanchis-Ojeda and Still2014), and EPIC 201637175b (Sanchis-Ojeda et al. Reference Sanchis-Ojeda2015), which are MS stars.
Vanderburg et al. (Reference Vanderburg2015) explained the K2 light curve of WD 1145 by occultations of the central star by dust clouds. They proposed that each of the periodicities is related to individual planetesimals (or multiple fragments of one minor planet) orbiting the white dwarf near the tidal radius. They launch winds of metal gases that condense into dust clouds that periodically block the light of the white dwarf. The observed infrared excess of WD 1145 is consistent with a warm (1 150 K) dusty debris disk.
There are unexplained discrepancies between the K2 data and ground-based data: significantly longer inferred duration of transits in K2 data compared to ground-based data, slightly different periods, phase shifts between the ground-based transits and the K2 transits.
The planetary debris at WD 1145 appears to be undergoing a rapid evolution (Gänsicke et al. Reference Gänsicke2016; Hallakoun et al. Reference Hallakoun2017), and continued observations are required to determine how many disintegrating bodies are orbiting the white dwarf, and whether their nearly co-orbital configuration remains stable over longer periods of time. It is attractive to check the prediction of Gurri, Veras, & Gansicke (Reference Gurri, Veras and Gansicke2017) that WD 1145 might become dramatically unstable within 2 yr (under certain condition for masses and eccentricity).
3 ROZHEN OBSERVATIONS
Our photometric observations were performed in the early 2017 (Table 1) with the 2-m Ritchey-Chretien-Coude (RCC) telescope of the Rozhen National Astronomical Observatory, equipped by a CCD camera VersArray 1300B (chip 1 340 × 1 300 pixels, pixel size 20 × 20 μm). The mode RC corresponds to FoV 5.6 × 5.3 arcmin and resolution of 0.258 arcsec per pixel, while the mode with focal reducer FoReRo2 allows to extend FoV to 15 arcmin in diameter with a resolution of 0.74 arcsec per pixel.
Log of the Rozhen photometric observations.

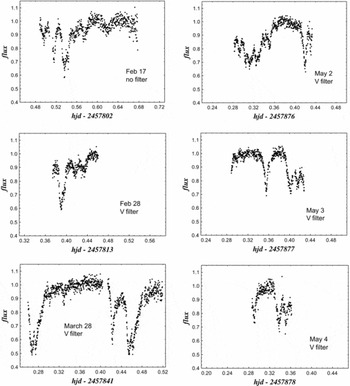
All frames were bias frame subtracted and flat field corrected. The photometric data were reduced by IDL package (standard subroutine DAOPHOT) using five comparison stars. Our light curves are shown in Figure 1.
Rozhen photometry of WD 1145 from 6 nights shown in the same scales.

4 ANALYSIS OF THE ROZHEN DATA
During our run, we observed asymmetric transits whose ingress is shorter than egress. Their features were with durations of 10–50 min and depths up to 50% in flux. Figure 1 exhibits the fast changes of the target light curve in the framework of 2.5 months.
4.1. Time-series analysis
To search for common periodicity of the Rozhen photometric data, we carried out periodogram analysis by the software PerSea. It led to the ephemeris
 $$\begin{equation}
HJD = 2457802.319463 + E \times 0.187266(91) .
\end{equation}$$
$$\begin{equation}
HJD = 2457802.319463 + E \times 0.187266(91) .
\end{equation}$$
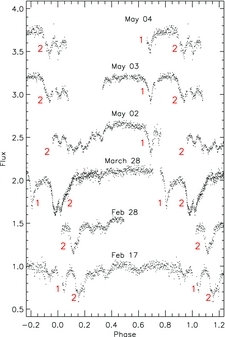
The folded curves corresponding to ephemeris (1) are shown in Figure 2.
The folded light curves of WD 1145 corresponding to ephemeris (1) are shifted vertically for a good visibility. The numbers 1 and 2 marked the repeating features during the different nights.

Our period P = 0.187266 d falls in the range of periods 0.187129–0.187297 d determined by high-speed photometry (5 s) of Gänsicke et al. (Reference Gänsicke2016). It is smaller than the K2 A-period of 0.187453 d and that of Rappaport et al. (Reference Rappaport2016) of 0.187517 d by around 16.2 s. That means ~0.1% decrease of the period for 1–2 yr. We assumed that this effect is real because the phasing of the observations from March 28 with repeating deep feature (Figure 1) by ephemeris (1) led to an excellent folded curve (Figure 2).
The folded curves allowed to track two repeating features during the different nights. The feature signed by number 1 is the only dip that almost does not change its shape during the season. Its depth is biggest in March 28. It is well-visible a decreasing of its phase from 1.04 to 0.68, i.e., by 0.36 for 76 d. This corresponds to decreasing of the orbital period of the formation causing this transit by 0.089% or 1.184 min per day. The dip signed by number 2 was tracked more difficult due to the considerable changes of its shape and gradually increasing width (Figure 2). On February 17, it had a single shape, on February 28 began to split, and on March 28 had double profile and biggest depth. A month later, its ingredients mutually have moved away and form a wide depression with many dips. This may mean that it fragments in several smaller parts within a month. The phase of feature 2 also decreases with time but almost two times slower than that of feature 1.
Earlier, Rappaport et al. (Reference Rappaport2016) also found that the dips of WD 1145 drift systematically in phase with respect to the A period by about 2.5 min per day.
The phase decreasing of the transits could be explained by period decreasing of the orbiting formations probably due their slow spiralling to the white dwarf.
4.2. Dip activity in the early 2017
Rappaport et al. (Reference Rappaport2016) proposed to fit the transits (dips) of WD 1145 by asymmetric hyperbolic secant (AHS) functions whose four parameters are: time of minimum t m, depth D, and the characteristic ingress and egress times, τin and τeg. Gary et al. (Reference Gary, Rappaport, Kaye, Alonso and Hambschs2017) introduced parameter characterizing the dip activity level. This quantity EW is defined similarly to the equivalent width of spectral lines:
 $$\begin{equation}
EW = kD/2
\end{equation}$$
$$\begin{equation}
EW = kD/2
\end{equation}$$
where k = (τin + τeg)/P orb and D is the depth (in flux units) of the feature. According to Gary et al. (Reference Gary, Rappaport, Kaye, Alonso and Hambschs2017), if the dust cloud transiting in front of the WD was optically thin and the circumferences of the dust particles are greater than one wavelength, then EW would be proportional to the projected area of all dust particles.
Table 2 contains parameters of the individual dips measured from our light curves. We assume that besides the parameter EW of individual dip another good measure for the disintegrating activity would be the sum EW tot of EW of all dips per cycle. Unfortunately, the most observations (our and previous) do not cover full cycle and the determination of EW tot is impossible.
Dip parameters of the Rozhen light curves.

4.3. Approximate quantitative analysis
We estimated approximate parameters of the structures S1 and S2 causing the two deep transit features (Figure 2) during our season based on several considerations.
-
(1) For 0.6 M⊙ white dwarf (Rappaport et al. Reference Rappaport2016), the period of 4.5 h corresponds to orbital axis a = 150 R⊕. For this orbit, the observed deep transits of the white dwarf with radius 1.34 R⊕ (Rappaport et al. Reference Rappaport2016) means inclination ⩾89°, i.e., the line-of-sight lies almost in the orbital plane.
-
(2) The observed transits have not flat section that means that the transiting structures do not cover the whole white dwarf surface, i.e., their size z 1, 2 perpendicular to the edge-on orbit (vertical coordinate) does not exceed white dwarf radius 1.34 R⊕. On the other hand, the transit durations of ~0.1 in phase units is a measure for the relative size L 1, 2/(2πa) of the transiting (approximate arc-like or sector-like) structures along the orbit. Then, their absolute size L 1, 2 along the orbit is of order of 100 R⊕. The elongated shapes of S1 and S2 imply that they are parts of geometrically thin (thickness below 1.34 R⊕), inhomogeneous disk (ring) around the white dwarf. The narrower and shallower dips may due to structures similar to S1 and S2 of the same disk but with smaller length.
-
(3) The (mean) phase distance of 0.2 between the main transits means that S2, S1, and WD form an approximately equilateral triangle. This remembers the triangle Lagrangian solution of the 3-body problem and its realization by the system Sun–Jupiter–Trojan asteroids.
-
(4) The mean density of WD 1145 is 4.55 × 10⁵ g cm−3. If we adopt upper limit of the mean density of the transiting structures 1 g cm−3, then the Roche radius would be R c = 250 R⊕ (it would be bigger for lower density). This means that the observed inhomogeneous disk (ring) at distance 150 R⊕ is well within the critical radius R c. This explains the fast fragmentation of the circumstellar material.
Our results about the structures causing transits are in consistence with the conclusion of Hallakoun et al. (Reference Hallakoun2017) that the gas, the transiting debris, and the dust emitting the infrared excess are part of the same general disc structure (although possibly at different radii).
The shapes of transiting features may be explained by three ways.
-
(a) The structures S1 and S2 are homogeneous and their sizes z 1, 2 (above, or below, or on the two sides of the central orbital plane) are described by AHS functions on the coordinate along the orbit.
-
(b) The thicknesses of S1 and S2 are the same (z 1, 2 are constants) but their densities are AHS functions on the coordinate along the orbit.
-
(c) Combination of these mechanisms.
This analysis put the issue about the physical meaning of AHS function of the vertical size and/or density distribution of the transiting structures of WD 1145. Future photometry with high time resolution might exhibit the substructure of the large transiting formations and of the disk as a whole.
5 CHRONOLOGY OF THE DIP ACTIVITY OF WD 1145
It is assumed that as circumstellar disks evolve their dust masses decrease rapidly, and by ages of 10–20 Myr, the overwhelming majority of disks have dissipated their primordial dust (Bell, Mamajek, & Naylor Reference Bell, Mamajek and Naylor2015). At ~10 Myr ages, the remaining circumstellar disks are classified as gas-poor ‘debris’ disks, in which the small amount of optically thin dust is generated by collisional evolution of Pluto-like bodies in analogs of the Solar Systems Kuiper belt (Wyatt Reference Wyatt2008).
Table 3 presents explicitly 3-yr chronology of the observed dip activity of WD 1145: ranges of depths and widths of the observed dips and their number per cycle. It is difficult to derive some trends from these results because the observations were carried out by different time resolution, photometric precision and often do not cover whole cycles.
Chronology of dip activity.

6 CONCLUSIONS
Our photometric observations of WD 1145 during six nights in the early 2017 revealed asymmetric transits with durations of 10–50 min and depths up to 50% in flux. Two deep features were tracked over 2.5-month season. We found that they drift in phase. This effect may be explained by period decreasing of the transiting formations due to their slow spiralling to the white dwarf. One of them seems to fragment in several smaller parts within a month.
We estimated that the transiting structures have elongated (probably arc-like) shape whose sizes perpendicular and along the orbit are of the order of 1 R⊕ and 100 R⊕. They are parts of geometrically thin inhomogeneous disk (ring) around the white dwarf that is well within its Roche radius.
The uniqueness of WD 1145 is due to simultaneous fulfilling of the three requirements: ‘polluted atmosphere’; orbital inclination >89°; high level of dip activity. Probably similar targets are quite rare. That is why WD 1145 is valuable object allowing us to be witnesses of the disintegrating of its circumstellar system. The transits of WD 1145 provide first observational evidence of rocky, disintegrating bodies around a white dwarf and support the planetesimal accretion model of polluted white dwarfs.
Our study provides additional data for the chronology of the events of disintegrating of WD 1145. Observations of the fates of planetary systems would help to constrain their formation and subsequent evolution.
ACKNOWLEDGEMENTS
This work was supported partly by projects DN08-20/2016 and DN08-1/2016 of the National Science Foundation of Bulgarian Ministry of education and science as well as by projects RD 08-102 and RD 08-80 of Shumen University. It used the SIMBAD database and NASA Astrophysics Data System Abstract Service. The authors are very grateful to anonymous referee for the valuable recommendations.