


Introduction
Studies on the mechanical properties of sea ice have demonstrated that laboratory tests of ice samples are commonly far superior to field tests. The reason for this is simple; in the laboratory more time and better equipment are invariably available. In addition, many laboratories now have stiff, high-capacity, closed-loop testing machines which provide true constant strain-rate tests and give reliable modulus and strength data. Transporting such machines into the field is neither simple nor common.
Ideally, one would like to perform large-scale, in-situ tests to determine the mechanical properties of sea ice. However, such tests are very expensive, time-consuming, and consequently rare. Therefore, much of the data base on the mechanical properties of sea ice has been and will continue to be derived from small samples extracted from the sea-ice sheet.
Unfortunately, removal of an ice sample from a sea-ice sheet invariably changes its characteristics. For example, some brine loss is usually observed when ice cores are removed and exposed to the colder air temperatures typically encountered during most sampling periods. The properties of an ice sample are also presumably affected by shipping and storage. While we believe that these changes are small, they have not, as yet, been studied either experimentally or theoretically.
In this paper, the changes in the salinity and porosity of sea-ice samples that are obtained in the field and then shipped, stored, and tested in the laboratory are examined theoretically. In the analysis it will be assumed that the ice samples initially contain no air and that all brine loss is due to brine expulsion. Estimates of the amount of brine loss and of the changes in both brine volume and air volume are then given for different sample-temperature histories.
Cooling
When an ice sample is removed from a sea-ice sheet and exposed to colder ambient temperatures, salt-rich brine is lost from the sample as a result of brine expulsion. The brine expulsion process can be conceptualized as follows. During cooling, water is removed from the brine via the formation of pure ice on the interior of the brine cavities. This concentrates the brine, allowing phase equilibrium between the ice and the brine to be maintained. Since the ice that forms on the cavity walls occupies about a 10% greater volume than the original water in the brine, some brine is expelled from the cavities and eventually out of the sample.
Some brine may also be lost by gravity drainage provided that the brine volume is sufficiently large. However, at typical cold field and storage temperatures, the permeability at the exterior of the core is rapidly reduced and gravity drainage is presumed to be minimal. In that experimental observations indicate that gravity drainage ceases if brine volumes are ≤50‰ (Reference Cox and WeeksCox and Weeks, 1975) and field observations suggest that ice salinities are rarely in excess of 20‰, gravity drainage is effectively excluded in ice colder than –23°C. When it is necessary to obtain ice samples during ambient temperatures higher than –23°C, precautions are commonly taken to minimize brine drainage (usually samples are immediately packed in dry ice, resulting in ice temperatures in the range of –50° to –60°C).
In Reference Cox and Weeks1975, Cox and Weeks developed a finite-difference model to predict brine expulsion in a growing saline sea-ice sheet. However, as it is inconvenient to use a model in this form, an analytical expression for brine expulsion will be formulated which is an extension of the work presented by Reference CoxCox (1983) and Reference Cox and WeeksCox and Weeks (1983) on the changes with temperature of the brine and air volumes in sea-ice samples.
In the following derivations we will neglect the presence of solid salts. According to the calculations pre-sented in Reference Cox and WeeksCox and Weeks (1983), this is a reasonable simplification. We also assume that the density of pure ice is constant and, as mentioned, that the initial air volume of the ice sample is zero, because the distribution of air in first-year sea-ice samples is not well understood. In the equations,  are the mass, density, and volume of component
  and the subscripts a, b, s, and і denote the component air, brine, salt, and pure ice, respectively. M is the bulk mass, V is the bulk volume, ρ is the bulk density, and T is the ice temperature. We will now derive equations for the change in brine volume, mass of salt, and salinity with temperature as the ice gets colder.
Brine volume
From Con (1983), the change in brine volume with temperature during cooling can be expressed as

where βi is the coefficient of thermal expansion of pure ice. Since we assume that ρi is constant, βi = 0, and Equation (1) may be written as

From Reference ZubovZubov (1945), we have

where c is a constant (0.0008 Mg/m3/‰). Separating variables, and integrating from T l to T 2 (T 2 < T l), we obtain

or

Mass of sail
By definition, the mass of salt in the ice, m S , is equal to

Differentiating with respect to temperature

and substituting Equation (2) into Equation (7) and collecting terms

Again, by separating variables and integrating from T t to T 2 (T2 < T 1), we get a closed-form solution for the change in mass of the salt:

Salinity
By definition, the salinity of sea ice, S i, can be expressed as:

Differentiating with respect to temperature and collecting terms

Because the mass of expelled brine is considerably smaller than the total mass, the last term in Equation (11) is neglected and during warming is equal to zero (Reference CoxCox, 1983). Dropping this term, separating variables, and again integrat-ing from T 1 to T 2 we obtain

an equation that is valid for both cooling and warming. Substitution of Equation (5) into Equation (12) then gives for cooling

Comparison of Equation (9) and Equation (13) shows that

which is not too surprising.
From Equation (5) and Equation (13) we can readily calculate the change in brine volume and salinity of an ice sample during cooling, as well as the amount of salt lost due to brine expulsion.
Warming
If a sea-ice sample is warmed, there will be no brine expulsion; however, due to volumetric changes associated with the phase changes, the air volume in the ice will in-crease (Reference CoxCox, 1983). Should the ice brine volume increase to greater than 50‰, some brine and salt will also be lost by gravity drainage (Reference Cox and WeeksCox and Weeks, 1975). Since we do not as yet have a good theoretical gravity drainage model, gravity drainage will not be considered. Equations for the change in brine volume and air volume with warming will next be derived.
Brine volume
From Reference CoxCox (1983), the change in brine volume with temperature during warming can be expressed as

Following the same procedure as in the previous section, we obtain

It is interesting to note that, if Equation (16) is substituted into Equation (12), we get

for warming, as expected.
Air volume
Also, from Reference CoxCox (1983), the change in air volume with temperature during warming is given as

where the density of pure ice, ρ i, is assumed to be constant. Noting that

Equation (18) can be expressed as

By separating variables, and substituting for ρ b and S b where appropriate, using Equation (3), we obtain

which when integrated from Tl and T2 gives

Collecting terms,

However, because Equation (19) applies,

which is in agreement with the difference in air volume calculated by equations given in Reference Cox and WeeksCox and Weeks (1983).
Variations of brine salinity with temperature
All of the final equations can be expressed in terms of the brine salinity at the initial and final temperatures in that the brine density can be approximated by Equation (3). The salinity of the brine at different temperatures can be calculated from the data presented in Reference AssurAssur’s (1958) sea-ice phase-equilibrium table. These values are plotted in Figure 1. The lines through the data are least-squares curves of the form

where T is the ice temperature (°C) and S b is the brine salinity (‰). Coefficients for the curves in different temperature ranges at temperatures to –54°C are given in Table I.
Brine salinity versus ice temperature. The line represents least-squares curve fits through the data.

Coefficients for Function S b(T) by Method of Least-Squares

Changes in porosity and salinity with temperature
The change in porosity and salinity of an ice sample, resulting from removal from the sea-ice sheet and storage, can now be calculated. In the examples which follow, the initial brine volume of the sample was taken from Reference WeeksWeeks (1962):

where the sea-ice density, ρ, is equal to

The reader is again reminded that it is assumed that the presence of solid salts can be neglected, the density of the pure ice phase is constant, the initial air volume in the ice is zero, and that all changes in salinity and porosity are due to brine expulsion.
First, the change in porosity and salinity due to brine expulsion as a result of storage of the ice samples at –54°C is examined. This corresponds to the situation where samples are removed from a sea-ice sheet and packed in dry ice for shipment from the field to a laboratory for testing. At the laboratory, samples are then warmed to the initial in-situ temperature prior to the test. The initial and final ice salinities and porosities for different initial ice temperatures are presented in Table II,
Changes in Porosity and Salinity due to Brine Expulsion as a Result of Storing Samples at ‒54 °C and then Returning the Samples to their Initial in-situ Temperatures. S, T, V b and n Denote the Sample Salinity, Temperature, Brine Volume, Air Volume, and Total Porosity at the Initial (i) and Final (f) Temperatures
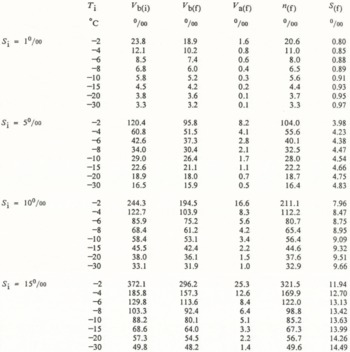
Examination of these figures reveals that, not surprisingly, the largest loss of salinity occurs when the difference between the in-situ temperature and the storage temperature is a maximum. More importantly, when the percentage decrease in the total porosity is calculated by comparing the initial porosity (Vb(i))with the final porosity (n(f)) it is found (Fig. 2) that the porosity decrease due to cycling in per cent is independent of the initial ice salinity (Equation (5), (16), and (24)) and drops off rapidly as the in-situ temperature approaches the storage temperature. For ice with in-situ temperatures near the melting point, porosity decreases of near 15% can be expected from the described cycling. If, on the other hand, in-situ ice temperatures are –5° or –10° C, porosity decreases will be less than 7.0 and 3.4%, respectively. Considering that property variations in sea ice commonly scale n 1/2 with (Reference Weeks and AckleyWeeks and Ackley, 1982), these porosity changes would correspond to property changes of approxim-ately 3.6 and 1.7%, respectively. Although such changes are hardly desirable, they can be tolerated considering the wide scatter in sea-ice property values. It would also be possible to make corrections for such changes.
Porosity decrease of ice samples cycled from different in-situ temperatures to –54 °C and then returned to the initial in-situ temperature.

The fact that the thermal cycling results in a decrease in the sample porosity might, at first glance, appear surprising. The explanation for this fact is that, on warming the sample back to the initial in-situ temperature, the amount of salt remaining in the sample is insufficient to cause the solution of all the pure ice that formed during the prior cooling. In addition, it is only the decrease in volume associated with this solution process that provides the space that is filled with gas. Therefore, the final porosity, which is the sum of the brine and gas volumes, is less than the initial porosity composed only of brine.
Secondly, the change in porosity and salinity is examined, assuming that after removal from the sea-ice sheet the ice is stored at –30° C and subsequently warmed to –10°C for testing. This corresponds to a more common testing scenario. These results are presented in Table III. In this case the final porosity at –10°C after cycling through –30°C should be compared, not with the initial in-situ porosity, but with the porosity n d that would be obtained if the sample was transferred directly from the in-situ temperature to –10° C without the excursion to the storage temperature. As seen in Table III, the differences are small, less than 2%.
Changes in Porosity and Salinity due to Brine Expulsion as a Result of Storage of Samples at –30°C. after Storage, Samples were Returned to a Temperature of –10°C. Symbols are Defined in Table II with the Exception of n d Which is the Porosity of a Sample Taken Directly from the in-situ Temperature to the Test Temperature of -10 °C Without Storage at -30 °

Conclusion
These calculations demonstrate that, if reasonably cold sea-ice samples (<–10° C) are cycled to cold-storage temper-atures and then returned to the in-situ temperatures for testing, the changes between the initial and final porosities are small. If, on the other hand, the in-situ temperatures are near the melting temperature of the ice, large porosity changes (≈15%) can result. These factors should be con-sidered when planning field-sampling programs. For instance, an ideal sampling procedure would be to collect ice from the cold, upper parts of sea-ice sheets during the later winter or early spring. The interpretation of tests made on ice collected during the melt period could indeed become very problematical. Unravelling the myriad of factors affecting sea-ice properties is clearly sufficiently complex without adding these complications. In addition, it should be noted that if near-melting ice temperatures are considered, the real porosity changes may significantly exceed those calculated here as gravity drainage can no longer be neglected. Finally, regardless of the thermal path by which an ice sample arrives at a test temperature, the analysis of the test should be based on density and salinity determinations made at the test temperature at the time of testing.



