


1. Introduction
Metallic-line A-type stars (i.e. Am stars) are CP stars of type A or early F type stars, which show an overabundance of heavy elements (iron-group elements, the rare earth elements) (Conti Reference Conti1970) and an underabundance of calcium and scandium. The spectra will exhibit the following characteristics: weaker Ca II, K line (Titus & Morgan Reference Titus and Morgan1940; Roman, Morgan, & Eggen Reference Roman, Morgan and Eggen1948), but enhanced Sr II line; the scandium and calcium elements are under-abundant while the iron-group elements, Y, Ba, and the rare earth elements are over-abundant (Conti Reference Conti1970). Next to a weak Ca II K line, Am stars also have weak Ca I 4 226 Å lines. There is a noticeable weakening of the absorption lines in the 4 395–4 400 Å region, which contain significant contributions from Sc II. The weak Ca II K lines and pronounced metallic-line spectra in these objects indicate a discrepancy between the spectral types derived from the strength of the Ca II K line (Sp(K)) and the metallic lines (Sp(m)) of at least five spectral subclasses by definition. While stars with a spectral type difference ( $\Delta=Sp(K)-Sp(m)$
) of
$\Delta=Sp(K)-Sp(m)$
) of $1 \leq \Delta \lt 5$
are often referred to as ‘marginal Am’ (or Am:) stars. Almost all Am stars (more than 90%) are the components of binaries (Abt Reference Abt1961, Reference Abt1965; Hubrig et al. Reference Hubrig, González, Schöller, Prša and Zejda2010). It is generally accepted that the largest equatorial rotational velocity of Am stars is about 120
$1 \leq \Delta \lt 5$
are often referred to as ‘marginal Am’ (or Am:) stars. Almost all Am stars (more than 90%) are the components of binaries (Abt Reference Abt1961, Reference Abt1965; Hubrig et al. Reference Hubrig, González, Schöller, Prša and Zejda2010). It is generally accepted that the largest equatorial rotational velocity of Am stars is about 120 $\mathrm{km\, s}^{-1}$
(Abt & Moyd Reference Abt and Moyd1973; Abt Reference Abt2000). There is a lack of very short periods of
$\mathrm{km\, s}^{-1}$
(Abt & Moyd Reference Abt and Moyd1973; Abt Reference Abt2000). There is a lack of very short periods of $P_{orb} \lt 1.2$
days in Am type binaries (Budaj Reference Budaj1996), and the general explanation is that synchronism in such systems would force the primary to rotate faster than 120
$P_{orb} \lt 1.2$
days in Am type binaries (Budaj Reference Budaj1996), and the general explanation is that synchronism in such systems would force the primary to rotate faster than 120 $\mathrm{km\, s}^{-1}$
. Nevertheless, Am peculiarity may have no significant correlation with rotational velocity (Monier & Richard Reference Monier, Richard, Zverko, Ziznovsky, Adelman and Weiss2004; Monier Reference Monier2005). Many Am stars show anomalous luminosity effect, i.e. the luminosity criteria in certain spectral regions will indicate that the target should be a giant or even supergiant star, whereas in other regions the luminosity will indicate it as a dwarf or even lower luminosity star. The common existence of Am stars in binaries is very noticeable around the chemically peculiar stars; almost all Am stars (more than 90%) are the components of binaries (Abt Reference Abt1961, Reference Abt1965; Hubrig et al. Reference Hubrig, González, Schöller, Prša and Zejda2010). An eclipsing binary containing one or two Am stars is called an eclipsing Am binary. Eclipsing Am binaries are extremely useful and important in investigating the properties of Am stars.
$\mathrm{km\, s}^{-1}$
. Nevertheless, Am peculiarity may have no significant correlation with rotational velocity (Monier & Richard Reference Monier, Richard, Zverko, Ziznovsky, Adelman and Weiss2004; Monier Reference Monier2005). Many Am stars show anomalous luminosity effect, i.e. the luminosity criteria in certain spectral regions will indicate that the target should be a giant or even supergiant star, whereas in other regions the luminosity will indicate it as a dwarf or even lower luminosity star. The common existence of Am stars in binaries is very noticeable around the chemically peculiar stars; almost all Am stars (more than 90%) are the components of binaries (Abt Reference Abt1961, Reference Abt1965; Hubrig et al. Reference Hubrig, González, Schöller, Prša and Zejda2010). An eclipsing binary containing one or two Am stars is called an eclipsing Am binary. Eclipsing Am binaries are extremely useful and important in investigating the properties of Am stars.
Information of V404 Aur, GW Gem and the corresponding comparison and check stars.
In our earlier work, about 21 600 Am candidates and 754 eclipsing Am binaries were detected based on the low-resolution spectra of the Large Sky Area Multi–Object Fiber Spectroscopic Telescope (LAMOST) (Tian et al. 2023). Some eclipsing Am binary candidates with a short period of less than 1 day were identified, which present challenges to the slow rotation of stars classified as type Am observed in the previous research. These candidates are significant targets and provide a great opportunity to explore the real relationship between Am–type stars’ peculiarity and slow stellar rotation. We have selected some short-period eclipsing Am stars to observe and study. This study focuses on the short-period eclipsing Am binaries V404 Aur and GW Gem.
V404 Aur (NSV 2733, GSC 02924-01750, TYC 2924-1750-1) is an EB type eclipsing Am binary with a period of 0.7543173 d (Samus’ et al. Reference Samus’, Kazarovets, Durlevich, Kireeva and Pastukhova2017). The spectral type of the primary component is kA2hA4mA6 (Tian et al. 2023). No detailed investigation has been carried out on this target.
GW Gem (BD+27 1494, GSC 01933-00692, TYC 1933-692-1) was confirmed as an Algol-type variable star, the period is 0.659444013 d. The spectral type of primary component is kA4hF0mF0 (Tian et al. 2023). The first BV band light curves were observed by Broglia & Conconi (Reference Broglia and Conconi1981). Lee et al. (Reference Lee, Kim, Lee, Kim, Park, Park and Koch2009) compiled the four bands light curves which show an inverse O’Connell effect, and the period was found a continuous period increase at a rate of $+(4.2\pm0.4)\times10^{-8}\mathrm{\,d\,{yr}}^{-1}$
, corresponding to a fractional period change of
$+(4.2\pm0.4)\times10^{-8}\mathrm{\,d\,{yr}}^{-1}$
, corresponding to a fractional period change of $+(1.2\pm0.1)\times10^{-10}$
. They concluded that GW Gem is a semidetached system with the secondary star filling its inner Roche Lobe (RL). The mass ratio of GW Gem was around 0.40 (0.46 by Lee et al. Reference Lee, Kim, Lee, Kim, Park, Park and Koch2009 and 0.343 by Yang & Wei Reference Yang, Wei, Qain, Leung, Zhu and Kwok2011).
$+(1.2\pm0.1)\times10^{-10}$
. They concluded that GW Gem is a semidetached system with the secondary star filling its inner Roche Lobe (RL). The mass ratio of GW Gem was around 0.40 (0.46 by Lee et al. Reference Lee, Kim, Lee, Kim, Park, Park and Koch2009 and 0.343 by Yang & Wei Reference Yang, Wei, Qain, Leung, Zhu and Kwok2011).
In this study, the multi-colour high-precision light curves, low-resolution spectrum and $O-C$
diagram with long time spanning eclipse timings were obtained for the short-period eclipsing Am binaries V404 Aur and GW Gem. More accurate geometric and physical parameters were obtained in this study. Meanwhile, the physical parameters of the well-known eclipsing Am binaries were collected. The correlations between the parameters were also been analysed and discussed.
$O-C$
diagram with long time spanning eclipse timings were obtained for the short-period eclipsing Am binaries V404 Aur and GW Gem. More accurate geometric and physical parameters were obtained in this study. Meanwhile, the physical parameters of the well-known eclipsing Am binaries were collected. The correlations between the parameters were also been analysed and discussed.
2. Observation and Data Reduction
2.1 Photometric observations
The first almost complete multi-colour light curves of V404Aur in Johnson minus;Cousin $BVR_{c}I_{c}$
filters (Ažusienis & Straižys Reference Ažusienis and Straižys1969; Bessell Reference Bessell1983) were observed on January 1, 2, and 3, 2023, with the Andor DZ936 2K CCD (size:
$BVR_{c}I_{c}$
filters (Ažusienis & Straižys Reference Ažusienis and Straižys1969; Bessell Reference Bessell1983) were observed on January 1, 2, and 3, 2023, with the Andor DZ936 2K CCD (size: $2\,048\times 2\,048$
pixel) photometric system attached to the 85 cm telescope at the Xinglong Station of the National Astronomical Observatories of China (NAOC). New complete Johnson minus;Cousin
$2\,048\times 2\,048$
pixel) photometric system attached to the 85 cm telescope at the Xinglong Station of the National Astronomical Observatories of China (NAOC). New complete Johnson minus;Cousin $VR_{c}I_{c}$
(Ažusienis & Straižys Reference Ažusienis and Straižys1969; Bessell Reference Bessell1983) multi-colour light curves of GW Gem were observed on December 25 and 26, 2022. The a observations were accomplished with the PI VersArray 1300B LN CCD (size:
$VR_{c}I_{c}$
(Ažusienis & Straižys Reference Ažusienis and Straižys1969; Bessell Reference Bessell1983) multi-colour light curves of GW Gem were observed on December 25 and 26, 2022. The a observations were accomplished with the PI VersArray 1300B LN CCD (size: $1\,340\times 1\,300$
pixels) photometric system attached to the 80 cm telescope (Tsinghua-NAOC Telescope) at NAOC. PHOT package of IRAF was used to process all the observation images. The comparison stars and the check stars have been chosen to determine the differential magnitudes. The non-variable star TYC 2924-2022-1 and TYC 2924-1540-1 are chosen as comparison star and the check star for V404 Aur, respectively. Meanwhile, the star TYC 1933-570-1 and 2MASS J07521442+2705257 are chosen as comparison stars, and the star 2MASS J07521241+2703288 is chosen as the check star for GW Gem. Table 1 shows the information of comparison, check stars and both targets. The comparison stars have similar magnitudes to the targets. The observed CCD images of both targets are shown in Figs. 1 and 2, respectively. In the figure, the variable star is marked with ‘V’, the comparison star is marked as ‘C’, and the check star is marked with ‘Ch,’ respectively. Especially, the two comparison stars for GW Gem were marked as ‘C1’ and ‘C2’ in Fig. 2. The light curves of V404 Aur and GW Gem are shown in Figs. 3 and 4, respectively. The magnitude difference between the comparison star and the check star in all filters is shown at the bottom of the figure. In Fig. 3, the mean standard deviations of each filter are about 0.00452 of the B band, 0.00454 of the V band, 0.00559 of the
$1\,340\times 1\,300$
pixels) photometric system attached to the 80 cm telescope (Tsinghua-NAOC Telescope) at NAOC. PHOT package of IRAF was used to process all the observation images. The comparison stars and the check stars have been chosen to determine the differential magnitudes. The non-variable star TYC 2924-2022-1 and TYC 2924-1540-1 are chosen as comparison star and the check star for V404 Aur, respectively. Meanwhile, the star TYC 1933-570-1 and 2MASS J07521442+2705257 are chosen as comparison stars, and the star 2MASS J07521241+2703288 is chosen as the check star for GW Gem. Table 1 shows the information of comparison, check stars and both targets. The comparison stars have similar magnitudes to the targets. The observed CCD images of both targets are shown in Figs. 1 and 2, respectively. In the figure, the variable star is marked with ‘V’, the comparison star is marked as ‘C’, and the check star is marked with ‘Ch,’ respectively. Especially, the two comparison stars for GW Gem were marked as ‘C1’ and ‘C2’ in Fig. 2. The light curves of V404 Aur and GW Gem are shown in Figs. 3 and 4, respectively. The magnitude difference between the comparison star and the check star in all filters is shown at the bottom of the figure. In Fig. 3, the mean standard deviations of each filter are about 0.00452 of the B band, 0.00454 of the V band, 0.00559 of the $R_c$
band and 0.00994 of the
$R_c$
band and 0.00994 of the $I_c$
band. In Fig. 4, the mean standard deviations of each filter are about 0.00454 of the V band, 0.00559 of the
$I_c$
band. In Fig. 4, the mean standard deviations of each filter are about 0.00454 of the V band, 0.00559 of the $R_c$
band, and 0.00994 of the
$R_c$
band, and 0.00994 of the $I_c$
band.
$I_c$
band.
Observed CCD image of V404 Aur. The data observed on different night are marked with different colours, and the B, V, $R_c$
, and
$R_c$
, and $I_c$
band data are represented by the square, circle, triangle, and inverted triangle, respectively. ‘Variable star’, ‘Comparison star’, and ‘Check star’ are marked with ‘V’, ‘C’ and ‘Ch,’ respectively.
$I_c$
band data are represented by the square, circle, triangle, and inverted triangle, respectively. ‘Variable star’, ‘Comparison star’, and ‘Check star’ are marked with ‘V’, ‘C’ and ‘Ch,’ respectively.

Observed CCD image of GW Gem. The data observed on different night are marked with different colours, and the B, V, $R_c$
, and
$R_c$
, and $I_c$
band data are represented by the square, circle, triangle, and inverted triangle, respectively. ‘Variable star’, ‘Comparison star’, and ‘Check star’ are marked with ‘V’, ‘C’ and ‘Ch,’ respectively.
$I_c$
band data are represented by the square, circle, triangle, and inverted triangle, respectively. ‘Variable star’, ‘Comparison star’, and ‘Check star’ are marked with ‘V’, ‘C’ and ‘Ch,’ respectively.

The light curves of V404 Aur on $BVR_cI_c$
bands. The data observed on different night are marked with different colours, and the B, V,
$BVR_cI_c$
bands. The data observed on different night are marked with different colours, and the B, V, $R_c$
, and
$R_c$
, and $I_c$
band data are represented by the square, circle, triangle, and inverted triangle, respectively.
$I_c$
band data are represented by the square, circle, triangle, and inverted triangle, respectively.
The light curves of GW Gem on $VR_cI_c$
bands. The data observed on different night are marked with different colours, and the V,
$VR_cI_c$
bands. The data observed on different night are marked with different colours, and the V, $R_c$
, and
$R_c$
, and $I_c$
band data are represented by the circle, triangle, and inverted triangle, respectively.
$I_c$
band data are represented by the circle, triangle, and inverted triangle, respectively.
2.2 TESS observations
The Transiting Exoplanet Survey Satellite (TESS) is an all-sky transit survey whose principal goal is to detect Earth-sized planets orbiting bright stars amenable to follow-up observations to determine planet masses and atmospheric compositions (Ricker et al. Reference Ricker, Oschmann Jacobus, Clampin, Fazio and MacEwen2014). TESS conducted high-precision photometry of more than 200 000 stars during its primary two-year mission with a cadence of approximately 2 min and 20 s in the extended mission for select targets. These targets are recorded as postage stamps and made available to the community as target pixel files (TPFs) and calibrated light curves. The light curve files contain the flux time series derived from the calibrated 2-min and 20-s target pixels. These files contain several time series, including the simple aperture photometry, a detrended light curve, position vectors, and quality flags. The aperture photometry flux series is known as the SAP_FLUX, while the flux series that has the common instrumental systematics removed using the CBV files is known as the PDCSAP_FLUX. The PDCSAP_FLUX light curves also correct for the amount of flux captured by the photometric aperture and crowding from known nearby stars.
Information of the TESS data of V404 Aur and GW Gem.

The continuous time-series and phase-binned light curves of V404 Aur obtained from TESS database.
V404 Aur (TESS target identifier: TIC 440362600) and GW Gem (TIC 126218852) are members of the TESS Input Catalog (TIC) which were used to select targets to observe at the 2-min cadence. V404 Aur and GW Gem were initially monitored during the TESS Prime Mission in some sectors, the detailed information of the TESS data used in this study of both targets was listed in the Table 2, which includes the sector, provenance name, exposure time, and observation time. The data were retrieved using the Python package lightkurve (Lightkurve Collaboration et al. 2018) from the MAST data archive(http://https://mast.stsci.edu/), which provides three different types of data products. Two kinds of light curves from the authors named TESS-SPOC and QLP, and the other is the TESScut cutouts of the calibrated Full Frame Images from the author named TESScut with an exposure time of 158.4 s. We downloaded 20 $\times$
20 pixels files centered on V404 Aur and GW Gem using the TESScut tool. Then, the python procedure dat.to_lightcurve was used to get a simple aperture photometry light curve. The flux data are normalised. In this way, the light curves of V404 Aur from sector 59 and 73 and that of GW Gem from sector 71 and 72 were obtained. The time-series light curves of each sector and phase-binned light curves of V404 Aur and GW Gem obtained from the TESS database are presented in Figs. 5 and 6. It should be noted that these data were not compared to a constant star to make them differential. The phase-binned light curves of both targets were based on the part of the data in corresponding sectors, which were shown in the left panel of the phase-binned light curves individually.
$\times$
20 pixels files centered on V404 Aur and GW Gem using the TESScut tool. Then, the python procedure dat.to_lightcurve was used to get a simple aperture photometry light curve. The flux data are normalised. In this way, the light curves of V404 Aur from sector 59 and 73 and that of GW Gem from sector 71 and 72 were obtained. The time-series light curves of each sector and phase-binned light curves of V404 Aur and GW Gem obtained from the TESS database are presented in Figs. 5 and 6. It should be noted that these data were not compared to a constant star to make them differential. The phase-binned light curves of both targets were based on the part of the data in corresponding sectors, which were shown in the left panel of the phase-binned light curves individually.
The continuous time-series and phase-binned light curves of GW Gem obtained from TESS database.
2.3 Spectroscopic observations
The spectra of V404 Aur and GW Gem were observed with the Beijing Faint Object Spectrograph and Camera (BFOSC) mounted to the 2.16m telescope of Xinglong station of the National Astronomical Observatories of China (NAOC), Chinese Academy of Sciences (CAS). Two spectra of V404 Aur were observed on 2023 November 14 and 15, and one spectrum of GW Gem was observed on 2023 November 15. Low-dispersion spectrometer BFOSC and grism G6 were used during our observation. The slit width and line dispersion of grism G6 are 1.8 arcsec and 88 Å mm $^{-1}$
, respectively, and the observation wavelength range is 330–545 nm (Fan et al. Reference Fan2016). The spectra resolution is 1.98 Å per pixel. IRAF was used to process the observation images and extract the spectra. Normalised flux was obtained with atmospheric absorption lines corrected. In such resolution, spectra can only show the spectral lines of the primary star, and the lines of the secondary star may be too faint to be detected. The observed spectrum is shown in Fig. 7 with black lines.
$^{-1}$
, respectively, and the observation wavelength range is 330–545 nm (Fan et al. Reference Fan2016). The spectra resolution is 1.98 Å per pixel. IRAF was used to process the observation images and extract the spectra. Normalised flux was obtained with atmospheric absorption lines corrected. In such resolution, spectra can only show the spectral lines of the primary star, and the lines of the secondary star may be too faint to be detected. The observed spectrum is shown in Fig. 7 with black lines.
University of Lyon Spectroscopic analysis Software (ULySS) (Koleva et al. Reference Koleva, Prugniel, Bouchard and Wu2009) was employed to acquire the atmospheric parameters through full spectra fitting with model spectra generated by an interpolator with the ELODIE library (Prugniel & Soubiran Reference Prugniel and Soubiran2001). The red lines in Fig. 7 show the fitted spectra. The atmospheric stellar parameters were derived, for V404Aur: $T_{eff}=8483\pm$
273 K,
$T_{eff}=8483\pm$
273 K, $\log {g}$
=3.94
$\log {g}$
=3.94 $\pm$
1.40 cm/s
$\pm$
1.40 cm/s $^2$
, [Fe/H]=-0.57
$^2$
, [Fe/H]=-0.57 $\pm$
0.17 dex; for GW Gem:
$\pm$
0.17 dex; for GW Gem: $T_{eff}$
=7455
$T_{eff}$
=7455 $\pm$
218 K,
$\pm$
218 K, $\log {g}$
=4.11
$\log {g}$
=4.11 $\pm$
0.60 cm/s
$\pm$
0.60 cm/s $^2$
, [Fe/H]=-0.26
$^2$
, [Fe/H]=-0.26 $\pm$
0.10 dex. Since, for the above two targets, in the spectra analysis program, the binaries spectra were analysed as the single star spectra ignoring the secondary (faint) component, it might happen that diluted primary’s spectra mimic a low metallicity. Commonly, the atmospheric parameters obtained by ULySS can be used to describe the atmospheric characteristics of the primary star. The physical properties of the primary can be estimated from the atmosphere parameters by matching with stellar isochrones (Zhang et al. Reference Zhang, Qian, Wu and Zhou2019), using the PARSEC (PAdova and TRieste Stellar Evolution Code) isochrone database (Bressan et al. Reference Bressan, Marigo, Girardi, Salasnich, Dal Cero, Rubele and Nanni2012; Chen et al. Reference Chen, Girardi, Bressan, Marigo, Barbieri and Kong2014, Reference Chen, Bressan, Girardi, Marigo, Kong and Lanza2015; Tang et al. Reference Tang, Bressan, Rosenfield, Slemer, Marigo, Girardi and Bianchi2014), along with the lognormal form initial mass function by Chabrier (Reference Chabrier2001). Then the primary stars’ physical properties (including mass, radius, and age) can be determined. For V404Aur:
$\pm$
0.10 dex. Since, for the above two targets, in the spectra analysis program, the binaries spectra were analysed as the single star spectra ignoring the secondary (faint) component, it might happen that diluted primary’s spectra mimic a low metallicity. Commonly, the atmospheric parameters obtained by ULySS can be used to describe the atmospheric characteristics of the primary star. The physical properties of the primary can be estimated from the atmosphere parameters by matching with stellar isochrones (Zhang et al. Reference Zhang, Qian, Wu and Zhou2019), using the PARSEC (PAdova and TRieste Stellar Evolution Code) isochrone database (Bressan et al. Reference Bressan, Marigo, Girardi, Salasnich, Dal Cero, Rubele and Nanni2012; Chen et al. Reference Chen, Girardi, Bressan, Marigo, Barbieri and Kong2014, Reference Chen, Bressan, Girardi, Marigo, Kong and Lanza2015; Tang et al. Reference Tang, Bressan, Rosenfield, Slemer, Marigo, Girardi and Bianchi2014), along with the lognormal form initial mass function by Chabrier (Reference Chabrier2001). Then the primary stars’ physical properties (including mass, radius, and age) can be determined. For V404Aur: $M_1=1.72_ {1.68}^{1.77}\,\mathrm{M}_\odot$
,
$M_1=1.72_ {1.68}^{1.77}\,\mathrm{M}_\odot$
, $R_1=2.29_{2.19}^{2.53}\,\mathrm{R}_\odot$
,
$R_1=2.29_{2.19}^{2.53}\,\mathrm{R}_\odot$
, $logL_1=1.388_{1.341}^{1.469}\,\mathrm{L}_\odot$
; for GW Gem:
$logL_1=1.388_{1.341}^{1.469}\,\mathrm{L}_\odot$
; for GW Gem: $M_1=1.47_{1.43}^{1.52}\,\mathrm{M}_\odot$
,
$M_1=1.47_{1.43}^{1.52}\,\mathrm{M}_\odot$
, $R_1=1.76_{1.69}^{1.85}\,\mathrm{R}_\odot$
,
$R_1=1.76_{1.69}^{1.85}\,\mathrm{R}_\odot$
, $logL_1=0.939_{0.869}^{1.007}\,\mathrm{L}_\odot$
.
$logL_1=0.939_{0.869}^{1.007}\,\mathrm{L}_\odot$
.
The blue-violet spectrum (3 800–4 600 Å) of V404 Aur, GW Gem and part of the spectrum of two MK standard spectra with a type of A3 V (Bet Leo) and F0 III are shown in Fig. 8. It is clear that the Ca II K lines of V404 Aur and GW Gem are quite weaker in strength than that of the A3 and F0 MK standards.
Spectrum of V404 Aur and GW Gem observed on 2023 November 15. The black and red lines in the top panel represent the observed and fitted spectrum, respectively.
A comparison of the blue-violet spectrum (3 800–4 600 Å) of V404 Aur and GW Gem with the part of the spectrum of two MK standards.
3. $\boldsymbol{O-C}$
Diagram Analysis
$\boldsymbol{O-C}$
Diagram Analysis

All the available times of light minimum with error of V404 Aur and GW Gem were collected from the literature. Meanwhile, we computed the light minimums based on the TESS observation data for both targets and turned the BJD time into HJD time, which were listed in the Appendix of Tables A1 and B1 marked with ‘This study*’ in the corresponding reference column.
3.1 V404 Aur
For V404 Aur, combining with two eclipse timings observed by us and 137 eclipse timings obtained from the TESS data base, total 221 eclipse times crossing about 60 yr were used to structure the $O-C$
diagram. All eclipse times used for the period analysis are listed in the Appendix of Table A1. The reference items marked with ‘*’ mean that the original publications are unavailable online. The corresponding
$O-C$
diagram. All eclipse times used for the period analysis are listed in the Appendix of Table A1. The reference items marked with ‘*’ mean that the original publications are unavailable online. The corresponding $O-C$
and cycles E were obtained with the following ephemeris:
$O-C$
and cycles E were obtained with the following ephemeris:
 \begin{eqnarray}Min {I} &=& HJD\, 2459946.14318\nonumber\\ &\;&+0.7543173^{d}\times E\end{eqnarray}
The $O-C$
diagram of V404 Aur is shown in Fig. 9 with error bars, in which, triangle and circle dot represent the data observed with photograph (pg), and CCD type detectors, respectively. In particular, the anti triangle was used to mark the light minimum obtained from the TESS database. A weight of 1 for photograph data and a high weight of 10 for CCD data (including the TESS-based) were applied in the
$O-C$
diagram of V404 Aur is shown in Fig. 9 with error bars, in which, triangle and circle dot represent the data observed with photograph (pg), and CCD type detectors, respectively. In particular, the anti triangle was used to mark the light minimum obtained from the TESS database. A weight of 1 for photograph data and a high weight of 10 for CCD data (including the TESS-based) were applied in the $O-C$
analysis. Based on the least-squares method, the following equation can describe the
$O-C$
analysis. Based on the least-squares method, the following equation can describe the $O-C$
diagram:
$O-C$
diagram:
 \begin{eqnarray}Min {I} &=& HJD\,2459956.14413(3)\nonumber\\ &\;& +0.754315832(11)\times{E}\nonumber\\ &\;& -1.10(1)\times 10^{-10}\times{E}^{2}\end{eqnarray}
The quadratic term in the above polymerisation means that the period is undergoing a long-term decrease at a rate of $dP/dt=-1.06(\pm0.01)\times 10^{-7}\,\mathrm{d}\,\mathrm{ yr}^{-1}$
. The black line in Fig. 9 represents the corresponding fitted curve. The fitting residuals are shown at the bottom of Fig. 9, and there is no cyclic change and other change anymore.
$dP/dt=-1.06(\pm0.01)\times 10^{-7}\,\mathrm{d}\,\mathrm{ yr}^{-1}$
. The black line in Fig. 9 represents the corresponding fitted curve. The fitting residuals are shown at the bottom of Fig. 9, and there is no cyclic change and other change anymore. $O-C$
diagram of V404 Aur.
$O-C$
diagram of V404 Aur.
3.2 GW Gem
For GW Gem, a totally of 578 eclipse times crossing about 94 years were used to structure the $O-C$
diagram including 2 new observed and 381 eclipse timings estimated from the TESS data base by this study, which are listed in the Appendix of Table B1. The following ephemeris is used to obtain the corresponding
$O-C$
diagram including 2 new observed and 381 eclipse timings estimated from the TESS data base by this study, which are listed in the Appendix of Table B1. The following ephemeris is used to obtain the corresponding $O-C$
and cycle E.
$O-C$
and cycle E.
 \begin{eqnarray}Min {I}& = & HJD\, 2459939.34201\nonumber\\ &\;&+0.659444013^{d}\times E\end{eqnarray}
Fig. 10 shows the $O-C$
diagram with the error bar of GW Gem, in which pentagram, triangle, square, and circle dot represent the data observed with visual (vis), photograph (pg), photoelectricity (pe) and CCD type detectors, respectively. The light minimum obtained from the TESS database was marked with the same anti-triangle as shown in Fig. 9. In the
$O-C$
diagram with the error bar of GW Gem, in which pentagram, triangle, square, and circle dot represent the data observed with visual (vis), photograph (pg), photoelectricity (pe) and CCD type detectors, respectively. The light minimum obtained from the TESS database was marked with the same anti-triangle as shown in Fig. 9. In the $O-C$
analysis program, the weights adopted for each observation method data are shown as follows: 1 for visual (vis) and photographic (pg) data, 10 for photoelectric (pe) and CCD data. Based on the least-squares method, the
$O-C$
analysis program, the weights adopted for each observation method data are shown as follows: 1 for visual (vis) and photographic (pg) data, 10 for photoelectric (pe) and CCD data. Based on the least-squares method, the $O-C$
of GW Gem can be described by the following equation:
$O-C$
of GW Gem can be described by the following equation:
 \begin{eqnarray}Min {I} &=& HJD\,2459939.34318(2)\nonumber\\ &\;&+0.659445886(5)\times{E}\nonumber\\ &\;&+2.18(1)\times 10^{-11}\times{E}^{2}\end{eqnarray}
The quadratic term in the above polymerisation means that the period is undergoing a long-term increase at a rate of $dP/dt=+2.41(\pm0.01)\times 10^{-8}\,\mathrm{d}\,\mathrm{ yr}^{-1}$
, which is consistent with the analysis of Lee et al. (Reference Lee, Kim, Lee, Kim, Park, Park and Koch2009). The black line in Fig. 10 represents the corresponding fitted curve. The fitting residuals are shown at the bottom of Fig. 10.
$dP/dt=+2.41(\pm0.01)\times 10^{-8}\,\mathrm{d}\,\mathrm{ yr}^{-1}$
, which is consistent with the analysis of Lee et al. (Reference Lee, Kim, Lee, Kim, Park, Park and Koch2009). The black line in Fig. 10 represents the corresponding fitted curve. The fitting residuals are shown at the bottom of Fig. 10. $O-C$
diagram of GW Gem.
$O-C$
diagram of GW Gem.
4. Light Curve Analyses
4.1 V404 Aur
The first multi-colour light curves of V404 Aur were observed. The TESS observation data from sector 73 (covering about HJD 2460595.5 to HJD 2460299.0) was utilised to generate the light curve for analysis, which is shown in the bottom right panel of Fig. 5. In the figures below, the observed multi-colour light curve is labeled as ‘LC_Obs’, while the light curve obtained from the TESS database is labeled as ‘LC_TESS’. Different linear ephemerides were used to calculate the phased light curves. For the multi-colour light curves, the following linear ephemeris was employed.
 \begin{eqnarray}Min {I}& = &HJD\,2459946.14318(29)\nonumber\\ &\;&+0.7543173^{d}\times E\end{eqnarray}
For the light curve form TESS, following linear ephemeris was used:
 \begin{eqnarray}Min {I}& = &HJD\,2460296.14608(23)\nonumber\\ &\;&+0.7543173^{d}\times E\end{eqnarray}
in which, the epoch 2459946.14318(29) is the observed eclipse times and 2460296.14608(23) is the eclipse times based on the TESS database. $\sum$
-q curves of V404 Aur.
$\sum$
-q curves of V404 Aur.

The theoretical light curves of V404 Aur based on multi-colour light curves with Mode 5.

Wilson-Devinney (W-D) program (Wilson & Devinney Reference Wilson and Devinney1971; Wilson Reference Wilson1990, Reference Wilson2012) was used to analysis the two sets of light curves. The effective temperature of the primary star was obtained as $T_1=8\,483$
K from our spectral analysis and the primary effective temperature was fixed at 8 483 K in the WD process. The gravity-darkening coefficients and bolometric albedos for the both components with radiative envelope
$T_1=8\,483$
K from our spectral analysis and the primary effective temperature was fixed at 8 483 K in the WD process. The gravity-darkening coefficients and bolometric albedos for the both components with radiative envelope $(T \gt 7\,200\,\mathrm{K})$
are taken as
$(T \gt 7\,200\,\mathrm{K})$
are taken as $g_1$
=1,
$g_1$
=1, $g_2=0.32$
and
$g_2=0.32$
and $A_1$
=1,
$A_1$
=1, $A_2=0.5$
(Ruciński 1969). Meanwhile, the bandpass limb-darkening coefficients taken from van Hamme (Reference van Hamme1993) and the logarithmic bolometric coefficients were applied. We acquired the convergent solutions of LC_Obs with Mode 5 (the semidetached case with the secondary component filling the critical RL). The corresponding adjustable parameters of Mode 5 are following: the monochromatic luminosity of star 1,
$A_2=0.5$
(Ruciński 1969). Meanwhile, the bandpass limb-darkening coefficients taken from van Hamme (Reference van Hamme1993) and the logarithmic bolometric coefficients were applied. We acquired the convergent solutions of LC_Obs with Mode 5 (the semidetached case with the secondary component filling the critical RL). The corresponding adjustable parameters of Mode 5 are following: the monochromatic luminosity of star 1, $L_{1B}$
,
$L_{1B}$
, $L_{1V}$
,
$L_{1V}$
, $L_{1R_c}$
,
$L_{1R_c}$
, $L_{1I_c}$
; the orbital inclination i; the mean temperature of star 2,
$L_{1I_c}$
; the orbital inclination i; the mean temperature of star 2, $T_2$
; and the dimensionless potential of the primary star,
$T_2$
; and the dimensionless potential of the primary star, $\Omega_1$
. Based on the TESS light curve, we determined that there is no convergent solution when
$\Omega_1$
. Based on the TESS light curve, we determined that there is no convergent solution when $q \gt 0.45$
with Mode 5, and there is no convergent solution when
$q \gt 0.45$
with Mode 5, and there is no convergent solution when $q \lt 0.36$
with Mode 3. Therefore, the convergent solution with Mode 3 would be more suitable for the LC_TESS of this target. The adjustable parameters in the Mode 3 are the same as those in the Mode 5. For confirming a more reliable mass ratio, the photometric solutions based on a group of assumed mass ratio values from 0.01 to 1 were obtained with the differential correction program. The search step length is 0.01. For all assumed values of q, the sums of weighted square deviations (
$q \lt 0.36$
with Mode 3. Therefore, the convergent solution with Mode 3 would be more suitable for the LC_TESS of this target. The adjustable parameters in the Mode 3 are the same as those in the Mode 5. For confirming a more reliable mass ratio, the photometric solutions based on a group of assumed mass ratio values from 0.01 to 1 were obtained with the differential correction program. The search step length is 0.01. For all assumed values of q, the sums of weighted square deviations ( $\overline{\sum{(O-C)_i}^2}$
) based on two sets of light curves are displayed in Fig. 11. In order to make the minimal q value more obvious, only the trend of change from
$\overline{\sum{(O-C)_i}^2}$
) based on two sets of light curves are displayed in Fig. 11. In order to make the minimal q value more obvious, only the trend of change from $q=0.3$
to
$q=0.3$
to $q=1$
was plotted. The minimal value achieved at
$q=1$
was plotted. The minimal value achieved at $q=0.38$
and
$q=0.38$
and $q=0.44$
for observed multi-colour light curves and TESS light curves, respectively. So we make q as an adjustable parameter and set
$q=0.44$
for observed multi-colour light curves and TESS light curves, respectively. So we make q as an adjustable parameter and set $q=0.38$
and
$q=0.38$
and $q=0.44$
as the initial value in the WD process for the two sets of light curves, respectively. The theoretical light curves for multi-colour light curves and TESS light curve are shown in Figs. 12 and 13 in black lines, respectively. The theoretical light curves fitted the light curves very well. All converged photometric solutions are listed in Table 2. V404 Aur is likely a marginal contact binary with a extremely small contact degree of
$q=0.44$
as the initial value in the WD process for the two sets of light curves, respectively. The theoretical light curves for multi-colour light curves and TESS light curve are shown in Figs. 12 and 13 in black lines, respectively. The theoretical light curves fitted the light curves very well. All converged photometric solutions are listed in Table 2. V404 Aur is likely a marginal contact binary with a extremely small contact degree of $f=3.16\%$
. It’s worth noting that the mass and radius ratios calculated based on the LC_TESS is larger than those based on the observed light curve LC_Obs, which may be due to the limitations in the models. The 3D geometric structure based on LC_Obs with Mode5 are shown in Fig. 14.
$f=3.16\%$
. It’s worth noting that the mass and radius ratios calculated based on the LC_TESS is larger than those based on the observed light curve LC_Obs, which may be due to the limitations in the models. The 3D geometric structure based on LC_Obs with Mode5 are shown in Fig. 14.
The theoretical light curves of V404 Aur based on TESS database with in Mode 3.
Geometrical structure of V404 Aur with Mode 5.
4.2 GW Gem
The new multi-colour light curves of GW Gem were observed. The TESS observation data from sector 71 (covering about HJD 2460240.5 to HJD 2460245.8) was utilised to generate the light curve for analysis, which is shown in the bottom right panel of Fig. 6. Same as V404 Aur, different linear ephemeris were used to calculate the phased light curves for the observed multi-colour light curves and TESS observation. For multi-colour light curves, the following linear ephemeris was used:
 \begin{eqnarray}Min {I}& = &HJD\,2459939.34201(36)\nonumber\\ &\;&+0.659444013^{d}\times E\end{eqnarray}
For the light curve from TESS, the following linear ephemeris was used:
 \begin{eqnarray}Min {I}& = &HJD\,2460241.36901(5)\nonumber\\ &\;&+0.659444013^{d}\times E\end{eqnarray}
in the above linear ephemeris, the epoch 2459939.34201(36) is the observed eclipse times and 2460241.36901(5) is the eclipse times based on TESS database.
Meanwhile, the Wilson-Devinney (W-D) program with appropriate parameter settings (such as gravity-darkening coefficients, bolometric albedos, bandpass limb-darkening coefficients, limb-darkening coefficients, logarithmic bolometric coefficients) was used to analyse the light curves. The primary effective temperature was fixed at 7 455 K in the WD process, which was obtained from our spectra analysis. The convergent solutions were confirmed with Mode 5. The corresponding adjustable parameters have been introduced in the previous paragraph. The search for a more reliable mass ratio has also been confirmed using the same method for V404 Aur based on the two sets of light curves. The sums of weighted square deviations ( $\sum{(O-C)_i}^2$
) for all assumed values of q are displayed in Fig. 15 based on both two sets of light curves. In order to make the minimal q value more obvious, only the trend of change from
$\sum{(O-C)_i}^2$
) for all assumed values of q are displayed in Fig. 15 based on both two sets of light curves. In order to make the minimal q value more obvious, only the trend of change from $q=0.3$
to
$q=0.3$
to $q=1$
was plotted. The minimal value is attained at
$q=1$
was plotted. The minimal value is attained at $q=0.37$
for observed multi-colour light curves (labeled as ‘LC_Obs’ and at
$q=0.37$
for observed multi-colour light curves (labeled as ‘LC_Obs’ and at $q=0.36$
for the TESS light curves (labeled as ‘LC_TESS’). Then ‘q’ was taken as an adjustable parameter and set
$q=0.36$
for the TESS light curves (labeled as ‘LC_TESS’). Then ‘q’ was taken as an adjustable parameter and set $q=0.37$
and
$q=0.37$
and $q=0.36$
as the initial value in the WD process for the two sets of light curves, respectively. The theoretical light curves for multi-colour light curves are shown in Fig. 16 in black lines. For the light curve of TESS data, the initial theoretical light curve shows a poor fit for the two light maximum. The TESS light curve shows slight asymmetry, which can due to the brightness enhancement at the secondary light maximum or the brightness weaken at the primary light maximum. The asymmetry means that the light curves have been disturbed by some perturbation caused by the photosphere activity of the components. The discrepancies can be modeled by a possible hot spot on the primary star due to impact from mass transfer between the components, or a cool spot on the secondary star having a convective atmosphere. Thus, two different model spots were postulated to reanalyse the TESS light curves by using the unspotted photometric parameters as initial values. A spot model was employed for the light curve fit with four adjustable parameters: the latitude of spot center (
$q=0.36$
as the initial value in the WD process for the two sets of light curves, respectively. The theoretical light curves for multi-colour light curves are shown in Fig. 16 in black lines. For the light curve of TESS data, the initial theoretical light curve shows a poor fit for the two light maximum. The TESS light curve shows slight asymmetry, which can due to the brightness enhancement at the secondary light maximum or the brightness weaken at the primary light maximum. The asymmetry means that the light curves have been disturbed by some perturbation caused by the photosphere activity of the components. The discrepancies can be modeled by a possible hot spot on the primary star due to impact from mass transfer between the components, or a cool spot on the secondary star having a convective atmosphere. Thus, two different model spots were postulated to reanalyse the TESS light curves by using the unspotted photometric parameters as initial values. A spot model was employed for the light curve fit with four adjustable parameters: the latitude of spot center ( $\theta$
) in degree; the longitude of spot center (
$\theta$
) in degree; the longitude of spot center ( $\phi$
) in degrees; the spot angular radius (r) in radians; and the spot temperature fact
$\phi$
) in degrees; the spot angular radius (r) in radians; and the spot temperature fact $T_f$
(
$T_f$
( $T_f=T_s/T_\ast$
, in which
$T_f=T_s/T_\ast$
, in which $T_s$
is the spot temperature and
$T_s$
is the spot temperature and $T_\ast$
is the photosphere surface temperature of the star). Two kinds of spotted model have obtain the convergent solutions. While, the theoretical light curve with a cold spot didn’t improve the initial fill of the secondary light maximum well. Then, the spot mode with a hot spot was considered to be more suitable. The initial theoretical light curve without spot and the theoretical light curves with a hot spot were plotted in Fig. 17 as the blue and red lines, respectively. The spotted theoretical light curves with a hot spot fitted the light curve better than the initial theoretical light curve without a spot. All converged photometric solutions are listed in Table 3. The geometric structure based on LC_Obs and LC_TESS with a hot spot in 3D view are both shown in Fig. 18.
$T_\ast$
is the photosphere surface temperature of the star). Two kinds of spotted model have obtain the convergent solutions. While, the theoretical light curve with a cold spot didn’t improve the initial fill of the secondary light maximum well. Then, the spot mode with a hot spot was considered to be more suitable. The initial theoretical light curve without spot and the theoretical light curves with a hot spot were plotted in Fig. 17 as the blue and red lines, respectively. The spotted theoretical light curves with a hot spot fitted the light curve better than the initial theoretical light curve without a spot. All converged photometric solutions are listed in Table 3. The geometric structure based on LC_Obs and LC_TESS with a hot spot in 3D view are both shown in Fig. 18. $\sum$
-q curves of GW Gem.
$\sum$
-q curves of GW Gem.

The theoretical light curves of GW Gem based on multi-colour light curves.
The theoretical light curves of GW Gem based on TESS database.

5. Discussion and conclusion
5.1 V404 Aur and GW Gem
Through the spectra analysis, the atmosphere parameters of the primary components of the two targets are obtained, which are shown as follows: for V404Aur: $T_{eff}=8\,483\pm$
273 K,
$T_{eff}=8\,483\pm$
273 K, $\log {g}=3.94\pm$
1.40 cm/s
$\log {g}=3.94\pm$
1.40 cm/s $^2$
, [Fe/H]=-0.57
$^2$
, [Fe/H]=-0.57 $\pm$
0.17 dex; for GW Gem:
$\pm$
0.17 dex; for GW Gem: $T_{eff}=7\,455\pm$
218 K,
$T_{eff}=7\,455\pm$
218 K, $\log {g}$
=4.11
$\log {g}$
=4.11 $\pm$
0.60 cm/s
$\pm$
0.60 cm/s $^2$
, [Fe/H]=-0.26
$^2$
, [Fe/H]=-0.26 $\pm$
0.10 dex. The physical properties of the primary can be estimated from the atmosphere parameters by matching with stellar isochrones, using the PARSEC database. For V404Aur:
$\pm$
0.10 dex. The physical properties of the primary can be estimated from the atmosphere parameters by matching with stellar isochrones, using the PARSEC database. For V404Aur: $M_1=1.72_ {1.68}^{1.77}\,\mathrm{M}_\odot$
,
$M_1=1.72_ {1.68}^{1.77}\,\mathrm{M}_\odot$
, $R_1=2.29_{2.19}^{2.53}\,\mathrm{R}_\odot$
,
$R_1=2.29_{2.19}^{2.53}\,\mathrm{R}_\odot$
, $log L_1=1.388_{1.341}^{1.469}\,\mathrm{L}_\odot$
; for GW Gem:
$log L_1=1.388_{1.341}^{1.469}\,\mathrm{L}_\odot$
; for GW Gem: $M_1=1.47_{1.43}^{1.52}\,\mathrm{ M}_\odot$
,
$M_1=1.47_{1.43}^{1.52}\,\mathrm{ M}_\odot$
, $R_1=1.76_{1.69}^{1.85}\,\mathrm{R}_\odot$
,
$R_1=1.76_{1.69}^{1.85}\,\mathrm{R}_\odot$
, $log L_1=0.939_{0.869}^{1.007}\,\mathrm{L}_\odot$
. WD program was used to fit the light curves of the two targets. The light curves of V404 Aur show beta Lyrae characteristics, while the light curves of GW Gem show Algol characteristics. The theoretical light curves with Mode 5 and Mode 3 fitted the LC_Obs and LC_TESS of V404 Aur quite well. The fill-degree factor of the primary component of V404 Aur is 0.9966(10) based on LC_Obs with Mode 5 and the contact degree of
$log L_1=0.939_{0.869}^{1.007}\,\mathrm{L}_\odot$
. WD program was used to fit the light curves of the two targets. The light curves of V404 Aur show beta Lyrae characteristics, while the light curves of GW Gem show Algol characteristics. The theoretical light curves with Mode 5 and Mode 3 fitted the LC_Obs and LC_TESS of V404 Aur quite well. The fill-degree factor of the primary component of V404 Aur is 0.9966(10) based on LC_Obs with Mode 5 and the contact degree of $f=3.16\%$
with Mode 3, which indicates that V404 Aur should be a marginal contact binary with secondary has already filled its RL and the primary is nearly filling the RL. While the fill-degree factor of the primary component of GW Gem is 0.8098(18) based on multi-colour light curves solutions, indicating that GW Gem is a semi-detached binary with the secondary has already filling its RL. The orbital inclinations of two targets are
$f=3.16\%$
with Mode 3, which indicates that V404 Aur should be a marginal contact binary with secondary has already filled its RL and the primary is nearly filling the RL. While the fill-degree factor of the primary component of GW Gem is 0.8098(18) based on multi-colour light curves solutions, indicating that GW Gem is a semi-detached binary with the secondary has already filling its RL. The orbital inclinations of two targets are $i=81.11(12)^\circ$
for V404 Aur and
$i=81.11(12)^\circ$
for V404 Aur and $i=86.07(21)^\circ$
for GW Gem, which means that the photometric solutions can be reliable. Based on the physical properties of the primary and the photometric solutions, the absolute parameters of the two binaries were estimated and listed in Table 4.
$i=86.07(21)^\circ$
for GW Gem, which means that the photometric solutions can be reliable. Based on the physical properties of the primary and the photometric solutions, the absolute parameters of the two binaries were estimated and listed in Table 4.
Photometric solutions of V404 Aur and GW Gem.
Geometrical structure of GW Gem.
The light curve of TESS data shows a slight asymmetry with brightness difference between the two light maximums. Such asymmetry refers to the O’Connell effect, which is a phenomenon where the magnitude of the primary light maximum (near 0.25 phase) differs from the secondary one (near 0.75 phase) (e.g., Milone Reference Milone1969; Liu & Yang Reference Liu and Yang1999; Qian et al. Reference Qian2014), The O’Connell effect can be caused by many common and complex mechanisms in eclipsing binaries, including flares, spots, mass transfer, etc. The spotted theoretical light curve fitted the LC_TESS of GW Gem better than the theoretical light curve without a spot. The final converged photometric solutions show that the brightness enhancement can be explained by the appearance of a hot spot near the facing surface of the primary component due to the mass transfer. Accretion stream caused by the long-term mass transfer from the secondary star will emerge on the surface of the primary component and then it will move to one side of the midline of the two stars, which will lead to local brightness enhancement of the surface (Hilditch et al. Reference Hilditch, Collier Cameron, Hill, Bell and Harries1997). The latitude and longitude of the spot center are about $163.1^{\circ}$
and
$163.1^{\circ}$
and $78.9^{\circ}$
, and the angular radius of the spot is about
$78.9^{\circ}$
, and the angular radius of the spot is about $20.05^{\circ}$
. The proportion of hot spot area in the surface of the primary component is about 2.79%. That is much larger than that of a spot on the Sun (the area of sunspot is usually less than 1% of the photospheric surface of the Sun). The spot may be composed of a group of small spots. The hot spot is one kind of vestige of mass transfer, and its area can be considered as an indirect measurable parameter of mass transfer. Moreover, the long-term orbital period increase, lasting about 100 yr, is further evidence of mass transfer between components.
$20.05^{\circ}$
. The proportion of hot spot area in the surface of the primary component is about 2.79%. That is much larger than that of a spot on the Sun (the area of sunspot is usually less than 1% of the photospheric surface of the Sun). The spot may be composed of a group of small spots. The hot spot is one kind of vestige of mass transfer, and its area can be considered as an indirect measurable parameter of mass transfer. Moreover, the long-term orbital period increase, lasting about 100 yr, is further evidence of mass transfer between components.
It is noteworthy that the light curves observed by Broglia & Conconi (Reference Broglia and Conconi1981) from 1978 to 1979 show no obvious asymmetry. However, Lee et al. (Reference Lee, Kim, Lee, Kim, Park, Park and Koch2009) detected asymmetric in the muti-colour light curves observed around 2007 2008. The difference in brightness between the sets of light curves has not yet understood. A trifling hot spot may be present because of the weak mass transfer. This spot might be relatively inconspicuous, and its impact on the light curves is smaller than the measurement precision.
All available eclipse times were used to investigate the variations of the orbital period by analyzing the $O-C$
diagram. The
$O-C$
diagram. The $O-C$
analysis found that the period of V404 Aur is decreasing at a rate of
$O-C$
analysis found that the period of V404 Aur is decreasing at a rate of $dP/dt=-1.06(\pm0.01)\times 10^{-7}\,\mathrm{d}\,\mathrm{yr}^{-1}$
, while the period of GW Gem is increasing at a rate of
$dP/dt=-1.06(\pm0.01)\times 10^{-7}\,\mathrm{d}\,\mathrm{yr}^{-1}$
, while the period of GW Gem is increasing at a rate of $dP/dt=+2.41(\pm0.01)\times 10^{-8}\,\mathrm{d}\,\mathrm{yr}^{-1}$
. The long-term period change was in agreement with the semi-detached configuration of the close binary system. For V404 Aur, the period decrease may mainly be caused by the combined effects of the angular momentum loss (AML) via an enhanced stellar wind of the more evolved secondary star and mass transfer between two components (e.g.,Tout & Eggleton Reference Tout and Eggleton1988; Liao et al. Reference Liao, Qian, Li, Zhou, Zhao and Zhang2017; Liao, Qian, & Sarotsakulchai Reference Liao, Qian and Sarotsakulchai2019). V404 Aur should be a particular target lying in the thermal relaxation oscillation theory (TRO) stage, like TYC 6408-989-1(Tian Reference Tian2021) and other marginal contact binaries(Qian & Zhu Reference Qian and Zhu2002; Zhu et al. Reference Zhu, Qian, Zola and Kreiner2009, Reference Zhu, Zejda, Mikulášek, Liška, Qian and de Villiers2012). They are in a semidetached phase with the secondary star filling the RL, and V404 Aur has evolved into a marginal-contact phase with poor thermal contact (e.g.,Liao, Qian, & Liu Reference Liao, Qian and Liu2012; Qian et al. Reference Qian, Liu, Liao, He, Liu, Zhu, Wang and Zhao2013, Reference Qian2014; Liao & Sarotsakulchai Reference Liao and Sarotsakulchai2019), while GW Gem will evolve into such a phase. GW Gem is a typical Algol system in a semidetached phase with the secondary star filling the RL. The long-term period increase of GW Gem is in agreement with the semi-detached configuration of this system. The period increase may be the result of the mass transfer from the secondary component to the primary one (e.g., Qian Reference Qian2002; Tian & Zhu Reference Tian and Zhu2019), resulting in a hot spot on the primary’s surface. Mass transfer in the two targets additionally suggests that mass transfer may be important in the formation of Am stars.
$dP/dt=+2.41(\pm0.01)\times 10^{-8}\,\mathrm{d}\,\mathrm{yr}^{-1}$
. The long-term period change was in agreement with the semi-detached configuration of the close binary system. For V404 Aur, the period decrease may mainly be caused by the combined effects of the angular momentum loss (AML) via an enhanced stellar wind of the more evolved secondary star and mass transfer between two components (e.g.,Tout & Eggleton Reference Tout and Eggleton1988; Liao et al. Reference Liao, Qian, Li, Zhou, Zhao and Zhang2017; Liao, Qian, & Sarotsakulchai Reference Liao, Qian and Sarotsakulchai2019). V404 Aur should be a particular target lying in the thermal relaxation oscillation theory (TRO) stage, like TYC 6408-989-1(Tian Reference Tian2021) and other marginal contact binaries(Qian & Zhu Reference Qian and Zhu2002; Zhu et al. Reference Zhu, Qian, Zola and Kreiner2009, Reference Zhu, Zejda, Mikulášek, Liška, Qian and de Villiers2012). They are in a semidetached phase with the secondary star filling the RL, and V404 Aur has evolved into a marginal-contact phase with poor thermal contact (e.g.,Liao, Qian, & Liu Reference Liao, Qian and Liu2012; Qian et al. Reference Qian, Liu, Liao, He, Liu, Zhu, Wang and Zhao2013, Reference Qian2014; Liao & Sarotsakulchai Reference Liao and Sarotsakulchai2019), while GW Gem will evolve into such a phase. GW Gem is a typical Algol system in a semidetached phase with the secondary star filling the RL. The long-term period increase of GW Gem is in agreement with the semi-detached configuration of this system. The period increase may be the result of the mass transfer from the secondary component to the primary one (e.g., Qian Reference Qian2002; Tian & Zhu Reference Tian and Zhu2019), resulting in a hot spot on the primary’s surface. Mass transfer in the two targets additionally suggests that mass transfer may be important in the formation of Am stars.
Absolute parameters of V404 Aur and GW Gem.
The components in very short-period near-contact systems, such like V404 Aur and GW Gem, are likely to be rotating synchronously. For a circular orbit, the following equation can be used to obtain the equatorial rotational velocity: $v = 50.6(R/R_\odot)/(P/d)\,\mathrm{km\,s}^{-1}$
(Carquillat & Prieur Reference Carquillat and Prieur2007), in which R is the radius of the considered component, P is the orbital period, v is its equatorial rotational velocity. The projected rotation velocity
$v = 50.6(R/R_\odot)/(P/d)\,\mathrm{km\,s}^{-1}$
(Carquillat & Prieur Reference Carquillat and Prieur2007), in which R is the radius of the considered component, P is the orbital period, v is its equatorial rotational velocity. The projected rotation velocity $v \sin i$
of the primaries of V404 Aur and GW Gem can be estimated as approximately 152 and 135
$v \sin i$
of the primaries of V404 Aur and GW Gem can be estimated as approximately 152 and 135 $\mathrm{km\, s}^{-1}$
, respectively. The targets are very special Am type eclipsing binary with very short period (less than one day) and quit large rotational velocity, which make them became a challenge to the cut-off of rotation velocities and periods of Am stars, like V1073 Cyg (
$\mathrm{km\, s}^{-1}$
, respectively. The targets are very special Am type eclipsing binary with very short period (less than one day) and quit large rotational velocity, which make them became a challenge to the cut-off of rotation velocities and periods of Am stars, like V1073 Cyg ( $v \sin i = 150\,\mathrm{km\,s}^{-1}$
) (Budaj Reference Budaj1996), and V2787 Ori (
$v \sin i = 150\,\mathrm{km\,s}^{-1}$
) (Budaj Reference Budaj1996), and V2787 Ori ( $v \sin i = 152\,\mathrm{km\,s}^{-1}$
based on
$v \sin i = 152\,\mathrm{km\,s}^{-1}$
based on $R_1$
=2.45 R
$R_1$
=2.45 R $_\odot$
Tian, Zhu, & Wang 2019).
$_\odot$
Tian, Zhu, & Wang 2019).
The relations between the mass ratio (q), radius ratio (k), effective temperature ratio (t), luminosity ratio (l), and total mass ( $M_{total}$
) of the eclipsing Am binaries. Upper left-hand panel: the l versus q; Upper right-hand panel: the k versus q. Bottom left-hand panel: the t versus q, the red dashed line is the fitting line for the EA type systems, the black dash lines represent the edges of the strip defined by the 5% and 95% percentiles of t for each q bin; Bottom right-hand panel: the
$M_{total}$
) of the eclipsing Am binaries. Upper left-hand panel: the l versus q; Upper right-hand panel: the k versus q. Bottom left-hand panel: the t versus q, the red dashed line is the fitting line for the EA type systems, the black dash lines represent the edges of the strip defined by the 5% and 95% percentiles of t for each q bin; Bottom right-hand panel: the $M_{total}$
versus q, the red dashed line is the fitting line and the black dash lines are as same as that in the diagram of t versus q.
$M_{total}$
versus q, the red dashed line is the fitting line and the black dash lines are as same as that in the diagram of t versus q.
Hertzsprung-Russell diagram of eclipsing Am binaries. The evolutionary tracks (thin solid lines) for the labeled masses, as well as the zero-age main sequence (ZAMS) and the terminal-age main sequence (TAMS), were taken from Bressan et al. (Reference Bressan, Marigo, Girardi, Salasnich, Dal Cero, Rubele and Nanni2012), which were calculated for $Y=0.279$
,
$Y=0.279$
, $Z=0.017$
.
$Z=0.017$
.
M-R, M-L, and M-T distribution of eclipsing Am binaries. The black dash lines in each panel are the empirical relationships of eclipsing Am binaries when $\log {M} \gt -0.09$
M
$\log {M} \gt -0.09$
M $_\odot$
. The blue dash-lines are the corresponding empirical relationships of main sequence stars (Eker et al. Reference Eker2018).
$_\odot$
. The blue dash-lines are the corresponding empirical relationships of main sequence stars (Eker et al. Reference Eker2018).

5.2 Properties of eclipsing Am binaries and statistical analysis
The physical parameters were collected for the well-known eclipsing Am binaries. A parameter table has been compiled and is displayed in the Appendix of Table 8. Currently, there are only 54 systems were well studied. The relationships between the parameters were also discussed. The distribution and relations between the mass ratio ( $q=M_2/M_1$
), radius ratio (
$q=M_2/M_1$
), radius ratio ( $k=M_2/M_1$
), surface effective temperature ratio (t=
$k=M_2/M_1$
), surface effective temperature ratio (t= $T_2/T_1$
), the luminosity ratio (
$T_2/T_1$
), the luminosity ratio ( $l=L_1/L_2$
), and the total mass (
$l=L_1/L_2$
), and the total mass ( $M_{total}$
) were discussed and the figures were shown in Fig. 19. Different colours were used to mark the EA and EB and EW type eclipsing Am binaries. The relation between l versus q is shown in the upper left-hand panel, with the black dashed line representing main-sequence star mass-luminosity relation(i.e. M-L relation),
$M_{total}$
) were discussed and the figures were shown in Fig. 19. Different colours were used to mark the EA and EB and EW type eclipsing Am binaries. The relation between l versus q is shown in the upper left-hand panel, with the black dashed line representing main-sequence star mass-luminosity relation(i.e. M-L relation), $l=q^{4.216}$
. Most systems adhere to the main-sequence M-L relation. The diagram in the upper right-hand panel displays k versus q, with the dashed line representing the empirical mass-radius of the main-sequence star, i.e. M-R relation,
$l=q^{4.216}$
. Most systems adhere to the main-sequence M-L relation. The diagram in the upper right-hand panel displays k versus q, with the dashed line representing the empirical mass-radius of the main-sequence star, i.e. M-R relation, $k=q^{0.64}$
. The M-R distribution of eclipsing Am binaries is around the main-sequence relation. The bottom left-hand panel shows the relation between the t and q, in which one can see that the temperature ratio(t) and the mass ratio(q) of the EA type eclipsing Am binaries follows a good linear relation. Meanwhile, the total mass,
$k=q^{0.64}$
. The M-R distribution of eclipsing Am binaries is around the main-sequence relation. The bottom left-hand panel shows the relation between the t and q, in which one can see that the temperature ratio(t) and the mass ratio(q) of the EA type eclipsing Am binaries follows a good linear relation. Meanwhile, the total mass, $M_{total}$
is also shown as a liner function of the mass ratio q, which is shown in the bottom right-hand panel. The two linear fitting lines can be written as follows:
$M_{total}$
is also shown as a liner function of the mass ratio q, which is shown in the bottom right-hand panel. The two linear fitting lines can be written as follows:
 \begin{align} t=0.413(\pm0.060)\times q+0.520(\pm0.045) \\[-25pt] \nonumber\end{align}
 \begin{align} M_{total}=1.476(\pm0.372)\times q+2.278(\pm0.297) \end{align}
The red dash-line in the bottom panels are the fitting lines, the black dash lines around the fitting line represent the edges of the strip defined by the 5% and 95% percentiles of t and $M_{total}$
for each q bin. Moreover, both of the boundaries are better defined. There is no other discussion about the relation between the total mass and mass ratio of the eclipsing Am binaries. However, but some authors have published their results on the relation of the normal late-type contact binaries (i.e. W UMa systems). The relationship between the total mass and mass ratio of the W UMa systems was identified by van’t Veer (Reference van’t Veer, Milone and Mermilliod1996), and has subsequently been confirmed by Li et al. (Reference Li, Zhang, Han, Jiang and Jiang2008) based on 130 well known W UMa systems. This is further verified by Sun et al. (Reference Sun, Chen, Deng and de Grijs2020) based on 2 335 W UMa systems(1 530 W-, 710 A-, and 95 B-type CBs) obtained from the Catalina Sky Survey (CSS). The slope of the best linear fit to our sample is
$M_{total}$
for each q bin. Moreover, both of the boundaries are better defined. There is no other discussion about the relation between the total mass and mass ratio of the eclipsing Am binaries. However, but some authors have published their results on the relation of the normal late-type contact binaries (i.e. W UMa systems). The relationship between the total mass and mass ratio of the W UMa systems was identified by van’t Veer (Reference van’t Veer, Milone and Mermilliod1996), and has subsequently been confirmed by Li et al. (Reference Li, Zhang, Han, Jiang and Jiang2008) based on 130 well known W UMa systems. This is further verified by Sun et al. (Reference Sun, Chen, Deng and de Grijs2020) based on 2 335 W UMa systems(1 530 W-, 710 A-, and 95 B-type CBs) obtained from the Catalina Sky Survey (CSS). The slope of the best linear fit to our sample is $dM_{total}/dq$
= 1.4762
$dM_{total}/dq$
= 1.4762 $\pm$
0.3723, which is larger than that of Sun et al. (Reference Sun, Chen, Deng and de Grijs2020) with a slope of 0.57
$\pm$
0.3723, which is larger than that of Sun et al. (Reference Sun, Chen, Deng and de Grijs2020) with a slope of 0.57 $\pm$
0.02.
$\pm$
0.02.
( $R_2$
/
$R_2$
/ $R_2$
_MS)-Period distribution of eclipsing Am binaries. The black dash line represents
$R_2$
_MS)-Period distribution of eclipsing Am binaries. The black dash line represents $R_2$
/
$R_2$
/ $R_2$
_MS=1.
$R_2$
_MS=1.

The relations between effective temperature T, mass M, radius R, and luminosity can help us to investigate the evolutionary stage of the systems. Fig. 20 shows the distributions of Hertzsprung-Russell (HR) diagram, the different symbols are used to help distinguish EA, EB, and EW type systems, while the orange and green colours mark the primary and the secondary component, respectively. One can see from Fig. 20 that the components of the systems are mainly around the zero-age main sequens, and some secondary components have evolved away from the main sequence. This is consistent with our statistics results in the previous work (Tian et al. 2023). The components of GW Gem and V404 Aur are also plotted in the HR diagram. The mass-luminosity relation, mass-radius relation, and mass-temperature relation of the components are shown in Fig. 21. Different colour were used to distinguish the primary and the secondary components, and different symbols were used to represent EA, EB, and EW type systems. The blue dash-lines are the corresponding empirical relationships of main sequence stars (Eker et al. Reference Eker2018). Almost all components follow the empirical relations of the main sequence quite well. For the systems with $M \gt 0.81$
M
$M \gt 0.81$
M $_\odot$
, there are good positive relations in the mass-radius distribution, the mass-luminosity distribution, and the mass-temperature distribution as follows:
$_\odot$
, there are good positive relations in the mass-radius distribution, the mass-luminosity distribution, and the mass-temperature distribution as follows:
 \begin{eqnarray} \log L=3.340(\pm0.242)\times \log M + 0.250(\pm0.061) \\[-25pt] \nonumber\end{eqnarray}
 \begin{eqnarray} \log R=0.754(\pm0.121)\times \log M + 0.144(\pm0.032) \\[-25pt] \nonumber\end{eqnarray}
 \begin{eqnarray} \log T=0.545(\pm0.045)\times \log M + 3.738(\pm0.012)\end{eqnarray}
Meanwhile, some secondary components with $M \lt 0.81$
M
$M \lt 0.81$
M $_\odot$
(i.e.
$_\odot$
(i.e. $\log {M} \lt -0.09$
M
$\log {M} \lt -0.09$
M $_\odot$
in the figure) show quite a dispersion distribution, indicating that they have evolved away from the main sequence. The components are the secondary ones of the following binaries: EW type binaries,V2364 Cyg, V1073 Cyg; EB type binaries, TYC 6408-989-1, GW Gem, V404 Aur, V2787 Ori; EA type, TX Ari, S Vel, RX Gem. Such components may have a higher evolutionary stage than their primary stars. One can see from the Fig. 21, these components appear hotter, larger, and brighter than the main-sequence stars with the same mass, consistent with the original theory of Am phenomenon (Fowler et al. Reference Fowler, Burbidge, Burbidge and Hoyle1965). According to the masses of the secondary components, the predicted main sequence radii (labeled as
$_\odot$
in the figure) show quite a dispersion distribution, indicating that they have evolved away from the main sequence. The components are the secondary ones of the following binaries: EW type binaries,V2364 Cyg, V1073 Cyg; EB type binaries, TYC 6408-989-1, GW Gem, V404 Aur, V2787 Ori; EA type, TX Ari, S Vel, RX Gem. Such components may have a higher evolutionary stage than their primary stars. One can see from the Fig. 21, these components appear hotter, larger, and brighter than the main-sequence stars with the same mass, consistent with the original theory of Am phenomenon (Fowler et al. Reference Fowler, Burbidge, Burbidge and Hoyle1965). According to the masses of the secondary components, the predicted main sequence radii (labeled as $R_2$
_MS) were obtained using the empirical relationships of main sequence stars of Eker et al. (Reference Eker2018). The (
$R_2$
_MS) were obtained using the empirical relationships of main sequence stars of Eker et al. (Reference Eker2018). The ( $R_2$
/
$R_2$
/ $R_2$
_MS)-Period distribution of the secondary components of eclipsing Am binaries is presented in Fig. 22. Some secondaries of semi-detached systems with short periods have evolved, leading to an expansion in their radius. They may has evolved through the giant phase, stripping away most of the hydrogen shell and exposing the stellar core, causing it become hotter and brighter. As a result, their location on the HR diagram will be near or within the main sequence region. The companions of Am stars often show signs of evolution and a history of mass transfer. This has led to the suggestion that the accretion processes, such as mass transfer, may be crucial for the formation of Am peculiarity in binary systems. When mass is transferred from the evolved component of Am type eclipsing binaries, it can cause chemical elements in the atmosphere of the companion stars to recombine. This may result in the presence of chemical anomalies in the composition, as observed in the well-studied marginal contact binary V1073 Cyg (Tian et al. Reference Tian, Zhu, Qian, Li and Jiang2018), V2787 Ori (Tian et al. 2019), TYC 6408-989-1 (Tian Reference Tian2021), which are lying on the thermal relaxation oscillation state.
$R_2$
_MS)-Period distribution of the secondary components of eclipsing Am binaries is presented in Fig. 22. Some secondaries of semi-detached systems with short periods have evolved, leading to an expansion in their radius. They may has evolved through the giant phase, stripping away most of the hydrogen shell and exposing the stellar core, causing it become hotter and brighter. As a result, their location on the HR diagram will be near or within the main sequence region. The companions of Am stars often show signs of evolution and a history of mass transfer. This has led to the suggestion that the accretion processes, such as mass transfer, may be crucial for the formation of Am peculiarity in binary systems. When mass is transferred from the evolved component of Am type eclipsing binaries, it can cause chemical elements in the atmosphere of the companion stars to recombine. This may result in the presence of chemical anomalies in the composition, as observed in the well-studied marginal contact binary V1073 Cyg (Tian et al. Reference Tian, Zhu, Qian, Li and Jiang2018), V2787 Ori (Tian et al. 2019), TYC 6408-989-1 (Tian Reference Tian2021), which are lying on the thermal relaxation oscillation state.
The relation of the temperature difference to the mass ratio for the eclipsing Am binaries.
The distributions and relations of $dp/dt$
versus
$dp/dt$
versus $\log {P}$
.
$\log {P}$
.

The relation of the temperature difference $\Delta T=T_1-T_2$
to the mass ratio q of the systems is shown in Fig. 23. The
$\Delta T=T_1-T_2$
to the mass ratio q of the systems is shown in Fig. 23. The $\Delta$
T-q relation of the EA type systems shows a well-linear relation:
$\Delta$
T-q relation of the EA type systems shows a well-linear relation:
 \begin{eqnarray} q = -1.457(\pm0.134)\times10^{-4}\times\Delta T +0.972(\pm0.029)\end{eqnarray}
which was shown with the red dashed line in Fig. 23, with the thin black dash lines representing the edges of the strip defined by the 5% and 95% percentiles of q for each $\Delta T$
bin. There are only very few systems with
$\Delta T$
bin. There are only very few systems with $\Delta T$
<0 K. The mass ratio has a negative correlation with the temperature difference, which means that when the components have nearly the same temperature, they will have nearly the same mass. We noticed that there are some EA type system with quite large temperature differences, up to 5 000 K.
$\Delta T$
<0 K. The mass ratio has a negative correlation with the temperature difference, which means that when the components have nearly the same temperature, they will have nearly the same mass. We noticed that there are some EA type system with quite large temperature differences, up to 5 000 K.
The rate of period change $dp/dt$
is crucial for investigating the orbital evolution of close binaries. Unfortunately, the available information on period changes in these systems is severely limited. Only 12 systems have been thoroughly studied concerning period change. The relationship between period change and the period is illustrated in Fig. 24. The period change of EA type systems shows a wide range. However, more research is needed to obtain period change information for additional systems in the future.
$dp/dt$
is crucial for investigating the orbital evolution of close binaries. Unfortunately, the available information on period changes in these systems is severely limited. Only 12 systems have been thoroughly studied concerning period change. The relationship between period change and the period is illustrated in Fig. 24. The period change of EA type systems shows a wide range. However, more research is needed to obtain period change information for additional systems in the future.
It is generally accepted that the largest equatorial rotational velocity of Am stars is about 120 $\mathrm{km\, s}^{-1}$
(Abt & Moyd Reference Abt and Moyd1973; Abt Reference Abt2000). It is assumed that the components are likely to be rotating synchronously in a circular orbit for short-period binary systems, and the possible slight ellipticity of the long-period systems has little influence. Thus, for all the system with a assuming circle orbit, the equatorial rotational velocities were estimated using the same equation mentioned above:
$\mathrm{km\, s}^{-1}$
(Abt & Moyd Reference Abt and Moyd1973; Abt Reference Abt2000). It is assumed that the components are likely to be rotating synchronously in a circular orbit for short-period binary systems, and the possible slight ellipticity of the long-period systems has little influence. Thus, for all the system with a assuming circle orbit, the equatorial rotational velocities were estimated using the same equation mentioned above: $v = 50.6(R/R_\odot)/(P/d)\,\mathrm{km\,s}^{-1}$
(Carquillat & Prieur Reference Carquillat and Prieur2007). Then the projected rotational velocities can be obtained based on the photometric solution and are listed in Table 8. The components of most eclipsing Am binaries in Table 8 exhibit slow rotation, with the rotational velocities less than 120
$v = 50.6(R/R_\odot)/(P/d)\,\mathrm{km\,s}^{-1}$
(Carquillat & Prieur Reference Carquillat and Prieur2007). Then the projected rotational velocities can be obtained based on the photometric solution and are listed in Table 8. The components of most eclipsing Am binaries in Table 8 exhibit slow rotation, with the rotational velocities less than 120 $\mathrm{km\, s}^{-1}$
. There are certain primary components with a projected rotational velocity of more than 120
$\mathrm{km\, s}^{-1}$
. There are certain primary components with a projected rotational velocity of more than 120 $\mathrm{km\, s}^{-1}$
, such as TYC 6408-989-1(
$\mathrm{km\, s}^{-1}$
, such as TYC 6408-989-1( $v_1\sin i$
= 159
$v_1\sin i$
= 159 $\mathrm{km\, s}^{-1}$
), V2364 Cyg (
$\mathrm{km\, s}^{-1}$
), V2364 Cyg ( $v_1\sin i$
=178
$v_1\sin i$
=178 $\mathrm{km\, s}^{-1}$
), GW Gem (
$\mathrm{km\, s}^{-1}$
), GW Gem ( $v_1\sin i$
= 122
$v_1\sin i$
= 122 $\mathrm{km\, s}^{-1}$
), EU Peg (
$\mathrm{km\, s}^{-1}$
), EU Peg ( $v_1\sin i$
= 148
$v_1\sin i$
= 148 $\mathrm{km\, s}^{-1}$
), V404 Aur (
$\mathrm{km\, s}^{-1}$
), V404 Aur ( $v_1\sin i$
= 130
$v_1\sin i$
= 130 $\mathrm{km\, s}^{-1}$
), V1073 Cyg (
$\mathrm{km\, s}^{-1}$
), V1073 Cyg ( $v_1$
$v_1$ $\sin i$
= 154
$\sin i$
= 154 $\mathrm{km\, s}^{-1}$
), and V2787 Ori (
$\mathrm{km\, s}^{-1}$
), and V2787 Ori ( $v_1\sin i$
= 152
$v_1\sin i$
= 152 $\mathrm{km\, s}^{-1}$
. All of targets are short-period systems with periods of less than 1 day. The targets with a short period of less than 1.2 days or with large rotational velocity are important to explore the real relationship between the Am peculiarity and the stellar rotation of Am stars.
$\mathrm{km\, s}^{-1}$
. All of targets are short-period systems with periods of less than 1 day. The targets with a short period of less than 1.2 days or with large rotational velocity are important to explore the real relationship between the Am peculiarity and the stellar rotation of Am stars.
Acknowledgements
This work is supported by the National Natural Science Foundation of China (Grant Nos. 12103030, 12303038), the Natural Science of Shandong Province (Grant No. ZR2021QA082), the Natural Science Foundation of Xinjiang Uygur Autonomous Rejion (Grant No. 2022DO1A164), the Joint Research Found (Grant No. U1831109) in Astronomy under cooperative agreement between the National Science Foundation of China (NSFC) and Chinese Academy of Sciences (CAS), and the Young Talent Project of ‘Yunnan Revitalization Talent Support Program’ and CAS ‘Light of West China’ Program. This work was partly supported by the Research Fund of Key Laboratory of Aircraft Environment Control and Life Support, MIIT, Nanjing University of Aeronautics and Astronautics(Grant No. KLAECLS minus;E minus;202203).
CCD photometric observations of the system were obtained with the 80 and 85 cm telescope at Xinglong station of National Astronomical Observatory. The spectra observation were obtained with the 2.16 m telescope at Xinglong station of National Astronomical Observatory. We acknowledge the support of the staff of the Xinglong 2.16 m, 85 cm and 80 cm telescope. This work was partially supported by the Open Project Program of the Key Laboratory of Optical Astronomy, National Astronomical Observatories, Chinese Academy of Sciences.
A. Light Minimum for V404 Aur
All available Light Minimum for V404 Aur.
Notes: ‘*’: $O-C$
gateway; ‘This study*’:light minimums obtained by us based on the TESS light curves; (1) Guarro-Flo et al. (Reference Guarro-Flo, Garcia-Melendo, Juan-Samso, Vidal-Sainz and Poch-Creixell1995) (2) Agerer & Huebscher (Reference Agerer and Huebscher1997) (3) Agerer & Huebscher (Reference Agerer and Huebscher1998) (4) Agerer & Hubscher (Reference Agerer and Hubscher1999) (5) Agerer & Hubscher (Reference Agerer and Hubscher2000) (6) Diethelm (Reference Diethelm2005) (7) Nelson (Reference Nelson2007) (8) Hubscher (Reference Hubscher2007) (9) Hubscher et al. (Reference Hubscher, Steinbach and Walter2009) (10) Nelson (Reference Nelson2008) (11) Diethelm (Reference Diethelm2009) (12) Hubscher et al. (Reference Hubscher, Lehmann and Walter2012) (13) Brat et al. (Reference Brat2011) (14) Diethelm (Reference Diethelm2011) (15) Hoňková et al. (2013) (16) Honková et al. (Reference Honková2014) (17) Hubscher (Reference Hubscher2015) (18) Juryšek et al. (Reference Juryšek2017) (19) Hubscher (Reference Hubscher2017) (20) Lehký et al. (Reference Lehký2021).
$O-C$
gateway; ‘This study*’:light minimums obtained by us based on the TESS light curves; (1) Guarro-Flo et al. (Reference Guarro-Flo, Garcia-Melendo, Juan-Samso, Vidal-Sainz and Poch-Creixell1995) (2) Agerer & Huebscher (Reference Agerer and Huebscher1997) (3) Agerer & Huebscher (Reference Agerer and Huebscher1998) (4) Agerer & Hubscher (Reference Agerer and Hubscher1999) (5) Agerer & Hubscher (Reference Agerer and Hubscher2000) (6) Diethelm (Reference Diethelm2005) (7) Nelson (Reference Nelson2007) (8) Hubscher (Reference Hubscher2007) (9) Hubscher et al. (Reference Hubscher, Steinbach and Walter2009) (10) Nelson (Reference Nelson2008) (11) Diethelm (Reference Diethelm2009) (12) Hubscher et al. (Reference Hubscher, Lehmann and Walter2012) (13) Brat et al. (Reference Brat2011) (14) Diethelm (Reference Diethelm2011) (15) Hoňková et al. (2013) (16) Honková et al. (Reference Honková2014) (17) Hubscher (Reference Hubscher2015) (18) Juryšek et al. (Reference Juryšek2017) (19) Hubscher (Reference Hubscher2017) (20) Lehký et al. (Reference Lehký2021).
B. Light Minimum for GW GEM
All available Light Minimum for GW Gem.
Notes: ‘*’: $O-C$
gateway; ‘This study*’:light minimums obtained by us based on the TESS light curves; (1) Rudiger (Reference Rudiger1983) (2) Kippenhahn (Reference Kippenhahn1953) (3) Diethelm et al. (Reference Diethelm, Germann, Locher, Peter, Wittwer, Forster and Morger1974) (4) Carnevali et al. (Reference Carnevali1975) (5) Agnesoni et al. (Reference Agnesoni1978) (6) Locher (Reference Locher1979) (7) Agnesoni et al. (Reference Agnesoni1980) (8) Diethelm et al. (Reference Diethelm1983a) (9) Diethelm et al. (Reference Diethelm1983b) (10) Andrakakou et al. (Reference Andrakakou1983) (11) Nelson (Reference Nelson2001) (12) Nelson (Reference Nelson2003) (13) Dvorak (Reference Dvorak2003) (14) Hubscher (Reference Hubscher2007) (15) Hubscher et al. (Reference Hubscher, Steinbach and Walter2009) (16) Ogloza et al. (Reference Ogloza, Niewiadomski, Barnacka, Biskup, Malek and Sokolowski2008) (17) Hubscher et al. (Reference Hubscher, Steinbach and Walter2009) (18) Nelson (Reference Nelson2009) (19) Brat et al. (Reference Brat2009) (20) Brat et al. (Reference Brat2011) (21) Hubscher (Reference Hubscher2014) (22) Hubscher & Lehmann (Reference Hubscher and Lehmann2015) (23) Hubscher (Reference Hubscher2016).
$O-C$
gateway; ‘This study*’:light minimums obtained by us based on the TESS light curves; (1) Rudiger (Reference Rudiger1983) (2) Kippenhahn (Reference Kippenhahn1953) (3) Diethelm et al. (Reference Diethelm, Germann, Locher, Peter, Wittwer, Forster and Morger1974) (4) Carnevali et al. (Reference Carnevali1975) (5) Agnesoni et al. (Reference Agnesoni1978) (6) Locher (Reference Locher1979) (7) Agnesoni et al. (Reference Agnesoni1980) (8) Diethelm et al. (Reference Diethelm1983a) (9) Diethelm et al. (Reference Diethelm1983b) (10) Andrakakou et al. (Reference Andrakakou1983) (11) Nelson (Reference Nelson2001) (12) Nelson (Reference Nelson2003) (13) Dvorak (Reference Dvorak2003) (14) Hubscher (Reference Hubscher2007) (15) Hubscher et al. (Reference Hubscher, Steinbach and Walter2009) (16) Ogloza et al. (Reference Ogloza, Niewiadomski, Barnacka, Biskup, Malek and Sokolowski2008) (17) Hubscher et al. (Reference Hubscher, Steinbach and Walter2009) (18) Nelson (Reference Nelson2009) (19) Brat et al. (Reference Brat2009) (20) Brat et al. (Reference Brat2011) (21) Hubscher (Reference Hubscher2014) (22) Hubscher & Lehmann (Reference Hubscher and Lehmann2015) (23) Hubscher (Reference Hubscher2016).
C. Physical parameters of the eclipsing binaries
Physical parameters of the eclipsing binaries.
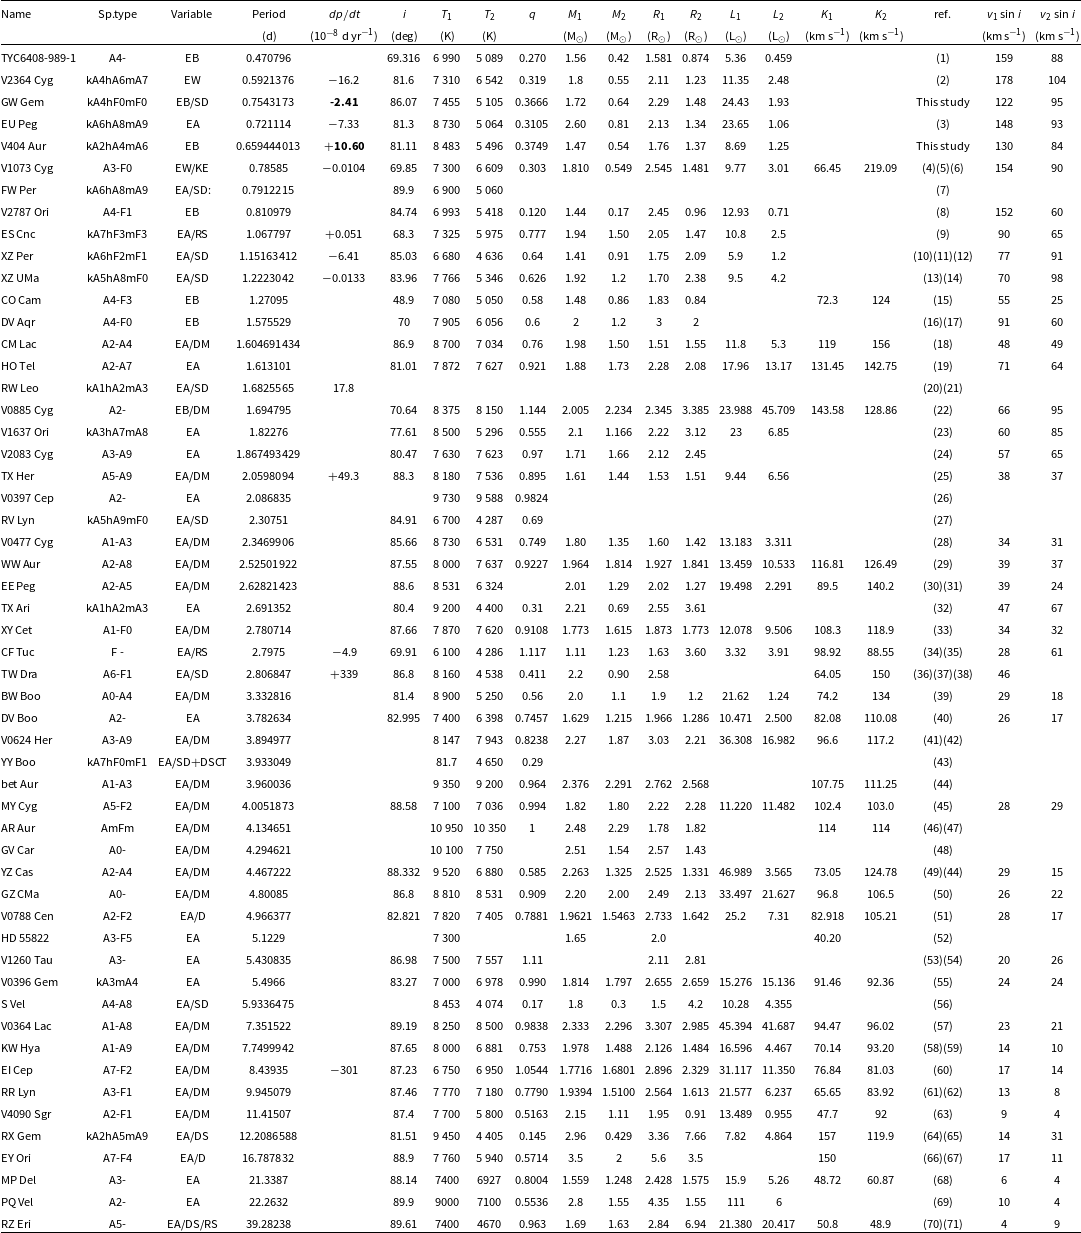
Notes: (1) Tian (Reference Tian2021) (2) Yuan et al. (Reference Yuan, Jiang, Dai, Wang and Yang2020) (3) Yang et al. (Reference Yang, Yuan, Dai and Zhang2018) (4) Pribulla et al. (Reference Pribulla2006) (5) Ekmekçi et al. (Reference Ekmekçi2012) (6) Tian et al. (Reference Tian, Zhu, Qian, Li and Jiang2018) (7) Zasche (Reference Zasche2015) (8) Tian et al. (2019) (9) Yakut et al. (Reference Yakut2009) (10) Qian (Reference Qian2001) (11) Michaels (Reference Michaels2017) (12) Khaliullina (Reference Khaliullina2021) (13) Nelson et al. (Reference Nelson, Terrell and Gross2006) (14) Soydugan et al. (2011) (15) Kurtz et al. (Reference Kurtz2020) (16) Okazaki et al. (Reference Okazaki, Yamasaki, Nurwendaya and Malasan1985) (17) Polubek (Reference Polubek2001) (18) Liakos & Niarchos (Reference Liakos and Niarchos2012) (19) Sürgit et al. (Reference Sürgit, Erdem, Engelbrecht, van Heerden and Manick2017) (20)Qian (Reference Qian2003) (21) Liao & Qian (Reference Liao and Qian2010) (22) Lacy et al. (Reference Lacy, Vaz, Claret and Sabby2004) (23) Ulaş et al. (2022) (24)Zasche et al. (Reference Zasche, Svoboda and Šlechta2012) (25) Zhu et al. (Reference Zhu, Tian, Zhou, Li and Wang2019) (26) Bulut et al. (Reference Bulut2005) (27) Zasche (Reference Zasche2017) (28) De $\check{g}$
irmenci et al. (2003) (29) Southworth et al. (Reference Southworth, Smalley, Maxted, Claret and Etzel2005) (30) Linnell et al. (Reference Linnell, Hubeny and Lacy1995) (31) Popper (Reference Popper1981) (32) Bakış et al.Bak (2022) (33) Southworth et al. (Reference Southworth, Pavlovski, Tamajo, Smalley, West and Anderson2011) (34) Do
$\check{g}$
irmenci et al. (2003) (29) Southworth et al. (Reference Southworth, Smalley, Maxted, Claret and Etzel2005) (30) Linnell et al. (Reference Linnell, Hubeny and Lacy1995) (31) Popper (Reference Popper1981) (32) Bakış et al.Bak (2022) (33) Southworth et al. (Reference Southworth, Pavlovski, Tamajo, Smalley, West and Anderson2011) (34) Do $\check{g}$
ru et al. (2009) (35) Jableka et al. (Reference Jableka, Zola, Zakrzewski, Szymanski, Kuzmicz, de Villiers, Zejda and Koziel-Wierzbowska2012) (36)Tkachenko et al. (Reference Tkachenko, Lehmann and Mkrtichian2010) (37) Liao et al. (Reference Liao, Qian, Zejda, Zhu and Li2016) (38) Chaplin (2019) (39) Glazunova (Reference Glazunova2011) (40) Kahraman Aliçavuş & Aliçavuş (2020) (41) Popper (Reference Popper1984) (42) Zasche et al. (2020) (43) Hambsch et al. (Reference Hambsch, Lampens, van Cauteren, Kleidis, Robertson, Krajci and Wils2010) (44) Takeda et al. (Reference Takeda, Han, Kang, Lee and Kim2019) (45) Tucker et al. (Reference Tucker, Sowell, Williamon and Coughlin2009) (46) Rachkovskaia (Reference Rachkovskaia1985) (47) Zverko et al. (Reference Zverko, Ziznovsky and Khokhlova1997) (48) Southworth & Clausen (Reference Southworth and Clausen2006) (49) Pavlovski et al. (Reference Pavlovski, Southworth, Kolbas and Smalley2014) (50) Popper et al. (Reference Popper, Andersen, Clausen and Nordstrom1985) (51) Graczyk et al. (Reference Graczyk2022) (52) Carquillat et al. (Reference Carquillat, Ginestet, Prieur and Debernardi2003) (53) Smalley et al. (Reference Smalley2014) (54) Bulut (Reference Bulut2022) (55) Yücel & BakışYücel & Bak (2022) (56) Garc a et al. (1990) (57) Torres et al. (Reference Torres1999) (58) Andersen & Vaz (Reference Andersen and Vaz1984) (59) Gallenne et al. (Reference Gallenne2019) (60) Torres et al. (Reference Torres, Andersen, Nordström and Latham2000) (61) Khaliullin & Khaliullina (Reference Khaliullin and Khaliullina2002) (62) Southworth (Reference Southworth2021) (63) Gallenne et al. (Reference Gallenne2019) (64) Glazunova et al. (Reference Glazunova, Yushchenko, Tsymbal, Mkrtichian, Lee, Kang, Valyavin and Lee2008) (65) Olson & Etzel (Reference Olson and Etzel2015) (66) Ismailov (Reference Ismailov1987) (67) Zakirov (Reference Zakirov1998) (68) Ibano
$\check{g}$
ru et al. (2009) (35) Jableka et al. (Reference Jableka, Zola, Zakrzewski, Szymanski, Kuzmicz, de Villiers, Zejda and Koziel-Wierzbowska2012) (36)Tkachenko et al. (Reference Tkachenko, Lehmann and Mkrtichian2010) (37) Liao et al. (Reference Liao, Qian, Zejda, Zhu and Li2016) (38) Chaplin (2019) (39) Glazunova (Reference Glazunova2011) (40) Kahraman Aliçavuş & Aliçavuş (2020) (41) Popper (Reference Popper1984) (42) Zasche et al. (2020) (43) Hambsch et al. (Reference Hambsch, Lampens, van Cauteren, Kleidis, Robertson, Krajci and Wils2010) (44) Takeda et al. (Reference Takeda, Han, Kang, Lee and Kim2019) (45) Tucker et al. (Reference Tucker, Sowell, Williamon and Coughlin2009) (46) Rachkovskaia (Reference Rachkovskaia1985) (47) Zverko et al. (Reference Zverko, Ziznovsky and Khokhlova1997) (48) Southworth & Clausen (Reference Southworth and Clausen2006) (49) Pavlovski et al. (Reference Pavlovski, Southworth, Kolbas and Smalley2014) (50) Popper et al. (Reference Popper, Andersen, Clausen and Nordstrom1985) (51) Graczyk et al. (Reference Graczyk2022) (52) Carquillat et al. (Reference Carquillat, Ginestet, Prieur and Debernardi2003) (53) Smalley et al. (Reference Smalley2014) (54) Bulut (Reference Bulut2022) (55) Yücel & BakışYücel & Bak (2022) (56) Garc a et al. (1990) (57) Torres et al. (Reference Torres1999) (58) Andersen & Vaz (Reference Andersen and Vaz1984) (59) Gallenne et al. (Reference Gallenne2019) (60) Torres et al. (Reference Torres, Andersen, Nordström and Latham2000) (61) Khaliullin & Khaliullina (Reference Khaliullin and Khaliullina2002) (62) Southworth (Reference Southworth2021) (63) Gallenne et al. (Reference Gallenne2019) (64) Glazunova et al. (Reference Glazunova, Yushchenko, Tsymbal, Mkrtichian, Lee, Kang, Valyavin and Lee2008) (65) Olson & Etzel (Reference Olson and Etzel2015) (66) Ismailov (Reference Ismailov1987) (67) Zakirov (Reference Zakirov1998) (68) Ibano $\check{g}$
lu et al. (2008) (69) Hauck (Reference Hauck2011) (70) Popper (Reference Popper1988) (71) Vivekananda Rao et al. (Reference Vivekananda Rao, Sarma and Prakash Rao1994).
$\check{g}$
lu et al. (2008) (69) Hauck (Reference Hauck2011) (70) Popper (Reference Popper1988) (71) Vivekananda Rao et al. (Reference Vivekananda Rao, Sarma and Prakash Rao1994).


 Open access