


Introduction
Conservation programmes and restoration plans often map out strategies that include the reintroduction of locally extinct species via translocation (Parker Reference Parker2008). Conservation translocations are a vital tool for management of both endangered species and of recovering ecosystems because re-establishment of populations of threatened species enhances biodiversity and therefore helps to maintain broader level ecosystem functions and processes (Schlapfer and Schmid Reference Schlapfer and Schmid1999, Benayas et al. Reference Benayas, Newton, Diaz and Bullock2009). Translocation now has a proven track record as an effective tool for both the management of individual species and the restoration of ecosystems (Armstrong and McLean Reference Armstrong and McLean1995, Parker Reference Parker2008, Seddon et al. Reference Seddon, Griffiths, Soorae and Armstrong2014). Despite the many successes, a high proportion of translocations fail to establish viable populations or reach the population size goals set by managers at the outset (Griffith et al. Reference Griffith, Michael Scott, Carpenter and Reed1989, Wolf et al. Reference Wolf, Garland and Griffith1998, Fischer and Lindenmayer Reference Fischer and Lindenmayer2000, Oro et al. Reference Oro, Martinez-Abrain, Villuendas, Sarzo, Minguez, Carda and Genovart2011, Ebrahimi et al. Reference Ebrahimi, Ebrahemie and Bull2015).
Whereas multiple individual factors will contribute to the outcome of a translocation, transfer-related mortality (i.e. loss of life as a direct result of the capture/transfer/release processes) has a significant negative impact on potential population establishment as any reduction in the number of initial founders reduces the likelihood of population persistence (Griffith et al. Reference Griffith, Michael Scott, Carpenter and Reed1989). The capture and holding phases of a translocation are known to cause moderate to high levels of stress for most translocated individuals (Groombridge et al. Reference Groombridge, Massey, Bruch, Malcolm, Brosius, Okada and Sparklin2004, Dickens et al. Reference Dickens, Delehanty and Romero2009, Adams et al. Reference Adams, Parker, Cockrem, Brunton and Candy2010, Parker et al. Reference Parker, Dickens, Clarke, Lovegrove, Ewen, Armstrong, Parker and Seddon2011) and the cumulative effects of stress can lead to reduced immune defence (McEwen Reference McEwen1998), and metabolic or behavioural crises (Dickens et al. Reference Dickens, Delehanty and Romero2009, Reference Dickens, Delehanty and Romero2010). The use of inappropriate capture, holding or release methodologies can exacerbate this problem (Parker et al. Reference Parker, Dickens, Clarke, Lovegrove, Ewen, Armstrong, Parker and Seddon2011), leading to high transfer-related mortality. Unfortunately, the species-specific methods and outcomes of many translocation attempts are not published (Parker et al. Reference Parker, Dickens, Clarke, Lovegrove, Ewen, Armstrong, Parker and Seddon2011), consequently reintroduction biologists have been emphasising the need for publication of both methods and results of translocations, regardless of the (positive or negative) outcome (Sutherland et al. Reference Sutherland, Pullin, Dolman and Knight2004, Seddon et al. Reference Seddon, Armstrong and Maloney2007, Armstrong and Seddon Reference Armstrong and Seddon2008, Parker et al. Reference Parker, Dickens, Clarke, Lovegrove, Ewen, Armstrong, Parker and Seddon2011).
The immediate post-release period (i.e. the establishment phase) produces its own set of stressors. Post-release effects could include ongoing chronic stress following transport and release (Dickens et al. Reference Dickens, Delehanty and Romero2010, Parker et al. Reference Parker, Dickens, Clarke, Lovegrove, Ewen, Armstrong, Parker and Seddon2011), stress associated with the arrival in novel environments (Dickens et al. Reference Dickens, Delehanty and Romero2009), and/or novel social interactions (Tavecchia et al. Reference Tavecchia, Viedma, Martinez-Abrain, Bartolome, Gomez and Oro2009), as well as Allee effects resulting from establishing populations at small initial sizes (Deredec and Courchamp Reference Deredec and Courchamp2007). These post-release stressors could also be compounded by initial responses to ongoing negative impacts such as inadequacies in the available resources (Armstrong et al. Reference Armstrong, Castro and Griffiths2007, Bouzat et al. Reference Bouzat, Johnson, Toepfer, Simpson, Esker and Westemeier2009), local competition (either intraspecific or interspecific) (Griffith et al. Reference Griffith, Michael Scott, Carpenter and Reed1989), or predation (Lovegrove Reference Lovegrove1996; Fischer and Lindenmayer Reference Fischer and Lindenmayer2000). Losses during establishment are common and can further reduce the number of founders available to contribute to population growth and persistence (Lloyd and Powlesland Reference Lloyd and Powlesland1994, Mumme and Below Reference Mumme and Below1999, Reinert and Rupert Reference Reinert and Rupert1999).
Small populations are susceptible to the effects of inbreeding, demographic stochasticity and environmental stochasticity (Jamieson et al. Reference Jamieson, Tracy, Fletcher and Armstrong2007, Jamieson Reference Jamieson2011, Armstrong and Reynolds Reference Armstrong, Reynolds, Ewen, Armstrong, Parker and Seddon2012), therefore the long-term viability of small founder populations is not assured. Reintroduction biologists advocate decision-making based on reliable and appropriate data collection, and robust modelling of population growth parameters (Armstrong and Reynolds Reference Armstrong, Reynolds, Ewen, Armstrong, Parker and Seddon2012). Modelling procedures can be used to address many specific management options, including requirements for supplementary transfers (e.g. Armstrong and Ewen Reference Armstrong and Ewen2001), predator control (Armstrong and Davidson Reference Armstrong and Davidson2006; Armstrong et al. Reference Armstrong, Raeburn, Lewis and Ravine2006), and nest site or supplementary food provisioning (e.g. Armstrong et al. Reference Armstrong, Davidson, Dimond, Perrott, Castro, Ewen, Griffiths and Taylor2002, Reference Armstrong, Castro and Griffiths2007). Monitoring and modelling of vital rates, including survival and reproduction, both during and following the establishment phase, is crucial for accurate reporting on the outcome of translocations, particularly for small establishing populations (Armstrong et al. Reference Armstrong, Raeburn, Lewis and Ravine2006, Armstrong and Reynolds Reference Armstrong, Reynolds, Ewen, Armstrong, Parker and Seddon2012, Nichols and Armstrong Reference Nichols, Armstrong, Ewen, Armstrong, Parker and Seddon2012).
This study reports on the transfer design and establishment of the first translocation of the North Island subspecies of an endemic New Zealand passerine, the Rifleman (Acanthisitta chloris granti). The Rifleman (Acanthisitta chloris) is one of only two remaining species within the ancient New Zealand wren family (Acanthisittidae) (Sibley and Ahlquist Reference Sibley and Ahlquist1990). Whereas the family originally consisted of seven species, five are now extinct. Both the North Island and South Island subspecies of Rifleman have been described as locally common. However, decreasing population sizes and increasing population fragmentation mean that the North Island subspecies is becoming increasingly threatened (Robertson et al. Reference Robertson, Hyvonen, Fraser and Pickard2007). It is almost extinct throughout large areas of the North Island, and is now described as locally threatened or extinct in some regions (Robertson and Heather Reference Robertson and Heather1999). With decreasing habitat and the presence of pest species causing significant impacts on declining numbers of individuals (Clout and Gaze Reference Clout and Gaze1984, Lovegrove Reference Lovegrove1996, Holdaway Reference Holdaway and MacPhee1999), conservation sites where intensive pest control and retention and restoration of native environments occurs are integral to the long-term survival of the subspecies. As the Rifleman occupies an important ecosystem niche as the smallest native insectivore (5–8 g) (Higgins et al. Reference Higgins, Jin and Steele2001), reintroduction efforts are considered important in addressing both species persistence and ecosystem function.
In 2003, the first translocation of South Island Rifleman Acanthisitta chloris chloris moved a small population from Codfish Island to the mammalian predator-free Ulva Island near Stewart Island. This translocation experienced high mortality during transfer, but the project was successful in establishing a continually viable breeding population, and provided several key recommendations regarding future transfer methodology for the rifleman species (Leech et al. Reference Leech, Craig, Beaven, Mitchell and Seddon2007). In particular, Leech et al. (Reference Leech, Craig, Beaven, Mitchell and Seddon2007) recommended reduced holding times, the separation of individuals from different family groups, and the supply of food and water during holding. In 2008, a privately funded and managed mainland (i.e. non-insular) sanctuary was approved as a recipient site for the first translocation of the North Island Rifleman, providing an opportunity to apply the recommendations provided by Leech et al. (Reference Leech, Craig, Beaven, Mitchell and Seddon2007). Following three translocations from 2008 to 2010, we investigated whether implementation of these recommendations resulted in the anticipated reduced transfer-related mortality. We report on the revised transfer methodology, details of the monitoring and its outcome, and provide a quantitative assessment of the population’s medium-term viability.
Methods
Study area
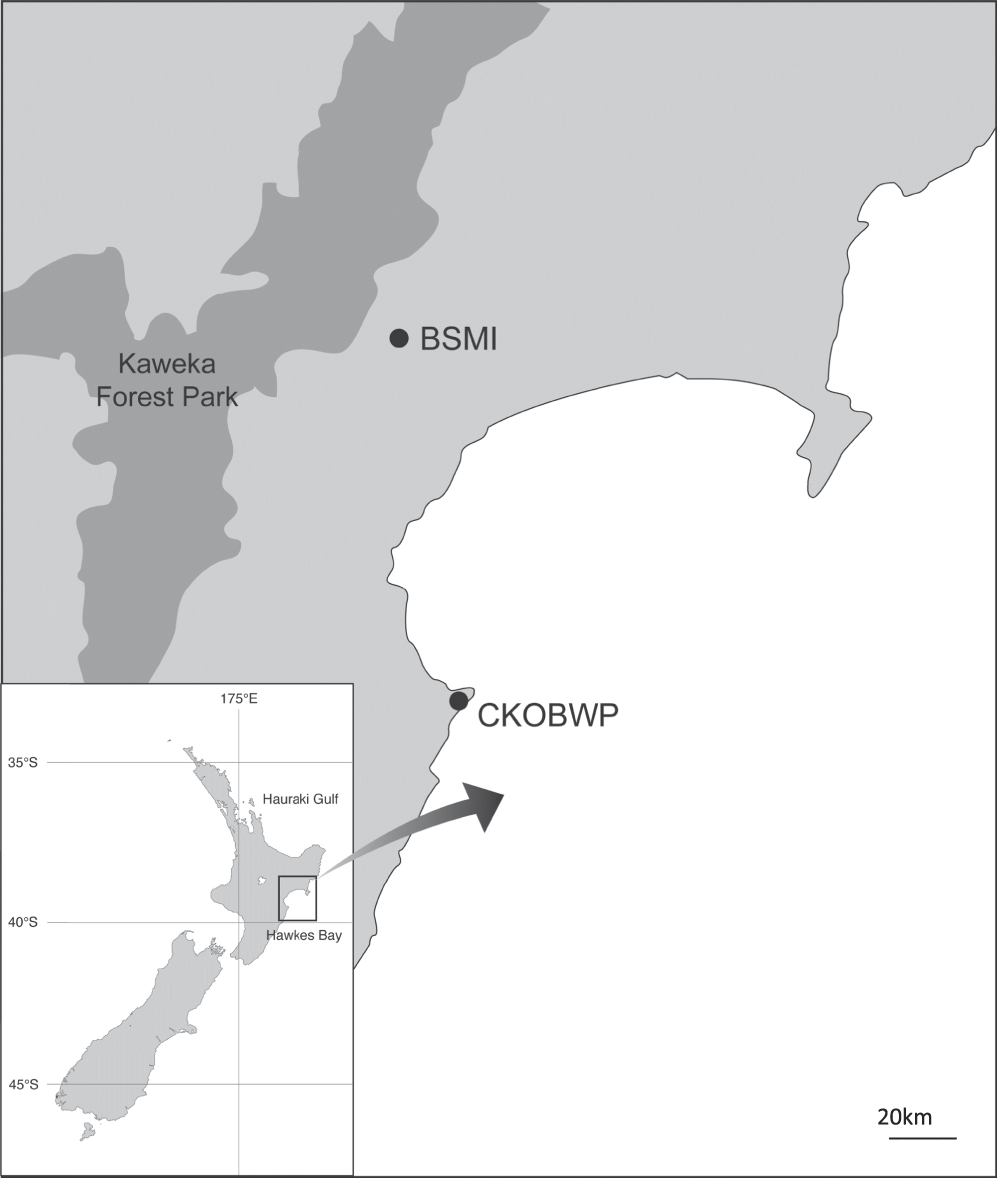
The source site for translocation was the Boundary Stream Mainland Island (BSMI), located within the Maungaharuru range within the Eastern ranges of the North Island of New Zealand (39°06’S, 176°48’E). BSMI is an 800-ha block of native forest that has been managed as a ‘mainland island’ site (i.e. a defined area typically protected by intensive invasive-mammal management) by the New Zealand Department of Conservation (DOC) since 1996. The site was selected as the most appropriate source location for two reasons; firstly, Rifleman occur at high densities within the intensively managed site and the source population was predicted to recover in numbers swiftly after removal of the translocated birds. Secondly, the reserve is in close geographic proximity to the Cape Kidnappers peninsula, resulting in ease of physical access to, and familiarity with the area by catchers, and shorter transportation times.
The recipient site was the Cape Kidnappers and Ocean Beach Wildlife Preserve (CKOBWP), located on the Cape Kidnappers peninsula in the Hawke’s Bay region of the North island of New Zealand, approximately 50 km south-east of BSMI (39°40’S, 177°02’E) (Figure 1). CKOBWP is a privately-funded conservation initiative on private land that aims to restore the peninsula with native flora and fauna characteristic of the region’s coastal system. Management of the site includes extensive mammalian pest control through trapping and poisoning, the maintenance of a 9.6-km predator-proof fence which spans the neck of the peninsula, and intensive reforestation efforts. A restoration plan has been developed to guide the reintroduction of native species to the peninsula, and the Rifleman was identified as one of four non-endangered endemic forest bird species absent from the area when the project began in 2007. Rifleman are considered likely to have once been present within the vegetated areas of the peninsula but have been absent for an unknown period of time, most likely as a result of predation and deforestation. As Rifleman are considered poor dispersers, it was also deemed unlikely that they would naturally recolonise the forested areas of the peninsula, despite the presence of wooded tracts of habitat, the reforestation effort, and the newly established maintenance of low mammalian predator numbers.
Location of source (Boundary Stream Mainland Island/BSMI) and recipient (Cape Kidnappers Preserve/CKOBWP) sites of the Rifleman translocation.
Before release, 130 artificial Rifleman nest-boxes were installed throughout the core area of the preserve where the birds were to be released and were expected to settle. The nest-box design was based on that of Gray (Reference Gray1969) and Sherley (Reference Sherley1994), and was known to be used by other populations of Rifleman.
Translocation methodology
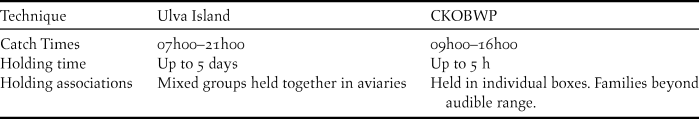
One week before catching, Rifleman calls were recorded from the source site for use as a lure during catching. Recorded calls were amplified using the program Audacity (Sourceforge.net) and edited into digital sound tracks for playback. Rifleman were targeted for capture during 28–31 January, 7–21 February and 20–23 September 2008. A supplementary transfer was carried out in February 2010 using the same source and recipient locations. Rifleman were caught only on fine days and during daylight between 09h00 and 16h00. Several 25-mm gauge mist nets were positioned in known territories and playback of local Rifleman calls was used to lure Rifleman into the nets. Captured individuals were placed in black cotton holding bags and taken to a central processing site where they were physically examined, banded, weighed, and visually sexed from their dichromatic plumage, before being placed into individual small (210 mm x 150 mm x 150 mm) plywood holding/transfer boxes. The presence of juvenile plumage was also noted. Boxes were ventilated with small holes and contained perches, food, and water. Meal worms were provided ad libitum as a food source during transfer. Following recommendations from Leech et al. (Reference Leech, Craig, Beaven, Mitchell and Seddon2007), only one Rifleman was placed into each holding box and only Rifleman from the same family group were held within calling distance of each other (Table 1). Also following the recommendations of Leech et al. (Reference Leech, Craig, Beaven, Mitchell and Seddon2007), and with permission from a certified veterinarian, Rifleman were not disease screened during the transfer process to avoid prolonged handling and associated stress.
Comparison of translocation strategies/methods used for the Ulva Island Rifleman translocation compared to the CKOBWP translocation. Data for Ulva Island are given in Leech et al. Reference Leech, Craig, Beaven, Mitchell and Seddon2007
All Rifleman were transported and released on the same day of capture and time from capture to release did not exceed five hours. Water bowls were removed from boxes prior to transfer. Rifleman were either flown by helicopter to the release site (transfer time approximately 20 min) or were driven to the site by vehicle (transfer time approximately two hours). Three release sites connected by contiguous habitat were used (located a maximum of 1.5 km apart). Releases took place no later than 16h00 to allow birds to settle and feed before nightfall.
Post-release population establishment and persistence
The forested area surrounding the release site was surveyed once each breeding season for three years following the initial release. Surveys involved walking along the tracks and lines cut for predator control access that span the preserve in a grid structure, and playing lure calls at regular intervals of 50 m. Any individuals heard or seen were followed and identified from their coloured leg bands; general home range locations, breeding partners, and nest locations were also identified. No individuals recorded as absent in one breeding were detected as present in a subsequent breeding season. We therefore assumed detection probability to be 100%; individuals not recorded were assumed to have died or dispersed outside the preserve.
Most females identified during surveys were subsequently monitored throughout the breeding season, allowing reproductive success to be estimated by detecting juveniles from their calls, which are loud and distinct (Higgins et al. Reference Higgins, Jin and Steele2001). As juveniles do not reach independence until up to five weeks following fledging (Sherley Reference Sherley1994), and remain in close contact with parents before independence (Sherley Reference Sherley1994, Higgins et al. Reference Higgins, Jin and Steele2001), we were confident that observations of juvenile numbers were an accurate indicator of reproductive success. Fledglings are distinguishable from adults based on the speckling on the breast (Higgins et al. Reference Higgins, Jin and Steele2001). Nest-boxes were checked each breeding season to assist in the detection of active nests.
Population modelling
We analysed the population data using an integrated approach in which survival, reproduction, and population dynamics were modelled simultaneously within a Bayesian hierarchical framework. The main advantage of this approach is that uncertainty in parameter estimation is automatically propagated into population projections (Besbeas et al. Reference Besbeas, Freeman and Morgan2005, Barker et al. Reference Barker, Schofield, Armstrong, Davidson, Thomson, Cooch and Conroy2009, Kéry and Schaub Reference Kéry and Schaub2012), meaning the precision of those projections accurately reflects the limitations of the data. The code was written in OpenBUGS (Spiegelhalter et al. Reference Spiegelhalter, Thomas, Best and Lunn2003, Lunn et al. Reference Lunn, Spiegelhalter, Thomas and Best2009).
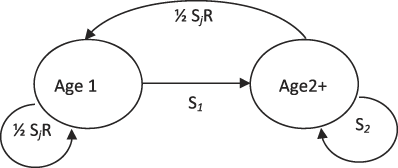
We used a two-stage female-only model with a pre-breeding census (Figure 2). This model had four parameters: annual survival probability of first-year adults (S 1), annual survival probability of older adults (S 2), mean number of young fledged per female per year (R), and probability of a juvenile surviving to the next breeding season (S j). The recruits were assumed to have a 50% probability of being female, with the sexes assumed to have equal survival probabilities. This model structure reflected prior knowledge of the species’ life history, including data showing low survival after the first year (Sherley Reference Sherley1985, Reference Sherley1993).
Life cycle modelling diagram for the female-only population model used for North Island Rifleman reintroduced to CKOBWP. S1 and S2 are the annual survival probabilities of a first-year adult and older adult respectively, R is the mean number of young fledged per female, and Sj is the probability of a fledgling surviving to the next breeding season.
Adult survival probabilities were estimated from surveys conducted in each of the first three breeding seasons, with birds included in the data set only if they survived to the first breeding season. We modelled survival using the state-space formulation of the Cormack-Jolly-Seber model (Kéry and Schaub Reference Kéry and Schaub2012) but found that we needed to assume 100% detection for all parameters to be estimated well (this was a reasonable assumption; see above). Age classes (first-year or older) were known in most cases, but in the first breeding season were known only for two females that had had juvenile plumage at the time of release. Consequently, the unknown age classes were modelled as missing values (Carpenter and Kenward Reference Carpenter and Kenward2013). The mean number of juveniles per female was estimated by sampling the numbers of young fledged by each monitored female each year from a Poisson distribution. Juvenile survival was modelled by sampling the number of recruits found in the second and third breeding seasons from binomial distributions, where the number of trials was the total number of juveniles produced in the previous season. However, because two females were not monitored in the second season, the total included missing values sampled for these two females. In addition, it was unclear whether unbanded birds found in the third season were recruits or surviving unbanded adults from the second season, so this uncertainty was also modelled.
We derived the population’s finite rate of increase (λ) from the 2 x 2 Leslie matrix
 $$\left[ {\matrix{ f & f \cr {{S_1}} & {{S_2}} \cr} } \right],$$
where  $f = {1 \!\left/{\vphantom{1 2}}\right.2}{S_j}R$ . Solving for λ under a stable age distribution gives
 $${\lambda _s} = {{f + {s_2} + \sqrt {{{\left( {f{}_1 - {s_2}} \right)}^2}} + 4f{s_1}} \over 2}.$$
 We simultaneously obtained probability distributions for the projected number of females for 10 years after translocation, and these incorporated demographic stochasticity as well as parameter uncertainty. Demographic stochasticity in reproduction was simulated by sampling the numbers of young fledged each year from Poisson distributions with mean RN t, where N t is the number of females, and demographic stochasticity in survival and sex allocation were simulated by sampling the numbers of second-year adults, older adults, and female recruits from binomial distributions with probabilities S 1, S 2 and  ${\rm{\raise.5ex\hbox{$\scriptstyle 1$}\kern-.1em/ \kern-.15em\lower.25ex\hbox{$\scriptstyle 2$} }}$S j respectively. We used uninformative priors for all parameters and based posterior distributions on 10,000 samples after discarding a burn-in of 1,000 samples.
Results
Capture, transfer and release
A total of 86 Rifleman were caught during the 2008 (46) and 2010 (40) translocations (Table 2). Of these, 38 (21 males, 14 females, three unknown sex) were transferred in late January/early February 2008, 8 (five males, three females) were transferred in September 2008, and 40 (15 males, seven females, 18 unknown sex) were transferred in February 2010 (Table 2). Most had adult plumage when captured, indicating they were over three months of age; in turn, five males and three females were judged to have juvenile plumage. All transferred Rifleman were within the normal weight range (Higgins et al. Reference Higgins, Jin and Steele2001), with females on average 6.7 ± 0.8 g and males 6.1 ± 0.8 g. All individuals survived capture and handling. Three individuals are considered to have died due to the transfer process. One individual did not survive the transfer and was found dead in the transfer box upon arrival, presumably from stress associated with handling and holding. An additional bird died shortly after arrival at the release site while still in the transfer box, and this death is also considered a result of the transfer. One individual was released alive but found dead several hours later and is considered to have died as a result of tail feather loss during capture and handling. All other individuals survived the transfer, regardless of the method of transportation (helicopter or vehicle). However, individuals that were transported via helicopter were noticeably more alert and dispersed from boxes in a faster timeframe than those moved by vehicle. Food was an important resource during transfer, as some birds consumed all available food supplied to them (although this was not the case for all individuals, regardless of the mode of transportation).
Number of mortalities (% in parentheses) at different stages of the translocation process for the Ulva Island and CKOBWP Rifleman translocations. Data for Ulva Island are given in Leech et al. Reference Leech, Craig, Beaven, Mitchell and Seddon2007. CKOBWP results are separated according to translocation date on the bottom line (2008/2010).

Post-release establishment
Eleven of the 44 (25%) individuals successfully released in 2008 were found in the preserve in the first (2008–2009) breeding season, comprising six males and five females. Seven of the 39 birds (18%) transferred in 2010 were found in the following breeding season. Therefore, 22% of the birds remained in the preserve and survived from the transfer process up to their first local breeding season, assuming 100% detection.
Dispersal and pair associations
Following release, individuals settled into territories within 500 m of the release sites. Founders appeared to have paired by the first breeding season, and all detected individuals were found in breeding units, typically consisting of one male and one female. One male appeared to be associating with two different females within the same area early in the first breeding season, but was not seen later in the season and is not considered to have contributed to the breeding population. Four breeding territories were located in both the first (2008–2009) and the second (2009–2010) seasons. Seven breeding territories were located in the third (2010–2011) season. Individuals appeared to maintain pair bonds throughout the winter, breeding with the same partner in subsequent breeding seasons, unless that partner disappeared. Offspring also appeared to establish territories with boundaries adjacent to the release site and to currently occupied territories, although a single male established a territory alone at a distance of 1.7 km from all other territories. Offspring born at the release site were observed to pair and establish territories almost immediately following independence. In the third season only one of the seven pairs located consisted of two first-year birds, whereas three first-year birds paired and bred with founders.
Survival and reproduction
Of the 11 birds (three first-year, eight age unknown) found in the first breeding season, six were found in the second breeding season, and two of these found in the third breeding season. These data gave estimated survival probabilities of 0.56 (SE 0.12) and 0.39 (SE 0.11) for first-year and older adults, respectively.
The four pairs with monitored breeding attempts in their first breeding season produced 10 fledglings (2, 2, 3, 3), two pairs with breeding attempts monitored in the second breeding season produced six fledglings (3, 3), whereas the other two pairs were not monitored sufficiently to accurately determine the number fledged; four pairs present in the third season produced 10 fledglings (3,4,1,2), with an additional three pairs not monitored. Overall reproductive success was therefore estimated as 2.39 (SE 0.47, n = 10) juveniles per female per year. The estimated 21.1 (SE 2.3) fledglings produced in the first two breeding seasons (SE 2.3) resulted in a total of six recruits, giving an estimated juvenile survival probability of 0.31 (SE 0.10).
The parameter estimates above result in an estimated finite rate of increase (λ) of 0.83, with a 95% credible interval ranging from 0.52 to 1.19. Starting from seven females in the third breeding season, population projections incorporating demographic stochasticity as well as estimation uncertainty produced a median population of 0 females after 10 years with an upper 95% prediction interval of 33 (Figure 3).
Distribution of population projections for the CKOBWP rifleman population. Projections are from a stochastic spreadsheet model constructed using data collected in the first three years after reintroduction (Years 0,1,2), and projections incorporate uncertainty in all population parameters. The solid line shows the predicted median number of females and the dashed lines show 95% prediction intervals.

Discussion
Translocation methodology
Following Leech et al.’s (2007) documentation of the first translocation of Rifleman, which experienced a high level of transfer-related mortality, we sought to assess whether the implementation of their recommendations would result in a lower level of mortality during transfer. Leech et al. (Reference Leech, Craig, Beaven, Mitchell and Seddon2007) specifically recommended implementing reduced holding times, separation of different family groups, and an allowance for feeding time in the morning before capture and the afternoon following release. The adoption of these recommendations resulted in a transfer survival rate of 97% compared to the 52% for the previous Ulva Island translocation.
Mortality specifically during the capture, holding and release phases of the transfer process was significantly decreased in the CKOBWP translocation compared to the Ulva Island translocation, with a reduction in mortality from 48% to 3%. While it is possible that alternative factors related to geography, genetics, or ecology, might explain some of this improved survival between the South and North Island translocations, the changes in holding social associations and times are likely to be major components of this reduced mortality. Several studies have demonstrated that the stress response to holding and transfer during the translocation process can be substantial for some species (Groombridge et al. Reference Groombridge, Massey, Bruch, Malcolm, Brosius, Okada and Sparklin2004, Dickens et al. Reference Dickens, Delehanty and Romero2009, Adams et al. Reference Adams, Parker, Cockrem, Brunton and Candy2010, Parker et al. Reference Parker, Dickens, Clarke, Lovegrove, Ewen, Armstrong, Parker and Seddon2011). In a review of translocation capture and holding methodology, Parker et al. (Reference Parker, Dickens, Clarke, Lovegrove, Ewen, Armstrong, Parker and Seddon2011) state that the key factors in the design of effective capture and holding methods include minimising stress caused by inefficient capture methods, and reducing enclosure changes. Dickens et al. (Reference Dickens, Delehanty and Romero2009) also found that the holding and captivity period contributes most to the overall stress syndrome experienced by translocated animals. Whereas the Ulva Island translocation required two separate capture episodes, with birds held temporarily in aviaries, the CKOBWP translocation used only a single handling episode and a single enclosure (individual transfer boxes). The separation of Rifleman into individual holding boxes also appeared to be an effective technique for minimising the stress associated with forced interaction between territorial individuals. Leech et al. (Reference Leech, Craig, Beaven, Mitchell and Seddon2007) suggested that the losses associated with the holding phase of the transfer were the result of highly aggressive territorial interactions between non-familial individuals who were forced to share the same enclosures. Although best-practice holding methodology for avian translocations may be to separate individuals in aggressive, territorial species, the need for separation in territorial species appears to depend on each species’ individual tolerance to conspecifics. For example, both the territorial Saddleback Philesturnus carunculatus and Hihi Notiomystis cincta can be successfully held in collective aviaries (Armstrong et al. Reference Armstrong, Castro, Alley, Feenstra and Perrott1999, Taylor and Jamieson Reference Taylor and Jamieson2007), whereas New Zealand Robins Petroica spp., Fernbird Bowdleria punctata vealeae (Parker et al. Reference Parker, Dickens, Clarke, Lovegrove, Ewen, Armstrong, Parker and Seddon2011) and Rifleman (this study) all appear to require and benefit from individual holding enclosures. This is particularly noteworthy as the Rifleman is not described as a highly territorial species and will tolerate territory incursion by conspecifics in the wild (Campbell 1990, Higgins et al. Reference Higgins, Jin and Steele2001). Energetic requirements might also be a significant factor to consider when determining appropriate holding times. Rifleman, especially given their small size, are considered to be highly metabolically demanding, and spend a very high percentage of their time foraging (up to 82.5%) (Sherley Reference Sherley1985, Lill Reference Lill1991). Therefore, longer holding times might be responsible for increased mortality as a direct result of a lack of sustenance. While food was provided during both the Ulva Island and CKOBWP translocations, individuals varied in their consumption during the CKOBWP translocation (Tamsin Ward-Smith pers. obs.). As the stress response to capture and holding results in increases in both heart rate and energy mobilisation in birds (Parker et al. Reference Parker, Dickens, Clarke, Lovegrove, Ewen, Armstrong, Parker and Seddon2011), we suggest that some individuals might not be feeding enough during holding to compensate adequately for the increased metabolic rate produced by stress.
Post-release population establishment and persistence
While the revised transfer methodology described here appears to have decreased transfer-associated mortality significantly, the re-sighting of translocated individuals post-transfer was low, indicating high post-release mortality and/or dispersal. Numerous reintroduction studies have noted considerable mortality following translocation (Musil et al. Reference Musil, Connelly and Reese1993, Sarrazain and Legendre Reference Sarrazain and Legendre2000, Armstrong and Ewen Reference Armstrong and Ewen2001, Tavecchia et al. Reference Tavecchia, Viedma, Martinez-Abrain, Bartolome, Gomez and Oro2009). Translocated birds can be vulnerable due to post-release experiences in novel environments and with competitors and/or predators (Dickens et al. Reference Dickens, Delehanty and Romero2009, Parker et al. Reference Parker, Dickens, Clarke, Lovegrove, Ewen, Armstrong, Parker and Seddon2011).
The habitat at CKOBWP is a regenerating environment with patchy areas of mature forest, surrounding dry river-beds, and is likely to be suboptimal in comparison to the mature forest habitat at the source site, BSMI. Rifleman occupy mature forest in most natural populations (Higgins et al. Reference Higgins, Jin and Steele2001, Robertson et al. Reference Robertson, Hyvonen, Fraser and Pickard2007), and data from Rifleman translocated to Ulva showed biased dispersal toward mature forest areas (Mitchell Reference Mitchell2004). The dispersal behaviour of the Rifleman translocated to CKOBWP appears to have followed a similar pattern, with fidelity to the release sites and a concentration of territories around mature trees. It is possible that some translocated Rifleman are attempting longer-distance dispersal in search of preferred areas of habitat, which could contribute to the low number of observed survivors within the monitored population. The dispersal of a lone male Rifleman 1.7 km from the release site provides support for the idea that dispersal might be at least partially responsible for apparent lower survival in the monitored population.
Competitive interactions are considered unlikely to be responsible for post-release mortality and dispersal in the CKOBWP Rifleman population. Rifleman are infrequently subjected to aggression from inter-specific competitors or aggressors in natural South Island (Gray Reference Gray1969, Higgins et al. Reference Higgins, Jin and Steele2001) and North Island populations. Aggressive interactions with both native and exotic species have been observed in the CKOBWP population (Withers Reference Withers2009, Withers, pers. obs), however these interactions do not appear to commonly result in injury. Additionally, potential inter-specific competitors and aggressors are at low densities at the CKOBWP site. Predation is also considered unlikely to have played a significant role in post-release mortality. Predator monitoring at the release site shows that the exotic mammals, which are likely to be the main threats to Rifleman, are kept at low levels (Tamsin Ward-Smith, unpublished data).
Stress associated with the novelty of new environmental cues might be acting to increase the post-release mortality of translocated Rifleman (Dickens et al. Reference Dickens, Delehanty and Romero2009), and ongoing stress as a result of the transfer itself might also be a factor (Dickens et al. Reference Dickens, Delehanty and Romero2010, Parker et al. Reference Parker, Dickens, Clarke, Lovegrove, Ewen, Armstrong, Parker and Seddon2011). Although the adjustment of translocation techniques described here has reduced transfer-associated mortality for Rifleman, it is likely that the process of translocation per se still represents a significantly stressful event for transferred birds. The effects of such chronic and post-event stress can manifest in numerous ways including reproductive suppression, compromised immune responses and altered behaviour or physiology (Dickens et al. Reference Dickens, Delehanty and Romero2010), and may increase vulnerability to potential threats present at the release site and ultimately affect translocation success (Parker et al. Reference Parker, Dickens, Clarke, Lovegrove, Ewen, Armstrong, Parker and Seddon2011).
Lastly, survival might be affected by a normal trend toward higher mortality over winter. Rifleman populations experience winter declines in natural populations, with losses of up to 35%; over-wintering mortality is sex-biased, with the number of females declining significantly more than that of males (41% compared to 29%) (Lill Reference Lill1991), indicating that females incur higher overall annual losses than males. Natural attrition of older birds may also explain the higher post-release mortality found in this transfer, as many adult birds were of unknown age.
Population modelling
Using monitoring data collected during the three years following release, our population model projected potential population growth in the medium term – i.e. for the 10 years following translocation. This model indicates that, despite the increase in transfer survival due to improved translocation methodology, the population has a low probability of survival in the medium term. Griffith et al.’s (Reference Griffith, Michael Scott, Carpenter and Reed1989) comparative study suggests that on average up to 80 founders are needed to maximise the probability of population establishment. Therefore, it is possible that the low initial number of surviving individuals at the first breeding season is implicated in the negative population projections. However, New Zealand translocations often succeed with only a very small number of initial founders (Armstrong and McLean Reference Armstrong and McLean1995, Byrne Reference Byrne1999). Despite ongoing concerns regarding inbreeding and the subsequent extinction risks in small founder populations (Taylor et al. Reference Taylor, Jamieson and Armstrong2005, Frankham Reference Frankham2005, Jamieson et al. Reference Jamieson, Wallis and Briskie2006), some populations persist for decades despite having fewer than 10 founding individuals (e.g. Ardern and Lambert Reference Ardern and Lambert1997). Small founding populations can recover rapidly after release with high rates of survival and reproduction because of competitive release, or due to the effects of reduced density when reproduction or juvenile survival is density-dependent (e.g. Komdeur et al. Reference Komdeur, Huffstadt, Prast, Castle, Mileto and Wattel1995, Westemeier et al. Reference Westemeier, Brawn, Simpson, Esker, Jansen, Walk, Kershner, Bouzat and Paige1998, Armstrong and Ewen 2002, Taylor et al. Reference Taylor, Jamieson and Armstrong2005, Bouzat et al. Reference Bouzat, Johnson, Toepfer, Simpson, Esker and Westemeier2009).
The low rates of juvenile survival and reproductive success found in our study also contribute to the population’s high likelihood of extinction in the medium to long term. Our estimate of juvenile survival (31%) is substantially lower than the estimated juvenile survival rate of 53–80% for the successfully established population of Rifleman translocated to Ulva Island (Leech et al. Reference Leech, Craig, Beaven, Mitchell and Seddon2007). Our estimates of reproductive success are also somewhat lower than the maximum reproductive potential of Rifleman which can produce between two and five eggs per clutch and lay up to two clutches per season (Higgins et al. Reference Higgins, Jin and Steele2001). Reported first clutch sizes in natural populations of the South Island subspecies have ranged from 4.4 (Kowhai Bush) to 3.8 (Dunedin) (Gray Reference Gray1969, Sherley Reference Sherley1985) and are as high as 4.5 young per clutch in the Orongorongo Valley, the only North Island site with comparative data (Gaze Reference Gaze1978).
As translocations can sometimes result in a reduction in reproductive success in the years immediately following transfer (e.g. Armstrong and Ewen 2002), we estimated that reproductive success based on actual observed fledged clutch sizes within our population, resulting in a lower but more accurate reproductive rate estimate compared to Leech et al. (Reference Leech, Craig, Beaven, Mitchell and Seddon2007) who estimated clutch size (2.7 young per clutch) based on a previous study on a distinct and non-translocated population. In line with the Ulva Island projections, we also based our model on a single clutch per season which was consistent with our observations. It is possible that the reproduction rates found in our population are lower than normal due to Allee effects. Allee effects refer to any negative effects on survival or fecundity in relation to the reduced population size and therefore include both loss of genetic diversity as well as declines in relation to adjusted social dynamics (for example) (Deredec and Courchamp Reference Deredec and Courchamp2007). Reproductive rates could be affected by the inevitable alteration and reduction in social group size and make-up as a result of translocation; due to a lower partner detection rate at low density; or a combination of both of these factors (Deredec and Courchamp Reference Deredec and Courchamp2007, Armstrong and Wittmer Reference Armstrong and Wittmer2011). As helpers can increase reproductive success in some cooperative species (e.g. Ridley Reference Ridley2007), this might be particularly important for species which employ cooperative breeding strategies, such as the Rifleman (Sherley Reference Sherley1990). Research on the South Island sub-species of Rifleman indicates that the benefits of helping may include an increase in juvenile recruitment (Preston et al. Reference Preston, Briskie and Hatchwell2016). As no cooperative breeding was observed at the CKOBWP site during our study, this might be one factor affecting reproductive or recruitment rates. The release of individuals at two different sites could have increased the likelihood of Allee effects affecting reproduction in the CKOBWP population. One individual was observed moving between the two release locations, but the majority of monitored individuals showed strong fidelity to their respective release site and chose breeding pairs from those released within the same site. In small populations, the likelihood of encountering potential partners is reduced, decreasing potential reproductive rates in the population (Deredec and Courchamp Reference Deredec and Courchamp2007). We recommend using a single release site for future translocations of Rifleman when releasing small founder populations.
Our investigation suggests that following the 2008 and 2010 translocations, the CKOBWP Rifleman population is unlikely to survive in the medium-long term, but the population model predictions also contain high levels of uncertainty. This model demonstrates the importance of incorporating the effects of demographic stochasticity as well as uncertainty in parameter estimates when producing population projections from small population sizes or sparse data sets. As demographic stochasticity can contribute to post-release effects (Deredec and Courchamp Reference Deredec and Courchamp2007), population models that do not incorporate these levels of uncertainty may overestimate the likelihood of population persistence, leading to inappropriate decisions regarding future management options (Armstrong and Wittmer Reference Armstrong and Wittmer2011). Questions relating to population establishment in terms of the size and make-up of founder groups are most effective when incorporating known reproductive and survival rates into population models (Armstrong and Seddon Reference Armstrong and Seddon2008). Given the scarcity of data on vital rates for small populations of managed species, monitoring and reporting are therefore vital to the production of accurate models and effective long-term management decisions (Nichols and Armstrong Reference Nichols, Armstrong, Ewen, Armstrong, Parker and Seddon2012).
Conclusions and recommendations
Our test of the efficacy of Leech et al.’s (Reference Leech, Craig, Beaven, Mitchell and Seddon2007) recommendations resulted in significantly improved transfer survival compared to previous transfers of Rifleman. Our key recommendations are to avoid prolonged holding and transfer times, to allow adequate feeding time both prior to and following capture and transfer, to ensure individuals and family groups are kept separate during holding to reduce territorial aggression and the use of a single release site when translocating small numbers of birds. These recommendations will be important also for any translocations involving territorial and highly metabolically demanding species worldwide. These adjustments to the transfer methodology resulted in 97% of birds surviving the transfer and release phase, yet the establishment phase experienced higher losses. We suggest that Rifleman at CKOBWP are affected by post-release effects, including high over-winter mortality and an increased dispersal rate from the release sites in the locally patchy woodland habitat-matrix. Rifleman dispersal at this site might be increased due to a lack of familiarity with the environment in addition to an increased likelihood of dispersal outside the protected/monitored areas in mainland release sites compared to island release sites.
The population viability model employed here predicted a negative population trend for the population in the medium term and implies a low probability of success for this population. However, uncertainty in our estimates is high due to the small population size and missing subsets of demographic and monitoring data. The current status of the CKOBWP Rifleman population is unknown. A further transfer of Rifleman was carried out in 2011 for which no data are available meaning an updated model of future population viability is not possible. Anecdotal reports of a small number of individuals still present indicates that there may be a very low-density breeding population still present at the site. This study demonstrates the importance of incorporating demographic stochasticity and uncertainty in vital rate estimates when producing population models for small reintroduced populations and projects with sparse data. We strongly recommend the collection and reporting of frequent monitoring data following any translocation, allowing more accurate model development and population projections.
Author contributions
TW-S planned and carried out the translocation that forms the basis for this manuscript. SJW, MEH, SP and TW-S founded the idea to collaborate on collection of monitoring data in order to answer the hypothesis proposed by this manuscript. SJW and TW-S monitored the population and collected survival and reproductive data, with data analysis being performed by SJW and DA. SJW and DA wrote the manuscript with input from TW-S, SP and MEH.
Acknowledgements
This project was made possible thanks to the help and financial support of the owners of the Cape Kidnappers and Ocean Beach Wildlife Preserve: Andy and Liz Lowe, Warwick and Juliet Hansen and Julian Robertson. Our thanks go to John McLennan who was instrumental in the planning and carrying out of the Rifleman translocation. The assistance of CKOBWP staff and volunteers during both translocation and post-release monitoring was invaluable and made this study possible. Valuable advice and logistical support were provided by Brent and Kari Beaven, who provided ongoing discussion and advice on transfer technique following their involvement in the Ulva Island translocation. The support and cooperation of the Department of Conservation, in particular staff at Boundary Stream Mainland Island, was vital to the success of the transfer. SJW was supported by funding from a University of Auckland Doctoral Scholarship and a study grant from the Australasian Society for the Study of Animal Behaviour (ASSAB). For discussions, we thank the South Island Rifleman translocation team, Luis Ortiz Catedral, and Kevin Parker. This manuscript is dedicated to the memory of the late Prof. Ian Jamieson, a leader of New Zealand translocation studies.


