

INTRODUCTION
Q fever is a zoonotic disease caused by the organism Coxiella burnetii and it has a wide range of reservoirs, including wild and domestic mammals, birds and ticks [Reference Burnet and Freeman1–Reference Davis and Cox3]. The primary route of infection for humans is airborne, via inhalation of aerosolized particles from animal birthing products, urine and faeces, or possibly via ingestion of raw milk [Reference Maurin and Raoult4, Reference Gale5]. Person-to-person transmission is rare [Reference Maurin and Raoult4].
In Australia, Q fever has historically been associated with occupational exposures including abattoir work or farming [Reference Derrick2, Reference Turra6, Reference Parker, Barralet and Bell7]. Assisting in birthing and slaughtering of animals are especially high risk exposures [Reference Beech, Duxbury and Warner8–Reference Massey, Irwin and Durrheim10]. Approximately half of those infected with Q fever will be asymptomatic [Reference Dupuis11]. For those who become symptomatic, the disease can manifest as an acute febrile illness with muscle aches, weakness, severe headaches and fatigue or chronic illness that may affect the heart or liver [Reference Maurin and Raoult4, Reference Parker, Barralet and Bell7].
In Australia, Q fever has been a notifiable disease in humans in all states and territories since 1977 [Reference Garner9]. The only state in Australia that requires notification of Q fever in animals is the southern-most state of Tasmania [12].
The Australian Government funded the time-limited National Q fever Management Program (NQFMP) from 2001 to 2006, which included screening and vaccination for specific populations. Phase I (2002) of the program targeted abattoir workers, contractors working in abattoirs and sheep shearers. Phase II (2003) expanded the target population to include sheep, dairy and beef cattle farmers, their employees and family members working on farms [Reference Gidding13].
During the NQFMP, the greatest decline in notification rates was observed in young adult males, the target population of Phase I of NQFMP. Initially, the median age of notified cases and proportion of notified cases who were female increased, but this decreased again after Phase II (reflecting the target population of Phase II) [Reference Gidding13].
In Australia, several state-specific analyses of notified Q fever cases have been published, namely in the states with higher disease prevalence in New South Wales and Queensland [Reference Massey, Irwin and Durrheim10, Reference Lin14–Reference Harris17]. The only recent analysis of national Q fever notifications was published as part of a review of the NQFMP, and only analysed data to 2006 [Reference Gidding13]. This paper aims to describe the epidemiology of Q fever in humans in Australia from 1991 to 2014.
METHODS
Analysis of national notification data
A case of Q fever was defined as per the Communicable Diseases Network Australia national surveillance case definition [18], which requires detection of C. burnetii by culture or nucleic acid testing, or seroconversion in the absence of recent Q fever vaccination.
Data from 1 January 1991 to 31 December 2014 were extracted from the National Notifiable Diseases Surveillance System (NNDSS) on 6 July 2015. The extracted fields included: unique identifier, State or Territory of residence, onset date, specimen collection date, notification date, notification received date, gender and age at onset.
The data were grouped into diagnosis year by the onset date, or where the date of onset was not known, the earliest of the specimen collection date, the notification date, or the notification received date. These years were further grouped into three NQFMP periods: pre-NQFMP (1991–2000), during NQFMP (2001–2006) and post-NQFMP (2007–2014).
Cases were summarized by year, NQFMP period, age, gender and jurisdiction. Demographic and risk factor data were compared between analysis periods. Data were analysed by Wilcoxon rank-sum test, a non-parametric test for trend across ordered groups (nptrend) and proportions were assessed by χ 2 tests. A P of <0·05 was considered statistically significant.
Population rates for Q fever were calculated using the Australian Bureau of Statistics mid-year estimated resident populations, which are based on the 2011 Australian census of population and housing [19]. Rates are presented as notifications/100 000 population per year for Australia or State-/Territory-specific notifications/100 000 State-/Territory-specific population per year.
Negative binomial regression
To investigate the relationships between covariates such as gender, age, jurisdiction and NQFMP period, regression modelling was undertaken. Negative binomial regression was used to calculate gender, age group, State/Territory and NQFMP period or year specific incidence rate ratios (IRRs) for Q fever notifications, with 95% confidence intervals (CI) and P values. Negative binomial model selection was verified against other count data models via a χ 2 goodness-of-fit test and probability graphs.
Two degrees-of-freedom χ 2 tests were conducted on all variables in the final model to see if they were statistically significant (P < 0·05) predictors of Q fever notifications. For the negative binomial regression model using individual years, the year with the lowest notification rate since the end of NQFMP was selected as the reference year.
Analysis of New South Wales and Queensland enhanced risk factor data
Public health staff in New South Wales and Queensland interview all notified cases of Q fever to identify risk factors for exposure. This risk factor data are collected in their respective communicable diseases information management systems. Data was only sought from these two jurisdictions as they account for the majority of Q fever cases nationally and have the highest Q fever notification rates.
Data from 1991 to 2014 were extracted from the New South Wales Health Notifiable Conditions Information Management System on 4 July 2014 and from the Queensland Department of Health, Notifiable Conditions System on 25 August 2014. The extracted fields included: unique identifier, vaccination status, occupation, animal exposures, and animal fluid exposures.
Due to the two states collecting different data, these data were grouped into broad categories of ‘occupation’ (see Appendix Table 1), ‘animal fluid’ (i.e. Involvement in slaughtering, skinning or meat processing; Assisted or observed animal birth) and ‘environmental’ exposures (i.e. Any involvement in shooting/hunting; Live/work near an abattoir/animal grazing area/saleyards/farm; Exposure to trucks transporting sheep, cattle or goats; Live/work near bush/scrub/forest area) known to be associated with Q fever infection. The enhanced risk factor data (occupation, animal fluid and environmental exposures) was analysed from 2002 to 2013, as this is when both jurisdictions consistently collected occupational information (and included complete calendar years).
Using direct data linkage of the unique identifier, the NNDSS data fields of State/Territory, gender, the calculated diagnosis year and 20-year age groups, were linked to the New South Wales and Queensland enhanced risk factor data fields of vaccination status and the broadly grouped categories of occupation, animal fluid exposures and environmental exposures. This enhanced risk factor data was used to describe more detailed exposures of the notified cases.
All data were analysed using Stata intercooled v. 13 (Stata Corp, USA).
Approval to conduct this study was granted although the Australian National University Human Research Ethics Committee; Human Ethics protocol 2014/205. Approval for access to the enhanced Queensland and New South Wales datasets was granted by the Director General of Queensland Health and the Chief Health Officer of New South Wales Health, respectively.
RESULTS
National notification data
During the study period, there were 12 164 notified cases of Q fever in Australia. For those records where gender was recorded, 80% were male (9700/12 133), with 31 notifications missing data on gender. Between 1991 and 2014, there was a statistically significant (nptrend, P < 0·05) increase in the proportion of notifications that were recorded as female over time (15% in 1991 increased to 25% in 2014).
Almost all notifications had a date of birth recorded (98%, 11 942/12 164), and the median age of Q fever notifications was 40 years (range 0–92 years). There was a significant difference (Wilcoxon rank-sum, P > 0·05) in the median age for males (39 years, range 0–92 years) and females (43 years, range 0–92 years). A total of 256 people aged <15 years were notified during the study period; those aged <15 years are not currently recommended for vaccination in Australia [20].
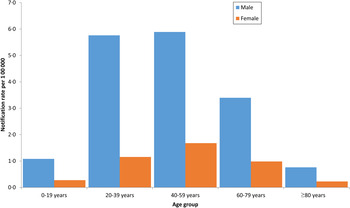
The highest notification rates for both males and females were in the 40–59 years age group at 5·9/100 000 for males and 1·7/100 000 for females (Fig. 1).
Q fever notification rates by gender and age group*, Australia 1991–2014, National Notifiable Diseases Surveillance System. [* (n = 11 915) 27 cases missing gender, 218 missing date of birth so no age group could be calculated and four missing both gender and date of birth.]
The median age of all cases increased over the study period with the pre-NQFMP period (1991–2000) having a median age of 35 years (range 0–92 years); for the during NQFMP period (2001–2006) the median age was 43 years (range 0–92 years); and for the post-NQFMP period (2007–2014) the median age was 47 years (range 1–89 years). The increase in median age was statistically significant (χ 2, P < 0·05).
After an initial decrease in Q fever notification rates following the introduction of Q fever vaccine for use in abattoirs in 1994, notification rates increased and peaked in 2002 (4·0/100 000) with the introduction of the NQFMP and declined to 1·7/100 000 in 2005. National rates have gradually increased since 2009 (from 1·4/100 000 in 2009 to 2·0/100 000 in 2014) (Fig. 2).
Q fever notification rates for Australia (National), Queensland (Qld) and New South Wales (NSW) by year, 1991–2014, National Notifiable Diseases Surveillance System.
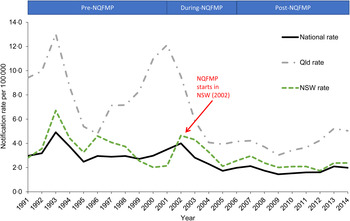
Cases of Q fever have been notified by all states and territories, with Queensland and New South Wales residents accounting for the majority of notifications (87%, 10 623/12 164). Queensland residents alone accounted for just under half of all Q fever notifications (47%, 5730/12 164). Along with the highest counts, Queensland residents also had the highest rates of Q fever notifications throughout the study period (Fig. 2). The peaks in Queensland notification rates in 2001, and for New South Wales in 2002 correspond with the differing start dates for NQFMP in those jurisdictions.
Negative binomial regression
Q fever notification rates were four times higher in males (IRR 4·03, 95% CI 3·51–6·64, P < 0·001) compared to females, when adjusting for NQFMP period, age group and jurisdiction (Table 1). Following the end of NQFMP in 2006, there has been a statistically significant 20% reduction in the rate of Q fever notifications (post-NQFMP period: IRR 0·82, 95% CI 0·69–0·97, P = 0·019) compared to before the introduction of NQFMP (Table 1).
Counts, percentages, rates and IRRs of Q fever notifications by gender, NQFMP period, age group and jurisdiction, 1991–2014
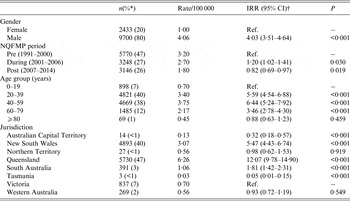
IRR, Incidence rate ratio; CI, confidence interval; Ref., reference group for negative binomial regression analysis.
* Percentages may not add up to 100 due to rounding or missing data.
† The negative binomial regression model contained 11 915 cases due to 27 cases missing gender, 218 missing date of birth so no age group could be calculated and four missing both gender and date of birth.
The rates for Q fever notifications were highest in the 40–59 years age group (IRR 6·44, 95% CI 5·24–7·92, P < 0·001), and were also higher in the 20–39 years age group (IRR 5·59, 95% CI 4·54–6·88, P < 0·001) and 60–79 years age group (IRR 3·46, 95% CI 2·78–4·30, P < 0·001), compared to the 0–19 years age group (Table 1). Statistically significant higher rates of Q fever notifications were also observed in Queensland (IRR 12·07, 95% CI 9·78–14·90, P < 0·001), New South Wales (IRR 5·47, 95% CI 4·43–6·74, P < 0·001) and South Australian (IRR 1·81, 95% CI 1·42–2·31, P < 0·001) residents (Table 1), compared to Victoria (reference State).
In further negative binomial regression analysis using individual years (and using 2009 as the reference year), there was a 41% (IRR 1·41, 95% CI 1·06–1·88, P < 0·020) and 34% (IRR 1·34, 95% CI 1·00–1·79, P < 0·047) increase in the 2013 and 2014 notification rates respectively, and both were statistically significant. Using individual years did not have an impact on the other variables in the model.
New South Wales and Queensland enhanced risk factor datasets
After using direct linkage, the combined enhanced risk factor dataset contained a total of 10 196 Q fever notifications; 4708 from New South Wales and 5488 from Queensland. Not all records (ten notifications from NNDSS and 39 notifications from the enhanced risk factor datasets) could be matched due to differing extraction dates.
For vaccination status, 68% of notifications (6978/10 196) were classified as unknown. For those notifications where vaccination status was recorded, 2% (71/3218) were listed as being vaccinated for Q fever. The proportion of notifications with unknown vaccination status decreased over time, with over 90% (405/446) in 1991 listed as unknown compared to 22% (94/416) in 2013.
From 2002 to 2013, 66% (2985/4523) of notifications did not have an occupation listed. The most frequently listed occupation included contact with livestock (16%, 703/4523), followed by no known risk occupation (9%, 371/4523).
A comparison of enhanced risk factor data from Q fever cases notified During NQFMP and post-NQFMP periods, including proportions of those with animal fluid and environmental exposures previously associated with Q fever by occupational risk categories, can be found in Table 2. During the NQFMP period, approximately half (51%, 1117/2193) of the Q fever notifications had an unknown occupation recorded and no animal fluid or environmental exposures recorded. This lack of identified risk factor reduced over time to 32% (743/2330) unknown in the post-NQFMP period.
Number and percentages of Q fever notifications by occupation categories, animal fluid and environmental exposures during and after the NQFMP, 2002–2013, New South Wales and Queensland enhanced risk factor datasets
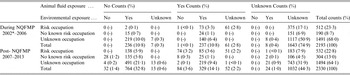
* Data not collected in 2001.
Where risk factors were known, the majority (62%, 1436/2330) of Q fever notifications in the post-NQFMP period had a high risk occupation, animal fluid exposure or environment exposure, or a combination of these. However, there was a small number (n = 28) of Q fever cases during this period that had no identified risks.
DISCUSSION
This study represents the first detailed analysis of Australian Q fever notifications since the end of the NQFMP in 2006, and is the first to combine Q fever notification data with enhanced risk factor data from multiple Australian jurisdictions with high notification rates.
Consistent with other published studies [Reference Garner9, Reference Gidding13], we found that New South Wales and Queensland residents accounted for the majority of Q fever cases in Australia and that rates of Q fever notifications were highest in older males. Also similar to other studies, we found that the age of notified Q fever cases [Reference Gidding13, Reference Lowbridge15] and the proportion of females both increased over time [Reference Massey, Irwin and Durrheim10, Reference Lowbridge15, Reference Palmer21].
The NQFMP was effective in reducing Q fever notifications in Australia [Reference Gidding13], with notification rates halving and then decreasing to their lowest level in 2009 at 1·4/100 000. A 20% reduction in Q fever notification rates occurred during the post-NQFMP period compared to the pre-NQFMP period; however, from 2009 onwards national Q fever notification rates have increased. It is important to note that while NQFMP had an effect on Q fever rates, changes in rates over time are likely to be multi-factorial; including the development of the vaccine for humans, the NQFMP, known outbreaks, changes in testing practices and awareness among the public and clinicians.
The enhanced risk factor data from New South Wales and Queensland contained limited data on vaccination status. While there is an effective vaccine available, studies have noted barriers to people being vaccinated [Reference Massey, Irwin and Durrheim10, Reference Gidding13, Reference Palmer21]. These barriers include the belief of not being at risk; costs associated with pre-screening and vaccination; difficulties accessing medical services; the need for pre-screening; and being below the recommended age of vaccination. Having only 2% of notified cases listed as vaccinated adds to the evidence for an effective vaccine [Reference O'Neill, Sargeant and Poljak22]. While the completeness of vaccination status in the surveillance data has improved over the study period, more work is needed to ensure at-risk individuals are vaccinated against Q fever.
When analysing the occupation field, the second highest occupation was no known risk occupation. This highlights that the risk factor of occupation alone is not a reliable determinant for risk of Q fever infection. This is also supported by other Australian studies [Reference Massey, Irwin and Durrheim10, Reference Gale16, Reference Palmer21]. We also observed Q fever notifications with a no known risk occupation who did not have another identifiable risk factor associated with Q fever. While the risk of Q fever from exposure to animal fluids and birthing products, particularly for abattoir workers, is well recognized, other potential factors such as contact with farm or native animals and exposure via wind/dust appear to be important [Reference Harris17, Reference Tissot-Dupont23, Reference O'Connor, Tribe and Givney24]. Other published studies have also identified non-traditional exposures associated with Q fever infection, including proximity to farms and animal sale yards [Reference O'Connor, Tribe and Givney24–Reference van der Hoek26]. Additionally, C. burnetii has been isolated from urban soil, atmospheric and vacuum cleaner samples [Reference Tozer27] and similar Q fever seropositivity levels have been detected in people from metropolitan and rural or remote areas [Reference Tozer28]. In Australia, there have also been cases of Q fever associated with domestic pets [Reference Tozer27, Reference Adamson, Marich and Roth29–Reference Cooper31] and an outbreak linked to a cosmetic supply factory [Reference Wade32].
Almost two-thirds of the Q fever notifications from the post-NQFMP period could be linked to an occupation, animal fluid exposure or environmental exposure known to be associated with Q fever infection. Vaccination of these people would have prevented the majority of notifications during this period.
With New South Wales and Queensland capturing slightly different risk factor data in their respective datasets and low levels of completeness, the analysis of the enhanced risk factor data requires cautious interpretation. Almost a third of records from the post-NQFMP period had incomplete data for all the analysed risk fields of occupation, animal fluid exposures and environmental exposures. Low data completeness limits our understanding of the current risk factors for Q fever in Australia.
With each Q fever case requiring public health staff to follow-up, interview and enter data into respective systems, it would be beneficial to have a nationally consistent surveillance questionnaire for interviewing Q fever cases. Additionally, a standardised approach to enhanced risk factor surveillance could facilitate more meaningful analyses to inform public health policy and action in Australia. The need for national enhanced risk factor data has been highlighted since the implementation of NQFMP [Reference Massey, Irwin and Durrheim10, Reference Gidding13, Reference Brotherton33, Reference Chiu34], although it is yet to be established. It was administration of specifically designed questionnaires during a Q fever outbreak in The Netherlands, which collected enhanced risk factor data, that highlighted how the traditional exposures of agricultural or meat processing occupations or living on a farm were associated with only a small proportion of cases [Reference Dijkstra35].
It is unknown if the apparent increase in Q fever notifications from 2009 is a true increase in disease incidence or whether other factors such as awareness and changes in testing practices have influenced the proportion of cases that are notified. A study into changes in testing practices and the effects of culture-independent diagnostic testing on Q fever notifications may help answer these questions.
Limitations of this paper include the use of notification data as they represent only a proportion of the total cases occurring in the community. Additionally, as approximately 50% of cases are asymptomatic, underreporting of cases is likely to have occurred.
A limitation of the enhanced risk factor data was the number of records from both jurisdictions with missing data, however, it should be noted that completeness has improved over time. While cautious interpretation of the analysis of the enhanced data is needed, almost two thirds of records from the enhanced data could be linked to an occupation, animal fluid exposure or environmental exposure previously associated with Q fever infection.
CONCLUSION
This national analysis has demonstrated that there may be more risk factors in Australia than those traditionally associated with Q fever. More comparable and complete risk factor data would help inform the epidemiological understanding of Q fever in Australia.
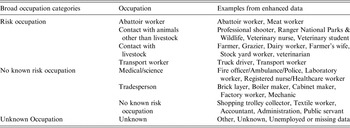
Occupational risk categories for Q fever infection based on New South Wales and Queensland enhanced risk factor data
ACKNOWLEDGEMENTS
The authors acknowledge State and Territory health departments, Public Health Units and the Communicable Diseases Network Australia.
DECLARATION OF INTEREST
None.


