





Introduction
Many economists and environmental campaigners believe that carbon taxes would be an effective and efficient way to reduce greenhouse gas emissions and thus mitigate climate change (Drupp, Nesje and Schmidt, Reference Drupp, Nesje and Schmidt2024; Koppl and Schratzenstaller Reference Köppl and Schratzenstaller2023; Stiglitz, Stern, Duan, et al. Reference Stiglitz, Stern, Duan, Edenhofer, Giraud, Heal, la Rovere, Morris, Moyer, Pangestu, Shukla, Sokona and Winkler2017). Yet, public support for carbon taxes is low (Barnes, Romemont and Lauderdale Reference Barnes, Romémont and Lauderdale2024; Carattini, Carvalho and Fankhauser Reference Carattini, Carvalho and Fankhauser2018; Carattini, Kallbekken and Orlov Reference Carattini, Kallbekken and Orlov2019; Schaffer Reference Schaffer, Hakelberg and Seelkopf2021). Rural communities are a particularly prominent part of public resistance to carbon taxes. Indeed, recent high-profile backlashes against environmental policies, such as the ‘Gilets Jaunes’ protests around rising fuel taxes in France and the public opposition to British Columbia’s carbon tax in Canada, had their roots firmly in rural areas (Bourdin and Torre Reference Bourdin and Torre2023; Harrison Reference Harrison2013; Murray and Rivers Reference Murray and Rivers2015). Why do we see such strong backlashes to carbon taxes in rural communities?
There is a lot of evidence showing that rural communities bear a disproportionate share of the costs of carbon taxation due to their greater reliance on heating, electricity, and private transport (eg cars) (Bureau Reference Bureau2011; Feng, Hubacek, Guan et al. Reference Feng, Hubacek, Guan, Contestabile, Minx and Barrett2010; Fremstad and Paul Reference Fremstad and Paul2019; Umit and Schaffer Reference Umit and Schaffer2020; Wier, Birr-Pedersen, Jacobsen et al. Reference Wier, Birr-Pedersen, Jacobsen and Klok2005), and we know that pocketbook concerns are an important predictor of carbon tax preferences (Beiser-McGrath and Bernauer Reference Beiser-McGrath and Bernauer2024). While revenue recycling approaches, such as tax rebates, can reduce the inequitable distribution of costs associated with carbon taxes and render them more politically feasible (Beiser-McGrath and Bernauer Reference Beiser-McGrath and Bernauer2019; Carattini, Kallbekken and Orlov Reference Carattini, Kallbekken and Orlov2019; Jagers, Martinsson and Matti Reference Jagers, Martinsson and Matti2019; Klenert, Mattauch, Combet et al. Reference Klenert, Mattauch, Combet, Edenhofer, Hepburn, Rafaty and Stern2018; Koppl and Schratzenstaller Reference Köppl and Schratzenstaller2023), resistance can persist in rural areas even with these measures in place (Beck, Rivers and Yonezawa Reference Beck, Rivers and Yonezawa2016). The direct costs borne by rural communities are only part of the picture, however, as support for carbon taxation is also heavily influenced by fairness considerations (Maestre-Andres, Drews and van den Bergh Reference Maestre-Andrés, Drews and van den Bergh2019; Povitkina, Carlsson Jagers, Matti et al. Reference Povitkina, Carlsson Jagers, Matti and Martinsson2021; Savin, Drews, Maestre-Andres et al., Reference Savin, Drews, Maestre-Andrés and van den Bergh2020; Sommer, Mattauch and Pahle Reference Sommer, Mattauch and Pahle2022). Citizens consider it unfair that carbon taxes punish people living in the countryside, and nowhere is this concern stronger than in rural communities themselves (Ewald, Sterner and Sterner Reference Ewald, Sterner and Sterner2022).
In this article, we develop the literature on fairness perceptions and rural resistance to carbon taxes. We focus on unequal treatment by the state, which is considered unfair by citizens as it violates widely-held equal treatment norms (Scheve and Stasavage Reference Scheve and Stasavage2023). Perceptions of unequal treatment by the state are a key determinant of preferences for taxing the rich (Alvarado Reference Alvarado2024; Limberg Reference Limberg2020; Scheve and Stasavage Reference Scheve and Stasavage2010, Reference Scheve and Stasavage2016), but have so far received little attention in studies on carbon tax preferences.
The growing literature on rural resentment in the advanced democracies has shown that rural communities have increasingly come to feel disadvantaged and marginalised compared to the urban centres of economic and political power (Borwein and Lucas Reference Borwein and Lucas2023; Cramer Reference Cramer2016; Haffert and Mitteregger Reference Haffert and Mitteregger2023; Hochschild Reference Hochschild2016; Huijsmans Reference Huijsmans2023a; McKay, Jennings and Stoker Reference McKay, Jennings and Stoker2024; Mitsch, Lee and Ralph Morrow Reference Mitsch, Lee and Ralph Morrow2021; Munis Reference Munis2022; Rodriguez-Pose Reference Rodrguez-Pose2018; Trujillo and Crowley, Reference Trujillo and Crowley2022; Wuthnow Reference Wuthnow2019; Zumbrunn Reference Zumbrunn2024). We therefore argue that when rural communities perceive more unequal treatment by the state, this leads them to think that carbon taxes are unfair as they punish those that have already been disadvantaged by the state. This lowers their support for the policy. Hence, a key part of the explanation for rural backlashes against carbon taxes is that people living in these areas think that carbon taxes unfairly reinforce unequal treatment by the state.
We proceed to test this argument in two steps. First, we provide observational survey evidence on how fairness perceptions and carbon tax support differ across rural and non-rural areas in the United Kingdom, drawing on a sample of around 1500 respondents. We find that rural respondents are significantly more likely to perceive unequal treatment by the state and to think that they are more exposed to carbon taxes. We also find a strong association for rural respondents between perceiving unequal treatment by the state and thinking carbon taxes are unfair as they punish those that have already been disadvantaged by the state. Crucially, rural respondents that perceive unequal treatment by the state also express significantly lower support for carbon taxes.
In the second step, we test our argument causally by carrying out an information provision survey experiment with a representative sample of around 3000 respondents from the United Kingdom. Respondents in the treatment group are shown information about the highly geographically unequal distribution of public spending on transport (per person), which is heavily skewed towards London, the most economically prosperous urban area in the UK and the seat of political power. The treatment aims to activate rural resentments and unequal treatment beliefs. We then look at how this affects fairness perceptions and support for carbon taxation for those living in both rural and non-rural areas.
We find that the treatment strongly affects support for carbon taxes in rural areas, lowering support by around 10 percentage points. In line with our argument, rural respondents in the treatment group also perceive more unequal treatment by the state and are more likely to believe that carbon taxes are unfair as the costs fall on those that have already been disadvantaged by the state.
The article makes three key contributions to the literature. First, it brings fairness concerns around unequal treatment by the state into research on preferences for carbon taxation for the first time. Second, it provides new causal evidence on the relationship between fairness perceptions and support for carbon taxes. Finally, it provides a novel explanation that can help us better understand the frequent and prominent backlashes to carbon taxes in rural communities in the advanced democracies.
The rest of the article proceeds as follows. The next section reviews the existing literature and sets out our theoretical argument. Section ‘Observational patterns’ begins by providing observational evidence on the rural–urban divide in unequal treatment beliefs, fairness perceptions, and support for carbon taxation. It then zooms in on rural respondents, looking at whether the associations in our observational data align with our theoretical argument. Section ‘Experimental evidence’ begins by setting out the design of our information provision survey experiment, before going on to present the results. Section ‘Robustness checks’ then runs a series of robustness tests to check for alternative explanations of our results. Lastly, we provide some concluding remarks in Section ‘Conclusion’.
Existing literature and our theoretical argument
In this section, we start by reviewing the existing literature on how fairness perceptions shape preferences for carbon taxation. We then summarise the political economy literature on unequal treatment by the state, fairness perceptions, and tax policy preferences. Building on these two important bodies of work, as well as the growing literature on rural resentment, we then set out our theoretical argument about the relationship between perceptions of unequal treatment, fairness beliefs, and backlashes to carbon taxation in rural areas.
Fairness perceptions and preferences for carbon taxation
Several studies have highlighted the importance of fairness perceptions for carbon tax preferences. Maestre-Andrés, Drews and van den Bergh (Reference Maestre-Andrés, Drews and van den Bergh2019) review the empirical literature on this topic and conclude that if people perceive carbon pricing to be fair, then this raises policy acceptability and support for carbon taxes. The review groups fairness concerns around carbon pricing into three categories, relating to personal effects, distributional effects, and procedural aspects. The former concerns perceived personal consequences such as expectations of individuals that they will be particularly hard hit by carbon pricing or that it will restrict their freedoms. Distributional effects relate to concerns about the collective consequences of carbon pricing such as the disproportionate effect on poorer households (that have to spend a larger share of their disposable income on carbon-intensive goods). Lastly, procedural aspects relate to perceived inequalities in the processes used to design and implement carbon pricing such as perceptions of insufficient consultation with social partners in designing policies or distrust that the government will keep its promises around revenue use.Footnote 1
Given the importance of the perceived distributional effects to the policy acceptability of carbon pricing, one common approach to lower public resistance to carbon taxes is to recycle the revenue raised by the carbon tax (eg through a general tax rebate or targeted support for low-income households) (Beiser-McGrath and Bernauer Reference Beiser-McGrath and Bernauer2019; Carattini, Kallbekken and Orlov Reference Carattini, Kallbekken and Orlov2019; Jagers, Martinsson and Matti Reference Jagers, Martinsson and Matti2019; Klenert, Mattauch, Combet et al. Reference Klenert, Mattauch, Combet, Edenhofer, Hepburn, Rafaty and Stern2018; Koppl and Schratzenstaller Reference Köppl and Schratzenstaller2023). Nevertheless, evidence from the political backlash to British Columbia’s carbon tax suggests that opposition can persist in rural areas even when revenue recycling measures are put in place (Beck, Rivers and Yonezawa Reference Beck, Rivers and Yonezawa2016).
Another important determinant of carbon tax fairness perceptions is concern for rural areas. Povitkina, Carlsson Jagers, Matti et al. (Reference Povitkina, Carlsson Jagers, Matti and Martinsson2021) use structural topic modelling on the answers to open-ended survey questions to explore what US respondents mean when they say that carbon taxes are unfair. The ‘need to drive’ and ‘concern for rural areas’ are two interlinked topics that help explain why (some) respondents think carbon taxes are unfair. Similarly, Ewald, Sterner and Sterner (Reference Ewald, Sterner and Sterner2022) find that ‘unfairness to rural areas’ is the most frequently chosen response when a national sample of the Swedish population is asked about the negative aspects of a carbon tax. They also find that this concern is greatest for those living in rural areas. In other words, a major source of rural opposition to carbon taxes is that they are seen to unfairly punish rural areas.
Unequal treatment by the state and tax policy preferences
A prominent source of unfairness perceptions in democracies is when the norm of equal treatment by the government (ie the belief that just as we all have one vote, we should also be treated equally by the state on other policy dimensions) is violated (Scheve and Stasavage Reference Scheve and Stasavage2016, Reference Scheve and Stasavage2023). This could occur for many reasons, as governments’ actions and policies often benefit some citizens more than others. For example, an infrastructure project in one part of the country will typically benefit people living in that geographical area more than people living elsewhere. Another example would be the introduction of a regressive sales tax that imposes a greater burden on people lower down the income distribution.
People typically react to the perceived unfairness of unequal treatment by the state by demanding that the government compensate them. Put another way, people demand the restoration of equal treatment by the state (Alvarado Reference Alvarado2024). Scheve and Stasavage’s (Reference Scheve and Stasavage2010, Reference Scheve and Stasavage2012, Reference Scheve and Stasavage2016) influential work on taxing the rich emphasises the importance of compensatory arguments in underpinning support for highly progressive taxation in the Western democracies after the second world war. They argue that higher taxes on the rich were considered fair during this period as they compensated for the rich being treated beneficially by the state – through lower conscription rates and higher profits from government demand for war-related goods – in the preceding period of mass warfare. In other words, progressive taxes were demanded as a means of restoring equal treatment by the state.
This argument has also been shown to generalise outside of periods of mass warfare. Limberg (Reference Limberg2020) finds evidence that the Great Recession and states’ reactions to it (including bank bailouts), triggered compensatory demands for tax progressivity in crisis-affected countries. In a recent conjoint survey experiment fielded in a diverse set of countries (the US, Australia, Chile, and Argentina), Alvarado (Reference Alvarado2024) goes one step further, providing causal evidence that perceived preferential treatment by the state leads to greater demand to use taxation to restore equal treatment, even outside of times of crisis.
Unequal treatment, fairness perceptions, and rural opposition to carbon taxation
We take the central idea of the existing research on unequal treatment and tax policy preferences – that unequal treatment by the state is considered unfair and that can have knock-on effects for tax policy preferences – and we apply it to the case of carbon tax support in rural areas. We argue that when people living in rural areas perceive unequal treatment by the state it leads them to be less supportive of carbon taxes, because they believe that carbon taxes unfairly punish those that have already been disadvantaged by the state.
In recent years, a large literature has emerged on rural resentment, which argues that the turn to right-wing populism in Western Europe and North America has been fuelled by people living in rural areas feeling increasingly politically, economically, and culturally marginalised (Cramer Reference Cramer2016; Haffert and Mitteregger Reference Haffert and Mitteregger2023; Hochschild Reference Hochschild2016; Huijsmans Reference Huijsmans2023a; Munis Reference Munis2022; Rodriguez-Pose Reference Rodrguez-Pose2018; Trujillo and Crowley Reference Trujillo and Crowley2022; Wuthnow Reference Wuthnow2019; Zumbrunn Reference Zumbrunn2024) In other words, rural communities feel that the urban centres of economic and political power are ‘unfairly advantaged and prioritised’ by the government (Borwein and Lucas Reference Borwein and Lucas2023, p. 3). This is reflected sharply in Cramer’s (Reference Cramer2016) seminal ethnographic study of place identity in rural Wisconsin, which finds that perceptions that rural areas do not get their fair share of economic resources from the government and that politicians and policymakers pay little attention to the problems facing rural areas are key drivers of rural resentment.
There are also several cross-country empirical studies on how the urban–rural divide is reshaping political attitudes in Europe. People in rural areas have been found to have lower levels of trust in politics (Kenny and Luca Reference Kenny and Luca2021; Mitsch, Lee and Ralph Morrow Reference Mitsch, Lee and Ralph Morrow2021), as well as exhibiting less satisfaction with how democracy works (Lago Reference Lago2022), more political discontent (McKay Reference McKay2019), and greater support for authoritarianism (Zumbrunn and Freitag Reference Zumbrunn and Freitag2023). Perceptions that national governments have a ’geographic bias’ are also widespread. McKay, Jennings, and Stoker (Reference McKay, Jennings and Stoker2024, p. 1741) find that ‘clear majorities believe that government is biased towards rich areas and capital cities, while around half of respondents perceive there to be bias against rural areas’. They also find that these perceptions of geographical bias are especially prominent among those living in rural areas.
In an extensive review article on the changing cleavage politics of the advanced democracies, Ford and Jennings (Reference Ford and Jennings2020) pick out rural resentment as one of the key forces remoulding electoral politics across OECD countries. They highlight the crucial role played by rural resentment in many of the seismic political events of recent years including Brexit in the UK, the Gilets Jaunes protests, and the rise of Marine Le Pen’s Front National in France, the strong polarisation of the electorate in the 2016 Presidential election in Austria, and the turn to right-wing populism in the United States.
Taken together, this literature makes a compelling case that many people in rural communities in the advanced democracies have come to feel increasingly marginalised and resentful towards national governments, as well as feeling that prosperous urban areas are unfairly advantaged. In other words, many ruralites perceive unequal treatment by the state.
People living in rural communities also tend to believe that they will have to pay a disproportionate share of the burden of carbon taxation. This aligns with the empirical evidence showing that rural areas typically have greater carbon emissions per person due to their higher usage of heating, electricity, and private transport (eg cars) (Bureau Reference Bureau2011; Feng, Hubacek, Guan et al. Reference Feng, Hubacek, Guan, Contestabile, Minx and Barrett2010; Fremstad and Paul Reference Fremstad and Paul2019; Pateman Reference Pateman2011; Umit and Schaffer Reference Umit and Schaffer2020; Wier, Birr-Pedersen, Jacobsen et al. Reference Wier, Birr-Pedersen, Jacobsen and Klok2005), as well as studies finding that rural communities feel that carbon taxes unfairly punish those living in rural areas (Ewald, Sterner and Sterner Reference Ewald, Sterner and Sterner2022; Povitkina, Carlsson Jagers, Matti et al. Reference Povitkina, Carlsson Jagers, Matti and Martinsson2021).
Bringing these two strands of the literature together, we arrive at the overarching argument of the article. When rural communities perceive unequal treatment by the state, they are particularly resistant to carbon taxes. This is because they believe that carbon taxes are unfair as they punish rural communities that have already been disadvantaged by the state. Indeed, we argue that this ‘double disadvantage’ is one of the crucial drivers of the deep-seated, fairness-based opposition to carbon taxes seen in many rural areas.
Our argument focuses on carbon tax support specifically, but it also aligns new research exploring the links between rural resentment and other areas of environmental policy. Munis and Nemerever (Reference Munis and Nemerever2025) find that rural and non-rural Americans share similarly positive views on federal ownership and management of public lands. The exception to this is ruralites that exhibit high levels of place-based resentment, who are uniquely opposed to public land management and the environmental policies of the federal government. Building on this research, Hunnicutt, Munis and Nemerever (Reference Hunnicutt, Munis and Nemerever2025) show that perceived procedural injustices in historical environmental policymaking (eg exclusionary practices of American environmental organisations or government agencies’ lack of recognition of rural identities) heighten rural resentment and lower support for government policies, including those on the environment.
Observational patterns
To investigate whether unfairness perceptions of carbon taxes due to unequal treatment by the state can help explain rural backlashes to carbon taxes, we ran a survey with around 3000 respondents in the United Kingdom asking people about their beliefs and preferences around carbon taxes. The survey was coded in Qualtrics, and respondents were recruited via Prolific’s online panel. We use a stratified sampling procedure to make our survey panel representative, stratifying across three demographics: age, sex, and ethnicity.Footnote 2 The average time to finish the survey was around 5 minutes. We exclude all speeders who took the survey in less than 2.5 minutes (2% of respondents) to ensure data quality.Footnote 3 Respondents were paid £16.30 per hour on average.
We chose to carry out the survey in the United Kingdom, where both urban–rural political divides (Huijsmans and Rodden Reference Huijsmans and Rodden2025; Rodden Reference Rodden2019; Taylor, Lucas, Armstrong et al., Reference Taylor, Lucas, Armstrong and Bakker2024) and rural resentments (McKay Reference McKay2019; McKay, Jennings and Stoker Reference McKay, Jennings and Stoker2024) have been well documented.Footnote 4 We see the UK as a ‘typical case’, which is representative ‘given the specified relationship’ (Seawright and Gerring Reference Seawright and Gerring2008, p. 297). In other words, we would expect the results for the UK to generalise to other advanced democracies with similar characteristics. Recent cross-country empirical research has shown particularly pronounced urban–rural political divides in the UK, the US, and Canada, but has also found these divides emerging in several European countries with multiparty systems such as Germany, Switzerland, Denmark, Norway, and Austria (Huijsmans and Rodden Reference Huijsmans and Rodden2025). While the literature on rural resentment initially focused on the US (Cramer Reference Cramer2016; Hochschild Reference Hochschild2016; Wuthnow Reference Wuthnow2019), similar resentments about rural communities being marginalised by the government have been found in a wide range of European countries including several with egalitarian welfare states (Auerbach, Eidheim and Fimreite Reference Auerbach, Eidheim and Fimreite2024; Hansson, Erlingsson and Tinghog Reference Hansson, Erlingsson and Tinghög2026; Huijsmans Reference Huijsmans2023b; Zumbrunn Reference Zumbrunn2024). Given the growing centrality of the urban–rural divide and rural resentment to politics in the advanced democracies (Ford and Jennings Reference Ford and Jennings2020), we expect our theoretical argument and empirical findings to apply to a broad range of OECD countries.
The survey was split into three parts: In the first part, we asked respondents about socio-economic characteristics (age, gender, place of living, etc.), as well as about general political attitudes (political affiliation, political interest, etc.). To identify whether a respondent lives in a rural area or not, we rely on self-reported rurality by asking respondents: ‘Which category best describes the neighbourhood where you live?’ We recode this category so it takes the value 1 for ‘Rural’ and 0 for ‘Non-rural’ (ie suburban and urban). On average, around 20.7% of our respondent identify as living in a rural area.Footnote 5 We decided against using a geocoded measure of rurality as official measures of rurality are not uniform across the UK’s devolved nations.Footnote 6 Thus, using a survey item allows for a standardised measure across diverse contexts where official classifications differ. While self-reported rurality has been used widely in the empirical literature (Garcia del Horno, Rico and Hernandez Reference Garca del Horno, Rico and Hernández2024; McKay, Claassen, Bankov et al., Reference McKay, Claassen, Bankov and Carman2025), it also causes potential issues (Nemerever and Rogers Reference Nemerever and Rogers2021). Most importantly, self-selection into (declared) rurality might pose a threat to inference. Therefore, we probe whether our findings are likely to be driven by self-selection in the robustness checks (Section ‘Robustness checks’).
The second part consists of an information provision experiment where we randomly present half our respondents with information about the geographically uneven distribution of government spending on transport in the UK (see the next section). The final part asks respondents a series of post-treatment questions about unequal treatment perceptions, unfairness beliefs, and support for carbon taxation. For the full survey instrument, see Part A of the Online Appendix.
We start by looking at observational evidence to see whether rural and non-rural people differ on average with regard to unequal treatment perceptions, perceptions of carbon tax exposure, beliefs about whether carbon taxes are unfair as they mostly fall upon those that have already been disadvantaged by the state, and carbon tax preferences. To do this, we solely look at the control group (of around 1500 respondents) to ensure our results are not driven by the information provision experiment. First, we look at perceptions of unequal treatment. To measure this, we ask people the extent to which they agree with the statement: ‘The government treats people equally, regardless of where in the UK they live’. Respondents could answer on an 11-point Likert scale ranging from 0 (Strongly disagree) to 10 (Strongly agree). We reverse the scale for the unequal treatment variable, so that higher values indicate that respondents perceive more unequal treatment. From the top-left panel of Figure 1, we see that rural respondents are more likely to hold unequal treatment perceptions, and this difference is highly statistically significant ( $p{\rm{ \lt }}0.01$
).
$p{\rm{ \lt }}0.01$
).
Differences between rural and non-rural respondents in unequal treatment perceptions, carbon tax cost exposure perceptions, carbon tax unfairness perceptions, and carbon tax support.
Note: The top-left panel shows average disagreement by rural/non-rural status with the statement: ‘The government treats people equally, regardless of where in the UK they live’. The top-right panel shows average answer by rural/non-rural status to the question: ‘On a scale of 0–10, how affected do you think you would be if the government increased the cost of ${\rm{C}}{{\rm{O}}_2}$
consumption through a carbon tax?’ The bottom-left panel shows average agreement by rural/non-rural status with the statement: ‘A carbon tax is unfair as it is mostly paid by those that have already been disadvantaged by the government’. The bottom-right panel shows support for increasing the cost of CO2 consumption through a carbon tax panel by rural/non-rural status. Random noise (jitter) applied to improve visualisation of density. ***p < 0.01, **p < 0.05, *p < 0.1.
${\rm{C}}{{\rm{O}}_2}$
consumption through a carbon tax?’ The bottom-left panel shows average agreement by rural/non-rural status with the statement: ‘A carbon tax is unfair as it is mostly paid by those that have already been disadvantaged by the government’. The bottom-right panel shows support for increasing the cost of CO2 consumption through a carbon tax panel by rural/non-rural status. Random noise (jitter) applied to improve visualisation of density. ***p < 0.01, **p < 0.05, *p < 0.1.

Next, we check whether rural respondents feel more exposed to carbon taxes. To do this, we look at a question that measures carbon tax cost perceptions by asking: ‘On a scale of 0–10, how affected do you think you would be if the government increased the cost of ${\rm{C}}{{\rm{O}}_2}$
consumption through a carbon tax?’ Answers could range on a 11-point Likert scale from 0 (Not affected at all) to 10 (Highly affected). The top-right panel of Figure 1 shows the results. We find that rural respondents do indeed feel that they would be more affected by carbon taxation (
${\rm{C}}{{\rm{O}}_2}$
consumption through a carbon tax?’ Answers could range on a 11-point Likert scale from 0 (Not affected at all) to 10 (Highly affected). The top-right panel of Figure 1 shows the results. We find that rural respondents do indeed feel that they would be more affected by carbon taxation ( $p{\rm{ \lt }}0.05$
). We then check whether carbon taxes are seen as an unfair double disadvantage by asking respondents about their agreement with the statement: ‘A carbon tax is unfair as it is mostly paid by those that have already been disadvantaged by the government’. Again, respondents could answer on an 11-point Likert scale ranging from 0 (Strongly disagree) to 10 (Strongly agree). The bottom-left panel in Figure 1 presents the results. Rural respondents are slightly more likely to agree with the statement, but the difference is not statistically significant.
$p{\rm{ \lt }}0.05$
). We then check whether carbon taxes are seen as an unfair double disadvantage by asking respondents about their agreement with the statement: ‘A carbon tax is unfair as it is mostly paid by those that have already been disadvantaged by the government’. Again, respondents could answer on an 11-point Likert scale ranging from 0 (Strongly disagree) to 10 (Strongly agree). The bottom-left panel in Figure 1 presents the results. Rural respondents are slightly more likely to agree with the statement, but the difference is not statistically significant.
Finally, we check whether there is a divide between rural and non-rural respondents in attitudes towards carbon taxation. We use a survey item that asks people the extent to which they support or oppose the government increasing the cost of ${\rm{C}}{{\rm{O}}_2}$
consumption through a carbon tax. Respondents could answer: 1 = Strongly support, 2 = Support, 3 = Neither support nor oppose, 4 = Oppose, 5 = Strongly oppose, and Don’t know. We recode the variable so that it takes the value ‘1’ if people either answered the question with ‘Strongly support’ or ‘Support’ and ‘0’ otherwise. The bottom-right panel of Figure 1 shows that support for carbon taxation is around 3 percentage points lower among rural respondents. On average, 43% of people in rural areas support carbon taxation. In contrast, 46% of respondents in non-rural areas support such a tax. This difference, however, is not statistically significant at conventional levels. This could be an issue of statistical power, given the relatively small sample size of around 1500 observations (with rural respondents making up about one-fifth of the sample).
${\rm{C}}{{\rm{O}}_2}$
consumption through a carbon tax. Respondents could answer: 1 = Strongly support, 2 = Support, 3 = Neither support nor oppose, 4 = Oppose, 5 = Strongly oppose, and Don’t know. We recode the variable so that it takes the value ‘1’ if people either answered the question with ‘Strongly support’ or ‘Support’ and ‘0’ otherwise. The bottom-right panel of Figure 1 shows that support for carbon taxation is around 3 percentage points lower among rural respondents. On average, 43% of people in rural areas support carbon taxation. In contrast, 46% of respondents in non-rural areas support such a tax. This difference, however, is not statistically significant at conventional levels. This could be an issue of statistical power, given the relatively small sample size of around 1500 observations (with rural respondents making up about one-fifth of the sample).
Taken together, the simple split of the respondents in our control group into rural and non-rural shows their beliefs and policy preferences diverge, but more in some areas than others. There are more marked differences in perceptions of unequal treatment by the state and cost perceptions of carbon taxes than there are in carbon tax fairness perceptions and support.
We now turn to explore whether the associations in our observational data align with our theoretical argument that ruralites that perceive unequal treatment by the state hold a strong fairness-based opposition to carbon taxation. We first run regression models investigating the associations between unequal treatment perceptions and our measures of carbon tax fairness and support among rural respondents. In both cases, we control for a range of covariates (age, gender, income, education, left-right placement) and find that the coefficients of unequal treatment perceptions are statistically significant (Table B1 in the Online Appendix). Figure 2 presents the results by plotting predicted values of unfairness beliefs of carbon taxes as well as of carbon tax support based on different levels of unequal treatment perceptions. In line with our argument, unequal treatment perceptions increase unfairness perceptions substantially. A three-point increase in unequal treatment perceptions predicts a one-point increase in unfairness beliefs of carbon taxation. Furthermore, unequal treatment perceptions also predict carbon tax support. A one-point increase in unequal treatment perceptions predicts a drop in carbon tax support of more than 3.4 percentage points.
Unequal treatment perceptions as a predictor of carbon tax unfairness and carbon tax support among rural respondents.
Note: The left panel shows predicted values of unfairness beliefs of carbon taxation along different levels of unequal treatment beliefs. The right panel shows predicted values of carbon tax support along different levels of unequal treatment beliefs. Predictions are based on the full models presented in Table B1 in the Online Appendix. Note: The left panel shows predicted values of unfairness beliefs of carbon taxation along different levels of unequal treatment beliefs. The right panel shows predicted values of carbon tax support along different levels of unequal treatment beliefs. Predictions are based on the full models presented in Table B1 in the Online Appendix.

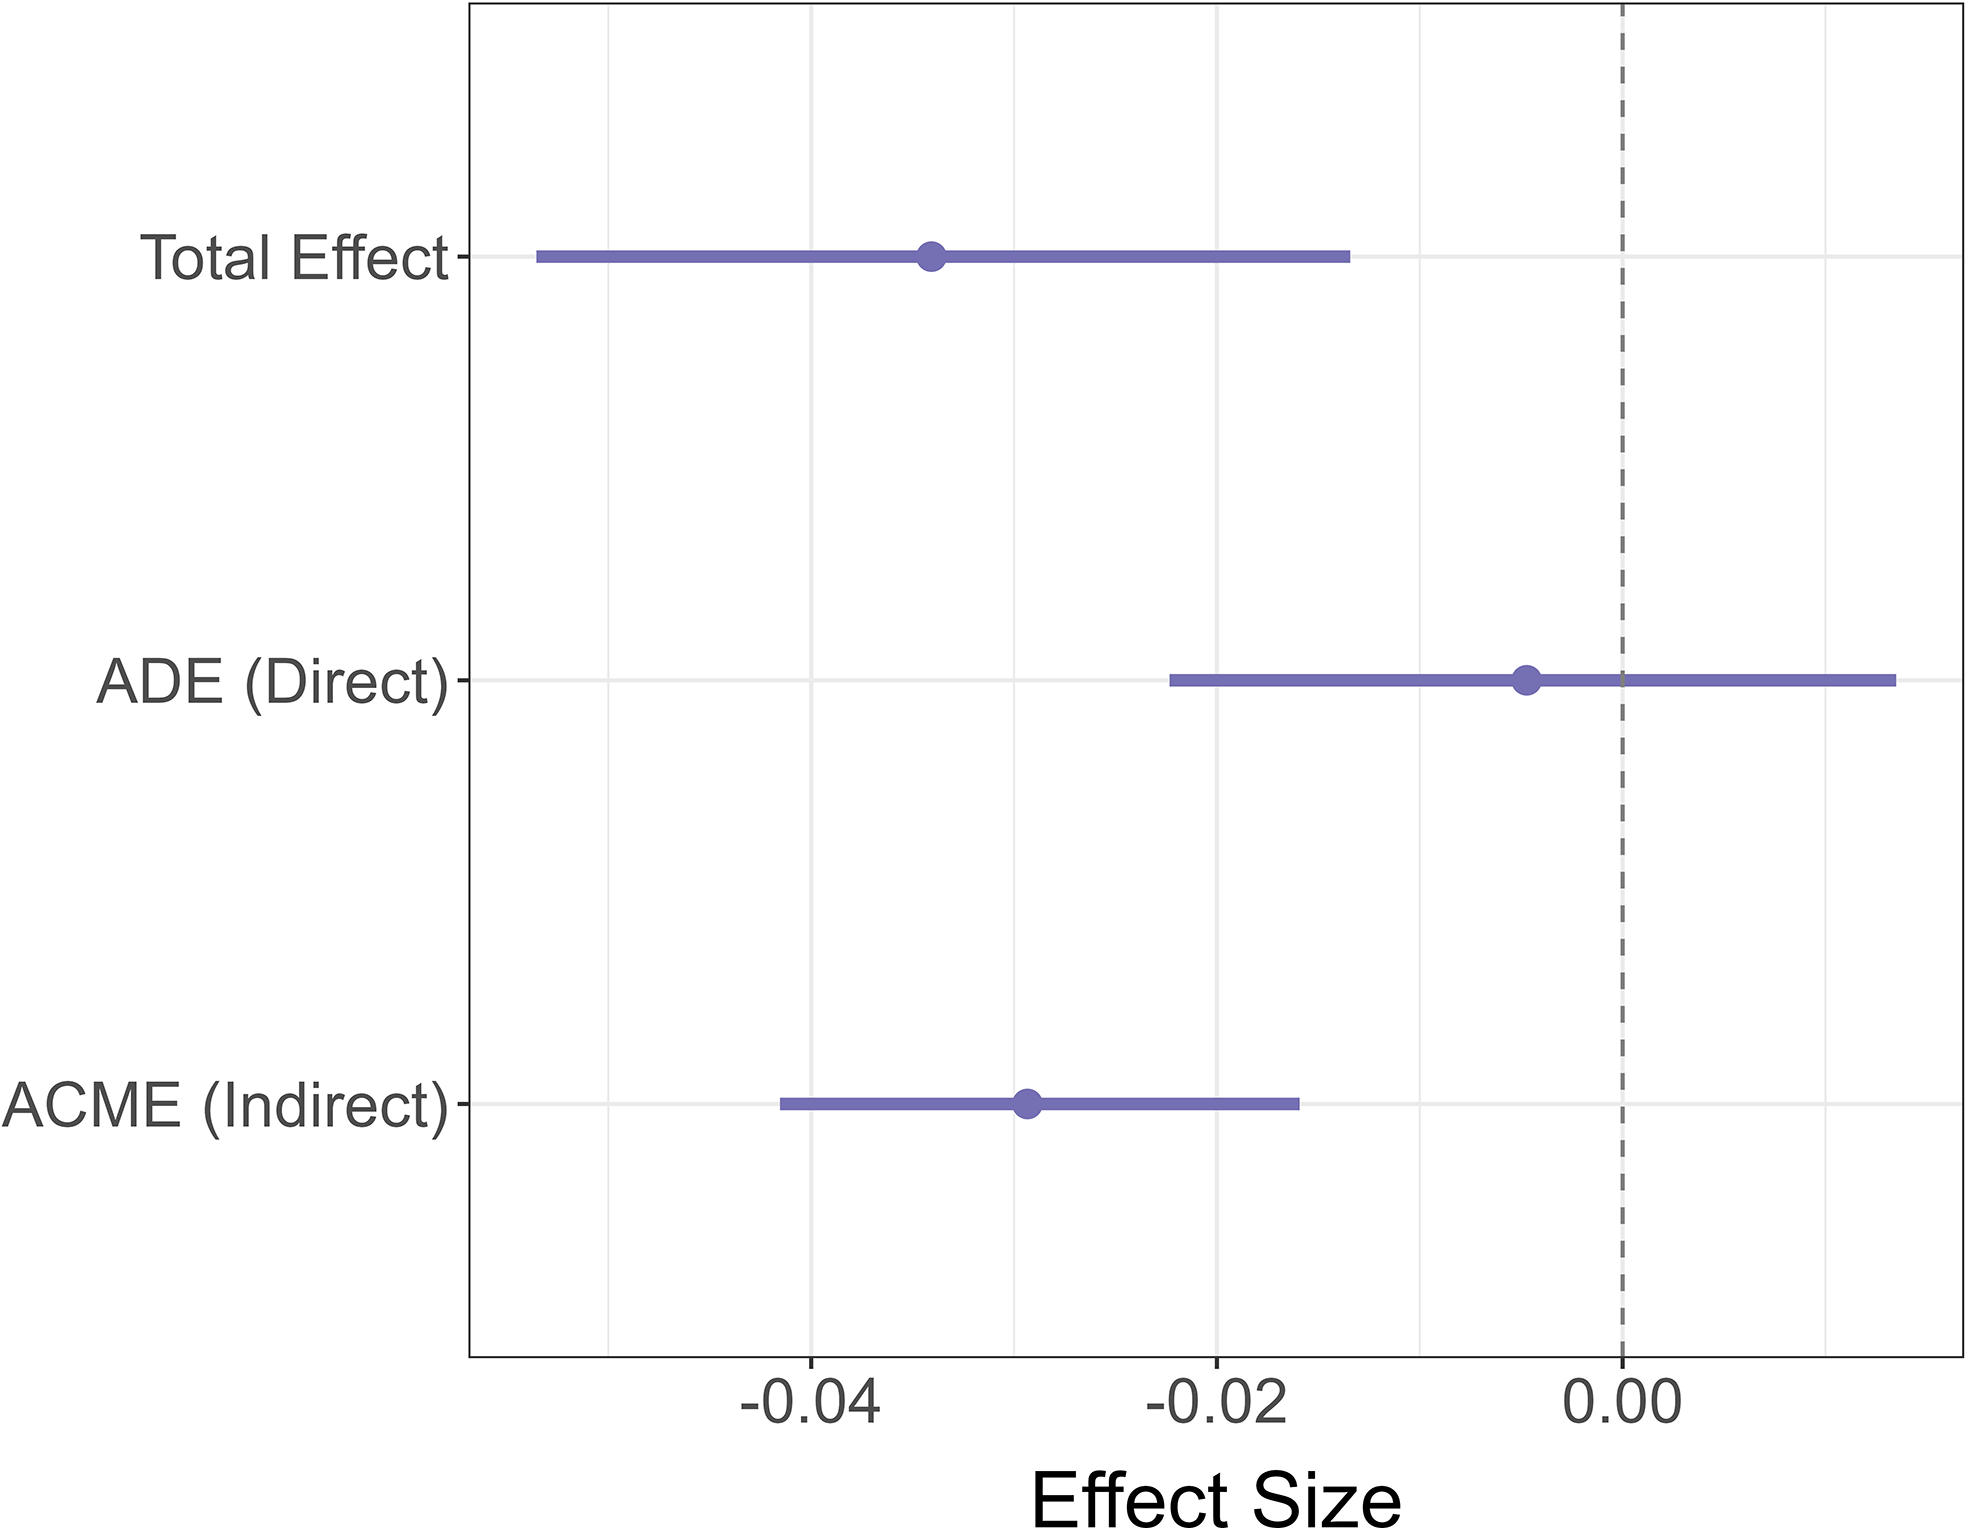
In the next step, we run a causal mediation analysis (Imai, Keele, Tingley et al., Reference Imai, Keele, Tingley and Yamamoto2011) to ascertain how much of the effect of unequal treatment perceptions on carbon tax support runs through respondents’ perceptions of carbon tax fairness. Figure 3 presents the results. We can see that the total effect of unequal treatment perceptions on carbon taxation support runs through unfairness beliefs. The average causal mediation effect of unfairness beliefs as the mediator is statistically significant ( $p{\rm{ \lt }}0.001$
) and accounts for 86% of the total effect of unequal treatment beliefs.
$p{\rm{ \lt }}0.001$
) and accounts for 86% of the total effect of unequal treatment beliefs.
Mediation analysis of effect of unequal treatment perceptions on carbon tax support among rural respondents.
Note: Mediation analysis of unequal treatment perceptions on support for carbon taxation with fairness perceptions of carbon taxes as the mediator. Dots denote estimates and error bars denote 90% confidence intervals.

In sum, the observational results show support for our theoretical argument that when people living in rural areas feel they are treated unequally by the government, they see carbon taxes as an unfair double disadvantage and are more opposed to them. Interestingly, we do not find large differences in carbon tax support between rural and non-rural respondents on average. Our evidence shows that the strong resistance to carbon taxes is concentrated among rural respondents that harbour resentments about unequal treatment by the state. This aligns with recent evidence from the United States focusing on public land management that shows resentful ruralites have dramatically different preferences for environmental policies to everyone else (Munis and Nemerever Reference Munis and Nemerever2025).
Experimental evidence
To provide a causal test of our argument, we implement an information provision experiment in our survey. The experiment uses a between-subjects design, where respondents are randomly assigned to the control or treatment arm of the experiment. Those in the control group receive no information, whereas those in the treatment group receive information about unequal treatment by the UK national government on a dimension that is closely related to climate policy. More specifically, we provide respondents in the treatment group with information showing the highly uneven distribution of government spending on transport (per person) across regions in the UK (Figure 4).Footnote 7 The treatment is aiming to shock respondents’ perceptions of unequal treatment by the government and to activate rural resentments. A crucial feature of the treatment is that London stands out as the region with by far the highest per capita government spending on transport. The level in London is almost twice the level in the UK as a whole. Crucially, London is the largest urban area in the UK and the seat of political power. The treatment therefore particularly highlights unequal treatment by the UK government along the urban-rural cleavage.
Information provision treatment.

The information provided in the treatment is dictated by how the UK Office for National Statistics records regional public spending. They do not break spending down by urban and rural areas but instead show how it is distributed across the 12 high-level geographical regions of the UK. It is a limitation of the treatment that it may also activate resentments from peripheral regions more generally against the centre (ie London). However, as our analysis will show, to the extent these resentments are activated, they do not affect preferences for carbon taxation outside of rural areas (see Section ‘Alternative mechanisms’). Furthermore, respondents might think that there are functional reasons for the higher per capita spending in London (eg due to tourism or population density). If this is the case, the treatment might not affect perceptions of unequal treatment. Hence, it is crucial to check whether the information treatment provides us with causal leverage by affecting perceptions of unequal treatment and unfairness perceptions of carbon taxes (see Figure 6).
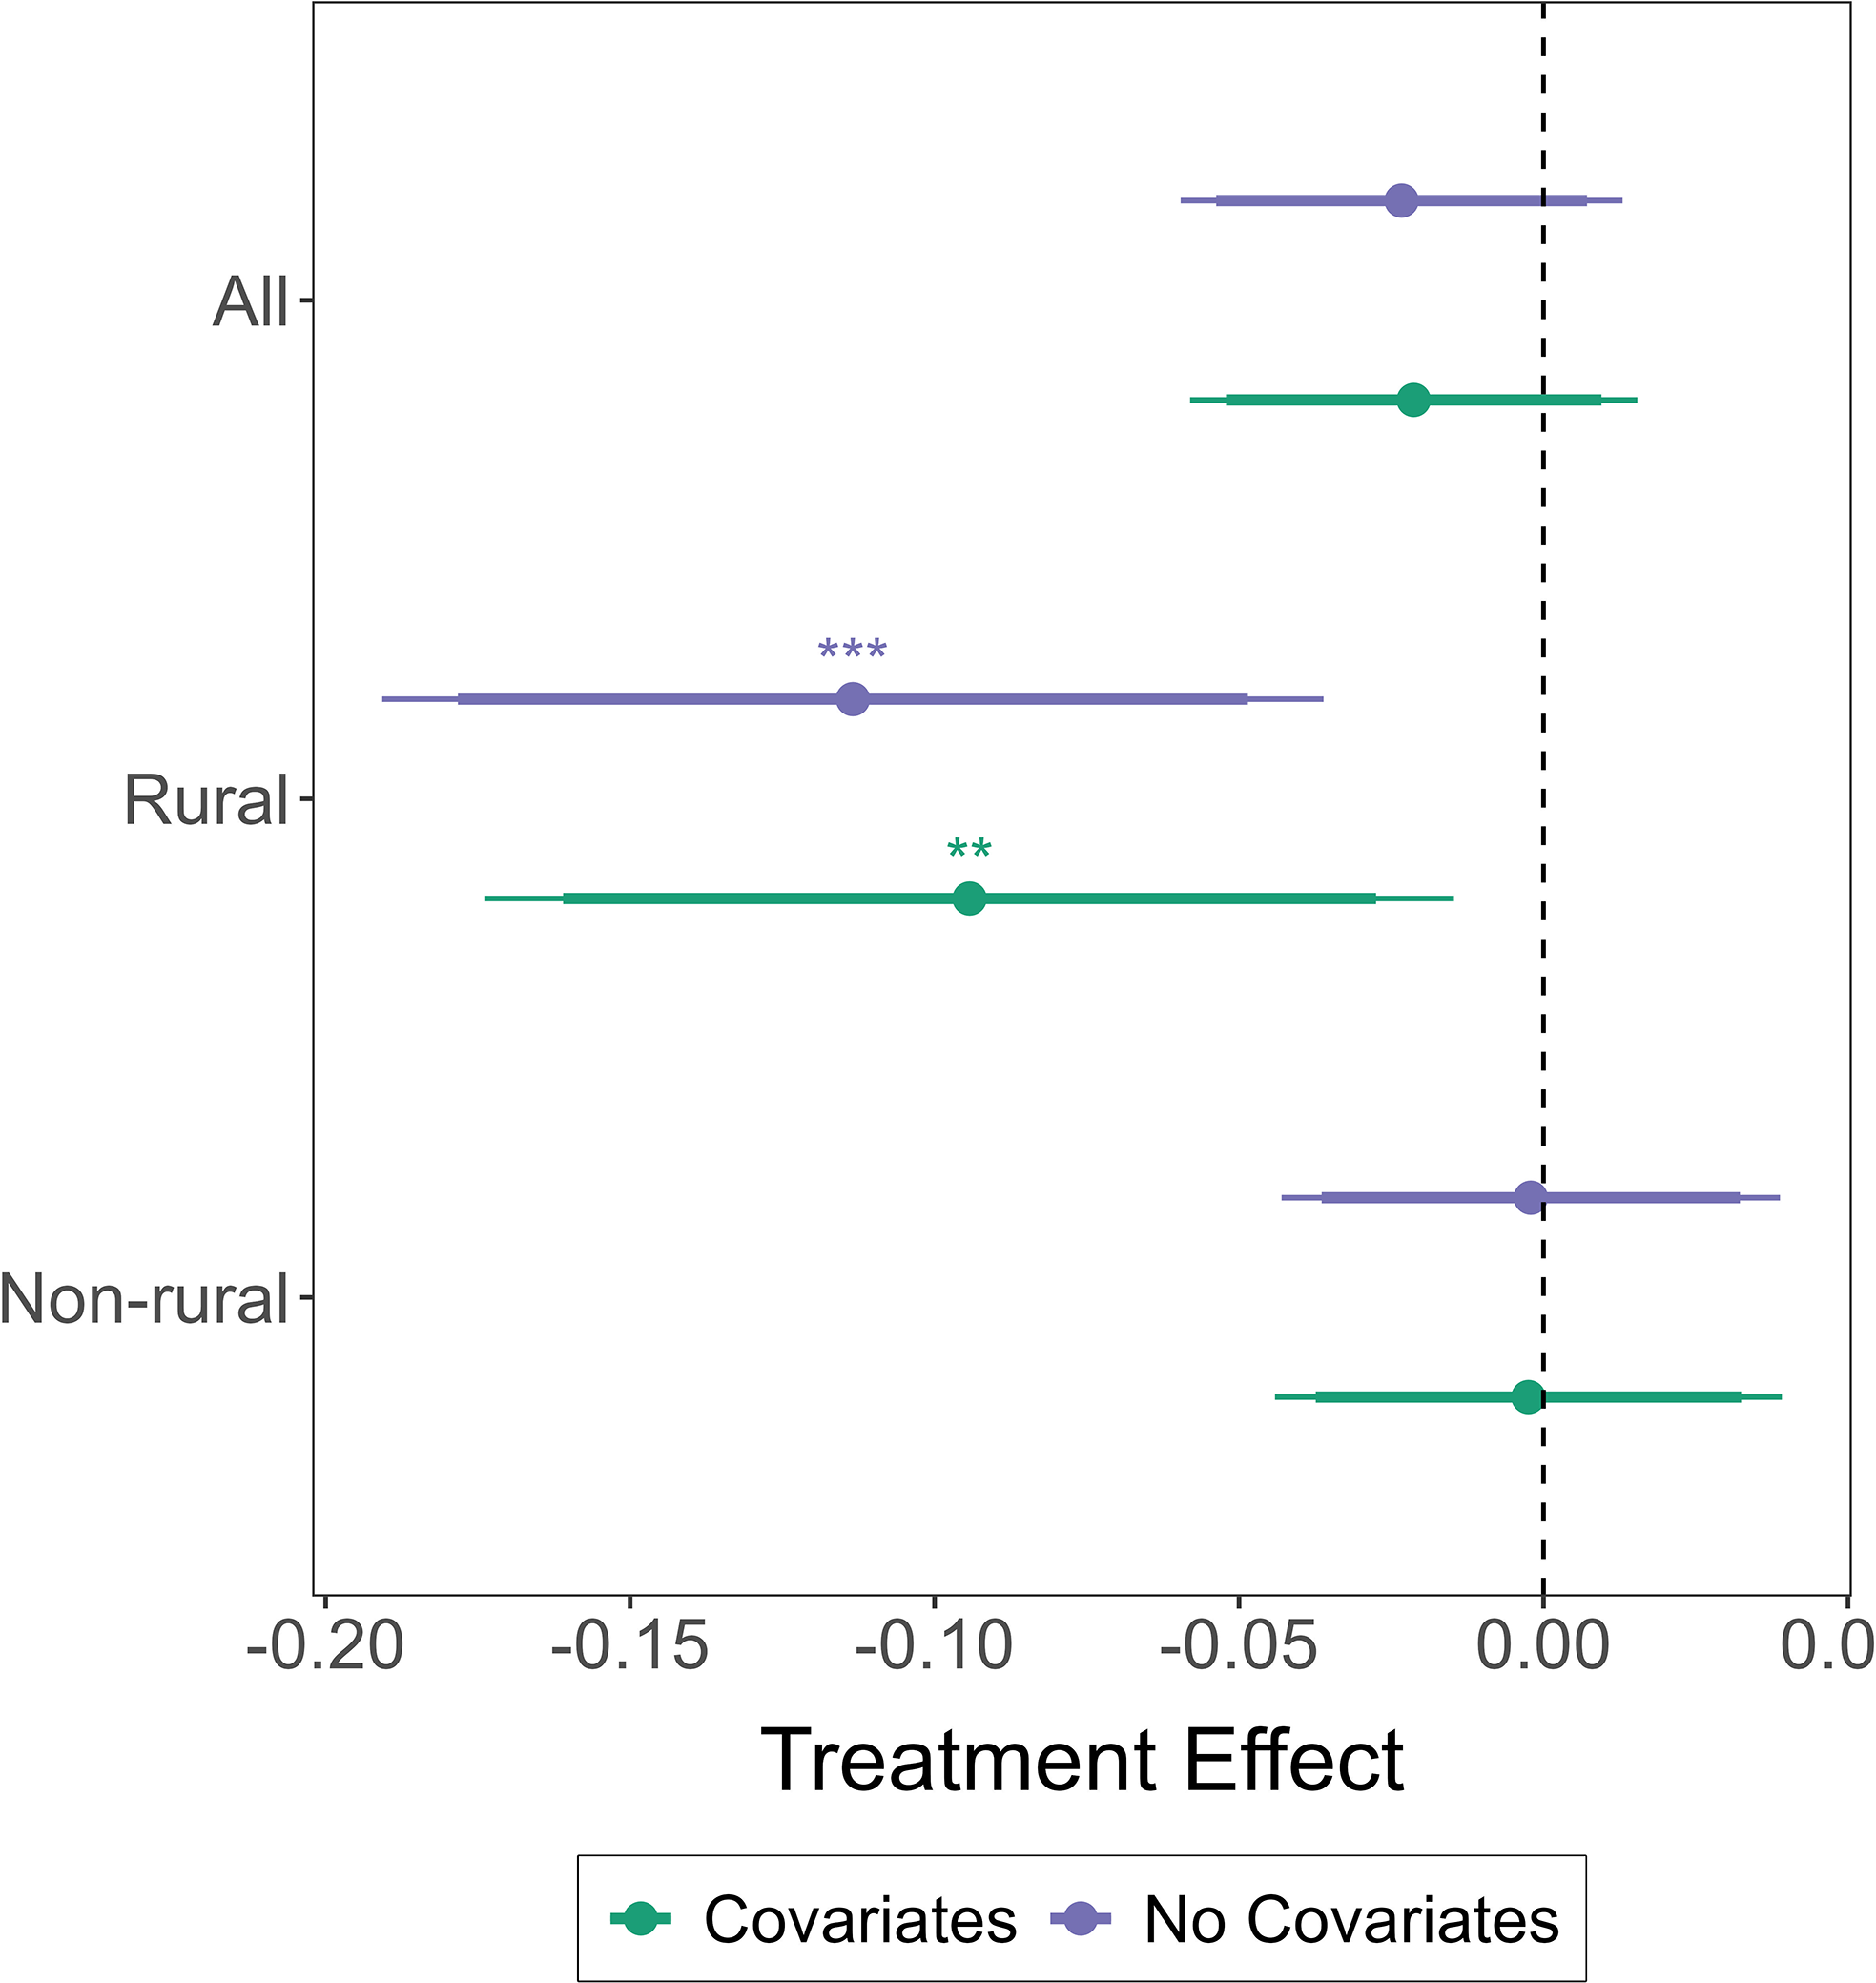
Treatment effect on carbon tax support.
Note: The figure shows the effect of the information provision treatment on support for carbon taxation. Thick inner bars denote 90% confidence intervals and thin outer bars denote 95% confidence intervals. See Table B2 in the Online Appendix for the full models. ***p < 0.01, **p < 0.05, *p < 0.1.

Treatment effect on perceptions of unequal treatment/unfairness of carbon taxes.
Note: The figures show the coefficient of the treatment on unequal treatment perceptions (left panel) and on unfairness beliefs of carbon taxation as it would fall onto those already disadvantaged by the government (right panel). Thick inner bars denote 90% confidence intervals and thin outer bars denote 95% confidence intervals. See Tables ***p < 0.01, **p < 0.05, *p < 0.1.

We start by looking at the effect of the treatment on support for carbon taxation (Figure 5). Again, we look at the binary variable measuring support for a carbon tax and run OLS models.Footnote 8 The overall effect of the treatment on carbon taxation support is negative, but statistically insignificant.Footnote 9 However, we can attribute the negative coefficient almost exclusively to the effect of the treatment on rural respondents. On average, the treatment lowers support for carbon taxation by around 10 percentage points among rural respondents, which is substantial. In contrast, the treatment effect on non-rural respondents is almost exactly zero. Furthermore, the difference between the treatment effects for rural and non-rural respondents is statistically significant at the 5% level. To check that this finding is not driven by model choices, we use alternative OLS models where we look at the full range of answer categories from 1 = Strongly oppose to 5 = Strongly support as well as models where we recode the answer into three categories (1 = Oppose, 2 = Neither support nor oppose, 3 = Support). The results hold (Tables C1 and C2 in the Online Appendix).Footnote 10
To probe the mechanisms behind the main treatment effect on carbon tax support, we look at whether the treatment affects perceptions about unequal treatment and unfairness beliefs. For this, we use the questions on unequal treatment perceptions by the government and unfairness beliefs of carbon taxation that we introduced in the observational patterns section. As before, we run OLS models. We find that the treatment increases perceptions of unequal treatment by the government (Figure 6, left panel). The effects do not differ substantially between rural and non-rural respondents – ie both groups perceive more unequal treatment.
When looking at whether the treatment raises beliefs about carbon taxes being unfair because they are mostly paid by those that have already been disadvantaged by the government, however, we only find an effect for rural respondents. The effect is only statistically significant at the 10% level but remains robust when adding our vector of covariates (Figure 6, right panel). Redoing our power analysis with these findings reveals that the lower statistically significant level of 10% among rural respondents is likely due to issues of power.Footnote 11 When running a causal mediation analysis (Imai, Keele, Tingley et al., Reference Imai, Keele, Tingley and Yamamoto2011), we also find that fairness beliefs about carbon taxes mediate the overall treatment effect on support for carbon taxation among rural respondents (Figure D2 in the Online Appendix).
Taken together, we find that although unequal treatment perceptions increase among all respondents due to the information provision on unequal transport spending, this only increases beliefs that carbon taxes are unfair because they are mostly paid by those that are already disadvantaged by the government among rural respondents. This is consistent with findings from the previous section: Rural respondents who harbour underlying resentments about unequal treatment by the government perceive a carbon tax as an unfair additional burden on rural communities. In contrast, we do not find a similar connection between unequal treatment perceptions and unfairness beliefs about carbon taxes for non-rural respondents.
Robustness checks
In line with the observational evidence, our treatment increases perceptions of unequal treatment, which in turn affects fairness perceptions of carbon taxes among rural citizens, and reduces support for carbon taxation. More precisely, our information provision experiment shows that: 1) Information on unequal regional transport spending increases perceptions of unequal treatment among all respondents; 2) unfairness perceptions of carbon taxes only increase among rural respondents; and 3) the treatment substantially lowers rural support for carbon taxation. Based on these findings, we have argued that fairness-based perceptions of unequal treatment by the state are an important driver of rural opposition to carbon taxes. In this section, we start by testing alternative explanations for these results. Furthermore, we test whether our results are driven by regional variation, check for heterogeneous treatment effects, and look at whether the findings differ by tax policy design.
Alternative mechanisms
First, it might be the case that our treatment simply increases perceptions of carbon tax exposure among rural respondents. In other words, instead of activating deep-rooted rural resentment about a double disadvantage of carbon taxation, an alternative explanation for our experimental finding could be that the treatment solely raises cost perceptions of carbon taxes among rural voters. To check this, we look at the effect of the treatment on the question about perceived carbon tax exposure. We find no statistically significant effect of the treatment on cost perceptions of rural respondents (Figure 7). Hence, our findings do not seem to be driven by the treatment increasing perceived personal costs associated with carbon taxation.
Treatment effect on cost and inequality perceptions among rural respondents.
Note: The figure shows the effect of the information provision treatment on perceptions being affected by a carbon tax and on inequality perceptions. Thick inner bars denote 90% confidence intervals and thin outer bars denote 95% confidence intervals. See Table ***p < 0.01, **p < 0.05, *p < 0.1.

Furthermore, rather than unequal treatment perceptions by the state, general inequality perceptions might account for the observed treatment effects on carbon tax preferences. If rural respondents have a higher awareness of general socio-economic inequality, they might be less likely to support regressive policies like carbon taxation. Hence, we have to test whether our treatment activates perceptions of inequality among rural respondents. To check this alternative mechanism, we look at a post-treatment item that asks people about the extent to which they agree with the following statement on an 11-point Likert scale from 0 (Strongly disagree) to 10 (Strongly agree): ‘Economic performance and average living standards are much higher in some regions of the UK than others’. We do not find evidence for the alternative explanation that our treatment drives inequality perceptions. The coefficients are positive, yet small, and they fail to reach statistical significance at the 10% level (Figure 7). Thus, the treatment-induced reduction in support for carbon taxation among rural respondents does not seem to be solely driven by increased general inequality perceptions.Footnote 12
Treatment heterogeneity
Second, we look at treatment heterogeneity. We differentiate between four different types of heterogeneity: geographical variation, general subgroup effects, subgroup effects among rural respondents, and variation by tax policy design.
Geographical variation
We start by focusing on geographical variation. Our treatment shows that per-person spending on public transport is particularly high in London. As London is the central metropolitan region and the epitome of urbanism in the UK, we have argued that the treatment particularly highlights unequal treatment along the urban-rural cleavage. However, one competing explanation for the differences in treatment effects on carbon tax support between rural and non-rural respondents could be that the results are driven by people in London. To check this, we rerun our analysis but exclude people from London, who make up around 11.4% of the sample. Figure D3 in the Online Appendix presents the results. We find the same pattern as in the main analysis: the treatment substantially reduces support for carbon taxation among rural respondents, whereas it has no effect on levels of support for non-rural respondents.
Furthermore, the variation in the treatment effect could be driven by regional variation rather than by differences between rural and non-rural respondents. More precisely, respondents that are shown information on unequal transport spending might be more likely to oppose additional carbon taxes if they are from one of the regions that receives lower levels of spending. We check this by running the analysis for each individual region and ordering them by government transport spending per person as shown in the information provision treatment. We do not find that the negative treatment effect on carbon tax preferences is systematically stronger among regions that receive less government spending on transport (Figure D4 in the Online Appendix). The only two regions where we find that support among the treatment group is significantly lower are both in the top half of regions by transport spending (the West Midlands and the East of England).
General subgroup analysis
We check whether the general effect of our treatment is moderated by other important socio-economic characteristics. This is crucial to examine whether our observed differences between rural and non-rural respondents stem from rurality itself or from compositional aspects of the rural population.
Crucially, all the moderating factors we look at in this section are measured pre-treatment.Footnote 13 We start by looking at age and income as these factors might serve as alternative explanations for our observed experimental effects. Table D1 in the Online Appendix shows the results of the interactive models. While older and poorer people are on average less supportive of carbon taxation, the interaction effects with the treatment are statistically insignificant. Thus, the treatment effect does not vary significantly along these factors.
Next, we look at subgroup effects by political orientation. We use an item that asks people about their political self-placement on a left-right scale ranging from 0 (Left) to 10 (Right). While self-declared right-wing respondents are less likely to support carbon tax increases, the negative effect of the treatment is strongest among people who identify as leftist. The interaction effect is statistically significant at the 10% level. There are several potential explanations for this interaction effect. For instance, it could be the case that leftist respondents hold stronger equal treatment norms and are therefore more likely to react to violations of these norms. Alternatively, the interaction might exist due to a floor effect with right-wing respondents already being considerably more opposed to carbon taxation in the baseline. Crucially, these results cannot explain our main finding about the differences between rural and non-rural respondents. On average, the self-placement on the left-right scale is more to the right among rural respondents (4.5) than among non-rural respondents (4.3). Thus, the negative treatment effect on carbon tax support among rural respondents might be a conservative estimate as it is dampened by the fact that rural respondents are slightly more rightist. We also check whether the treatment effect is moderated by trust in government. While people with higher trust are more likely to support carbon taxes (Fairbrother Reference Fairbrother2019; Fairbrother, Johansson Seva and Kulin Reference Fairbrother, Johansson Sevä and Kulin2019), the interaction effect is insignificant. Thus, our findings for rural respondents are unlikely to be driven by a general lack of trust in the government. Furthermore, these findings speak against concerns that our measure of whether somebody lives in a rural area is subjective. For instance, one might argue that respondents with more rightist attitudes and lower trust are more likely to self-select into stating that they live in a rural area. If these respondents are more likely to have lower support for carbon taxation due to the treatment, then this might explain the treatment effect. However, we do not find any evidence for such subgroup effects.
Subgroup effects among rural and non-rural respondents
In the previous subsections, we did not find evidence that the general treatment effect varies significantly by region. Furthermore, the effect of the treatment did not vary by characteristics that are more common in rural areas. This indicates that compositional aspects of rurality do not account for our findings. We probe this further by checking whether there is heterogeneity in the treatment effect among rural and non-rural respondents. For rural respondents, this means reducing the sample to around 600 respondents. Thus, statistical power drops, and the results of the interaction effects should be interpreted with caution.
We start by looking at regional variation in the treatment effect among rural and non-rural respondents. On average, we have N = 50 for each region due to the reduced sample size. In other words, we do not have the statistical power to investigate treatment effects among rural respondents in each region individually. To be able to see whether the effect varies between regions that receive more or less transport spending per person, we perform a simple median split. We find that in both groups with higher and lower transport spending, the treatment reduces support for carbon taxes among rural respondents (Figure D5 in the Online Appendix). Furthermore, there is a similar lack of variation in the treatment effect when comparing non-rural respondents in regions with higher and lower transport spending (Figure D6 in the Online Appendix). Together, these results provide further support for our claim that the findings are not primarily driven by regional variation.
We also rerun the previous interaction models to check whether the treatment effect among rural and non-rural respondents varies by socio-economic characteristics. Among rural respondents, we do not find evidence that the treatment effect varies by age and political trust (Table D2 in the Online Appendix). We do find that the treatment effect is stronger among rural respondents with higher incomes, as well as among more leftist respondents. As mentioned before, there are several potential explanations for these findings, such as floor effects among rightist respondents or varying fairness norms among leftist respondents. Crucially, the results highlight that the effect among rural respondents does not stem from compositional aspects, as the rural population tends to have slightly lower incomes and is more rightist. For non-rural respondents, we do not find any evidence of subgroup effects (Table D3 in the Online Appendix).
Together, these findings highlight three points. First, the observed treatment effects in rural and non-rural areas are independent of whether respondents live in a region that received relatively higher or lower transport spending per person. Thus, the observed effects among rural respondents do not originate from the distribution of rural respondents in the different regions. Instead, and in line with our argument, the treatment activates general perceptions of unequal treatment and unfairness of carbon taxation among rural respondents. Second, our findings cannot be explained by compositional aspects of the rural population (Beiser-McGrath and Beiser-McGrath Reference Beiser-McGrath and Beiser-McGrath2020). Third, the differences in the treatment between rural and non-rural respondents cannot be explained by low trust and rightist attitudes in rural areas making respondents react more strongly to the treatment. Thus, self-selection into (declared) rurality is unlikely to drive our results either.
Tax policy design
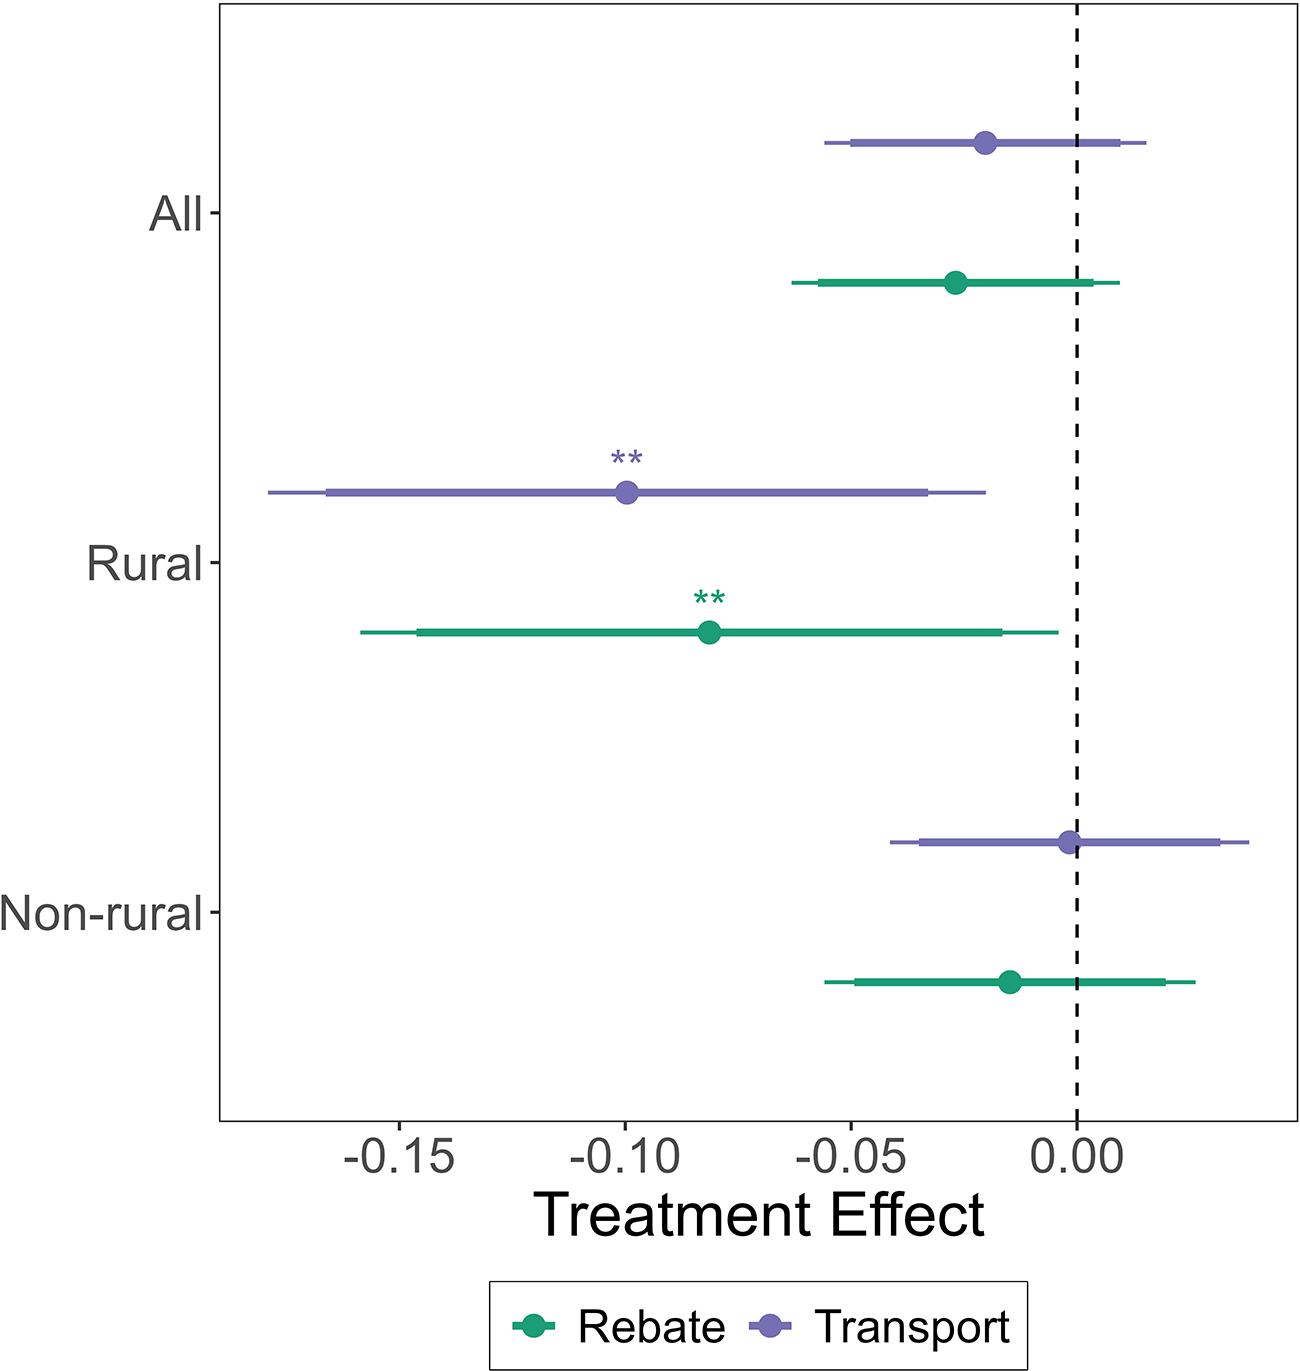
To check whether our findings vary by tax policy design, we look at two additional post-treatment survey questions. Both focus on the role of revenue recycling (Beiser-McGrath and Bernauer Reference Beiser-McGrath and Bernauer2019). First, we look at a tax policy design where the revenue raised is used to fund a general tax rebate. We find the same empirical pattern as in the main experiment: The treatment substantially lowers support for carbon taxation among rural respondents, while the effect is insignificant for non-rural respondents (Figure 8).
Treatment effect on carbon tax support, different policy designs.
Note: The figure shows the effect of the information provision treatment on support for carbon taxation. Thick inner bars denote 90% confidence intervals and thin outer bars denote 95% confidence intervals. See Table ***p < 0.01, **p < 0.05, *p < 0.1.

Second, we test whether the effects differ for a carbon tax policy design where the revenue raised is used to improve access to high-quality public transport across the UK. Again, our findings are similar to the main results (Figure 8). One potential explanation for why this policy design does not dampen rural-based opposition is that the wording of the revenue recycling mechanism we ask respondents about is too general. Based on past experiences, rural respondents might think that government spending to improve access to high-quality transport will mainly benefit cities.Footnote 14 An alternative explanation is that perceptions of unequal treatment by the state in rural communities are deep-rooted and hard to shift. Thus, it may require a more encompassing and multifaceted approach to overcome unfairness perceptions and boost rural support for carbon taxation.
Conclusion
In this article, we provide a novel explanation for rural backlashes against carbon taxation. We argue that when people living in rural communities perceive unequal treatment by the state, they are significantly less supportive of carbon taxes. This is because they believe that carbon taxes unfairly punish those that have already been disadvantaged by the state. Put another way, when ruralites believe they have been disadvantaged by the government compared to those living in urban areas, they find it unfair that they have to bear a disproportionate share of the costs of carbon taxation.
We test our argument by carrying out a survey with a representative sample of around 3000 respondents from the United Kingdom. We find both observational and experimental evidence in support of our argument. For those living in rural areas, increased perceptions of unequal treatment by the state reduce the perceived fairness of carbon taxes and substantially lower support for carbon taxation. Our findings highlight the deep-rooted nature of unequal treatment perceptions in rural areas and how this can underpin strong opposition to carbon taxes in these communities.
The study contributes to previous research on fairness perceptions and carbon tax preferences (as summarised in Maestre-Andrés, Drews and van den Bergh Reference Maestre-Andrés, Drews and van den Bergh2019) by emphasising how procedural concerns around unequal treatment by the state are an important determinant of perceptions of carbon tax fairness and policy acceptability in rural areas. Our results also align with new research in the United States showing that rural resentment is a key driver of rural opposition to environmental policies coming from the federal government (Hunnicutt, Munis and Nemerever Reference Hunnicutt, Munis and Nemerever2025; Munis and Nemerever Reference Munis and Nemerever2025). This is suggestive that perceptions of unequal treatment by the state in rural communities may hamper support for a wider range of environmental policies – ie our argument and findings could apply beyond the specific case of carbon taxation.
Our findings also bring into sharp focus the challenge facing policymakers looking to use carbon taxation to help mitigate climate change. They imply that unequal treatment perceptions may need to be tackled to garner widespread support for carbon taxation in rural communities. Our additional analysis looking at carbon tax policy designs shows that compensating rural areas through revenue recycling schemes may not be sufficient to overcome opposition. Governments may therefore need to look at other approaches that can more directly address rural resentments and perceptions of unequal treatment. These could focus on reducing regional disparities in government spending (eg boosting spending on public transport in rural areas) or they could focus on making rural communities feel less politically marginalised (eg by taking greater account of rural interests and identities in the formulation of environmental policies).
The article points to several interesting avenues for future research. First, the interaction with electoral politics and partisanship could be explored. Rural resentment has been strongly associated with the rise of right-wing populism in the US and Europe (Cramer Reference Cramer2016; Ford and Jennings Reference Ford and Jennings2020). Recent research has also shown that right-wing populist parties have taken an increasingly adversarial stance to climate change, using it as a wedge issue (Dickson and Hobolt Reference Dickson and Hobolt2025). Future research could investigate whether right-wing populist parties have actively reinforced perceptions of unequal treatment and opposition to environmental policies in rural areas. Second, future research could look more closely at the bind facing policymakers aiming to build a broad base of support for carbon taxation. In particular, there is a need for more empirical evidence on the changes to government policies and processes that could help alleviate perceptions of unequal treatment in rural areas. Follow up survey experimental research could also look at whether the provision of specific information could help to reduce perceptions of unequal treatment among rural respondents (eg providing information on how many people from rural areas utilise the public transport networks of major urban areas). Lastly, future work could examine the broader question of whether perceptions of unequal treatment by the state affect support for governments’ environmental policies beyond carbon taxation.
Supplementary material
The supplementary material for this article can be found at https://doi.org/10.1017/S1475676526101054
Data availability statement
Data and replication code are available at https://osf.io/k3cjw.
Acknowledgements
We would like to thank Alessandro Nai for his excellent editorial guidance on the paper and the three anonymous reviewers for their helpful comments and suggestions. For providing detailed and insightful comments on the experimental design and earlier versions of the paper, we would like to thank Leo Ahrens, Björn Bremer, Jack Blumenau, Lukas Haffert, Alex Kuo, Aidan Miao, Bilyana Petrova, and Theresa Wieland. We also thank participants at research seminars at King’s College London and University of Oxford and participants at the In_equality Conference 2024 in Konstanz, the UCL workshop on ‘The Politics of Economic Policy’ in May 2024, the CES Conference 2024 in Lyon, and the LEAPP workshop in September 2024 for their valuable feedback.
Funding statement
We are grateful to the James M. and Cathleen D. Stone Centre on Wealth Concentration, Inequality, and the Economy at University College London for an External Research Support Grant (ERSG/2324/HOP) to fund the survey for this article.
Competing interests
No conflicts of interest to disclose.
Ethical standards
Our pre-analysis plan is registered via the OSF Preregistration registry (https://osf.io/fc68a). Ethical clearance for this project is granted via the King’s College London’s Minimal Risk Procedure (Reference number MRA-23/24-42764).







 Open access

