


Introduction
Since 2016, the thickness of the permafrost active layer and permafrost temperature have been designated as essential climate variables by the World Meteorological Organization (GCOS 2022). Both variables are heavily influenced by the presence of snow on the ground, which decouples soil temperature from atmospheric temperature (e.g. Zhang Reference Zhang2005), affecting the soil thermal regime due to its insulating capacity, which is dependent on snow thickness and its properties. This is particularly important in Antarctica, where vegetation is sparse, except for some patches of lichens and mosses. Therefore, the use of instrumentation to measure and monitor snow cover is common in frozen ground monitoring networks, such as the Global Terrestrial Network for Permafrost (GTN-P; https://gtnp.arcticportal.org), because although it is not a mandatory variable within the GTN-P protocol, its relevance for interpreting ground thermal dynamics has led many researchers to include it in their monitoring designs.
There are simple, low-cost methods to approximate snow thickness from indirect air temperature measurements at different heights above the ground (Lewkowicz Reference Lewkowicz2008), and even from luminosity (Tutton & Way Reference Tutton and Way2021). These methods have demonstrated a good cost-effectiveness ratio for approximating snow thickness, considering that precise determination of snow thickness is not always necessary. Instead, it is crucial to determine whether the snow thickness has exceeded a critical threshold, rendering it an insulating layer between the soil and the atmosphere based on its properties (e.g. Zhang Reference Zhang2005). This critical thickness, varying between 30 and 80 cm depending on snow properties (density, water content, etc.), could be easily determined using these methods with sufficient numbers of sensors placed at an appropriate height above the ground (García-Maroto et al. Reference García-Maroto, Durán and de Pablo2024).
However, several circumstances have necessitated evaluating other instrument options, including 1) numerous issues with traditional temperature-based devices used in Antarctic frozen ground monitoring stations over time, 2) increased costs of temperature miniloggers and 3) the need for a temporal study of snow-cover evolution in order to analyse other soil parameters, such as thermal regime or moisture, and even heaving and subsidence processes caused by freeze-thaw cycles (Gruber Reference Gruber2020, de Pablo et al. Reference de Pablo, Ramos, Vieira, Molina, Ramos and Maior2024). Therefore, it was necessary to consider using other devices in order to maintain a good cost-effectiveness ratio, avoiding high-cost commercial sensors and loggers, which also require additional technology, such as solar panels and batteries, complicating and increasing the cost of establishing and maintaining these stations.
Beyond satellite-based remote sensing techniques (e.g. Tedesco et al. Reference Tedesco, Derksen, Deems, Foster and Tedesco2015, Larson & Small Reference Larson and Small2016, Teleubay et al. Reference Teleubay, Yermekov, Tokbergenov, Toleubekova, Igilmanov, Yermekova and Assylkhanova2022, Tanniru & Ramsankaran Reference Tanniru and Ramsankaran2023) or even cosmic-ray detectors (e.g. Sigouin & Si Reference Sigouin and Si2016, Bogena et al. Reference Bogena, Herrmann, Jakobi, Brogi, Ilias and Huisman2020), various types of sensors are used in studies, including those based on ultrasound (e.g. Ryan et al. Reference Ryan, Doesken and Fassnacht2008, Wangdi et al. Reference Wangdi, Wangmo, Sonam, Lhamo and Muramatsu2016), lidar (e.g. Deems et al. Reference Deems, Painter and Finnegan2013), lasers (e.g. Prokop et al. Reference Prokop, Schirmer, Rub, Lehning and Stocker2008, de Haiji Reference de Haiji2011, Voordendag et al. Reference Voordendag, Goger, Prinz, Sauter, Mölg, Saigger and Kaser2024) and images (e.g. Garvelmann et al. Reference Garvelmann, Pohl and Weiler2013, Filhol et al. Reference Filhol, Perret, Girod, Sutter, Schuler and Burkhart2019, Bongio et al. Reference Bongio, Arslan, Tanis and de Michele2021, Breen et al. Reference Breen, Currier, Vuyovich, Miao and Prugh2024). The complexity of image acquisition and processing and the cost of laser scanning systems make acoustic (ultrasound) sensors some of the most viable options, as they are relative simple in terms of measurements and data processing can be obtained at low cost for extended use in GTN-P frozen ground monitoring networks. Among the various available techniques, this study focuses on using ultrasonic sensors as a practical and robust solution suitable for long-term monitoring in remote regions. The performance of the proposed device is specifically compared with temperature-based snow poles, a widely used method in permafrost studies due to their simplicity and affordability, albeit with limited temporal resolution. Given the technical and analytical complexity of alternative approaches, we aimed to evaluate a cost-effective configuration that is easy to deploy and maintain and is capable of providing high-resolution snow-depth data with a simple processing pipeline. Consequently, a seemingly robust and relatively low-cost configuration was developed, consisting of an ultrasound sensor and a small datalogger, tested at 12 stations in the South Shetland Islands, Antarctica, from early 2023 to early 2024.
This study presents the deployment and performance of an ultrasonic snow-depth measurement system under harsh Antarctic field conditions. Here, we evaluate its operational reliability, processing workflow and data quality in comparison with snow pole methods, and we explore the seasonal evolution of snow cover at 12 monitoring sites during the 2023–2024 period.
Study areas
This study was conducted at 12 frozen ground monitoring stations of the PERMATHERMAL network located on Livingston and Deception islands (de Pablo Reference de Pablo2023) in the South Shetland Archipelago, situated in the western sector of the Antarctic Peninsula (Fig. 1). These stations are part of the GTN-P network and are equipped with sensors for monitoring ground thermal conditions at various depths, surface temperature and air temperature. Additionally, they are equipped with wooden snow poles supporting iButton DS1922L miniloggers to record air temperatures at different heights above the ground (2.5, 5, 10, 20, 40, 80 and 160 cm), from which snow thickness can be estimated (Lewkowicz Reference Lewkowicz2008). Each of these stations has been equipped with new low-cost devices for measuring snow thickness using ultrasound technology.
Location map and photographs of the 12 snow cover monitoring stations on Livingston and Deception Islands, South Shetland Islands, Antarctic Peninsula region (letter codes as in Table I).

The sites are distributed as follows (Fig. 1): six near the Spanish Antarctic Base ‘Juan Carlos I’ on the Hurd Peninsula of Livingston Island, along an altitudinal transect from the raised beaches (15 m above sea level (a.s.l.)) to the summit of Mount Reina Sofía (274 m a.s.l.), in areas with different wind exposures (Table I); one in the Limnopolar Lake basin on Byers Peninsula, Livingston Island (84 m a.s.l.), in a slightly depressed area with high snow accumulation due to a lack of orographic protection; and five on an elevated plain (85 m a.s.l.) near Crater Lake, of volcanic origin, close to the Spanish Antarctic Base ‘Gabriel de Castilla’ on Deception Island. These stations are all in the same environment with similar orographic protection, and they are less than 100 m distant from each other.
Main settings of the ground surface temperature monitoring sites on Livingston and Deception Islands (simplified from de Pablo et al. Reference de Pablo, Ramos, Vieira, Molina, Ramos and Maior2024, after Ferreira et al. Reference Ferreira, Vieira, Ramos and Nieuwendam2017).

Livingston Island is an elongated island (73 × 34 km) ~950 km south of Tierra del Fuego. It covers ~974 km2, of which only 10% is seasonally ice-free, primarily along the coasts and Byers Peninsula (61 km2), with additional smaller capes and peninsulas (López-Martínez et al. Reference López-Martínez, Thomson, Arche, Svante, Ellis-Evans and Hatway1996, Georgiev et al. Reference Georgiev, Velev, Dochev, Metodiev, Balkanska, Sabeva and Georgiev2023). The rest of the island is covered by glacier masses (Molina et al. Reference Molina, Navarro, Calvet, García-Sellés and Lapazaran2007). The major mountain ranges include the Tangra Mountains, with peaks reaching up to 1700 m a.s.l., while other significant peaks range from 600 to 800 m in altitude. South of Livingston Island is located Deception Island, an active volcano associated with the Scotia Arc subduction zone (Geyer et al. Reference Geyer, Álvarez-Valero, Gisbert, Aulinas, Hernández-Barreña, Lobo and Marti2019, Reference Geyer, Pedrazzi, Almendros, Berrocoso, López-Martínez, Maestro, Smellie, Panter and Geyer2021). The island, ~16 km in diameter in its emergent part, has a horseshoe shape due to a collapsed caldera flooded by the sea through a 400 m-wide passage known as Neptune’s Bellows. The caldera’s rim features elevated terrain, with the highest point being Mount Pond at ~540 m a.s.l. More than 50% of the island is glacier-covered, although many glaciers are not clearly visible due to them being covered by volcanic ash and pyroclasts from eruptions between 1967 and 1970 (Geyer et al. Reference Geyer, Pedrazzi, Almendros, Berrocoso, López-Martínez, Maestro, Smellie, Panter and Geyer2021).
Although the study stations are distributed across both islands in locations with varying orography and are associated with different types of materials and geomorphological environments (Table I), the meteorological conditions are not very different among them and are significantly less extreme than those on the Continental Antarctic due to the maritime influence. The stations are in a cold maritime climate zone, with mean air temperatures between −1°C and −3°C, although minimum temperatures can drop below −25°C in winter, and summer temperatures can exceed 15°C (Rochera et al. Reference Rochera, Justel, Fernández-Valiente, Bañon, Rico and Toro2010, Bañón & Vasallo Reference Bañon and Vasallo2015). Precipitation, ~500 mm/year, generally falls as snow, although it can be liquid during the summer months (Bañón & Vasallo Reference Bañon and Vasallo2015), keeping the region snow-covered for 8 or more months each year (Fassnacht et al. Reference Fassnacht, López-Moreno, Toro and Hultstrand2013). Between 2013 and 2016, some areas remained snow-covered throughout the summer (e.g. de Pablo et al. Reference de Pablo, Ramos and Molina2014, Reference de Pablo, Ramos and Molina2017, Ramos et al. Reference Ramos, Vieira, de Pablo, Molina, Abramov and Goyanes2017, Reference Ramos, Vieira, de Pablo, Molina and Jimenez2020), linked to the end of a cooling period in the Antarctic Peninsula sector (e.g. Oliva et al. Reference Oliva, Navarro, Hrbáček, Hernandéz, Nývlt and Pereira2017, Sancho et al. Reference Sancho, Pintado, Navarro, Ramos, de Pablo and Blanquer2017). Snow cover is highly heterogeneous, being heavily influenced by terrain and wind exposure. Average wind speeds in the area are ~14 km/h, with maximum speeds exceeding 60 km/h and frequent storms reaching over 100 km/h, and winds up to 180 km/h have been recorded (Bañón & Vasallo Reference Bañon and Vasallo2015). These winds contribute to the redistribution of snow, given the sparse vegetation beyond lichens and mosses (e.g. Fassnacht et al. Reference Fassnacht, López-Moreno, Toro and Hultstrand2013), resulting in recorded snow thicknesses as low as 30 cm in some stations, whereas others nearby might exceed 120 cm in the same period.
Instruments, data and methods
Low-cost ultrasonic sensor
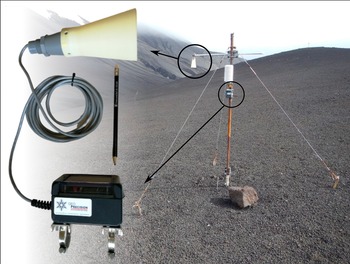
The ultrasonic sensor used in this study is the self-cleaning, high-resolution, 42 kHz MB7574-SCXL-Maxsonar-WRST7 by MaxBotix (Fig. 2). It can measure distances between 500 and 5000 mm (detection range) with a resolution of 1 mm/m and is designed to operate at temperatures ranging from −40°C to +65°C, with internal temperature compensation, as specified by the manufacturer (MaxBotix, Inc. n.d.). The self-cleaning system activates before each measurement, involving a slight heating of the transducer to evaporate any moisture or condensation on the device, although it is not capable of removing solid particles or dust. The sensor is equipped with an extended cone (made from plastic by a 3D printer and provided by the manufacturer) to protect the sensor from ice accumulation. The sensor used in this study is commercially available, and its technical specifications and laboratory-calibrated performance are provided by the manufacturer. Our goal here is not to test its intrinsic design but to assess its suitability for field use in Antarctic conditions. The sensor is mounted with a metal clamp screwed to a 2 cm-diameter, 1 m-long aluminium tube. This tube is attached to a vertical wooden or metal mast using metal clamps, positioned between 160 and 250 cm above the ground, depending on the station, to ensure a height of at least 50 cm above the maximum expected snow thickness at each location. The sensor is placed 75–80 cm away from the vertical mast to avoid interference, as recommended by the manufacturer for installations where the sensor height is less than 250 cm above ground, maintaining a mounting clearance angle of ≥ 11.3°. In some cases, the end of the aluminium arm holding the sensor is secured to the ground with ropes attached to metal stakes to prevent excessive vibration caused by the wind, ensuring sufficient clearance angles to avoid interference with the ultrasonic signal.
Photograph of one of the monitoring stations showing the installation setting of a MB7574-SCXL-Maxsonar MaxBotix ultrasonic sensor with the protective cone attached, at the end of a horizontal mast to keep a > 75 cm distance from the main mast where the Geoprecision-Box datalogger was installed to avoid interference and erroneous distance measurements to the ground surface.

Datalogger
This sensor is connected to a Geoprecision Box model compact datalogger with a polycarbonate housing (80 × 113 × 60 mm), capable of storing up to 500 000 measurements in its 2048 kB non-volatile memory (Fig. 2). It is powered by a 3.6 V lithium D-cell battery with an estimated lifespan of up to 9 years for a configuration of hourly measurements with the self-cleaning system activated. Data are downloaded remotely via a 433 MHz radiofrequency antenna connected to a Windows-operated device running the Flexgate 2 program, developed by the manufacturer. This software enables configuring of data collection, starting and stopping of the device and downloading of data without handling the measuring device or the datalogger or disturbing the existing snow cover during data downloading. A log of activity for each connection with each device is stored along with the data. This enables tracking of the memory capacity and battery life of each device, facilitating the planning of the next maintenance campaign. This is especially important as these devices are installed in remote locations that are visited at most once a year.
Data and data processing
The downloaded data correspond to a time series starting on various dates between 9 February and 9 March 2023 and ending between 21 January and 16 February 2024. The data are in ASCII format in comma-separated value (.csv) files, pre-processed to remove control rows and unnecessary headers. The resulting file consists of three columns: the first for date and time, the second for distance to the ground in millimetres and the third for the device temperature in degrees Celsius. As these devices measure the distance to the surface, snow-thickness values are obtained through processing, which involves removing outliers (spurious data) and both high- and low-frequency noise, then converting distance to snow height considering that the sensors were installed at an unspecified height during the snow-free period. We developed an algorithm to process the data using R (R Core Team 2022) in the RStudio environment (Posit Team, Reference Team2024) to enable 1) outlier removal, 2) high- and low-frequency noise elimination, 3) defining a reference level corresponding to the sensor installation height, 4) calculating snow thickness and 5) saving the results in an ASCII .csv file.
To calculate snow depth from sensor distance measurements to the surface, an R script was developed (Table II; de Pablo & Rosado Reference de Pablo and Rosado2025). This script preprocesses the raw data as downloaded from the datalogger, but it can also read a previously pre-processed file. The script initially cleans the data by removing values of 500 and 5000 mm, corresponding to the sensor’s minimum and maximum ranging thresholds (L1). It then filters out outliers using a Hampel filter (Hampel Reference Hampel1974), which relies on the median absolute deviation. We used a window of 50 measurements and a threshold of 1σ, which effectively reduces a significant portion of signal noise (L2). All removed values are linearly interpolated according to user-defined settings. In our case, interpolation was applied only if the missing values spanned fewer than 24 continuous measurements; otherwise, gaps were left in the data series. To eliminate high-frequency noise (H), the data are smoothed by calculating the centred daily moving average (24 hourly values), which are considered the final clean signal values for calculating snow depth. This moving average is only applied to periods with data, preserving gaps resulting from extended low-frequency noisy signals. Thus, to convert the distance to the ground into snow depth, the reference level, which is the sensor’s installation height, must be established. This is done by calculating the median of the values during the first 24 h of the previously calculated moving average, assuming that no snow is present at the site during this period. This reference value is subtracted from each hourly measurement (those obtained after applying the moving average filter). All negative values, interpreted as snow-free conditions within this method, are assigned a value of zero to ensure consistency. Other users of these devices may adapt this step if they prefer to retain negative values or to handle them differently. By default, snow depth is calculated in millimetres and centimetres. After computing daily statistics (maximum, minimum, mean values and standard deviations) for both the clean data (without L1 and L2 noise) and the snow depth, the results are saved in an ASCII file. This script also generates and saves scatter plots and box-and-whisker diagrams of the data at various stages of processing.
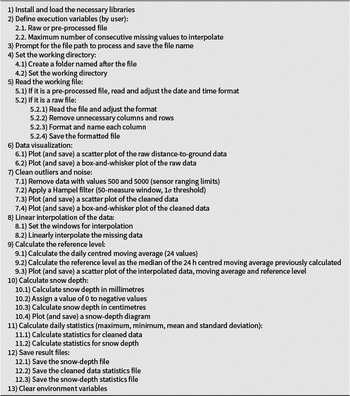
Structure and actions of the R script created to process ultrasonic sensor data, clean the signal from noise and calculate snow depth, generating various plots of the data at each stage of processing and providing statistical calculations regarding the cleaned and final data. R script and sample dataset are available from de Pablo & Rosado (Reference de Pablo and Rosado2025).

Snow poles
To compare the results obtained with ultrasonic sensors to those from snow poles, we also processed the data recorded by snow pole installations at the same stations. These snow poles consist of vertical wooden masts, chosen for their low thermal conductivity to minimize thermal bridging between sensors and to avoid warming or cooling effects from ambient conditions. The masts are equipped with air temperature sensors positioned at fixed heights: 2.5, 5, 10, 20, 40, 80 and 160 cm above the ground surface.
The sensors used are water-resistant miniaturized iButton devices (Maxim DS1922L), with a resolution of 0.0625°C and an accuracy of ± 0.5°C, recording data every 3 h. Temperature records from each sensor were processed to determine whether they were covered by snow, based on daily temperature variability. A sensor was considered snow-covered when its diurnal temperature range was less than 1°C or uncovered when it exceeded that range (Lewkowicz Reference Lewkowicz2008, de Pablo et al. Reference de Pablo, Ramos and Molina2014). Snow depth was then estimated as the mid-point between the height of the uppermost covered sensor and the lowest uncovered one. The vertical resolution of this method is inherently limited by the spacing between adjacent sensors in the array, which causes the estimated snow depth to vary in discrete steps. Furthermore, the failure of one or more sensors - particularly those near the snow surface - can significantly compromise the accuracy and resolution of the resulting time series. The resulting time series were manually reviewed to remove spurious values and outliers.
Comparative analysis
To complement the visual comparison between snow-depth estimates from snow poles and ultrasonic sensors, a set of quantitative metrics was also calculated for each station and method. These include 1) the number of days with snow cover, 2) the maximum annual snow depth, 3) the mean annual snow depth and 4) the Snow Index, defined as the cumulative sum of daily mean snow-depth values over the snow season in cm·day (Karunaratne & Burn Reference Karunaratne, Burn, Phillips, Springman and Arenson2003, de Pablo et al. Reference de Pablo, Ramos and Molina2017, Ramos et al. Reference Ramos, Vieira, de Pablo, Molina and Jimenez2020). These parameters were computed independently for both measurement methods and then compared station by station. In addition, correlation analyses were performed to assess the overall agreement between the two datasets.
Signal noise filtering and characterization
To assess signal reliability, a process of two-tier noise filtering and analysis was applied. First, low-frequency noise was defined as all readings equal to 500 or 5000 mm (instrumental detection limits), as well as values outside the range 5th to 95th percentile ± 250 mm, computed from valid data. The number of events, their duration and amplitude and the proportion of affected records were calculated per station (Table III). Second, high-frequency noise was assessed on the filtered signal using the absolute difference between hourly values. Values exceeding the mean + 3σ were flagged, and summary statistics (mean, standard deviation and maximum) were computed for the entire year and for the first 3 snow-free days as baseline due to the stable and less windy weather conditions (Table III). For SO station (see Table I for station naming codes), only data prior to 21 August 2023 were analysed due to station failure beyond that date.
Summary of low-frequency (LF) and high-frequency (HF) noise characteristics detected in the ultrasonic sensor data at each station (letter codes as in Table I): number of events, average and maximum duration of the events (in number of records or hours), maximum amplitude and percentage of effect on the time series, for the LF noise and mean, standard deviation (SD) and maximum values of the hourly variability considering the complete time series (all) or the first 3 days when the sites were free of snow cover.

Results
Device performance
After operating in the Antarctic region for 1 year, all sensors recorded hourly data without interruption, and by the end of the observation period they retained theoretical battery capacity for an additional 8 years (until 2032) and memory capacity for another 14 years (until 2039). Only one of the 12 installed devices suffered damage when the aluminium arm securing it to the station’s mast broke, also damaging part of the sensor’s protective cone. Despite the breakage in mid-August 2023, the device, located at the summit of Mount Reina Sofía (SO), continued taking measurements uninterruptedly, although the data were invalid due to the sensor’s incorrect position. The transducer showed no damage despite being exposed to wind, low temperatures and ice and snow for several months between August 2023 and February 2024.
The data obtained from the various sensors exhibit a common characteristic: high- and low-frequency noise. Low-frequency noise can be categorized into two groups: L1 values of 500 and 5000 mm, which are the sensor’s detection limits, and L2 values above or below the sensor’s installation distance, with the latter more frequently being lower than this distance but above 500 mm (Fig. 3). This low-frequency noise is not equally prevalent across the different stations. In contrast, high-frequency noise (H) corresponds to values very close to the distance between the sensor and the ground surface or snow cover and is common to all stations.
Plots showing raw distance data (grey dots) measured by devices at each station (letter codes as in Table I), alongside a centred daily moving average (red solid line) calculated every 24 measurements, after cleaning outliers and addressing gaps smaller than 24 consecutive measurements. The reference distance (black solid line) is derived from the median of the first 24 measurements in each time series, and snow depth (blue filled area) is calculated as the hourly moving average minus the reference distance. All values are presented in millimetres. Note that 1) y-axes are truncated at 2500 mm, omitting outliers and noise values between 2500 and 5000 mm, 2) at SO station a sensor support mast failure occurred in late August 2023 and 3) at MO station multiple events occurred in which the measured distance to the ground surface exceeded the reference distance.

The results show that low-frequency noise typically affects less than 2% of the records (Table III), although higher values are observed in some stations: MO (3.5%), CR (5.6%) and SO (9.1%). These episodes are generally infrequent (ranging from 1 to 21 per station), but they can persist for several consecutive days, with the longest single event reaching 212 consecutive records at SO station. In contrast, high-frequency variations remain between 7 and 10 mm under average conditions, except at MO station, where mean values reach up to 15 mm. During the first 3 snow-free days, these values decrease slightly, with the minimum mean variation reaching 2.6 mm (MO) and maximum values up to 10.6 mm (CL-1). The standard deviations of these variations range from 10 to 34 mm, with maximum spikes reaching up to 950 mm. Under snow-free conditions, the standard deviations drop to between 2 and 12 mm, and maximum variations do not exceed 60 mm at any station.
Snow-cover thickness evolution
The snow depths recorded at the various stations show significant variability, with maximum depths reaching nearly 110 cm at several stations, whereas at others the maximum depth barely exceeds 20 cm (Fig. 4). The snow period begins ca. 7 April 2023, across all stations, with the disappearance of the snow cover occurring between 1 December 2023 (CL-33) and 14 January 2024 (NI). This indicates different melting rates even among stations with similar maximum snow depths. The accumulation of snow cover throughout the year is irregular, staggered and heterogeneous across the different stations. Numerous episodes of snow accumulation of less than 10 cm are observed, although not synchronously across all stations, with some events occurring at a single station. Aside from the major accumulation events, some stations experience a significant increase in snow depth at the beginning of the snow period, with incremental increases during each event (e.g. CL-77), whereas other stations show a more continuous increase (e.g. LL).
Snow-depth evolution at the 12 monitoring stations on Livingston (continuous lines) and Deception (dashed lines) Islands, Antarctica (letter codes as in Table I), throughout year 2023 derived from processed data acquired by ultrasonic sensors.

Eight major regional snow accumulation events are recorded throughout the year. The most significant event occurs between 20 and 25 August 2023, resulting in increases of up to 75 cm in snow depth, although this rapidly decreases within a few days, leaving a net increase of less than 15 cm. Another notable event occurs on 4 October 2023, with the effects disappearing by 15 October. This event is not uniformly recorded across all stations but results in increases of up to 60 cm at the stations where it is observed, with a net increase of up to 20 cm after the event. A final significant accumulation event occurs on 17 November 2023, with up to 30 cm of snow accumulating at some stations, although this is not recorded at all sites. Following this event, all stations record a synchronous reduction in snow cover starting on 28 November and concluding by 14 January 2024 at the latest station. Only two stations (CL-1 and CL-33) begin this reduction process earlier, on 2 November 2023, whereas the snow depth at other stations either remains constant or increases prior to the final accumulation event. During the first 3 days of the reduction phase, all stations experienced a rapid decrease in snow depth, losing up to 20 cm in this period. Thereafter, the rate of reduction is continuous but not constant, with occasional minor increases of 2–3 cm observed at various stations. Additionally, snow reduction events are noted throughout the year, predominantly following the major accumulation events, with significant losses of several tens of centimetres occurring within a few days. Other periods exhibit minor reductions of 2–3 cm over 2–3 days, or near-constant snow depths with reductions of less than 1 cm over up to 25 days, accompanied by daily oscillations of 0.2–0.3 cm.
Temperature-derived snow depths and comparative metrics
Snow depth estimates derived from air temperature data at different heights above the ground (Fig. 5) generally show less temporal precision than those obtained using ultrasonic sensors. This is due to the coarser vertical resolution of the thermistor arrays and the frequent malfunctioning of individual sensors, which occurred at several stations. As a result, snow-depth values from snow poles tend to vary in discrete steps rather than showing continuous trends. Despite these limitations, similar seasonal patterns of snow accumulation and snowmelt are observed at most stations - although not at all of them - highlighting the need for further analysis to detect anomalous values and outliers in these series. Sensor failures in the upper part of the array clearly limit the maximum snow depth that can be registered. This is the case at CL-2 station, where failure of the 80 cm sensor prevented the detection of depths greater than 60 cm. A similar situation occurred at JC station, where the failure of multiple sensors prevented a realistic estimation of snow cover throughout the season. In contrast, at other stations such as CL-33 and CR, although the upper sensors functioned correctly, the maximum depths recorded were still well below those detected by the ultrasonic sensors. At most other stations, except SO - where the ultrasonic sensor failed - the overall snow evolution trends are similar between methods, although with variable differences. These differences are not solely related to elevation; local wind exposure and microtopographic effects probably play major roles in shaping snow accumulation patterns.
Snow-depth (in cm) time series obtained from both ultrasonic sensors (light blue areas) and temperature-based snow poles (dark blue lines) for each of the 12 PERMATHERMAL stations (letter codes as in Table I). Elevations of temperature sensors on the snow poles are marked on the left-hand y-axis, showing the correct (green dots) and failed (purple crosses) devices.

To complement this visual comparison, a series of basic snow metrics was calculated independently for each station and each method. These include the number of snow-covered days, the maximum and average annual snow depth and the Snow Index, defined as the cumulative sum of daily mean snow depths during the snow season (Fig. 6). The values obtained vary significantly between stations and between methods. Ultrasonic sensors generally reported a greater number of snow-covered days, higher maximum and average snow depths and greater Snow Index values than snow poles. However, the magnitude of the differences is highly variable and depends on site-specific snow conditions and the number and location of functional sensors in each thermistor array. These metrics offer the best possible validation approximation given the absence of in situ manual snow measurements due to logistical limitations and the lack of continuous winter data from nearby meteorological stations.
Comparison of four key snow metrics: a. number of snow-covered days, b. maximum and c. mean annual snow depth and d. the Snow Index - for each station (letter codes as in Table I), derived from both ultrasonic sensors (light blue bars) and snow pole arrays (dark blue bars). Bar plots show absolute values, while bottom labels indicate the relative differences between methods (in %). General average differences (in %) are shown at the top of each plot.

Most stations recorded between 300 and 330 snow-days with ultrasonic sensors, except for MO (180 snow-days), CR (269 snow-days) and NI (283 snow-days). In contrast, snow poles typically registered fewer than 205 snow-days, with the lowest value occurring at CL-33 (31 snow-days). Maximum snow depths recorded by ultrasonic sensors ranged from 90 to 110 cm at NI, LL, CL-2 and CL-3 stations, from 30 to 60 cm at most other stations and as low as 14 cm at CL-1 station. Snow poles yielded higher maximum values in some cases (up to 120 cm) due to the discrete nature of this method, but most results were limited to 60 or 30 cm depending on the highest covered sensor. Despite these differences, the average annual snow depth was relatively similar between methods, with differences generally under 10 cm. Most stations recorded annual mean snow depths below 50 cm, with values between 40 and 50 cm at NI, LL, CL-2 and CL-3 stations and below 20 cm at the rest. On the other hand, the Snow Index ranged between 1400 and 16 500 cm·day when using ultrasonic data, in proportion to the seasonal snow cover. In contrast, snow pole-based Snow Index estimates were considerably lower, ranging between 380 and 12 500 cm·day.
Discussion
Data analysis
The noise observed in the data could originate from several sources. Firstly, the 500 mm readings correspond to the minimum measurable distance by the sensor. Any object positioned less than 50 cm from the sensor will returns a distance value of 500 mm. As the sensors were always installed at heights greater than the maximum expected snow depth at each station, recorded distances of 500 mm or slightly more could be attributed to the presence of precipitation at the time of measurement. During these times, the acoustic signal might reflect off the precipitation particles rather than the surface, returning the minimum value of 500 mm. Given the low frequency of these values (Fig. 3 & Table III), this interpretation is plausible. However, the abundance of such values varies across the stations, being particularly frequent at some stations but not at others. If precipitation were the sole cause of this, one would expect stations located close to each other, such as those on Deception Island, to record similar occurrences, as they would experience the same precipitation due to the flat terrain and proximity (within 100 m) without intervening relief. This inconsistency suggests that although precipitation might contribute to these values, another process must also be responsible. Moreover, during rapid decreases in distance (indicating increased snow depth), less noise of this type is observed (Fig. 3). There is also no direct correlation between the abundance of this noise and snow depth, as stations with similar depths (e.g. LL and CL-3, IN and CR or JC and CL-77) exhibit significantly different frequencies of these values (Fig. 3). Additionally, these values appear even during periods without snow accumulation, indicating no significant snowfall, as seen at CR, LL and CL-77 stations.
If snowfall is not responsible for these readings, wind might be a contributing factor, given its varying intensity and direction at different locations with distinct topographic contour conditions. Many other authors have reported the effects of wind on changing snow depth at monitoring stations (e.g. Dadic et al. Reference Dadic, Mott, Lehning and Burlando2010, Knuth et al. Reference Knuth, Tripoli, Thom and Weidner2010, Leonard & Maksym Reference Leonard and Maksym2011, Mott et al. Reference Mott, Vionnet and Grünewald2018, Voordendag et al. Reference Voordendag, Goger, Prinz, Sauter, Mölg, Saigger and Kaser2024). However, this hypothesis does not explain the varying presence of these values at closely situated stations with similar environmental conditions, such as those on Deception Island.
Conversely, the 5000 mm readings, which correspond to the upper measurement limit of the sensors, are generally less frequent (Fig. 3), except at NI, CR, CL-1 and CL-2 stations, where they are as frequent or more so than the previously described values. These values are generally considered erroneous as the sensors are always mounted at heights below 2.5 m above the ground. Such readings would only be expected if the acoustic signal were lost or if the sensor were misaligned to point diagonally or horizontally rather than vertically. The former scenario is plausible, given the common occurrence of winds exceeding 100 km/h in the study area. The latter scenario would involve a change in the reference level, as the sensor would no longer measure vertically. However, to prevent sensor misalignment, the sensor’s mounting piece was screwed onto the horizontal arm at all stations, so the entire horizontal arm would have to rotate relative to its anchoring point for this to occur. Efforts were made to secure the mounting with tightly fitted metal pieces, although this possibility cannot be entirely ruled out. However, this did not occur at any station, as evidenced by 1) the distance measurements at the start and end of the time series being consistent, with only a few millimetres of difference at each station without snow, 2) the measurements being coherent before and after any potential arm rotation and 3) no sensor damage or rotation being observed during data retrieval. Therefore, the 5000 mm values might also be related to wind, with other values exceeding the ground or snow-cover distance being linked to acoustic signal disturbances or sensor malfunctions due to wind or sensor vibration. Electronic errors are unlikely, as temperature data acquired from the device at the same time during these periods are consistent.
High-frequency noise is common at all stations (Fig. 3 & Table III), causing variations of less than 7 mm on average between hourly measurements at all of the stations throughout the year. The low average values observed throughout the year, along with the small differences recorded between the first days of the time series during the snow-free period and the rest of the year, suggest a high degree of stability in the measurements. These stable conditions occurred during relatively stable weather, especially at the beginning of the series. The recorded variations fall within the sensor’s resolution range (± 1 mm/m) and may be attributed to micro-scale changes on the ground or snow surface, such as wind-driven particle movement or variations in surface moisture (Tanaka et al. Reference Tanaka, Suda, Hirai, Sako, Fuakgawa, Shimamura and Togari2009, Woo et al. Reference Woo, Do, Hong and Choi2022). Maximum values of this type of noise (Table III) could be related to increased snow accumulation during a snowstorm, with this later being reduced by wind redistribution. In fact, the maximum values during the snow-free days are all less than 60 mm at all of the station, which is compatible with snowfall during the summer or the effects of wind; meanwhile, the much higher maximum values of the high-frequency noise (less than 950 mm) are compatible with the strong and long-duration snowstorms that occur during the winter, accompanied by strong winds. Wind could also contribute to this high-frequency noise, causing vibrations in the main mast or the sensor’s horizontal arm, leading to measurement variability exceeding the sensor’s error range. Although the anchorage is strong (as evidenced by the intact and non-rotated sensors), vibrations could still generate such data, given the sensor’s position at the end of the 75 cm-long horizontal arm.
In two of the 12 study stations (CL-33 and CL-77), the vertical mast is not anchored to the ground with guy ropes and metal stakes, and the masts are wooden rather than metal, unlike at the other stations. Despite these differences in installation settings, these stations do not exhibit more high-frequency noise than the others, contrary to expectations (Fig. 3). In contrast, MO station, where the metal main mast is anchored with steel cable rather than cord, exhibits the most noise, excluding SO station after its support broke. Furthermore, abrupt distance changes are observed at MO station, where distances increase and return to normal after days or weeks (Fig. 3), occasionally exceeding the sensor’s installed distance. This phenomenon recurs during both snowy and snow-free periods, suggesting an intermittent signal offset. During these periods, the data are consistent with previous and subsequent readings within the period and show similar variability to other stations. Clear explanations for this phenomenon are lacking, as potential interference from the support ropes should reduce distances rather than increase them, unless the signal was initially interfered with and the interference ceased during these episodes, which is not feasible, as initial distance was checked during their installation. Moreover, this effect would only be plausible during snow-free periods, but it also occurs during snowy periods when distances decrease due to snow depth. This phenomenon is not observed at stations with ropes securing the main mast or sensor arm. If the sensor’s mounting had rotated, causing intermittent interference from the ropes, the initial and final positions of the arm would not yield consistent ground distance values at the start and end of the temporal series. We initially discarded this effect because initial reference distance was coarsely measured, but to resolve this issue, exact measurements of the sensor’s position are needed to determine the reference value accurately and identify data affected by potential interference, if this is indeed the cause.
Overall, despite the absence of external validation data, the consistency and low frequency of anomalous values and the limited amplitude of high-frequency variations provide strong evidence for the reliability of this system. The fact that both types of noise remain within plausible physical ranges confirms that the observed variability is neither random nor indicative of instrumental malfunction. Instead, it reflects expected responses to environmental conditions and sensor resolution. These findings, derived from nearly 9000 hourly records per station across 12 Antarctic stations, support the robustness of this low-cost ultrasonic method for continuous snow-depth monitoring in harsh environments.
Installation and maintenance
Two issues related to sensor installation in Antarctic conditions have been identified. First is the breakage of the support arm of one of the sensors at SO station, which is located at the highest altitude and is exposed to harsh weather conditions and strong winds. It is possible that the breakage of the support arm was due to the formation of rime ice around the sensor or its support arm, as has been observed on the radiation shield of the air temperature sensor at the same station in other years. This ice accumulation could have added weight to the support arm, increasing its wind resistance and causing it to break during a strong winter storm. To prevent this, several improvements are proposed: using stainless steel tubes instead of aluminium and with a larger diameter than the current 2 cm, covering the support arms with plastic to reduce ice adhesion, adding a brace from the end of the support arm to the mast to increase its strength and adding ropes from the end of the support arm to the ground in positions that do not interfere with the ultrasonic signal.
The other issue observed is signal noise. Although this has been addressed with data processing filters, it could potentially be reduced further by using the previously mentioned ropes to connect the end of the sensor support arm to the ground, thereby reducing the degrees of freedom of movement of the arm and the mast assembly.
Data processing
The algorithm developed for pre-processing and processing the data enables the rapid calculation of snow depth from raw data, only requiring the configuration of the maximum number of consecutive missing measurements for interpolation (Table II). The results show that, in all cases, anomalous values and outliers are cleaned without overly smoothing the signal, thus retaining sharp and rapid accumulations of snow at the site in question. The Hampel filter at 1σ (Hampel Reference Hampel1974) has been particularly effective, outperforming a filter of outlier values in the time series (i.e. using the ‘tsoutlier’ filter; e.g. Chen & Liu Reference Chen and Liu1993), which removed many recorded snow accumulation events. User review is required only to detect and eliminate invalid results from when a sensor is broken. This was the case at SO station, where the algorithm cleaned all erroneous signals and outliers but retained consistent (although not real) distance data recorded when the device was broken and misaligned. It was only necessary to identify when the signal became unrealistic and to remove the subsequent data from the resulting snow-depth time series. In all other cases, the algorithm provided definitive results, obtaining the desired product of hourly snow depth throughout the study period without any data manipulation during data processing or requiring any further decisions from the operator.
This data processing (Table II; de Pablo & Rosado Reference de Pablo and Rosado2025) can be easily adapted by users to suit their specific data needs, allowing for improvements and customization for other stations’ unique cases. For example, if snow cover is present at the time of device installation, the R code (de Pablo & Rosado Reference de Pablo and Rosado2025) can be adapted to calculate the reference level from the latest data or to input the reference value if the sensor-to-ground distance is precisely known. Other adjustments to the R code can include changing the windows for calculating moving averages or using different filters to eliminate erroneous data and outliers. Our algorithm is designed to handle data gaps caused by anomalous values using linear interpolation, but to keep these gaps when they are greater than a user-selected threshold. However, based on other users’ needs, it would be possible to change the R script to compute values using other algorithms (Moritz & Bartz-Beielstein Reference Moritz and Bartz-Beielstein2017), such as a Kalman filter (Slater & Clark Reference Slater and Clark2006, Avanzi et al. Reference Avanzi, Zheng, Coogan, Rice, Akella and Conklin2020), as it is done with SNOTEL network data (Avanzi et al. Reference Avanzi, de Michele, Ghezzi, Jommi and Pepe2014, Ladwig & Francisco Reference Ladwig and Francisco2019).
Comparison with traditional snow pole estimates
The time series derived from ultrasonic sensors and snow poles show broadly similar seasonal patterns in snow accumulation and ablation across most stations (Fig, 5). However, significant differences emerge in terms of temporal resolution, signal continuity and the capacity to detect short-lived snow events. The temperature-based method produces step-like patterns due to the fixed sensor spacing and is highly sensitive to sensor failures, particularly in the upper part of the array, which can cap the measurable snow depth. In contrast, the ultrasonic sensor delivers continuous high-resolution data with centimetre-scale precision, allowing a more nuanced interpretation of snow dynamics. The comparative figure (i.e. Fig. 5) highlights these differences, showing how ultrasonic data consistently detect finer variations and more snow accumulation events than the classical method. Several cases illustrate these issues clearly: at CL-2 station, the failure of the 80 cm sensor prevented the detection of snow depths above 60 cm, and at JC station, multiple sensor failures severely compromised snow pole-based estimates. Even at stations where all sensors were functional, such as CL-33 and CR, snow poles failed to capture the full depth or continuity of the snowpack compared to ultrasonic readings.
The comparative metrics (Fig. 6) show consistent differences across stations. Ultrasonic sensors generally reported more snow-covered days, greater snow accumulation and higher seasonal Snow Index values than thermistor-based snow poles. In many cases, differences exceeded 30–50%, especially at stations with frequent sensor failures or low vertical resolution in the snow pole arrays. The lack of direct in situ snow measurements or of local meteorological stations with snow data during winter further complicates the validation process, especially given the strong spatial variability observed even between closely located stations.
Correlation plots comparing the snow metrics derived from ultrasonic sensors (y-axes) and snow pole (x-axes) data: a. number of snow-covered days, b. maximum annual snow depth, c. mean annual snow depth and d. Snow Index. Each point represents one station (letter codes as in Table I). Lineal fitting curves and correlation equations and factors are shown.

Examples of issues with snow poles that do not represent problems that the ultrasonic sensors face: a. accumulation of blown snow on the mast, b. exposure of the temperature sensors because of the radiative heat from the mast and c. alteration of the snow layer structure during temperature sensor removal to download their data.

These results quantitatively support the observations derived from the time series. For instance, ultrasonic data indicate 300–330 snow-days at most stations, whereas snow pole data rarely exceed 205 snow-days, and in one case (CL-33 station) detect only 31 snow-days. Similarly, the Snow Index, which integrates both duration and intensity of snow cover, reaches up to 16 500 cm·day with ultrasonic sensors, compared to a maximum of ~12 500 cm·day with snow poles - and often much less. Although average annual snow-depth estimates are relatively similar between methods at some stations, the overall signal is more complete and consistent in the ultrasonic data.
These differences are not simply technical; they have direct implications for interpreting ground thermal regimes, snow insulation effects and seasonal hydrological dynamics. The ultrasonic sensors offer clear operational and analytical advantages in this context. However, it is important to note that ultrasonic sensors are not suitable for studying snow thermal properties such as diffusivity. For such applications, traditional snow poles with vertical temperature profiles may still be necessary. In our case, the research focus was on snow-depth dynamics, which makes the ultrasonic system an appropriate and effective alternative.
To assess the consistency between both measurement systems, we performed a correlation analysis between the key snow metrics obtained from each method (Fig. 7). The strongest agreement is found for average snow depth (R 2 = 0.9) and the Snow Index (R 2 = 0.9), suggesting that, despite their differences, both methods capture similar seasonal trends in snowpack evolution. However, to study the detailed evolution of the snowpack, hourly snow-depth data are required, and here the correlation regarding maximum snow depth is only moderate (R 2 = 0.4), probably reflecting the influence of discrete step changes and sensor failures in the thermistor arrays. No significant correlation was observed for the number of snow-covered days (R 2 ≈ 0), which confirms that the snow pole method tends to underestimate transient or shallow snow events (Fig. 5). Therefore, comparative analysis with snow pole data, despite its limitations, remains the most reliable indirect validation method currently available for this type of study in Maritime Antarctic conditions.
These results highlight the value of ultrasonic sensors not only as a replacement for traditional methods, but as a significant improvement in terms of both precision and reliability. The combination of the strong correlation in key metrics and more complete data coverage makes ultrasonic sensors particularly suitable for long-term snow monitoring in remote and harsh environments. Although the snow pole data do not constitute a formal validation benchmark, they represent the most informative and operationally comparable reference available under current Antarctic logistical constraints.
Advantages and disadvantages
The cost of measuring snow depth using the MaxBotix-MB7374 ultrasonic sensor combined with a Geoprecision-Box datalogger is ~€1000, with an additional €100 for the necessary masts, anchoring parts, guy ropes and stakes for installation. This cost is higher than the previous installation of a snow pole with seven iButton DS1922L temperature miniloggers (Lewkowicz Reference Lewkowicz2008, de Pablo Reference de Pablo2022), which had a total cost of ~€650, including the wooden mast, rope guy wires and stakes. However, commercial prices have increased in recent years, making the cost comparable to that of the ultrasonic sensor. The cost of other devices commonly used for similar measurements, such as the HOBO Pendant Temp, is ~€100, resulting in a total cost of ~€700 plus installation materials. Although these are well-established technologies, iButton, HOBO and similar relatively low-cost dataloggers continue to be widely used in polar and alpine snow monitoring networks due to their affordability and ease of deployment (e.g. Tutton & Way Reference Tutton and Way2021). Therefore, comparing the tested device with such systems remains relevant for evaluating cost-efficiency in real-world applications.
The higher price of the MaxBotix ultrasonic device provides accurate hourly (or more frequent if desired) snow-depth measurements compared to the general daily data obtained from semi-manual temperature analysis at different heights (Lewkowicz Reference Lewkowicz2008, Tutton & Way Reference Tutton and Way2021). However, as air temperatures at different heights are not measured, thermal diffusivity calculations of the snow are no longer possible, which can be conducted using snow pole data (e.g. Oldroyd et al. Reference Oldroyd, Higgins, Huwald, Selker and Parlange2013). A significant drawback of the ultrasonic sensor is that when the sensor or installation fails, as happened at SO station, data are lost or become unusable for snow-depth measurement. In contrast, when using individual temperature sensors at different heights, the failure of one or more sensors still allowed for an approximation of snow depth, although with reduced vertical resolution, depending on which sensor(s) failed.
When comparing the tested device with other ultrasonic instruments, prices reach ~€2000 for the Sommer USH-9, or somewhat lower for the Campbell Scientific SR50-L or SnowVue-10 devices. These prices are in addition to installation materials, dataloggers, batteries and, if applicable, solar panels for charging the batteries. These elements not only increase economic costs but also require more maintenance materials, tools and time. The Geoprecision-MaxBotix ad hoc device does not require additional power elements, and its battery lasts several years, as does its inner memory. Replacing the battery is cheap and quick, as it only involves replacing the cell in its socket after opening the waterproof datalogger box without special tools. This is an improvement over iButton-type devices, whose batteries are non-replaceable, and HOBO-type devices, which have a longer lifespan than iButton devices but require more frequent battery replacements than the devices analysed here.
This configuration offers a higher cost-effectiveness/reliability ratio than other lower-cost devices (e.g. Varhola et al. Reference Varhola, Wawerla, Weiler, Coops, Bewley and Alila2010, Prajapati & Pahuja Reference Prajapati and Pahuja2016, Wangdi et al. Reference Wangdi, Wangmo, Sonam, Lhamo and Muramatsu2016) and a much lower cost than other devices on the market (e.g. Prokop et al. Reference Prokop, Schirmer, Rub, Lehning and Stocker2008, Ryan et al. Reference Ryan, Doesken and Fassnacht2008, Fischer Reference Fischer2011).
Another advantage of the tested devices is that the data are not affected by wind and heat radiative effects on the supporting pole. For snow poles, wind could accumulate snow around the pole, causing sensors to be covered with snow due to the shadow effect (Fig. 8), resulting in an overestimated depth. The opposite is also common, with snow loss around the snow pole forming a funnel, exposing some sensors to the atmosphere below the snow depth, leading to an underestimated depth (Fig. 8). Due to the limited memory (iButton) or battery limitations (HOBO) of the temperature loggers typically used with snow poles, it was necessary to remove them from the poles to download their data and reprogram them or replace the battery. It is important to note that, unlike general-purpose devices with removable storage, many field instruments used in snow poles - such as iButton, HOBO or Tinytag devices - rely on internal, non-replaceable memory chips. These built-in memories are typically small and cannot be upgraded, which constrains long-term data acquisition and requires regular data retrieval to avoid loss. This was problematic when annual station visits occurred while snow cover remained, often with ice layers beneath. Removing snow and ice for data downloading and sensor maintenance increased the time and number of tasks required and altered snow conditions (Fig. 8). Even when refilled with snow after maintenance, the conditions of depth and density (among others) were no longer the same. There was also no possibility of extending measurement periods due to the limited memory of these devices, leading to data loss when stations were not visited annually (e.g. de Pablo et al. Reference de Pablo, Ramos and Molina2017). Using Geoprecision-MaxBotix devices allows 1) data retention if stations are not visited annually, as there is enough battery and memory for multiple years, and 2) maintaining of snow conditions during data downloading or battery maintenance, as the datalogger is not at the measurement point and communication is via radio.
Snow-depth evolution
The results obtained using the Geoprecision-MaxBotix devices in the PERMATHERMAL network stations on Livingston and Deception islands in Antarctica have shown, on the one hand, similar behaviour in terms of major accumulation and melting events, despite the differences in location across three different areas on two distinct islands (Fig. 4 & Table I). This implies that, in the event of a sensor failure, recorded events from other stations can be utilized when necessary. There is greater variation in events of lesser snow-cover variability, related to local effects of wind or precipitation. While many of these events are repeated across stations, they do not always occur at all stations, even those located in the same area, as seen for the stations on Deception Island (CL-1, CL-2, CL-3, CL-33 and CL-77), or within an altitudinal range such as that on the Hurd Peninsula of Livingston Island (JC, NI, IN, CR, MO and SO). However, these events have a low impact on annual trends and changes in snow-cover thickness.
The long-term variation in snow thickness observed among the stations is markedly different (Fig. 4). The stations on the Hurd Peninsula of Livingston Island show a very slow increase until spring, when the snow thickness significantly rises. This thickness is greater at stations at lower altitudes and increases with elevation. An exception is NI station, which shows greater thickness than all other stations in the area, possibly due to its sheltered location at the foot of Mount Reina Sofía. Another exception, based on the available data, is SO station, located at the mountain’s summit, where, until its support broke in mid-August, it displayed snow thicknesses similar to lower-altitude stations despite being a wind-exposed site.
A very different behaviour is observed at the stations on Deception Island (Fig. 4). Despite being very close to each other (less than 100 m between the farthest ones) on a smooth, low-slope site with no nearby orographic shelters, they exhibit very different thicknesses. While CL-1 and CL-33 stations show low (< 20 cm) and very homogeneous snow thickness throughout the year, CL-77 station shows intermediate thicknesses (< 40 cm) throughout the year, increasing to 60 cm in early spring, similar to the stations on Hurd Peninsula. However, CL-2 and CL-3 stations show greater snow thickness from early winter, increasing to ~50 cm and very slowly rising until early spring, when, similar to the other stations, they increase to more than 80 cm in terms of snow thickness.
The station with the most linear snow thickness behaviour is the one on the Byers Peninsula of Livingston Island (LL), where the thickness increase is linear throughout the year, reaching over 1 m by mid-spring (Fig. 4). The major accumulation events observed at other stations have a lesser impact on the thickness increase at this station. The location of LL station in a slightly depressed area, which could explain this wind-related behaviour (Fassnacht et al. Reference Fassnacht, López-Moreno, Toro and Hultstrand2013).
The behaviour observed throughout 2023 at the PERMATHERMAL network stations shows that the snow accumulation during major events does not contribute to snow thickness increases; instead, these occur gradually through small snowfalls or the wind redistribution of snow. While there is a certain altitudinal component in the amount of accumulated snow, there is significant spatial variability, even in unprotected and nearby locations, where wind direction probably plays a crucial role. Confirming this requires detailed study of the climatic or orographic variables of the different stations. At stations where there is a significant snow thickness increase it is ~50 cm in a month, while events that accumulate 50 cm of snow in less than 3 days end up showing reduced snow cover over a similar time frame, therefore not contributing to net long-term snow-cover increases.
This evolution and its variability among stations provide valuable information for interpreting the different soil thermal regimes recorded at these stations (de Pablo et al. Reference de Pablo, Ramos, Vieira, Molina, Ramos and Maior2024), particularly when using Geoprecision-MaxBotix devices instead of traditional snow poles with temperature sensors. While ultrasonic sensors only measure the distance to the snow surface, their high temporal resolution enables more detailed monitoring of snow accumulation and melt dynamics. When combined with complementary datasets - such as surface temperature or snow water equivalent measurements obtained from other sensors - they facilitate quantitative studies on snow-soil interactions, including the influence of snow thickness on surface temperature, the assessment of curtain effect episodes or the role of water in modulating soil thermal behaviour. This can be reliably achieved using ultrasonic instruments but at a lower cost than traditional instruments, both economically and in terms of the time and materials needed for their annual maintenance, with no need for annual visits due to these dataloggers’ memory and energy capacities. Given these advantages, although snow thickness is not a mandatory GTN-P monitoring variable, this system represents a valuable and practical enhancement for ground thermal monitoring networks, offering a cost-effective solution to integrate snow-cover dynamics into permafrost research.
Conclusions
The results of this study demonstrate that the low-cost ultrasonic sensors tested (MB7574-SCXL-Maxsonar-WRST7 from MaxBotix), when coupled with Geoprecision-Box dataloggers, offer a robust and effective solution for year-round snow monitoring under the harsh climatic conditions of Maritime Antarctica. Despite not measuring snow depth directly, the sensors provide accurate distance-to-ground data that can be automatically converted into snow depth using the R script developed for this purpose. This tool also enables customizable post-processing and the generation of additional snow-related metrics tailored to specific research needs.
In the absence of direct ground truthing, the internal consistency of the data, the low proportion of anomalous values and the limited amplitude of both high-frequency noise - consistently within the ± 1 mm/m resolution range - along with the moderate low-frequency fluctuations, provide strong evidence of the accuracy and reliability of this ultrasonic sensor system under Antarctic conditions. These results are further supported by the comparative analysis with snow pole data, which confirms the overall coherence of the seasonal trends captured by both methods, despite their technical and operational differences.
Throughout 2023, the 12 PERMATHERMAL stations deployed on Livingston and Deception islands recorded snow accumulation reaching up to 1 m in some locations. Accumulation patterns varied between stations: in some, gradual buildup occurred throughout spring, whereas in others, major accumulation events were recorded early in winter. Snow typically melted rapidly during late spring. While elevation influenced snow cover to some extent, other site-specific factors such as wind exposure and microtopography also played a major role, contributing to substantial spatial variability even among closely located stations.
Although some installation issues were observed, such as sensor displacement due to wind or ice load, the system performed reliably overall. Improving the mechanical anchoring of both the horizontal arm and the main mast is recommended to reduce vibrations and potential data noise during the winter period. While further validation would ideally rely on direct manual measurements, the limited accessibility during winter and the sparse distribution of operational snow-monitoring meteorological stations highlight the practical value of this sensor system.
In conclusion, this sensor system combines high temporal resolution, low cost, ease of deployment and data stability, offering a reliable alternative to traditional snow pole methods for long-term snow monitoring in remote polar environments. Beyond serving as a replacement for snow poles, it also provides added value for investigating snow-cover dynamics and their interactions with soil thermal processes in cold regions.
Declaration
During the preparation of this work, the authors used ChatGPT to translate the original text from Spanish to English, and to improve the text’s grammar and spelling. The text was originally generated without this tool. After using this tool/service, the authors carefully reviewed and edited the content as needed, and the take full responsibility for the content of the publication.
Acknowledgements
The authors thank the chiefs and crews of the Spanish Antarctic stations ‘Juan Carlos I’ on Livingston Island and ‘Gabriel de Castilla’ on Deception Island for their support during fieldwork and help with the instruments’ maintenance, as well as the crew of the Spanish research vessel Hespérides for their support of logistical operations along the 2022–2023 and 2023–2024 field seasons. The authors also thanks Geoprecision GmbH for their help with integrating the MaxBotix ultrasonic sensors with their Box model dataloggers. The authors also express their appreciation to the anonymous reviewers for their insightful and constructive comments, which substantially improved the quality of this manuscript.
Financial support
This work was supported by the Spanish Research Agency, Ministry of Science, and Innovation, Government of Spain, through the Polar Research Program grants: PERMAMODEL (POL2006-01918), PERMAPLANET (CTM2009-10165), ANTARPERMA (CTM2011-15565-E) and PERMASNOW (CTM2014-52021-R) projects, and PERMATHERMAL contracts with IGME-UAH and CSIC/UTM-UAH LOU art. 83 and LOSU art. 60 PERMATHERMAL 2021/00381, 2022/00102, 2023/00117 and 2024/00041.
Competing interests
The authors declare none.
Author contributions
Conceptualization: MAdP; data acquisition and curation: MAdP; formal analysis: MAdP and BR; funding acquisition: MAdP; investigation: MAdP; methodology: MAdP; project administration: MAdP; resources: MAdP; visualization: MAdP and BR; writing - original draft: MAdP and BR; and writing - review and editing: MAdP and BR.


 Open access