


Introduction
The 2020 update to the international radiocarbon (14C) calibration curve (IntCal20) introduced far greater detail to the record through a substantial increase in measurements on individual tree rings. Since then, annual resolution measurements have revealed new insights, such as detailed information on past 14C concentrations in the atmosphere which was previously obscured by coarser measurements on multi-ring blocks of 5, 10, or 20 years.
Such investigations have been particularly crucial for studies on the 2nd millennium BCE, a period that had already received considerable attention due to the controversial dating of the Minoan eruption of Thera (modern-day Santorini). In fact, the mid-2nd millennium BCE has now become one of the most extensively studied and best 14C-dated periods in history (Manning Reference Manning2022, Reference Manning2024a, Reference Manning2024b; Pearson et al. Reference Pearson, Brewer, Brown, Heaton, Hodgins, Jull, Lange and Salzer2018, Reference Pearson, Sbonias, Tzachili and Heaton2023).
The Minoan eruption was one of the largest volcanic events of the Holocene (Johnston et al. Reference Johnston, Sparks, Phillips and Carey2014; Sigurdsson et al. Reference Sigurdsson, Carey, Alexandri, Vougioukalakis, Croff, Roman, Sakellariou, Anagnostou, Rousakis, Ioakim and Goguo2006). It potentially had environmental, cultural, political and economic consequences for the contemporary cultures in the region, and putatively triggered earthquakes and tsunamis that reached as far as Crete and the shores of Anatolia (Aydar et al. Reference Aydar, Çiner, Ersoy, ÉCochard and Fouache2021; Bruins et al. Reference Bruins, MacGillivray, Synolakis, Benjamini, Keller, Kisch, Klügel and van der Plicht2008; Lespez et al. Reference Lespez, Lescure, Saulnier-Copard, Glais, Berger, Lavigne, Pearson, Virmoux, Müller Celka and Pomadère2021; McCoy and Heiken Reference McCoy and Heiken2000; Şahoğlu et al. Reference Şahoğlu, Sterba, Katz, Çayır, Gündoğan, Tyuleneva, Tuğcu, Bichler, Erkanal and Goodman-Tchernov2022). Some argue the eruption even instigated a climatic downturn, leading to widespread crop failures, famine, migration, and disruption of local economies and trade networks (Driessen and Macdonald Reference Driessen and MacDonald2000; Foster and Ritner Reference Foster, Ritner and Foster1996; Friedrich and Sigalas Reference Friedrich, Sigalas and Warburton2009; LaMoreaux Reference LaMoreaux1995; Soles Reference Soles2007; White & Humphreys Reference White and Humphreys1994). Indeed, the aftermath of the eruption, especially for the island of Crete, either in terms of direct destruction (Luce and Bolton Reference Luce and Bolton1976; Marinatos Reference Marinatos1939) or more nuanced arguments around long-term socio-economic disruption (Driessen Reference Driessen2019; Druitt et al. Reference Druitt, McCoy and Vougioukalakis2019; Manning and Sewell Reference Manning, Sewell, Torrance and Grattan2002; Pyle Reference Pyle1997), has now been a topic of debate for more than a century.
The core of the debate lies in determining the exact eruption date. Archaeological synchronisms between Egypt, Greece and the Levant place the eruption around 1500 BCE (Bietak Reference Bietak, Shortland and Bronk Ramsey2013; Höflmayer Reference Höflmayer2012; Warren Reference Warren and Warburton2009, Reference Warren and Müller2010; Warren and Hankey Reference Warren and Hankey1989), whereas most of the 14C evidence suggests a date closer to 1600 BCE (Bruins and van der Plicht Reference Bruins and van der Plicht2014; Friedrich et al. Reference Friedrich, Kromer, Friedrich, Heinemeier, Pfeiffer and Talamo2006; Höflmayer Reference Höflmayer2012; Manning Reference Manning2022; Manning et al. Reference Manning, Ramsey, Kutschera, Higham, Kromer, Steier and Wild2006, Reference Manning, Höflmayer, Moeller, Dee, Ramsey, Fleitmann, Higham, Kutschera and Wild2014). The 100-year discrepancy between the two scenarios may seem trivial in some contexts but, in this case, it is pivotal to unravelling the long-term impact of this event. Recently, the new high-resolution data on tree rings have reignited the debate on the 14C date of the eruption. It has been revealed that the international calibration curve has suffered from offsets, either localized (Dee et al. Reference Dee, Brock, Harris, Ramsey, Shortland, Higham and Rowland2010; Manning et al. Reference Manning, Griggs, Lorentzen, Bronk Ramsey, Chivall, Jull and Lange2018, Reference Manning, Kromer, Cremaschi, Dee, Friedrich, Griggs and Hadden2020a, Reference Manning, Wacker, Büntgen, Bronk Ramsey, Dee, Kromer, Lorentzen and Tegel2020b) or global (Pearson et al. Reference Pearson, Brewer, Brown, Heaton, Hodgins, Jull, Lange and Salzer2018; Regev et al. Reference Regev, Gadot, Uziel, Chalaf, Shalev, Roth, Shalom, Szanton, Bocher, Pearson and Brown2024). In particular, a clear disparity was found between IntCal13 and IntCal20 over the course of more than 100 years (ca. 1660 to ca. 1540 BCE) (Pearson et al. Reference Pearson, Brewer, Brown, Heaton, Hodgins, Jull, Lange and Salzer2018). Such discrepancies can result from a variety of causes. Laboratory factors, data artefacts, or differences in latitude or growing season among the various tree species are all possible sources, and all could cause the 14C dates from the eruption to be incorrect.
A couple of specific anomalies in 14C concentration have been suggested for the years 1557 and 1528 BCE, based on data from bristlecone pine (Pinus longaeva) in California (Pearson et al. Reference Pearson, Brewer, Brown, Heaton, Hodgins, Jull, Lange and Salzer2018, Reference Pearson, Wacker, Bayliss, Brown, Salzer, Brewer, Bollhalder, Boswijk and Hodgins2020b). In the same publication, the feature in 1557 BCE is not observed in oak (Quercus sp.) measurements from Ireland; however, the datasets from both species show a significant increase in ∆14C (‰) values around 1528 BCE. These are potential Miyake Events, which are sudden spikes in 14C production associated with intense solar activity (Bard et al. Reference Bard, Miramont, Capano, Guibal, Marschal, Rostek, Tuna, Fagault and Heaton2023; Brehm et al. Reference Brehm, Christl, Knowles, Casanova, Evershed, Adolphi, Muscheler, Synal, Mekhaldi, Paleari and Leuschner2022; Büntgen et al. Reference Büntgen, Wacker, Galván, Arnold, Arseneault, Baillie, Beer, Bernabei, Bleicher, Boswijk and Bräuning2018; Miyake et al. Reference Miyake, Nagaya, Masuda and Nakamura2012, Reference Miyake, Masuda and Nakamura2013). Miyake Events can serve as time-markers in assigning historical events to a single year (Kuitems et al. Reference Kuitems, Panin, Scifo, Arzhantseva, Kononov, Doeve, Neocleous and Dee2020a, Reference Kuitems, Wallace, Lindsay, Scifo, Doeve, Jenkins, Lindauer, Erdil, Ledger, Forbes and Vermeeren2022; Maczkowski et al. Reference Maczkowski, Pearson, Francuz, Giagkoulis, Szidat, Wacker, Bolliger, Kotsakis and Hafner2024). So far, five events have been confirmed, although the precise criteria for confirmation have not yet been universally agreed. What is common to these five cases is that they have been found in independent dendrochronological archives, from different parts of the world, by multiple laboratories. Equivalent anomalies have also all been found in the same years in ice core records. These five cases correspond to: 774 CE (Miyake et al. Reference Miyake, Nagaya, Masuda and Nakamura2012), 993 CE (Miyake et al. Reference Miyake, Masuda and Nakamura2013), ∼664 BCE (O’Hare et al. Reference O’Hare, Mekhaldi, Adolphi, Raisbeck, Aldahan, Anderberg, Beer, Christl, Fahrni, Synal and Park2019; Panyushkina et al. Reference Panyushkina, Jull, Molnár, Varga, Kontul’, Hantemirov, Kukarskih, Sljusarenko, Myglan and Livina2024; Park et al. Reference Park, Southon, Fahrni, Creasman and Mewaldt2017), 5259 BCE and 7176 BCE (Brehm et al. Reference Brehm, Christl, Knowles, Casanova, Evershed, Adolphi, Muscheler, Synal, Mekhaldi, Paleari and Leuschner2022). Additional spikes have also been proposed but not yet confirmed, including in 5410 BCE (Miyake et al. Reference Miyake, Panyushkina, Jull, Adolphi, Brehm, Helama, Kanzawa, Moriya, Muscheler, Nicolussi and Oinonen2021), 1052 CE and 1279 CE (Brehm et al. Reference Brehm, Bayliss, Christl, Synal, Adolphi, Beer, Kromer, Muscheler, Solanki, Usoskin and Bleicher2021). The presence of a spike in 1557 or 1528 BCE could facilitate a precise date for the eruption, which would thus clarify the consequences of the eruption, help secure the chronology of the Eastern Mediterranean region, and allow us to understand the political and cultural shifts that developed after this massive event (Kutschera Reference Kutschera2020; McCoy Reference McCoy and Warburton2009).
Many laboratories around the world have contributed 14C dates to IntCal20 for this time period. Currently, the calibration data comes from measurements from Germany, the Netherlands, Ireland, and California. New annual measurements for IntCal20 were provided by the University of Arizona; the Swiss Federal Institute of Technology, Zurich; the Curt-Engelhorn-Centre for Archaeometry, Mannheim; and Aarhus AMS Centre, University of Aarhus. These augmented the extant multi-ring measurements from Heidelberg University Radiocarbon Laboratory (now Central Radiocarbon Laboratory of Heidelberg University); the Quaternary Isotope Lab, University of Washington; and the 14CHRONO Centre, Queens University Belfast. In comparison, University of Groningen (laboratory code: GrM) has contributed 18 14C dates to the calibration record over this period (Kuitems et al. Reference Kuitems, van der Plicht and Jansma2020b), which were both in annual and multi-year resolution.
In this paper, our aim is to provide considerably more annual data over this controversial period measured by the Centre for Isotope Research (CIO), Groningen. Building upon Kuitems et al. (Reference Kuitems, van der Plicht and Jansma2020b), we present new 14C measurements on dendrochronologically dated wood from the Netherlands and Northern Ireland, UK. Our analysis focuses on investigating any proposed offsets in 14C concentration and exploring the likelihood of a Miyake Event that could serve as an exact time marker for this period. Specifically, we compare our dataset with respect to IntCal20, other laboratories, tree species, and the latitude of the sample origin.
Materials and methods
Sample material
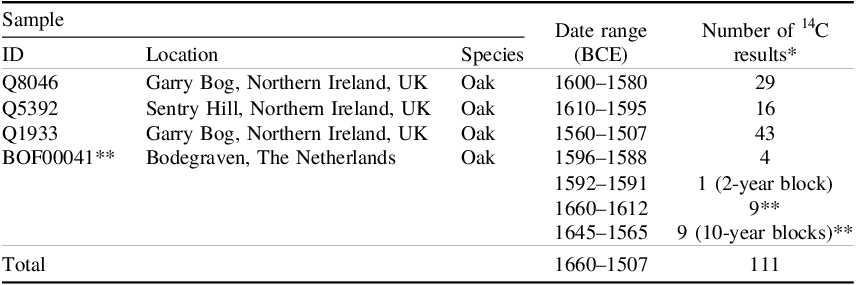
All of the tree-ring samples used in this study are listed in Table 1. Eighteen 14C measurements on sample (BOF00041) from Bodegraven, the Netherlands, were published by Kuitems et al. (Reference Kuitems, van der Plicht and Jansma2020b), alongside detailed dendrochronological information on the sample. These data are already included in the IntCal20 database. Here, we have extended this dataset by five measurements. The rest of our new measurements were obtained on dendrochronologically dated wood from Garry Bog (55°06’N, 6°31’W) and Sentry Hill (54°33’N, 6°11’W), Northern Ireland, UK. In this case, Quercus sp. tree rings were dissected from three different samples from these sites (Q8046, Q5392 and Q1933). Their early and late wood fractions were not separated because the ring widths were too narrow. A total of 93 new tree rings were pretreated and analysed for their 14C content.
List of dendrochronological samples selected and measured for 14C content in this paper

Table 1 Long description
The table presents a detailed list of dendrochronological samples measured for carbon-14 content. It includes four columns: Sample ID, Location, Species, Date range (BCE), and Number of carbon-14 results. The table has five rows of data plus a total row. Sample IDs include Q8046, Q5392, Q1933, and BOF00041, with locations in Northern Ireland, UK, and the Netherlands. The species listed is Oak. Date ranges span from 1600 to 1507 BCE, with varying numbers of carbon-14 results, including specific blocks of years for sample BOF00041. The total number of carbon-14 results is 111.
* Annual samples unless otherwise stated.
** See Kuitems et al. (Reference Kuitems, van der Plicht and Jansma2020b) for more detail.
Pretreatment
All the samples were subjected to Groningen’s α-cellulose extraction protocol, details of which can be found in Dee et al. (Reference Dee, Palstra, Aerts-Bijma, Bleeker, De Bruijn, Ghebru, Jansen, Kuitems, Paul, Richie and Spriensma2020). Put simply, the procedure involves a strong acid-base-acid (ABA) sequence (1.5 M HCl, 80 °C, 20 min; 17.5 w/vol, NaOH, RT, 60 min ultrasonicated under N2 atmosphere; 1.5 M HCl, 80 °C, 20 min) with an additional bleach step (1.5% w/vol NaClO2/H+, pH=3, 80 °C, 16 hr). The resulting product is freeze-dried, weighted into tin capsules, combusted and graphitized (Dee et al. Reference Dee, Palstra, Aerts-Bijma, Bleeker, De Bruijn, Ghebru, Jansen, Kuitems, Paul, Richie and Spriensma2020). The 14C measurements are then obtained using a MICADAS AMS (Synal et al. Reference Synal, Stocker and Suter2007).
Results and discussion
Experimental results
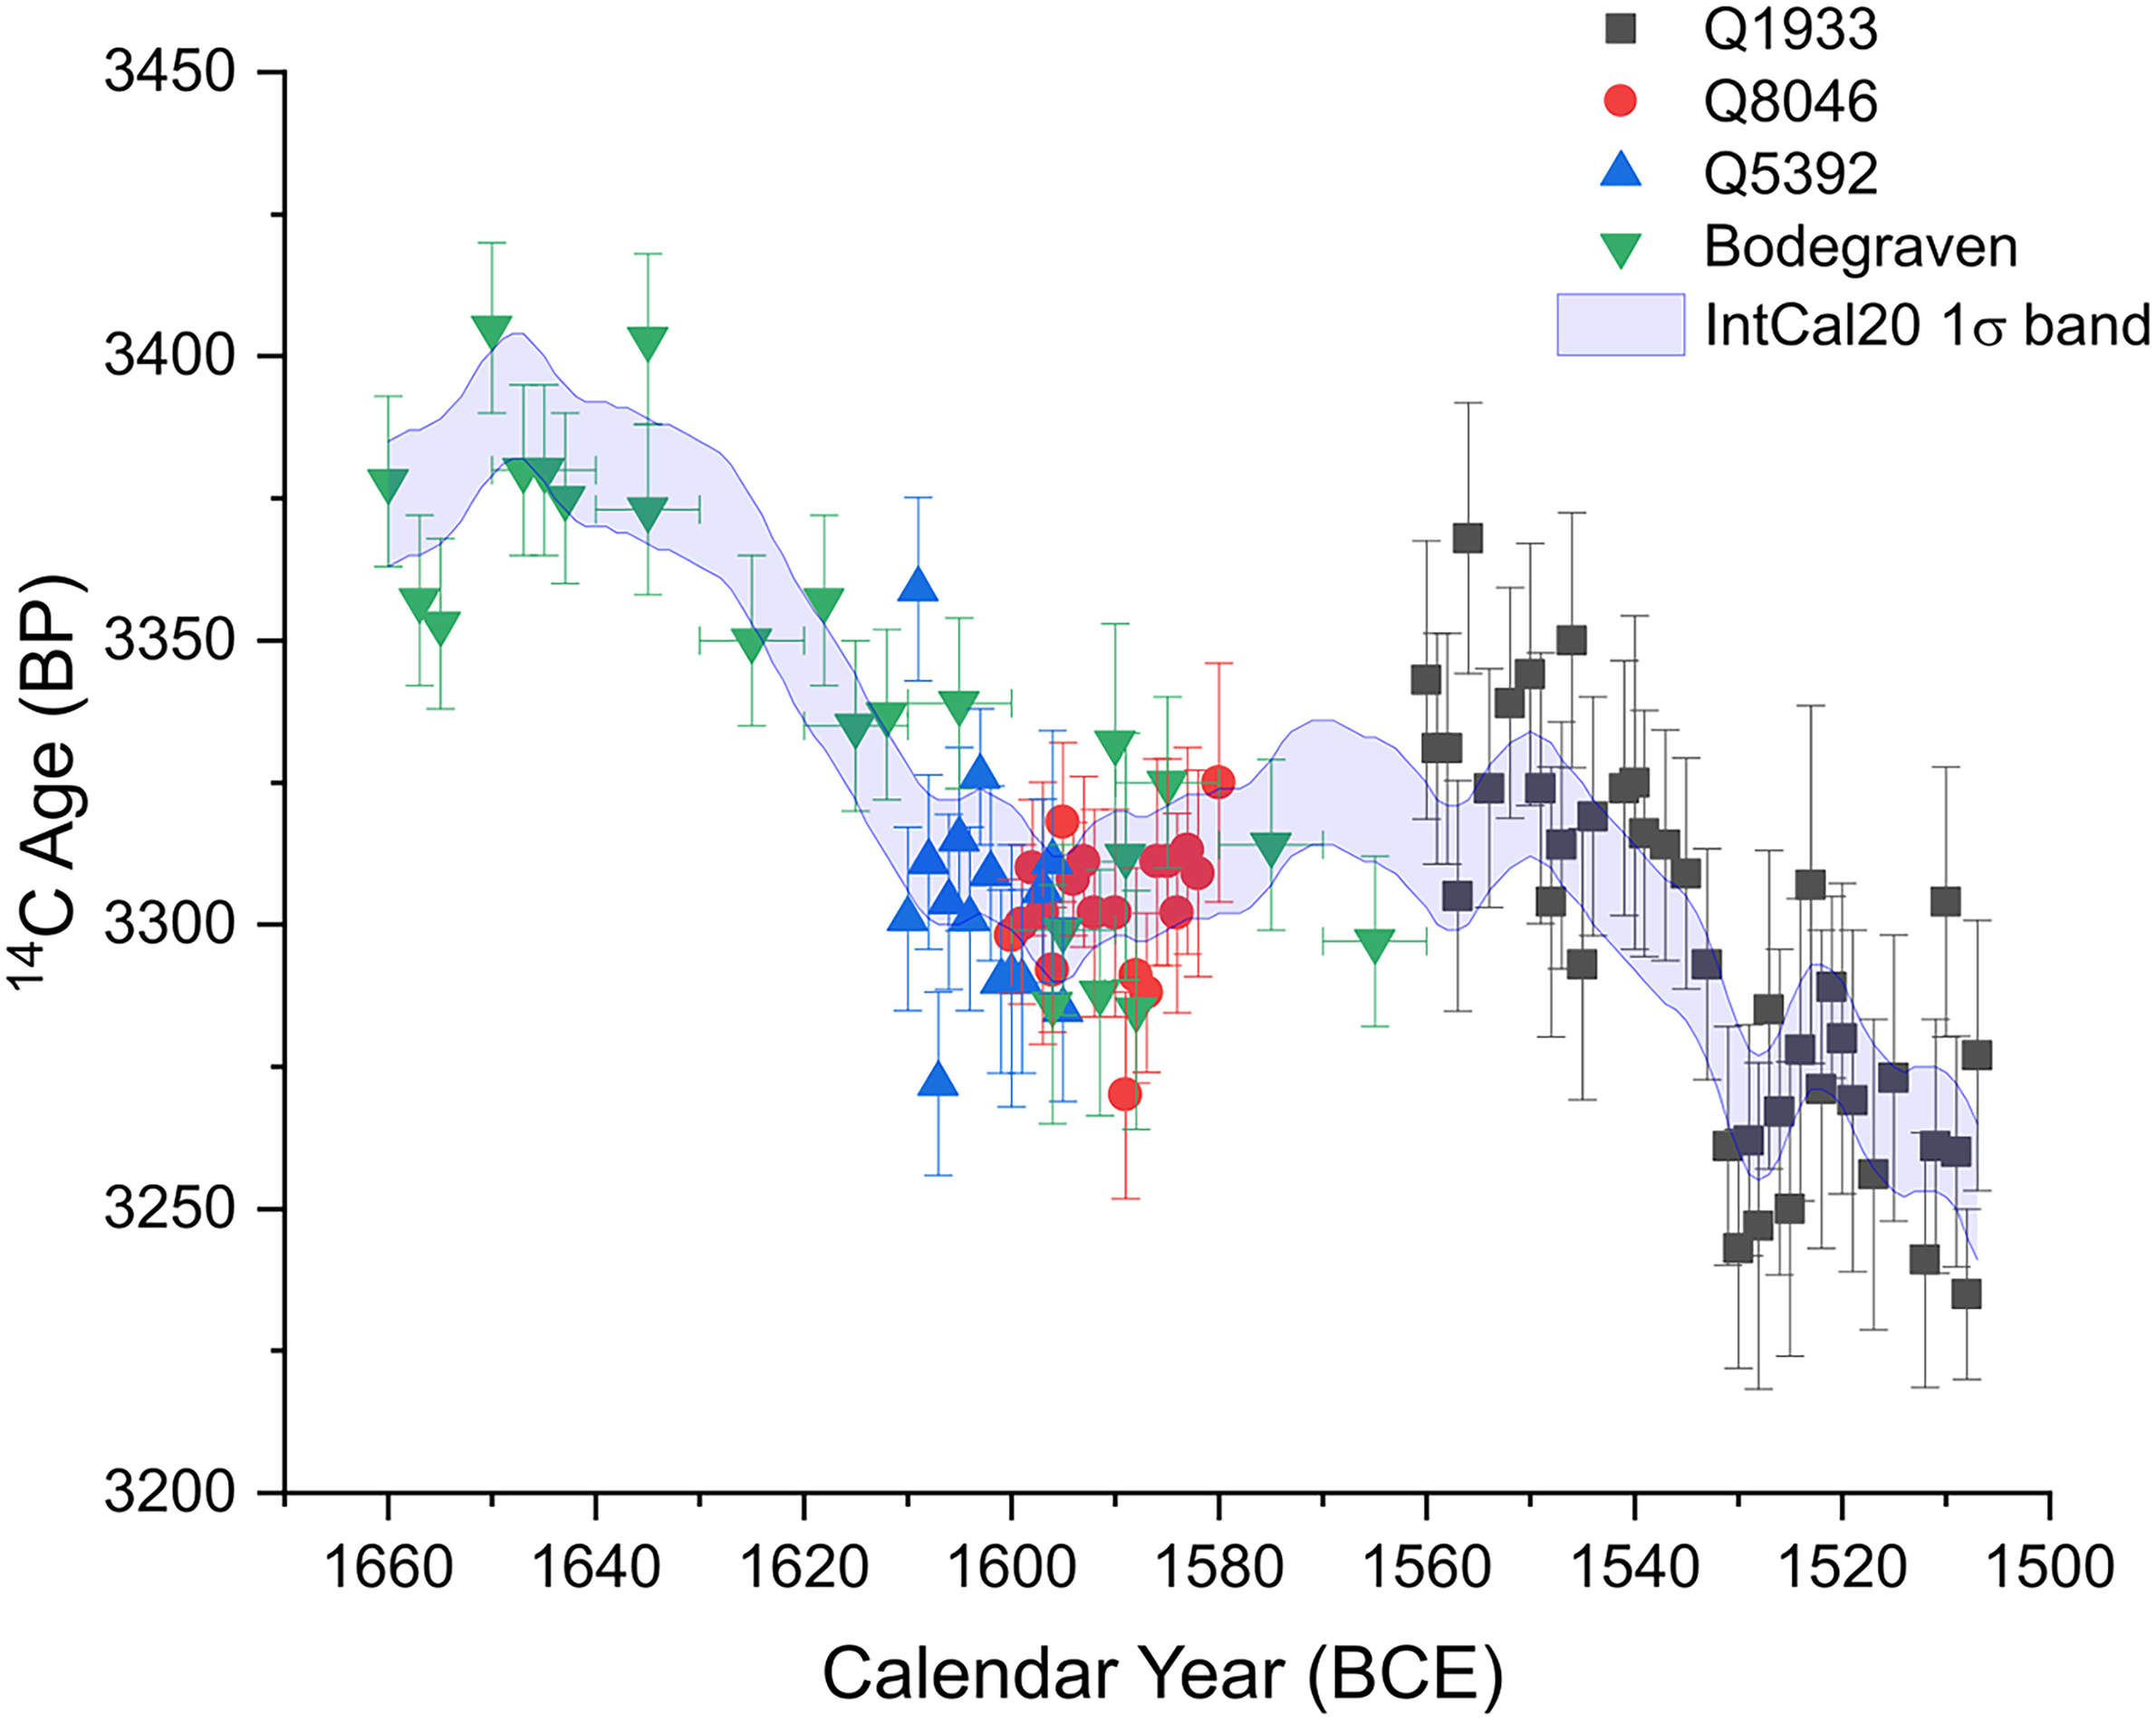
Here, we present 93 new high-precision 14C measurements at annual-resolution covering a total span of 153 calendar years. Due to practical constraints, such as very narrow tree rings, it was not possible to obtain a result for every single year. The list of the 14C measurements from all tree samples is given in the Supplementary Material Tables S1–S4. All of these data are plotted in Figure 1 in comparison with IntCal20 (Reimer et al. Reference Reimer, Austin, Bard, Bayliss, Blackwell, Ramsey, Butzin, Cheng, Edwards, Friedrich and Grootes2020).
All Groningen (GrM) measurements on tree rings from Bodegraven, the Netherlands and Garry Bog and Sentry Hill, Northern Ireland, UK (Q1933, Q8046, Q5392). Different colors represent different samples and tree-ring chronologies.

Figure 1 Long description
The line graph displays radiocarbon ages on the y-axis ranging from 3200 to 3450 radiocarbon years before present (BP) and calendar years on the x-axis ranging from 1660 to 1500 before common era (BCE). Different colors represent different samples and tree-ring chronologies: black squares for Q1933, red circles for Q8046, blue triangles for Q5392, and green inverted triangles for Bodegraven. A blue shaded area indicates the IntCal20 1-sigma band. The graph shows the relationship between radiocarbon ages and calendar years, with data points and error bars for each sample. All values are approximated.
Comparisons with IntCal and other laboratories
To analyse our dataset for any potential systematic offsets, we compared it across laboratories, tree species, and based on the latitude of the sample origin. To maintain a controlled approach, only measurements from Northern Ireland were used (the data from the Netherlands were excluded), ensuring that all comparisons were conducted using the similar latitude (55°–54°N) and species (Quercus sp). In order to create one continuous dataset, we calculated the weighted mean of multiple measurements from the same calendar year for all the wood samples (i.e. the weighted mean of measurements on samples Q8046 and Q5392). There were 12 such averaged results and each passed the χ2 test (see Supplementary Material Table S5) (Ward and Wilson Reference Ward and Wilson1978). After applying the weighted mean, a total of 70 single-year measurements were used in the offset comparisons.
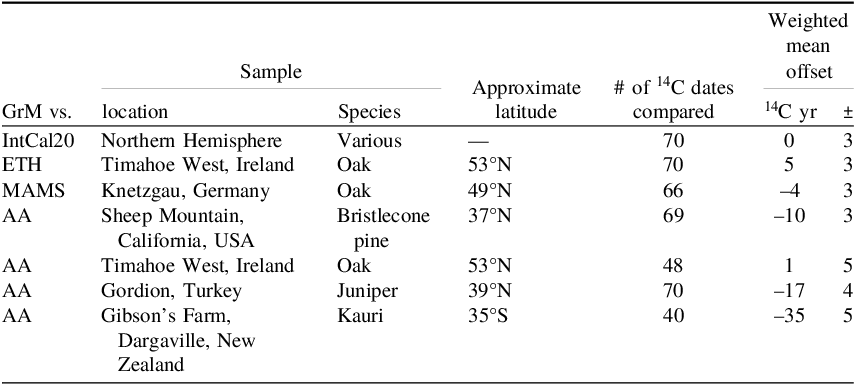
Initially, we compared our dataset directly to IntCal20. As seen in Figure 1, our data closely agrees with the 1σ band of this reference dataset. The GrM data does not show any statistically significant offset (0 ± 3 14C years). However, the calibration curve is a statistically smoothed dataset that averages out fluctuations in 14C concentration; certain details may be obscured in the process. We therefore shifted our focus to the composite datasets for a more comprehensive analysis. We tested for differences between GrM and the single-year measurements from the Curt-Engelhorn-Centre for Archaeometry, Mannheim (MAMS; oak from Knetzgau, Germany), the Swiss Federal Institute of Technology (ETH; oak from Timahoe West, Ireland), and the University of Arizona (AA; bristlecone pine from Sheep Mountain, California, USA, and oak from Timahoe West, Ireland). Additionally, we tested other relevant datasets from the same time period that are not incorporated into IntCal20. These provide alternative parameters for comparison, such as different latitude and species (AA; juniper from Gordion, Turkey, and kauri from Gibson’s Farm, Dargaville, New Zealand) (Pearson et al. Reference Pearson, Salzer, Wacker, Brewer, Sookdeo and Kuniholm2020a, Reference Pearson, Wacker, Bayliss, Brown, Salzer, Brewer, Bollhalder, Boswijk and Hodgins2020b). The weighted mean offsets between the various datasets are presented in Table 2.
Comparisons between the GrM annual dataset on oak from Northern Ireland, UK (55°–54°N) corresponding to IntCal20, ETH, MAMS, and AA measurements. Juniper data from Turkey (Pearson et al. Reference Pearson, Salzer, Wacker, Brewer, Sookdeo and Kuniholm2020a) and kauri data from New Zealand (Pearson et al. Reference Pearson, Wacker, Bayliss, Brown, Salzer, Brewer, Bollhalder, Boswijk and Hodgins2020b) are not incorporated in the IntCal20 dataset. All the datasets listed below were prepared using holocellulose extraction, except for GrM, where α-cellulose was the preferred extract.

Table 2 Long description
The table compares radiocarbon datasets from various locations and species, showing weighted mean offsets in 14C years. It includes data from Northern Hemisphere, Timahoe West Ireland, Knetzgau Germany, Sheep Mountain California USA, Gordion Turkey, and Gibsons Farm Dargaville New Zealand. The table has six columns: GrM vs., location, species, approximate latitude, number of 14C dates compared, and weighted mean offset in 14C years. Row 1: GrM vs. IntCal20, Northern Hemisphere, Various, no approximate latitude, 70 14C dates compared, 0 14C years offset plus or minus 3. Row 2: GrM vs. ETH, Timahoe West Ireland, Oak, 53 degrees North, 70 14C dates compared, 5 14C years offset plus or minus 3. Row 3: GrM vs. MAMS, Knetzgau Germany, Oak, 49 degrees North, 66 14C dates compared, minus 4 14C years offset plus or minus 3. Row 4: GrM vs. AA, Sheep Mountain California USA, Bristlecone pine, 37 degrees North, 69 14C dates compared, minus 10 14C years offset plus or minus 3. Row 5: GrM vs. AA, Timahoe West Ireland, Oak, 53 degrees North, 48 14C dates compared, 1 14C years offset plus or minus 5. Row 6: GrM vs. AA, Gordion Turkey, Juniper, 39 degrees North, 70 14C dates compared, minus 17 14C years offset plus or minus 4. Row 7: GrM vs. AA, Gibsons Farm Dargaville New Zealand, Kauri, 35 degrees South, 40 14C dates compared, minus 35 14C years offset plus or minus 5.
The offset of –35 ± 5 14C years with the kauri data confirms the difference in the 14C concentration in the atmosphere between the Northern and Southern Hemispheres (NH, SH) (Hogg et al. Reference Hogg, Heaton, Hua, Palmer, Turney, Southon, Bayliss, Blackwell, Boswijk, Ramsey and Pearson2020; –36 ± 27 14C years). Otherwise, GrM data shows statistically significant offsets relative to the AA measurements on bristlecone pine from Sheep Mountain (–10 ± 3 14C years) and juniper from Gordion (–17 ± 4 14C years), as the 2σ ranges for these offsets do not overlap zero. In contrast, the GrM offsets relative to ETH oak (5 ± 3 14C years) and MAMS (–4 ± 3 14C years) datasets are not statistically significant.
The variances obtained are unlikely to result from inter-laboratory offsets, as GrM does not show a significant difference with AA measurements on oak (1 ± 5 14C years). However, it should be noted that the absolute age of the juniper sample is based on a wiggle-matched sequence, even though the calendar year match is quite precise (± 4 years for the sequence’s final ring). Thus, our offset calculations might not reflect a direct year-to-year comparison.
The offset in 14C years observed between GrM and AA datasets from Gordion and Sheep Mountain (approximately 15°–16° and 17°–18° difference with Northern Ireland datasets respectively) accord with the latitudinal gradient proposed by Büntgen et al. (Reference Büntgen, Wacker, Galván, Arnold, Arseneault, Baillie, Beer, Bernabei, Bleicher, Boswijk and Bräuning2018). Their research has highlighted that the 14C concentrations are higher at latitudes above 60°, identifying a “meridional north–south gradient of declining average 14C values” (Büntgen et al. Reference Büntgen, Wacker, Galván, Arnold, Arseneault, Baillie, Beer, Bernabei, Bleicher, Boswijk and Bräuning2018). The atmospheric 14C levels can vary across different atmospheric circulation zones, which are defined through carbon cycle modeling and 14C dating over the Bomb Period (Hua et al. Reference Hua, Barbetti and Rakowski2013, Reference Hua, Turnbull, Santos, Rakowski, Ancapichún, De Pol-Holz, Hammer, Lehman, Levin, Miller and Palmer2022). Such factors are particularly relevant to dating of the Thera eruption, as the island is located in NH Bomb Zone 2, much farther south than the trees that make up the calibration curve, which predominantly grew in NH Bomb Zone 1. Any latitude variation in 14C levels on the calibration curve could therefore influence the results.
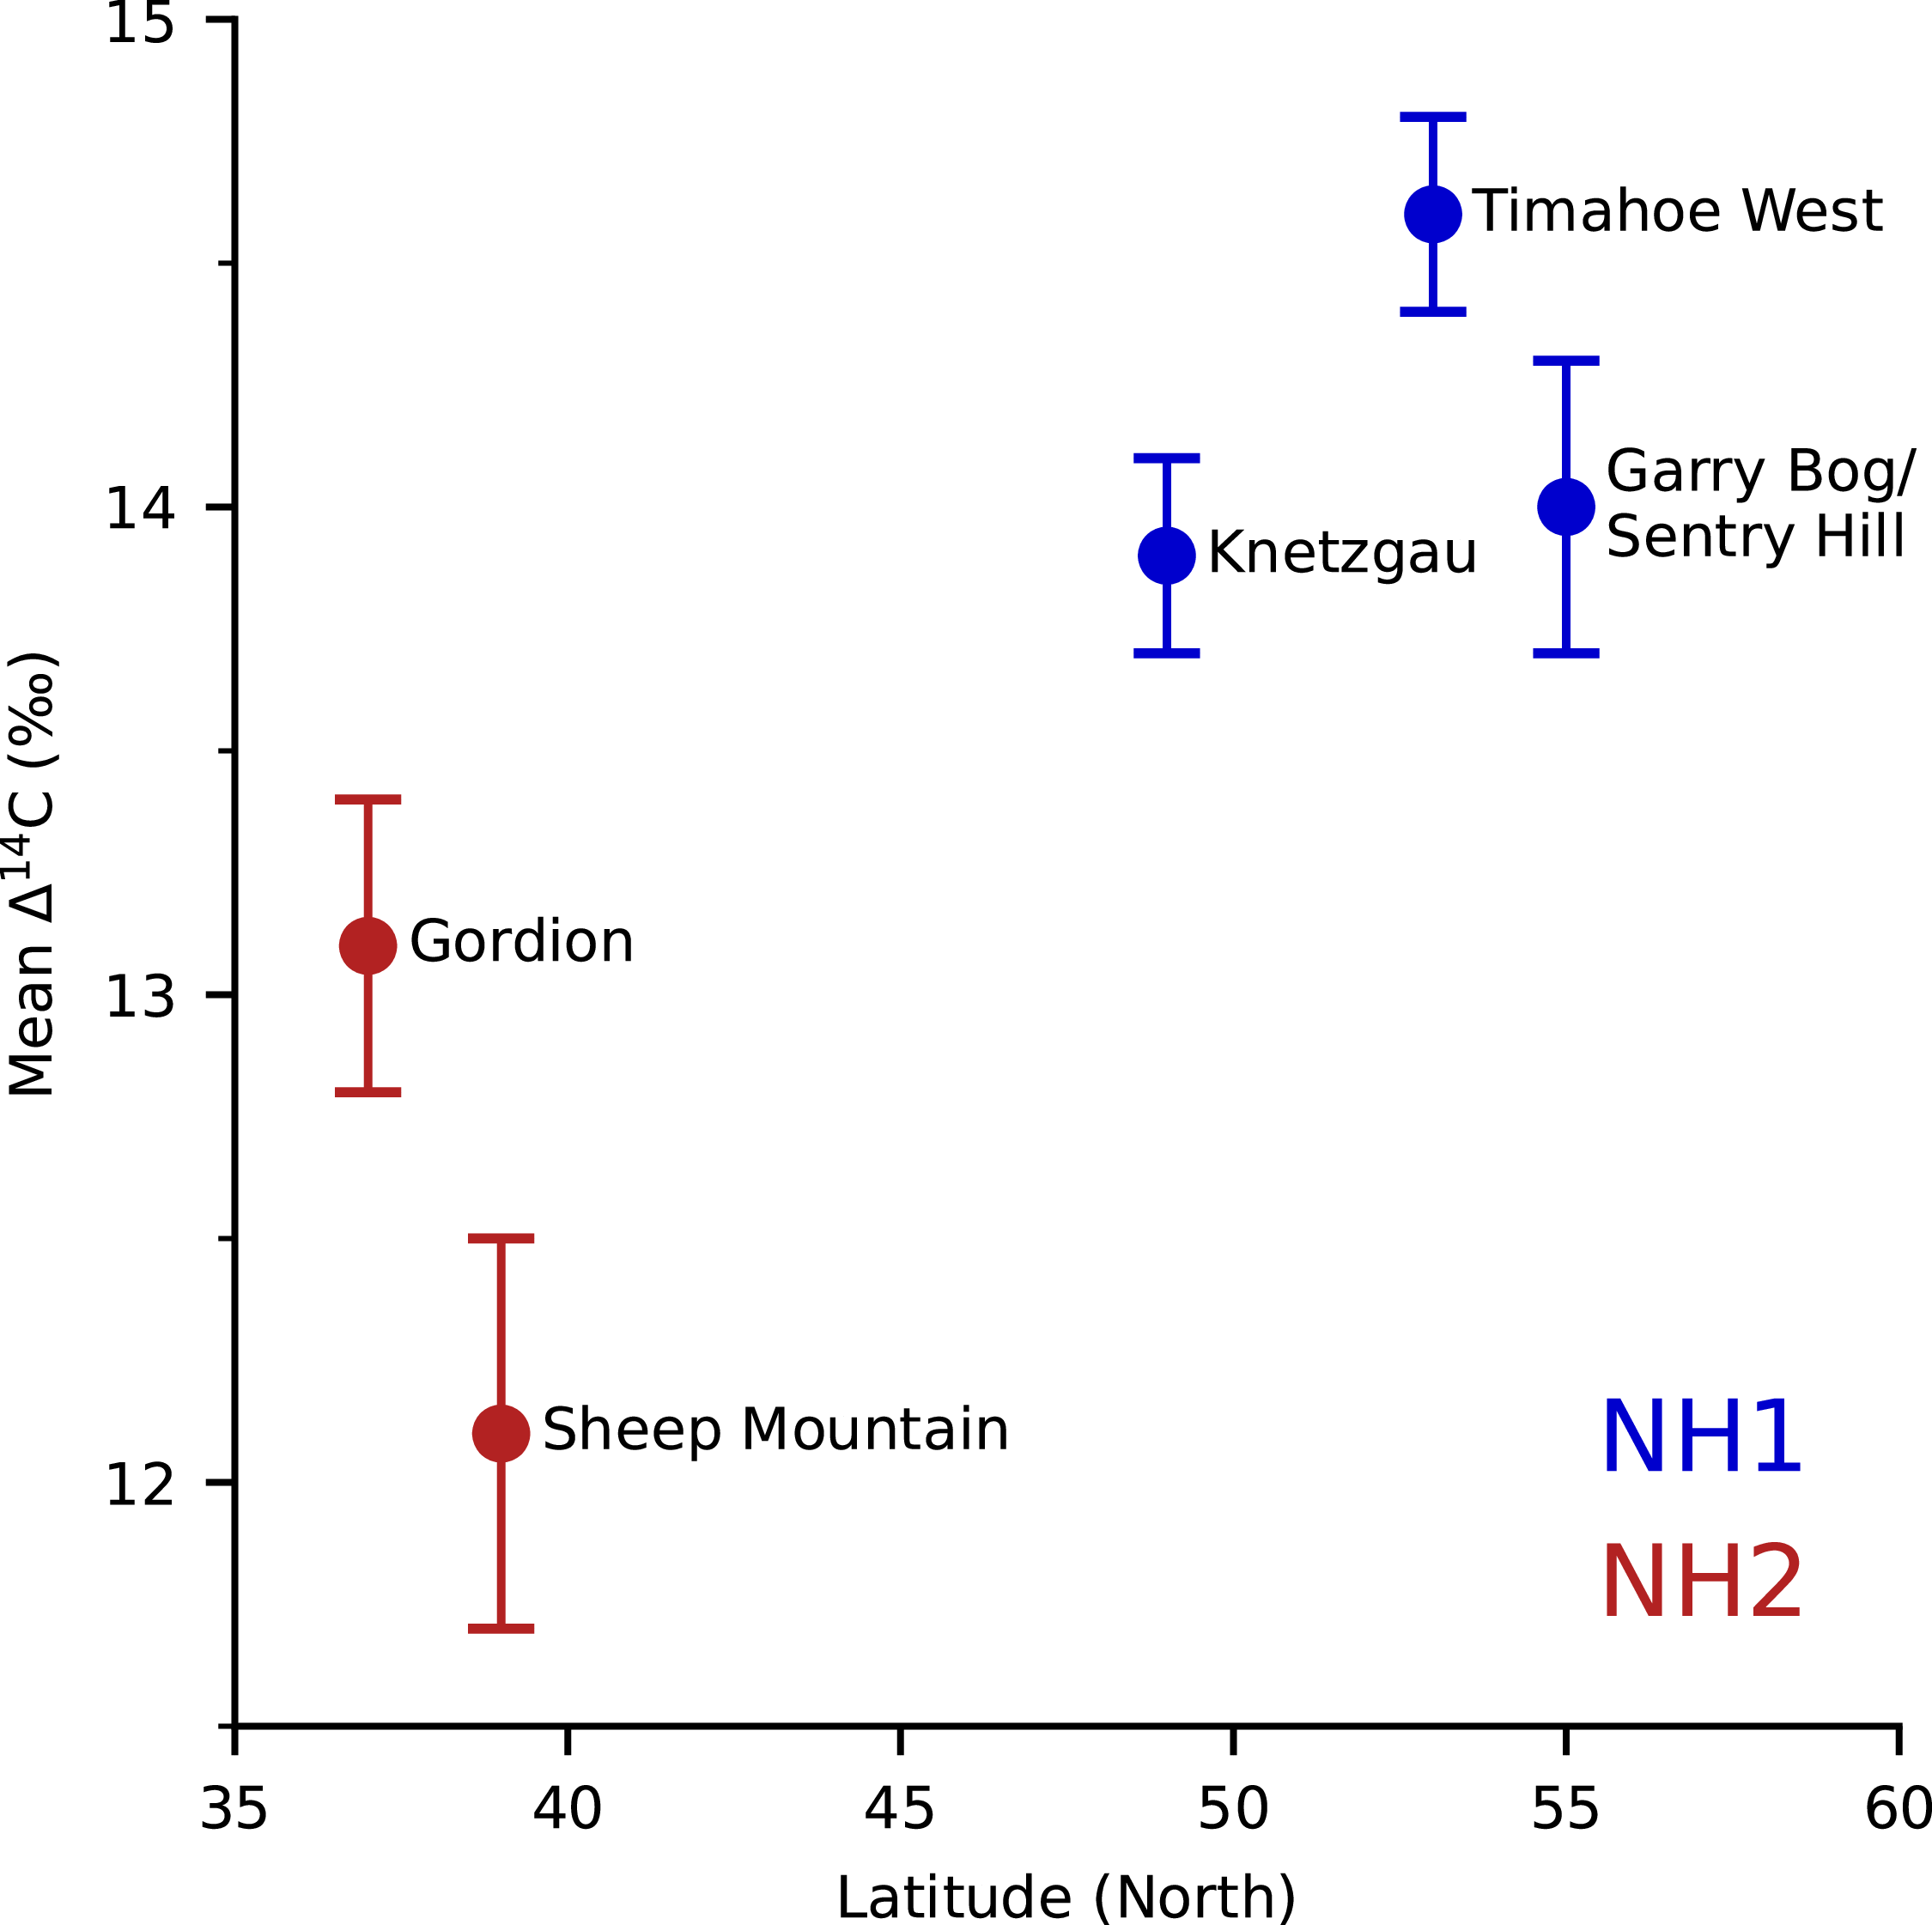
To assess this effect, we plotted the mean Δ14C (‰) values in relation to latitude, following a similar approach to Büntgen et al. (Reference Büntgen, Wacker, Galván, Arnold, Arseneault, Baillie, Beer, Bernabei, Bleicher, Boswijk and Bräuning2018, p.4), as shown in Figure 2. We used 66 14C measurements from 1610 to 1510 BCE across the five NH latitudes listed in Table 2. This subset was selected as it represents the common calendar years present across all datasets. Our results reveal a similar pattern to their analysis with a strong positive correlation between latitude and the mean Δ14C values, higher latitudes exhibiting higher 14C concentrations. It should be acknowledged that our dataset is limited to only five groups.
Scatter plot of the mean ∆14C values by latitude. The mean value of 66 14C measurements on tree rings between 1510–1610 BCE. Datasets are from Knetzgau, Timahoe West and Garry Bog/Sentry Hill (NH1); Sheep Mountain and Gordion (NH2).

Figure 2 Long description
A scatter plot showing mean delta 14C values by latitude for tree rings between 1510 and 1610 BCE. The x-axis represents latitude in degrees North, ranging from 35 to 60. The y-axis represents mean delta 14C values in percentage, ranging from 12 to 15. The plot includes several data points, each representing a dataset from different locations: Knetzgau, Timahoe West, Garry Bog/Sentry Hill, Sheep Mountain, and Gordion. The data points are color-coded into two groups: NH1 in blue and NH2 in red. Each data point is labeled with its corresponding location. The plot shows variations in mean delta 14C values across different latitudes, with some clustering and distinct separation between the two groups. All values are approximated.
However, when comparing samples from different latitudes, several lurking variables could not be controlled for. These include variations in local growing season, tree physiology and even differences in laboratory pretreatment. At higher latitudes, trees tend to grow primarily in mid-to-late summer, whereas at lower latitudes, growth occurs earlier, between spring and early summer (Kromer et al. Reference Kromer, Manning, Kuniholm, Newton, Spurk and Levin2001; Manning Reference Manning2024a). This coincides with the seasonal fluctuations of atmospheric 14C levels, reaching a minimum in late winter and a maximum in late summer for NH (Kitagawa et al. Reference Kitagawa, Mukai, Nojiri, Shibata, Kobayashi and Nojiri2004 ; Levin and Kromer Reference Levin and Kromer2004; Manning et al. Reference Manning, Griggs, Lorentzen, Bronk Ramsey, Chivall, Jull and Lange2018, Reference Manning, Wacker, Büntgen, Bronk Ramsey, Dee, Kromer, Lorentzen and Tegel2020b). As a result, trees from higher latitudes, such as Irish and German oaks, take in carbon during this maximum, potentially making their 14C ages slightly younger. In contrast, trees from lower latitudes, such as Turkish juniper, tend to absorb carbon earlier in the year, leading to slightly older ages (Dee et al. Reference Dee, Brock, Harris, Ramsey, Shortland, Higham and Rowland2010; Kromer et al. Reference Kromer, Manning, Kuniholm, Newton, Spurk and Levin2001). This is consistent with what we present in Table 2 and Figure 2, with measurements on higher latitude trees exhibiting younger ages. Bristlecone pine from California, however, has a particularly short and distinct growing period in summer because of the high altitudes at which it grows (Beasley and Klemmedson Reference Beasley and Klemmedson1980; Pearson et al. Reference Pearson, Wacker, Bayliss, Brown, Salzer, Brewer, Bollhalder, Boswijk and Hodgins2020b). It should thus primarily record the summer maximum in 14C values and should align more closely with boreal wood rather than with trees from similar latitudes, such as Turkish juniper. Yet, the 14C levels in bristlecone pine appear more comparable to Turkish juniper, indicating that additional factors may be driving the observed offsets.
Another such parameter is differences in laboratory approaches and pretreatment protocols. For example, the observed offsets could relate to differences between the earlywood and latewood fractions of trees. Due to seasonal atmospheric fluctuations and carbon storage dynamics, it has been suggested that NH latewood tends to contain more 14C, and hence appears younger, than earlywood (McDonald et al. Reference McDonald, Chivall, Miles and Ramsey2019). While this difference was not statistically significant within 2σ, McDonald et al. (Reference McDonald, Chivall, Miles and Ramsey2019) report a 96% probability that latewood is more enriched. This observation is qualitatively consistent with a recent study on tree physiology using samples from the post-bomb era by Kromer et al. (Reference Kromer, Wacker, Friedrich, Lindauer, Friedrich, Bitterli, Treydte, Fonti, Martínez-Sancho and Nievergelt2024). They claim that earlywood in most species is formed from stored older carbon, whereas latewood is primarily derived from products of more recent photosynthesis. Among the datasets listed in Table 2, only the Timahoe West samples are separated by wood fraction, with only latewood used, while the rest are measurements on full tree rings. Consistent with the aforementioned research on ring fractions, as shown in Figure 2, this dataset exhibits the highest mean Δ14C (‰) values, appearing younger than the rest. Such differences could contribute to small but consistent offsets, and further controlled studies are needed.
Finally, variations in the different pretreatment methods should also be taken into account. For example, the protocols used by Friedrich et al. (Reference Friedrich, Kromer, Wacker, Olsen, Remmele, Lindauer, Land and Pearson2020) and Pearson et al. (Reference Pearson, Wacker, Bayliss, Brown, Salzer, Brewer, Bollhalder, Boswijk and Hodgins2020b) involve holocellulose, while our GrM dataset is the only one analysed using α-cellulose. Even though it requires a longer and harsher procedure than simple holocellulose extraction (Khumalo et al. Reference Khumalo, Svarva, Zurbach and Nadeau2024) and therefore may be problematic for poorly preserved samples (Capano et al. Reference Capano, Miramont, Guibal, Kromer, Tuna, Fagault and Bard2018; Jędrzejowski et al. Reference Jędrzejowski, Michczyńska, Kłusek, Michczyński, Pawełczyk, Piotrowska, Heeb and Hajdas2024), α-cellulose is a more discerning protocol, and results in higher removal of lignin and other potential contaminants (Hoper et al. Reference Hoper, McCormac, Hogg, Higham and Head1997; Rinne et al. Reference Rinne, Boettger, Loader, Robertson, Switsur and Waterhouse2005). One previous research found no statistically significant difference between these two pretreated fractions, although the 14C measurements on α-cellulose from the same tree rings were consistently older than those on holocellulose in their dataset (Lange et al. Reference Lange, Nordby, Murphy, Hodgins and Pearson2019). It therefore remains unclear which fraction yields the most representative age.
In Table 2, there is no significant inter-laboratory offset between our data and MAMS, ETH or AA measurements on the same wood species (oak) from northern Europe (Knetzgau, Timahoe West). This was expected due to the minimal differences in latitude between the sampling locations and the use of the same species. However, for the remaining comparisons, multiple variables, such as species and latitude differences, growing seasons, atmospheric 14C fluctuations, and pretreatment techniques, make it challenging to isolate the exact cause of the observed offsets. Nevertheless, the offsets between these different datasets exert only a limited influence on calibrations using IntCal, since the curve is constructed as a statistically smoothed average of all these records.
Short-term features in mid-16th century BCE
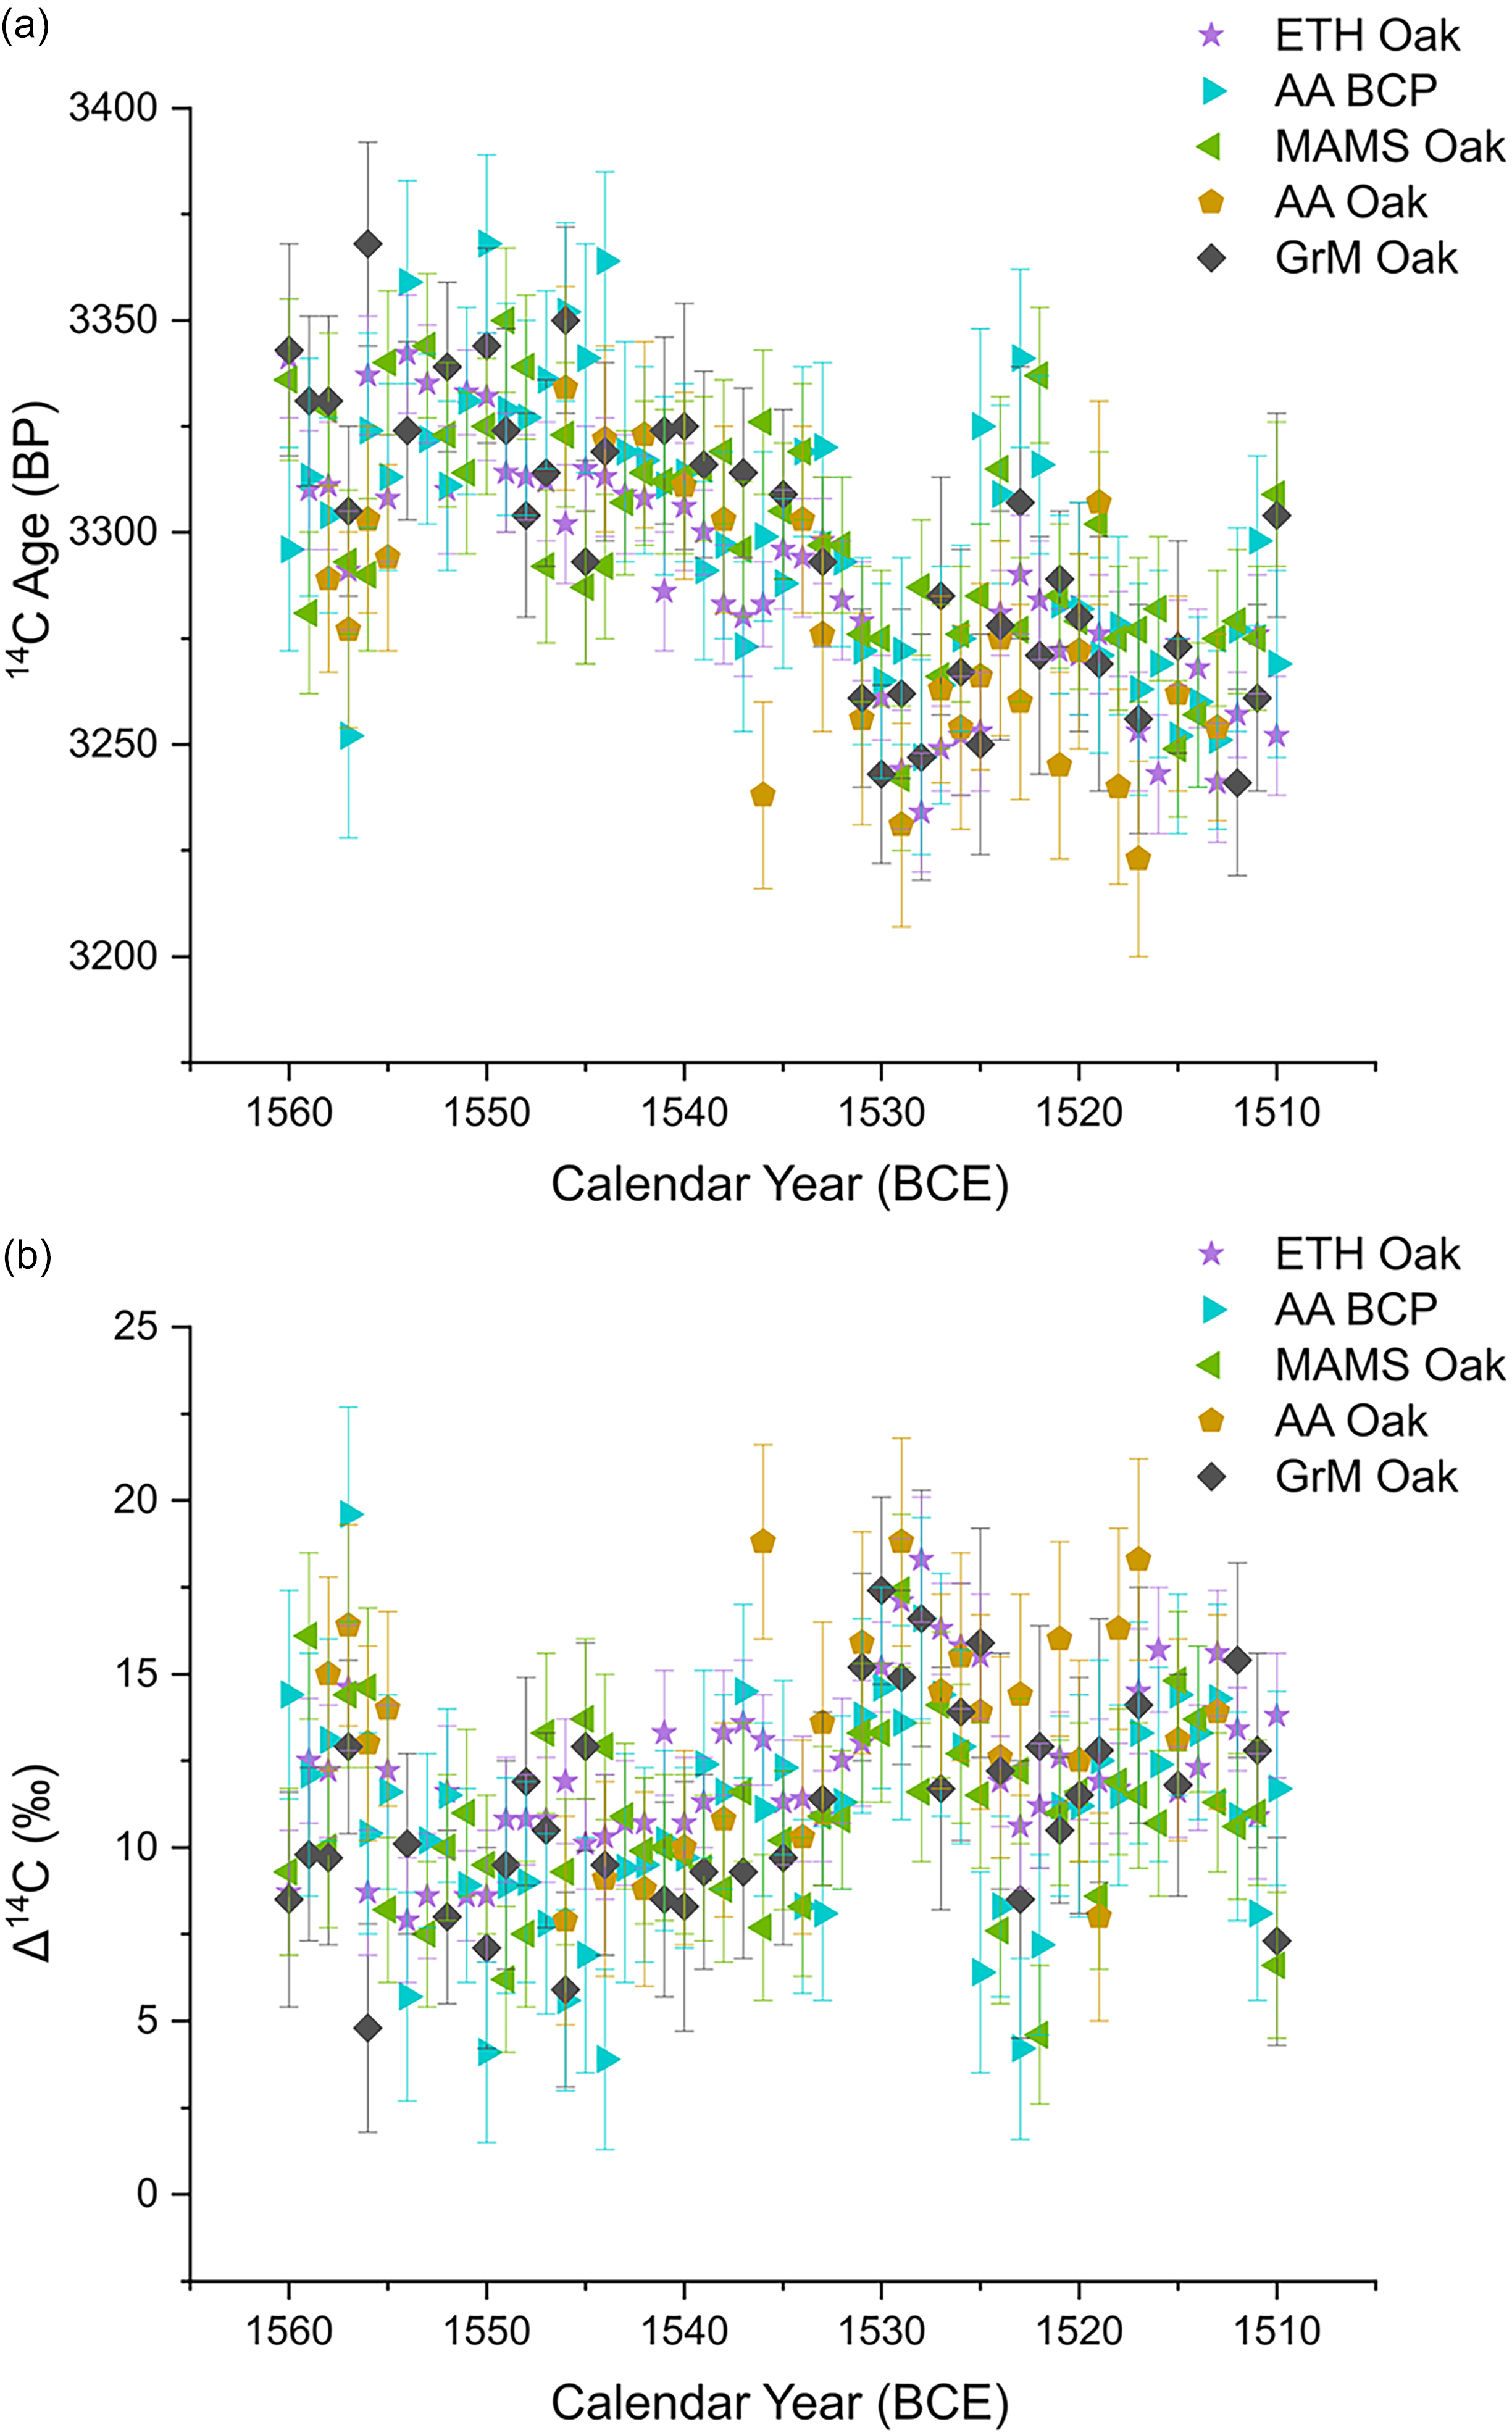
To investigate the veracity of the possible Miyake Events in 1557 and 1528 BCE, we first zoom in to our dataset and extract 50 years of measurements over the period 1560–1510 BCE. Once again, we compare the data obtained by our laboratory with some of the IntCal20 composite datasets over this window (see Figure 3). Our GrM measurements align more closely with those of ETH than AA or MAMS. We do not observe the specific anomaly reported by Pearson et al. (Reference Pearson, Wacker, Bayliss, Brown, Salzer, Brewer, Bollhalder, Boswijk and Hodgins2020b) around 1558-1557 BCE, similar to the ETH, AA oak and MAMS datasets. However, the GrM, ETH and AA bristlecone pine data all show a short-lived but comparatively sharp decrease between 1557-1556 BCE (GrM 8‰; ETH 6‰; AA bristlecone pine 9‰).
Single year measurements between 1560–1510 BCE from GrM (this study), along with ETH, AA (Pearson et al. Reference Pearson, Brewer, Brown, Heaton, Hodgins, Jull, Lange and Salzer2018, Reference Pearson, Wacker, Bayliss, Brown, Salzer, Brewer, Bollhalder, Boswijk and Hodgins2020b), and MAMS (Friedrich et al. Reference Friedrich, Kromer, Wacker, Olsen, Remmele, Lindauer, Land and Pearson2020) showing (a) 14C data (b) corresponding Δ 14C values.

Figure 3 Long description
A scatter plot with two panels representing radiocarbon data and corresponding values from different studies between 1560 and 1510 BCE. The x-axis in both panels represents the calendar year in BCE, ranging from 1560 to 1510. The y-axis in the top panel represents the radiocarbon age in years before present (BP), ranging from 3200 to 3400. The y-axis in the bottom panel represents the delta radiocarbon values in percentage, ranging from 0 to 25. The data points are color-coded and shaped differently to represent different studies: ETH Oak, AA BCP, MAMS Oak, AA Oak, and GrM Oak. The data points show variations and clusters, indicating differences in radiocarbon ages and values across the studies. All values are approximated.
Turning to the proposed anomaly around 1528 BCE, there is a very similar pattern between all laboratories around 1534–1515 BCE, where a steep rise in 14C levels is indeed observed. This increase begins in 1533 and peaks between 1530 and 1528 BCE and subsequently declines in all the datasets. The peak rise amounts to approximately 5–6‰ for GrM; 7‰ for ETH; 8‰ for AA bristlecone pine; 6–7‰ for MAMS; and 8‰ for AA oak in Figure 3b. While the value is lower than the confirmed Miyake Events listed in the Introduction; it is comparable to the proposed events of 1052–1053 CE (5.9‰) and 1279–1280 CE (6.5‰) (Brehm et al. Reference Brehm, Christl, Knowles, Casanova, Evershed, Adolphi, Muscheler, Synal, Mekhaldi, Paleari and Leuschner2022), the existence of which has latterly been disputed by Scifo et al. (Reference Scifo, Abi Nassif, Conti, Bayliss, Doeve and Dee2024). Further, the values show an exponential increase over 4–5 years rather than an abrupt rise or a spike like a Miyake Event, similar to the rise between 541–546 CE (6‰) reported by Scifo et al. (Reference Scifo, Abi Nassif, Conti, Bayliss, Doeve and Dee2024).
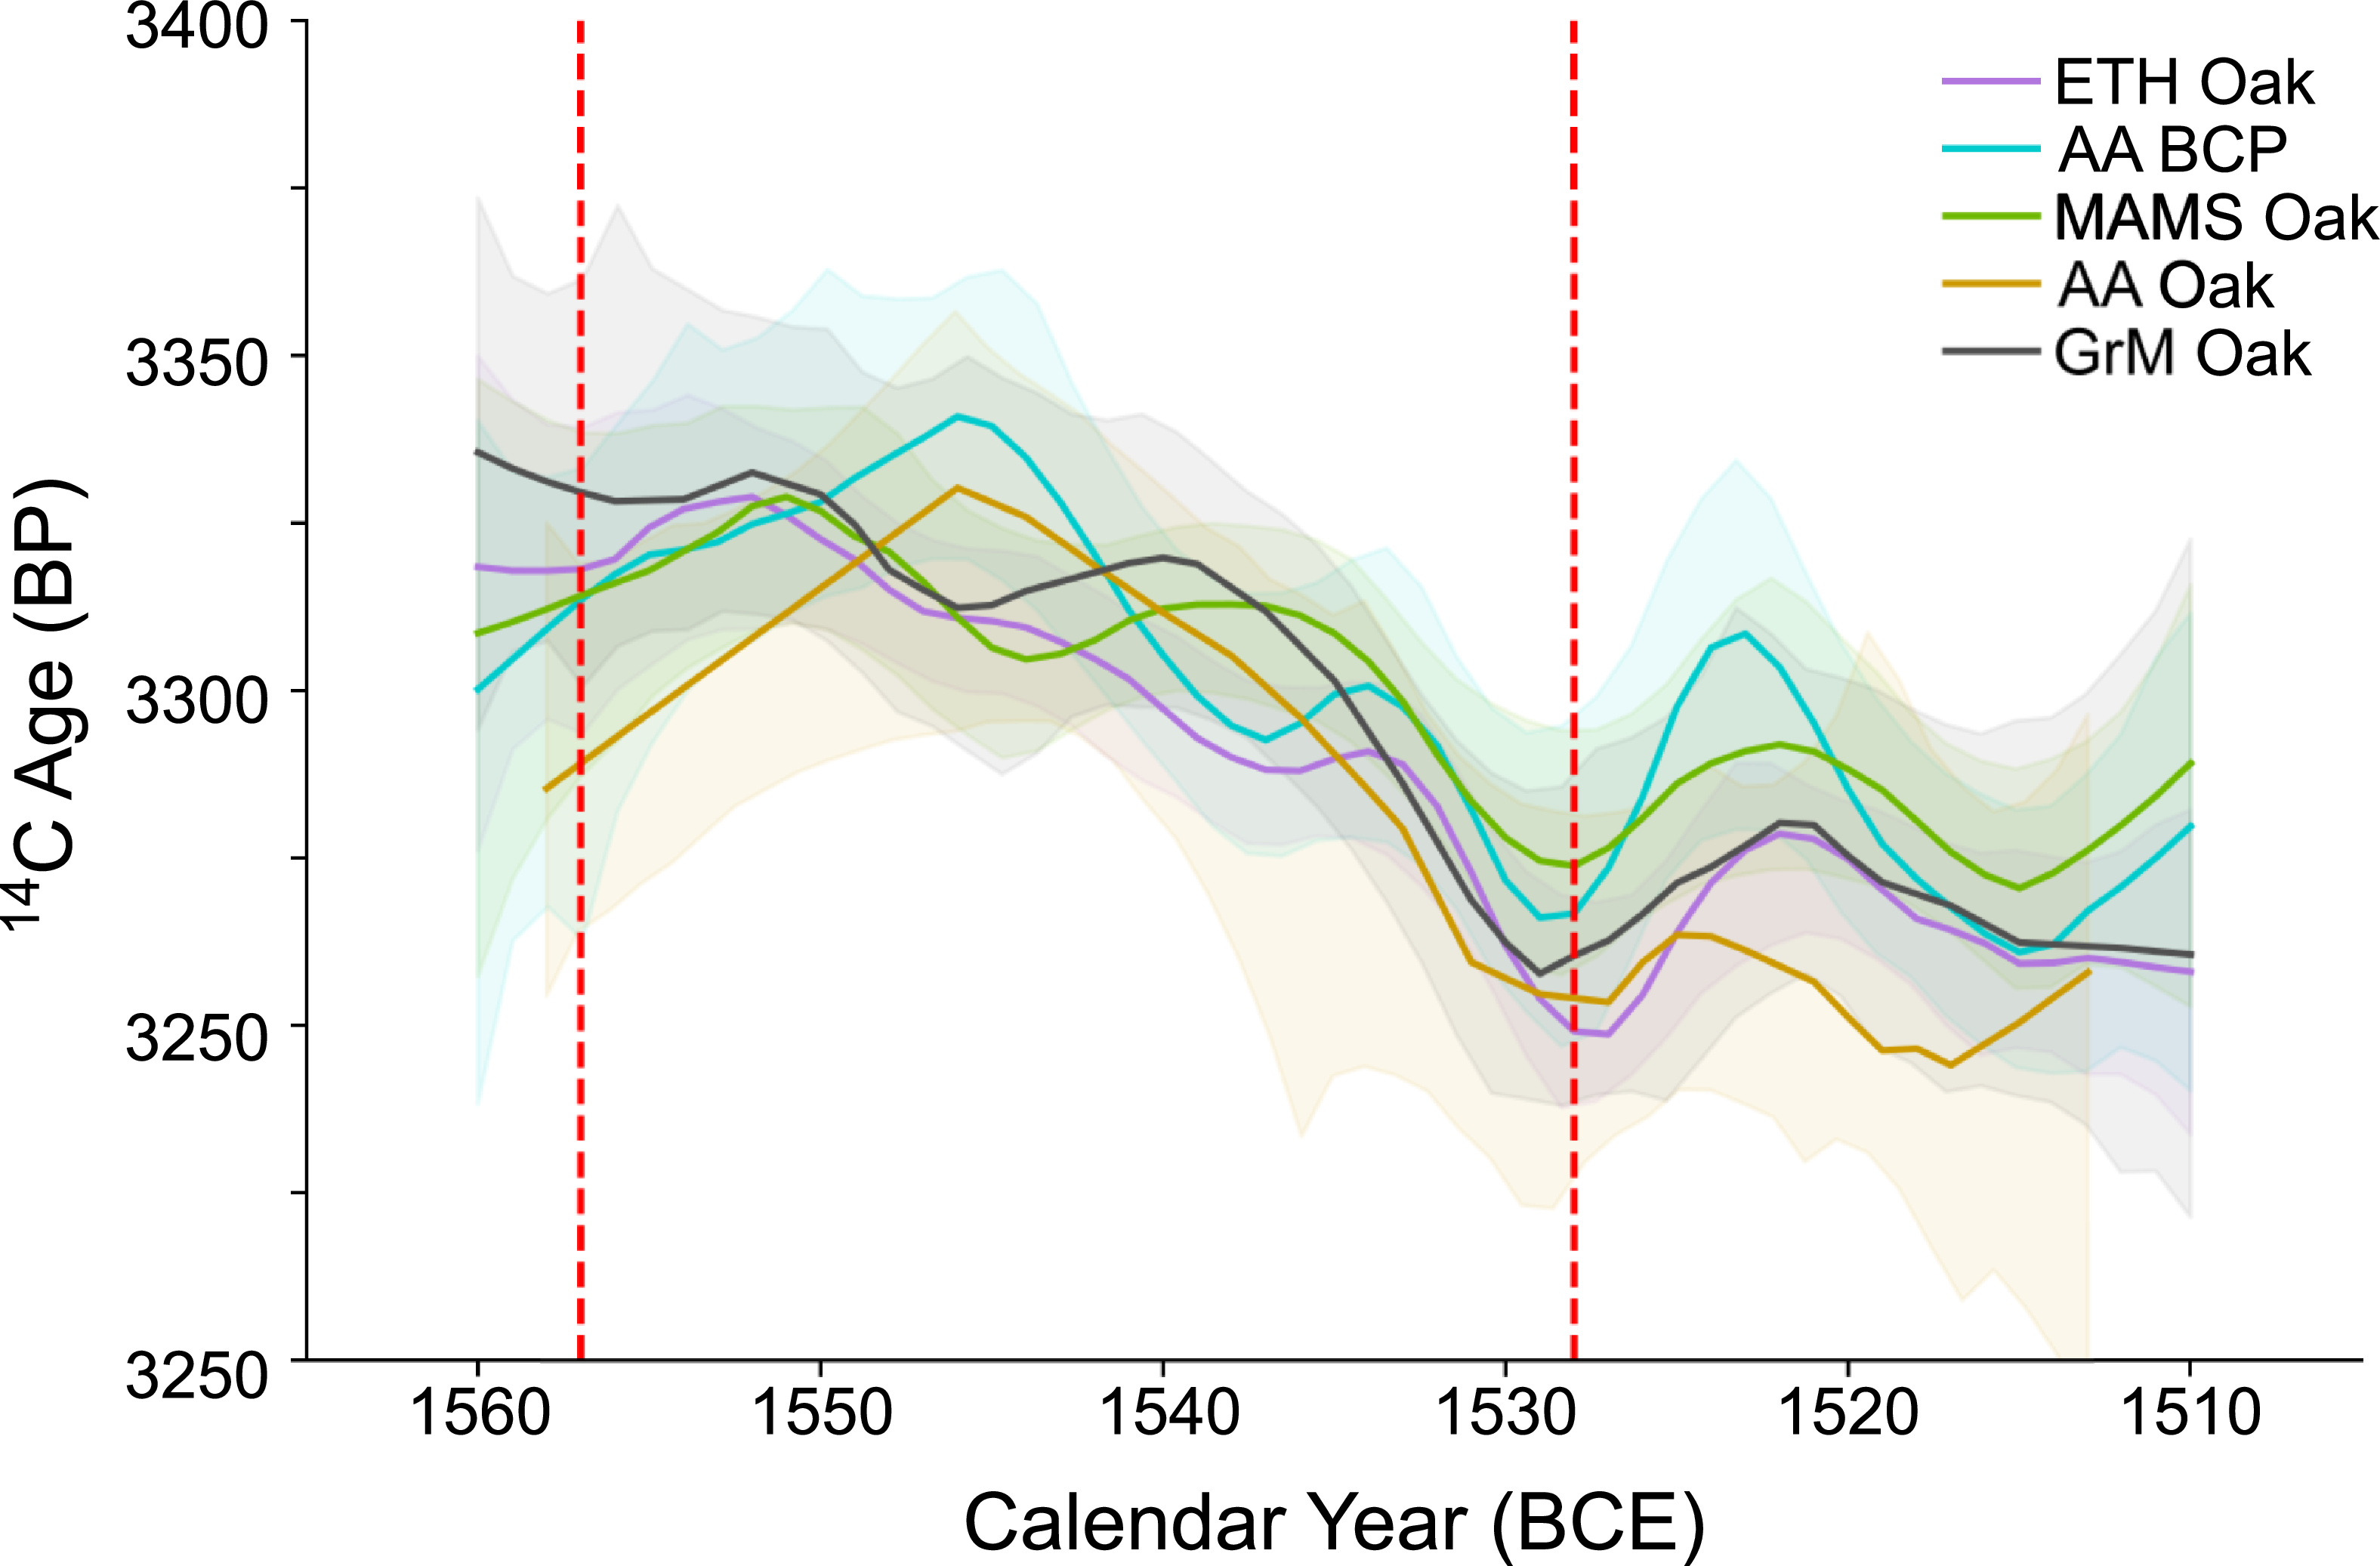
While the gradual rise in 14C levels ca. 1530 BCE lacks the characteristics of a Miyake Event, there seems to be a particular pattern evident in all the datasets. The shape of the data between 1534 and 1515 BCE becomes visually apparent after applying data smoothing, as shown in Figure 4. We used the Loess nonparametric method of data smoothing since the GrM, MAMS and AA oak datasets do not have evenly spaced x-axis values, as some calendar years were skipped. Although the intensity of the 14C concentration varies over this period, for instance AA bristlecone pine and MAMS show elevated levels between 1525–1520 BCE, the overall wiggle pattern is consistent across all labs (GrM, AA, ETH, and MAMS) and latitudes (Ireland, Germany, California). This pattern may still offer a time marker of similar value, provided the sample in question has the right characteristics (i.e. a series of single-year samples) for its identification. For instance, if the eruption had occurred after 1530 BCE, this undulation would almost certainly be evident in the data.
The 14C data shown in Figure 3 smoothed using the Loess nonparametric method. The red lines mark the previously reported anomalies on 1557 and 1528 BCE. A similar wiggle fluctuation pattern is visible across all datasets between 1534 and 1515 BCE.

Figure 4 Long description
The line graph presents radiocarbon age data over calendar years before common era, with five datasets labeled ETH Oak, AA BCP, MAMS Oak, AA Oak, and GrM Oak. The x-axis represents calendar years from 1560 to 1510 BCE, and the y-axis represents radiocarbon age in years before present (BP), ranging from 3250 to 3400 BP. Each dataset is represented by a distinct colored line with corresponding shaded regions indicating uncertainty. The red dashed lines mark previously reported anomalies at 1557 and 1528 BCE. A similar wiggle fluctuation pattern is visible across all datasets between 1534 and 1515 BCE. All values are approximated.
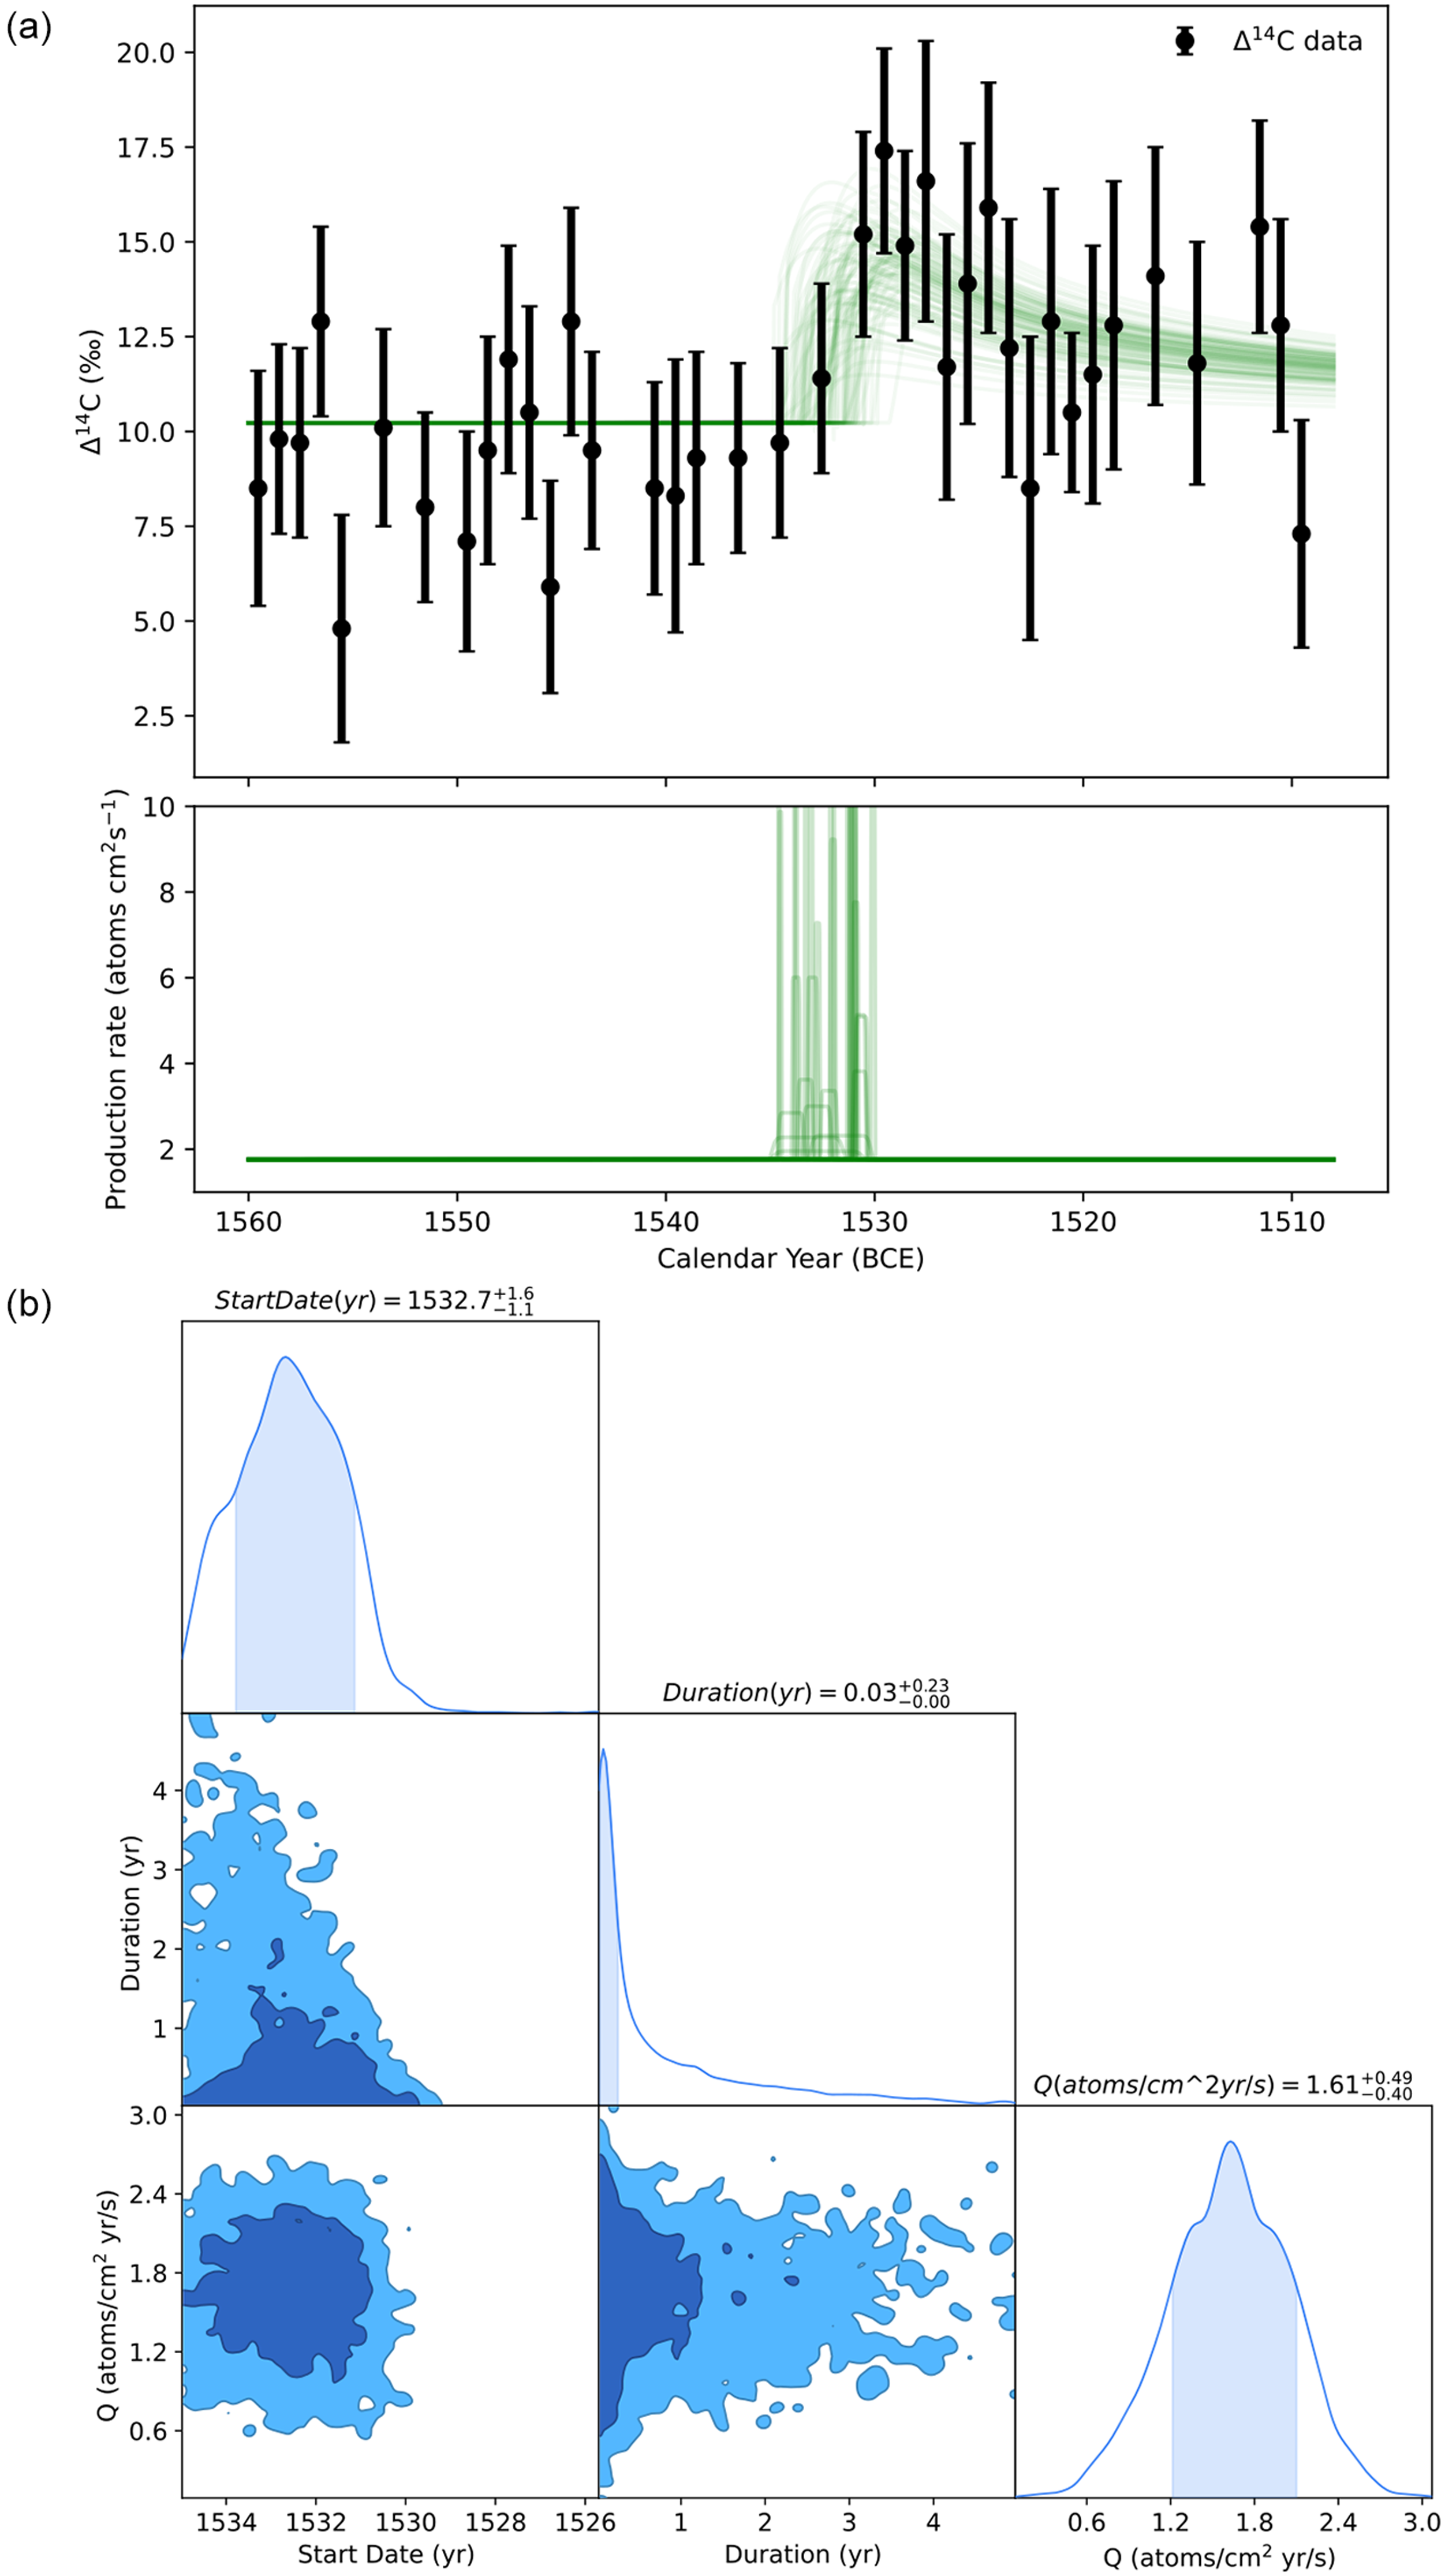
Potential candidates for Miyake Events can also be examined using carbon box models (see Scifo et al. Reference Scifo, Abi Nassif, Conti, Bayliss, Doeve and Dee2024; Brehm et al. Reference Brehm, Pearson, Christl, Bayliss, Nicolussi, Pichler, Brown and Wacker2025). We investigated the proposed anomaly in 1528 BCE using the open-source Python package ticktack on the extracted data over the period 1560–1510 BCE on Garry Bog only (Zhang et al. Reference Zhang, Sharma, Dennis, Scifo, Kuitems, Büntgen, Owens, Dee and Pope2022; Sharma et al. Reference Sharma, Zhang and Dennis2023). This modeling library is designed to analyse ∆14C (‰) values, detect potential anomalies and summarize 14C production data. Detailed explanations of this package and its application to different datasets are provided in Zhang et al. (Reference Zhang, Sharma, Dennis, Scifo, Kuitems, Büntgen, Owens, Dee and Pope2022). We used the 22-box model of Brehm et al. (Reference Brehm, Bayliss, Christl, Synal, Adolphi, Beer, Kromer, Muscheler, Solanki, Usoskin and Bleicher2021), already implemented within ticktack, and applied spike only command to test whether there is a sudden rise on 14C production on 1528 BCE (see Supplementary Material Table S6 for model specifications). This method is specifically designed to identify potential events within the input dataset.
The results of the modeling are presented in Figure 5. First, we display the model estimates in terms of ∆14C (‰) in Figure 5a. The key posterior parameters from this analysis, the Start Date, Duration, and Q, with the latter representing integrated 14C yields over the observed rise, are shown in Figure 5b. A small potential increase in 14C production of approximately 1.6 14C atoms/cm2/s per year is estimated to occur around 1532.7 ( $^{+1.6}_{-1.1}$
years) BCE. In comparison, the 775 event produced 6.4 14C atoms/cm2/s per year (Scifo et al. Reference Scifo, Abi Nassif, Conti, Bayliss, Doeve and Dee2024), so our data shows an increase in production rate that is roughly four times lower. Our result is comparable with the 1052 CE (1.4 atoms/cm2/s), 1279 CE (1.1 atoms/cm2/s), and 540s CE (1.7 atoms/cm2/s) event candidates. All these latter features are ambiguous and characterized by low production rates and unresolved start dates. Indeed, they may simply represent normal variations in solar modulation, as reported by Scifo et al. (Reference Scifo, Abi Nassif, Conti, Bayliss, Doeve and Dee2024). Furthermore, we do not have a 14C measurement for the year 1532 BCE, as our data skips from 1533 to 1531 BCE, which may have influenced the model’s interpretation of a possible rise in 14C production. Nevertheless, the models exclude 1528 BCE as a starting date for a Miyake Event at 95.4% probability (Figure 5b).
$^{+1.6}_{-1.1}$
years) BCE. In comparison, the 775 event produced 6.4 14C atoms/cm2/s per year (Scifo et al. Reference Scifo, Abi Nassif, Conti, Bayliss, Doeve and Dee2024), so our data shows an increase in production rate that is roughly four times lower. Our result is comparable with the 1052 CE (1.4 atoms/cm2/s), 1279 CE (1.1 atoms/cm2/s), and 540s CE (1.7 atoms/cm2/s) event candidates. All these latter features are ambiguous and characterized by low production rates and unresolved start dates. Indeed, they may simply represent normal variations in solar modulation, as reported by Scifo et al. (Reference Scifo, Abi Nassif, Conti, Bayliss, Doeve and Dee2024). Furthermore, we do not have a 14C measurement for the year 1532 BCE, as our data skips from 1533 to 1531 BCE, which may have influenced the model’s interpretation of a possible rise in 14C production. Nevertheless, the models exclude 1528 BCE as a starting date for a Miyake Event at 95.4% probability (Figure 5b).
Focus on 1560–1510 on new GrM 14C data, all dates are in BCE. (a) The possible Δ 14C (‰) estimates of the event from spike only model results shown in green lines (b) Corner plot of the posterior parameters from the ticktack model showing 68.2% (dark blue) and 95.4% (light blue) probability ranges.

Figure 5 Long description
A scatter plot with error bars showing the relationship between calendar year in BCE and delta 14C percentage. The x-axis represents the calendar year ranging from 1560 to 1510 BCE, and the y-axis represents the delta 14C percentage ranging from 2.5 to 20 percentage. The data points are black circles with error bars indicating variability. Green lines and shaded areas represent model estimates of the event. The lower panel shows the production rate in atoms per square centimeter per second over the same time period, with a notable spike around 1530 BCE. The second part of the image is a corner plot displaying the posterior parameters from the ticktack model, including start date, duration, and production rate. The plot shows 68.2 percent and 95.4 percent probability ranges in dark blue and light blue, respectively. The start date is approximately 1532.7 years BCE, the duration is around 0.03 years, and the production rate is about 1.61 atoms per square centimeter per year squared. All values are approximated.
In summary, there is only weak evidence to suggest a significant and sudden 14C production event comparable with the previously confirmed, globally replicated Miyake Events. Hence, there is no specific tie point here for chronology, particularly for the Thera eruption.
Modeling of the archaeological datasets related to the eruption of Thera
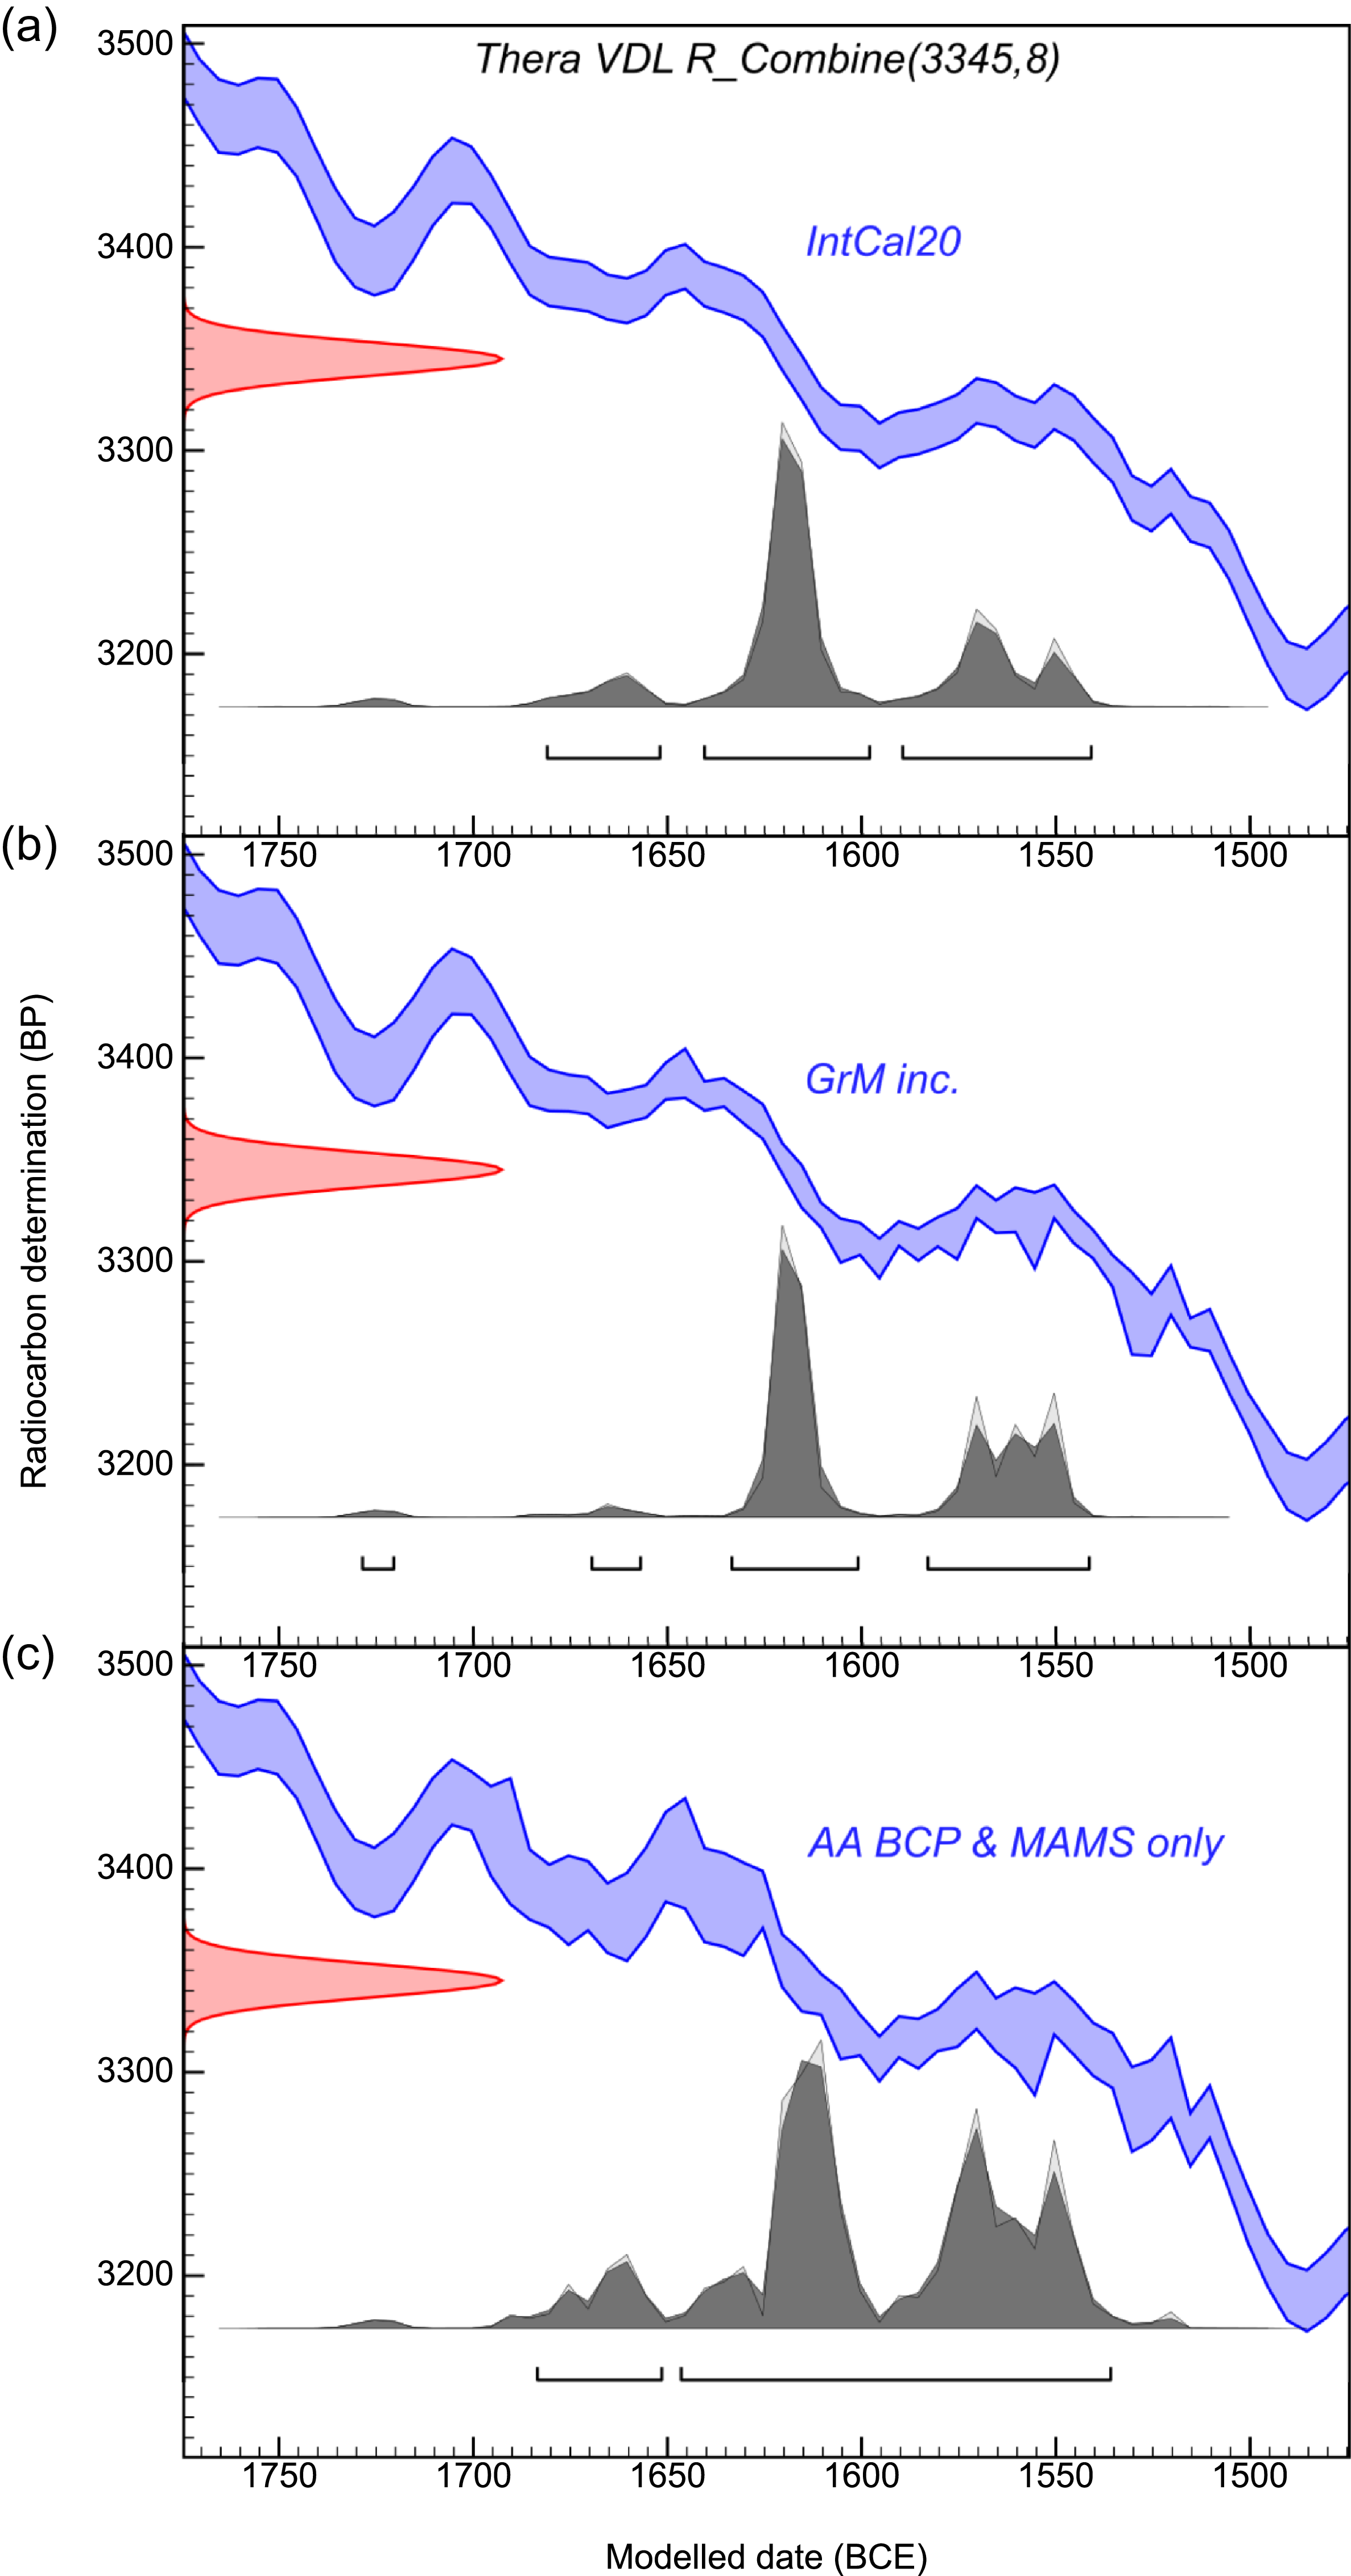
The smoothed curves on Figure 4 reveal elevated 14C levels in the AA bristlecone pine and MAMS datasets after 1530 BCE, with measurements reaching as much as 3300 BP. In contrast, the other datasets do not show such high 14C ages post-1530 BCE. Such features could also influence the 14C calibrations for the Thera eruption. To test this, we prepared two new calibration curves: one that incorporated single-year IntCal20 data with the new GrM data (GrM inc.), and another based solely on AA bristlecone pine and MAMS data (AA BCP & MAMS-only). These two test curves are simply the weighted average of the measurements for each calendar year from the single-year datasets.
Using IntCal20 and these two test curves, we employed OxCal software (Bronk Ramsey Reference Bronk Ramsey2009a, version 4.4) to rerun the R_Combine analysis of 24 14C dates on short-lived plant samples from the Akrotiri volcanic destruction level (VDL) at Thera, excluding four problematic measurements with uncertain contexts, as discussed by Manning (Reference Manning2024a). The resulting calibrations using each curve are not significantly different from each other (Figure 6). The highest region of probability still falls between 1650–1600 BCE. The only difference is the GrM data introduces a slight probability for the eruption date to be earlier than the 1700s, which is not archaeologically feasible.
Calibration of Thera Akrotiri VDL seeds dataset using R_Combine using (a) IntCal20 (b) single-year IntCal20 data incorporating the new GrM measurements (c) AA bristlecone pine and MAMS-only data.

Figure 6 Long description
The line graph presents radiocarbon determination over modeled dates for the Thera Akrotiri VDL seeds dataset using three different calibration methods. The x-axis represents the modeled dates in before common era (B C E) ranging from 1750 to 1500, while the y-axis represents the radiocarbon determination in before present (B P) ranging from 3200 to 3500. The graph includes three subplots: (a) using IntCal20, (b) using single-year IntCal20 data incorporating the new GrM measurements, and (c) using AA bristlecone pine and MAMS-only data. Each subplot shows a blue line representing the calibration curve and a red shaded area indicating the uncertainty range. Gray peaks and troughs represent the radiocarbon data points and their distribution over time. All values are approximated.
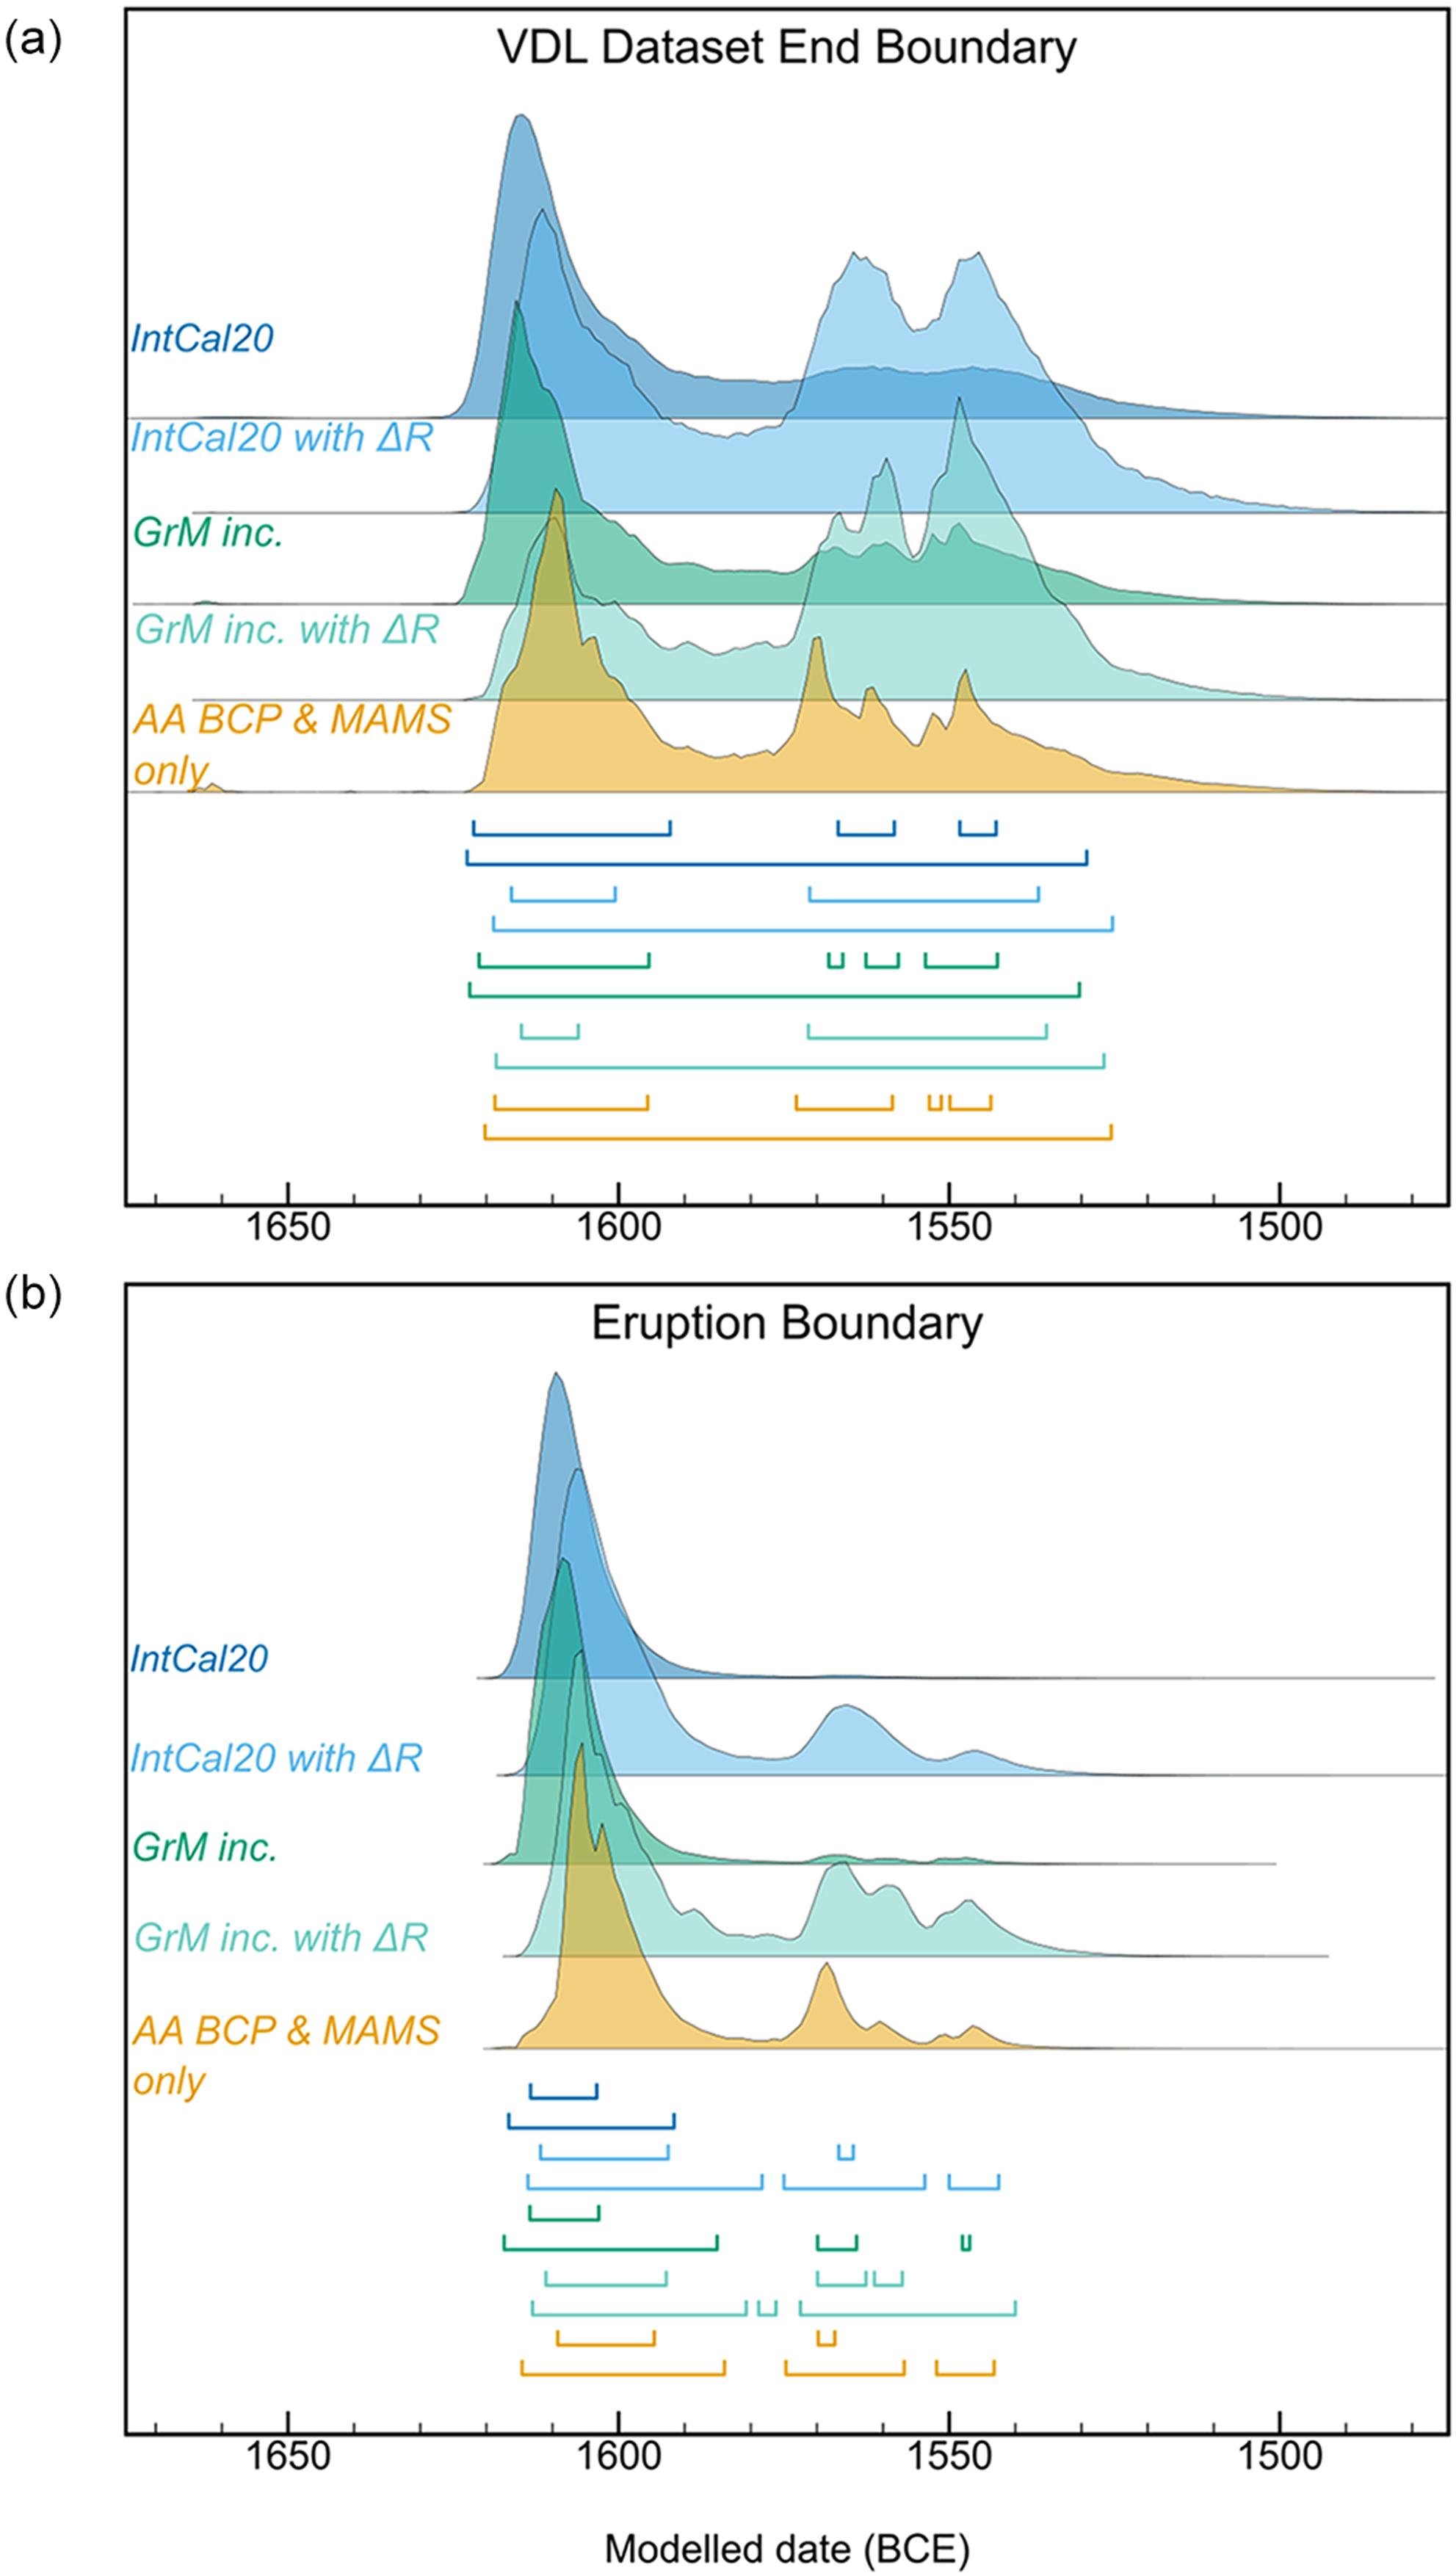
Apart from using R_Combine with the VDL dataset, we also tried modeling them simply by placing the 24 measurements under a Phase within two uniform Boundary functions. The resulting probability for the end Boundary for this model is given on Figure 7a. Since this model is very simple, with no specific constraints, the resulting probabilities are wider. The highest region of probability still falls in the 17th century BCE.
Modeled results for (a) the end Boundary of Akrotiri VDL seeds, (b) the Eruption Boundary of the model by Manning (Reference Manning2024a) incorporating Thera olive sequence, Therasia shrub sequences and the VDL dataset, using different calibration curves and Delta_R adjustment. The models are run with three different curves: IntCal20 (blue), single-year IntCal20 data incorporating the new GrM measurements (green), and a curve using AA bristlecone pine and MAMS-only data (orange). The 68.3% and 95.4% probability ranges are shown below the graphs, following the respective color coding.

Figure 7 Long description
The line graph presents modeled results for the end boundary of Akrotiri VDL seeds and the eruption boundary. The graph includes three different calibration curves: IntCal20 in blue, single-year IntCal20 data incorporating the new GrM measurements in green, and a curve using AA bristlecone pine and MAMS-only data in orange. The x-axis represents modeled dates in BCE, ranging from 1650 to 1500. The y-axis shows the probability density. The 68.3% and 95.4% probability ranges are displayed below the graphs, following the respective color coding. All values are approximated.
Additionally, we tested the applicability of the Delta_R adjustment to account for a potential offset for the Thera dataset in comparison to the calibration curve, in light of the results of our analysis in the previous section of this paper. As discussed earlier, the precise cause of these observed offsets could be a combination of factors, including differences in growing season, tree physiology, laboratory pretreatment, and potentially latitude. The latitudinal gradient proposed by Büntgen et al. (Reference Büntgen, Wacker, Galván, Arnold, Arseneault, Baillie, Beer, Bernabei, Bleicher, Boswijk and Bräuning2018) also correlates with differences in growing season and offers a practical proxy for modeling purposes. We explore this by applying a Delta_R correction of 10 ± 3 which is the offset between the GrM oak vs. AA bristlecone pine measurement. This offset approximately reflects the difference between the trees that predominantly contribute to the calibration curve between 1700–1500 BCE (Irish and German oak) and the latitude of Thera. We recognise that this might be an oversimplification of multiple overlapping effects; however, latitude is the only variable we can control using the available data. With this compensation included the probability for a 16th century date for the eruption increases (Figure 7a). However, there are 882 14C measurements in total between 1700 and 1500 BCE in IntCal20 and 198 measurements come from AA bristlecone pine, representing 22% of these data. Thus, just under a quarter of the IntCal20 data used to calibrate 14C dates from the Theran eruption come from the same latitude as the volcano, compared to 33% from German oak and 42% from Irish oak. So, while it seems highly likely that an offset exists, it would be significantly less than 10 ± 3 in the case where all the IntCal20 data are included. Applying this offset is less justified when using the AA BCP & MAMS-only curve, where 50% of the data in this period comes from the same latitude and would not be affected by a latitude-related offset, and we have therefore not included this version in the figures.
Since the 14C calibration curve over this period is affected by a plateau (Manning Reference Manning2024a), it is customary to make use of Bayesian modeling to incorporate constraints. To address this issue, we reran the most extensive model proposed by Manning (Reference Manning2024a) which integrates the Therasia olive shrub sequences (Pearson et al. Reference Pearson, Sbonias, Tzachili and Heaton2023), Thera olive sequence (Friedrich et al. Reference Friedrich, Kromer, Friedrich, Heinemeier, Pfeiffer and Talamo2006) as well as the VDL dataset (Manning Reference Manning2014; Manning et al. Reference Manning, Ramsey, Kutschera, Higham, Kromer, Steier and Wild2006) (see Manning Reference Manning2024a for the OxCal code and the underlying rationale). However, we have adapted the code with a uniform Boundary instead of Tau Boundary and also included a General Outlier model (Bronk Ramsey Reference Bronk Ramsey2009b). These models were run both with and without the aforementioned Delta_R adjustment. While this approach introduces more constraints to the model, it allows us to overcome the impact of the plateau. The Boundary labelled as Eruption is plotted on Figure 7b. The 95.4% probability ranges are narrower than those of the VDL model as a result of the additional constraints. There is less probability allocated to 16th century BCE, with the highest probability again clustering around 1600 BCE. Yet, despite the elevated 14C levels of AA bristlecone pine and MAMS datasets, the modeled results still do not support a timeline for the eruption as late as 1500 BCE.
Conclusions
The IntCal20 calibration curve is the product of extensive collaboration across multiple disciplines. This international effort is essential for achieving accuracy and precision in 14C dating. Inclusion of datasets from different laboratories, as well as samples from diverse latitudes and tree species, enhances the reliability of the calibration curve and therefore the calibration process. In this context, we present new annual-resolution 14C data over 1660–1507 BCE, of direct relevance to the ongoing discussion of the date of the Thera eruption.
We have compared our measurements with datasets from other leading laboratories contributing to IntCal20. While our results overlap with IntCal20, the offset analysis reveals the possibility of a seasonal, latitudinal, species or pretreatment related effect as previously discussed in literature. We do not observe any distinct features around 1557 or 1528 BCE that could serve as a definitive chronological marker for the Thera eruption. However, there is a distinctive pattern evident in 14C levels between 1530–1520 BCE in all datasets, which warrants further investigation. Potentially, this pattern could be used as a fingerprint in obtaining an exact date of the eruption.
Furthermore, we reran models related to the Thera eruption from existing literature using several test calibration curves. However, even when the models are ran using a curve with elevated 14C levels, the resulting probabilities consistently favour a late 17th or early 16th century date. Ultimately, while offsets in the calibration curve most certainly exist, they are unlikely to dramatically affect the longstanding debate on the timing of this event.
Supplementary material
To view supplementary material for this article, please visit https://doi.org/10.1017/RDC.2025.10186.
Data availability
Some of the data used in this study are derived from public domain resources. Additional data are available within the article and its supplementary materials.
Acknowledgments
The first author was supported by the Dutch Research Council (NWO, Grant No. PGW.21.013). All of the radiocarbon analyses as well as the project members at the University of Groningen were funded by the European Research Council project, ECHOES (ERC, Grant No. 714679). The authors would like to thank the laboratory staff at the Centre for Isotope Research, Groningen for their support.


 Open access