


1. Introduction
This paper focuses on examining framing and reframing (F-RF) in design by applying a Natural Language Processing (NLP)-based memory model to student design sessions. Framing and reframing are fundamental cognitive processes through which designers interpret situations, structure problems, construct meaning, and generate spaces of potential solutions. Frames can be understood as sets of interconnected concepts co-activated by prior knowledge, experiences, and value systems. Reframing occurs when these conceptual structures are introduced after an initial framing or are reorganized, allowing a reinterpretation of the design task and supporting the exploration of alternative directions (Reference DorstDorst, 2015; Reference Kelly and GeroKelly & Gero, 2022; Reference SchönSchön, 1983). Framing and reframing create design spaces of possibilities.
Although the importance of F-RF in design thinking has long been acknowledged, much of the literature remains conceptual or descriptive, often relying on qualitative analysis and theoretical models. These approaches provide valuable insights but offer limited capacity for systematic measurement of how frames emerge, evolve, and interact over time. As a result, empirical research that quantifies framing and reframing behaviors is still underdeveloped.
Recent advances in Natural Language Processing (NLP) offer new opportunities to analyze framing behaviors from designers’ verbalizations (Reference Casakin, Sopher, Anidjar and GeroCasakin et al., 2024). To address current limitations, this study introduces an NLP-based memory model that functions as a frame extraction tool, operationalizing frames as dynamically co-activated concepts within verbal protocols. By incorporating the cognitive plausibility of recency-weighted concept activation, the model captures both the number of frames generated and their semantic properties, offering a structured, repeatable, and cognitively grounded method for examining framing behavior.
Using data from individual think-aloud design sessions, this study investigates framing behaviors among design students across three design phases—Designing, Finalizing, and Debriefing—while also examining potential gender-related patterns. By focusing on novices, the analysis highlights how design students initiate and refine problem representations, thereby establishing a foundation for future comparisons with expert designers.
Specifically, this research seeks to investigate:
RQ1. Based on the Memory Model, how does the number of frames generated by design students vary across different stages of the design process, and between male and female participants?
RQ2. Based on the Memory Model, how does the semantic value of frames generated by design students evolve throughout the design process, and between male and female participants?
By addressing these questions, the paper contributes to design cognition research through a computational model approach to F-RF. It demonstrates how quantitative measures of frames can yield new insights into student design processes and provides a methodological basis for future studies comparing expertise, gender, and other variables.
2. Framing and reframing in design cognition
Frames assist in structuring experiences, allowing individuals to make sense and respond to their environment (Reference GoffmanGoffman, 1974). In design cognition, framing and reframing are considered fundamental mechanisms that involve the co-activation of concepts generated within the design process (Reference Kelly and GeroKelly and Gero, 2022). Frames function as conceptual structures through which designers interpret a problem situation, prioritize relevant aspects, and construct a working understanding of the design task (Reference DorstDorst, 2011; Reference SchönSchön, 1983). Framing allows designers to transform ill-structured problems (Reference SimonSimon, 1973) into manageable representations that can guide the development of potential solutions. Framing is not only a cognitive act of interpretation but also a generative one, as it determines which directions are explored and which are excluded (Reference Dorst and CrossDorst & Cross, 2001).
Reframing occurs when these conceptual structures are reorganized, modified, or new frames introduced, enabling designers to reinterpret the design situation and open new possibilities for ideation (Reference DorstDorst, 2015; Reference Paton and DorstPaton & Dorst, 2011). This process often reflects a shift in perspective that leads to the discovery of alternative design directions, fostering creative breakthroughs (Reference BeckmanBeckman, 2020; Reference Casakin, Sopher, Anidjar and GeroCasakin et al., 2025). Reframing can therefore be seen as a critical driver of a deeper understanding and expansion of the design space, as it modifies existing interpretations while maintaining coherence with the broader design context.
In design cognition, F-RF is closely linked to the iterative dynamics of divergent and convergent thinking. Designers frame problems by generating preliminary interpretations that enable divergent exploration of ideas; they reframe when new insights require reinterpretation or when convergence toward a solution demand restructuring of the problem space (Reference DorstDorst, 2019). Framing not only guides solution generation but also reflects a designer’s knowledge, expertise, views and values, highlighting its central role in both professional practice and design education (Reference Cardoso, Badke-Schaub and ErisCardoso et al., 2016).
Although the importance of framing and reframing is well established, most empirical work remains qualitative, relying on case studies or theoretical models. Such approaches limit the ability to systematically measure framing behaviors or compare them across contexts (Reference Casakin, Sopher, Anidjar and GeroCasakin et al., 2024). Developing quantitative methods for identifying, representing, and analyzing frames can advance understanding of design cognition. They can reveal patterns in how frames emerge, evolve, and interact over time. This paper contributes to this aim by proposing an NLP-based memory model to quantify F-RF behaviors and applies it in student design sessions.
3. Memory models, design cognition, and framing
Memory is a core component of human cognition and design thinking. Cognition research describes memory as a dynamic network of interrelated concepts whose activation depends on context, recency, and associative strength (Reference AndersonAnderson, 1983; Reference CowanCowan, 2001). Memory does not function as a passive storehouse (Reference BartlettBartlett, 1932). Instead, it continuously reorganizes itself through processes of activation and decay. It strengthens frequently accessed information while allowing unused concepts to fade (Reference BaddeleyBaddeley, 2012). Such mechanisms explain how designers recall, combine, and reinterpret knowledge when dealing with complex, evolving design problems.
In design cognition, memory supports retrieval and reinterpretation of information. Designers do not simply recall past experiences but actively reconstruct and adapt them to new contexts, generating fresh perspectives on design challenges (Reference CrossCross, 2007; Reference GoldschmidtGoldschmidt, 2016). Therefore, memory-based models in design offer a theoretical bridge between cognitive science and design research. They provide an analytical instrument to formalize how knowledge representations evolve through time (Reference Gero and KannengiesserGero & Kannengiesser, 2004).
Gero’s theoretical and computational work has played a central role in linking memory and design cognition. The Function–Behaviour–Structure (FBS) framework (Reference GeroGero, 1990) models design as a sequence of representational transformations between functions, behaviours, and structures. The Situated FBS extension (Reference Gero and KannengiesserGero & Kannengiesser, 2004) embeds these transformations within a dynamic, context-sensitive model that incorporates the notion of constructive memory and interpretation. In this extended framework, memory contributes to the reinterpretation of evolving design situations through internal constructions and reformulations that integrate new experiences and contextual interaction.
Gero’s concept of constructive memory (Reference GeroGero, 1999) proposes that memory retrieval is not simple reproduction, but an active reconstruction influenced by context, cues, and interpretation of the situation. In design, constructive memory allows past experiences to be reorganized and reinterpreted in response to emerging situations, supporting framing and reframing. Reference Gero and SmithGero (2005) describes designing as a sequence of situated acts to emphasize that design moves are episodic and informed by prior experience. Reference Liew and GeroLiew and Gero (2004) developed a computational model based on this principle. They showed how a design agent’s memory dynamically constructs and updates knowledge through feedback between perception, experience, and internal representations. These studies suggest that memory in design is cumulative and selective, as ideas persist, evolve, or fade according to their relevance to the designer’s current context and goals.
The relationship between memory and framing lies in how designers restructure knowledge to define and redefine problems. Frames can be understood as configurations of activated memory structures that shape interpretation and guide attention (Reference DorstDorst, 2015). Reframing occurs when these structures are restructured or augmented with new frames. This means that constructive memory activates new associations or inhibits existing ones. This reconstructive process allows alternative problem definitions and design directions to emerge. Memory therefore supports the dynamics of framing in design, enabling continuous reinterpretations of design situations. This view of memory provides a cognitive foundation for understanding design as a process of ongoing framing and reframing. In this study, this perspective is operationalized through an NLP-based memory model that is used to identify, maintain, and reactivate frames over time based on patterns of concept activation and decay.
4. Method
4.1. Study
The work presented in this paper is based on a controlled experiment. In this setup, twenty (N=20) architecture students individually engaged in an identical design task during a single design session. They were in their third year of undergraduate studies in architecture.
The experiment was conducted in a laboratory setting, with each session lasting approximately 65 minutes. The sessions were organized into three phases: Designing phase (40 minutes), dedicated to addressing the design task and exploring potential solutions; Finalizing phase (15 minutes), in which participants were asked to develop and presented their final design proposal; and Debriefing phase (10 minutes) during which they explained their designs retrospectively.
Participants received a design brief and a task sheet containing general instructions. They were instructed to verbalize their thoughts aloud to document their design activities. A fixed camera recorded the participants’ sketches and actions. The design task involved creating a small museum in an urban area characterized by the coexistence of historical and contemporary architectural contexts (adapted from Reference Casakin and KreitlerCasakin & Kreitler, 2011).
Figure 1 depicts the overall research design.
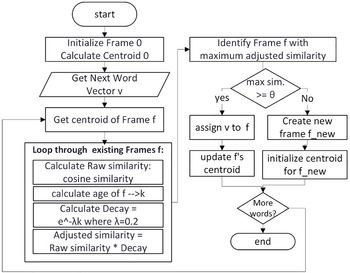
The process for computing frames is summarized in Figure 2 before presenting methodological details. The analysis followed four sequential stages: (i) transcription preprocessing and noun extraction from verbal design protocols; (ii) semantic embedding of extracted concepts; (iii) assigning each noun to a frame using a recency-weighted memory model; and (iv) computation of quantitative framing metrics for comparisons across design phases and participant groups. These stages are elaborated in the following subsections.
Research design

Process for computing frames

4.2. NLP-Based data preparation
To characterize the conceptual structure of participants’ design discourse, we implemented a Natural Language Processing (NLP) pipeline that systematically transformed the verbal transcripts into analyzable linguistic data. The objective of this stage was to extract and represent the core conceptual elements, specifically, the nouns that denote design-relevant concepts, used by each designer throughout the session. This process enabled the construction of a semantic space suitable for subsequent memory modeling and included the following steps.
1. Preprocessing: Verbal protocols from each design session were first transcribed verbatim and subjected to a series of standard preprocessing steps. Punctuation marks, non-verbal fillers, and stop words were removed to retain only semantically meaningful content. The cleaned text was then tokenized into individual word units, preserving the sequential order of utterances. This step ensured that the temporal flow of the discourse, a crucial component for modeling conceptual activation, was maintained.
2. Noun extraction: From the tokenized data, we extracted all nouns, treating them as proxies for conceptual entities verbalized by the designer. Noun extraction was carried out using YAP (Yet Another Parser), a Hebrew syntactic and morphological parser that integrates dependency parsing with Named Entity Recognition (Reference Tsarfaty, Seker, Sadde and KleinTsarfaty et al., 2019). YAP supports accurate part-of-speech tagging in morphologically rich languages such as Hebrew, making it especially suitable for this dataset. Its combined morphological and syntactic analysis allowed us to isolate noun tokens that represent the conceptual focus of each participant’s discourse. These noun tokens formed the foundational elements of the NLP-based memory model.
3. Representing each noun as a meaning-based vector: Each extracted noun was converted into a numerical representation using Multilingual BERT (mBERT), a machine learning model trained on over 100 languages, including Hebrew (Reference Devlin, Chang, Lee and ToutanovaDevlin et al., 2019). These numerical vector representations (also known as semantic embeddings) enabled us to compute semantic distances between concepts, providing a quantitative measure of how closely related or distinct they were over time. These embeddings served as the input for the memory model described in the following section.
4.3. NLP-based memory model
Building on the extracted and embedded noun data, we implemented a cognitively inspired memory model to simulate how designers’ conceptual frames emerge, evolve, and decay during the design session. This model is grounded in theories of constructive memory (Reference GeroGero, 1999; Reference Liew and GeroLiew & Gero, 2004) and in models of situated cognition (Reference Gero and KannengiesserGero & Kannengiesser, 2004). It assumes that memory is an active and temporally modulated process rather than a static repository. The model assumes that conceptual focus decays gradually and that new frames emerge either as extensions of recently active frames or as shifts to novel cognitive contexts.
In this model, frames are operationalized as clusters of semantically related nouns that together represent a coherent focus of attention. This operationalization is grounded in established theoretical perspectives that conceptualize frames as configurations of co-activated concepts shaping interpretation and attention (Reference DorstDorst, 2015; Reference Kelly and GeroKelly & Gero, 2022), and in constructive memory models in which meaning emerges from patterns of concurrent activation rather than isolated representations (Reference GeroGero, 1999). As participants speak, the model determines whether each new noun continues the current focus, reactivates an earlier one, or signals the emergence of a new idea. The nouns are processed in the same order they were spoken, enabling a dynamic reconstruction of each participant’s conceptual development.
The framing process is depicted in Figure 2. For each new noun embedding v, the model evaluates all existing frames through a unified memory-retrieval process:
1. Compute similarity to previous frames using memory decay
For each frame f, the cosine similarity between v and the frame’s centroid is computed. This similarity is then adjusted by an exponential decay factor
 $$\;{e^{ - \lambda k}},$$
where k indexes how long ago the frame was last active and
$$\;{e^{ - \lambda k}},$$
where k indexes how long ago the frame was last active and
 $$\lambda = 0.2$$
. This decay models the reduced impact of older or less recently referenced frames. The frame with the highest adjusted similarity is then identified.
$$\lambda = 0.2$$
. This decay models the reduced impact of older or less recently referenced frames. The frame with the highest adjusted similarity is then identified.
2. Assign the noun to the most appropriate frame
If the highest adjusted similarity meets the threshold θ, the noun is assigned to that frame, and the frame’s semantic centroid is updated. If no frame exceeds θ, a new frame is created and initialized with the current noun.
This mechanism captures both semantic continuity—when new nouns extend or reactivate prior conceptual structures—and semantic change—when new frames emerge. By tracking activation, decay, and reassignment across the transcript, the model provides a structured and interpretable representation of framing and reframing in design discourse.
4.4. Quantifying framing dynamics
To evaluate framing and reframing behavior quantitatively, we derived two complementary measures from the NLP-based memory model: (1) the breadth of framing and (2) the semantic value of frames. Together, these measures capture how often designers shifted their conceptual focus and how substantially their ideas changed throughout the design process.
(1) Breadth of framing (number of frames)
This measure reflects how frequently designers introduced new conceptual structures during the session. Each time the model initiated a new frame, it indicated a shift to a different idea. The total number of frames produced by a designer, therefore, represents the extent of exploration in their design reasoning. That is, how broadly they searched the conceptual design space. Because the three phases differed in duration, this value was normalized per minute for comparisons.
(2) Semantic value of frames (degree of conceptual change)
While the number of frames indicates how often conceptual shifts occurred, it does not reveal how big those changes were. To capture the magnitude of reframing, we measured the semantic distance between frames using cosine distance. For each frame, the model computed how different its embedded noun representations were from the frames that preceded it on average. Larger distance values indicate greater conceptual divergence, reflecting deeper reinterpretations of the design problem. These values were averaged for each participant and within each phase of the design task.
While the present study does not include an external human-coded validation or baseline segmentation comparison, frame identification is constrained by a theory-driven operationalization and fixed parameter settings applied uniformly across all participants and phases. Accordingly, the constructed frames are intended as consistent analytical units for comparative analysis rather than claims of ground-truth segmentation.
5. Results
5.1. Variation in the breadth of framing across the design process
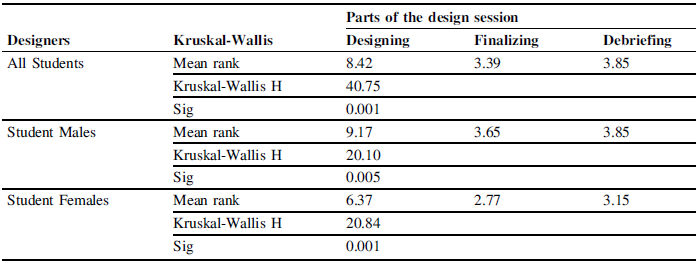
A series of Kruskal-Wallis H tests were conducted to analyze the influence of different phases of a design session, designated as Designing, Finalizing, and Debriefing, on the generation of Number of Frames, the measure of Breadth of Framing, for all participants. As the duration of each phase varied, the data was normalized by calculating the number of frames per minute. Results showed that framing activity was highest in the Designing phase and declined sharply in the Finalizing and Debriefing phases. Mean ranks indicate that students, including males and females, generated substantially more frames at the beginning of the process than later on (Table 1).
Wilcoxon tests results for number of frames across phases per minute

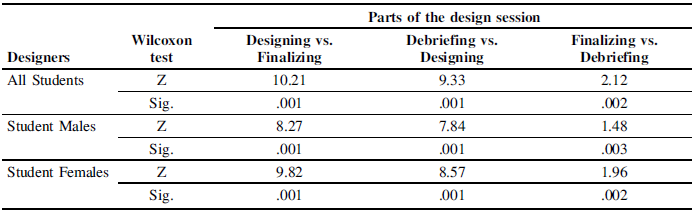
Pairwise comparisons using Wilcoxon tests indicated significant reductions from the Designing to the Finalizing phase, from the Designing to the Debriefing phase, and from the Finalizing to the Debriefing phase (Table 2).
Pairwise comparisons (Wilcoxon Tests) for number of frames in the process

Gender comparisons using Mann–Whitney U tests indicated that although male students produced more frames on average during the Designing and Finalizing phases, no statistically significant differences were observed in the Debriefing phase (Table 3). Overall, these results demonstrate a clear temporal pattern: students began with a high rate of framing that progressively decreased as they moved toward defining and finalizing their design solutions.
Mann-Whitney U test results for number of frames generated by males and females in the session

5.2. Variation in the semantic value of frames across the design process
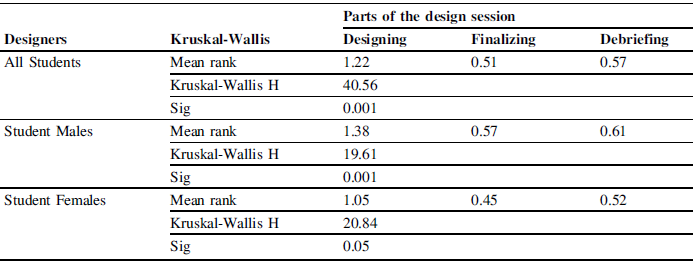
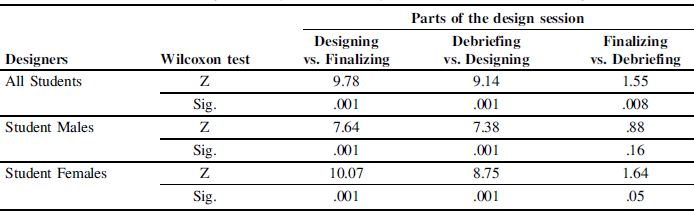
This section investigates how the semantic value of frames evolved throughout the design process, as measured by cosine similarity values derived from the NLP-based memory model. Results showed that semantic values decreased as the design progressed. The mean semantic value was highest during the Designing phase, lower during the Finalizing phase, and slightly higher again in the Debriefing phase. This was confirmed for both males and females, independently (Table 4).
Pairwise comparisons using Wilcoxon tests showed a significant decrease from the Designing to the Finalizing phase, from the Designing to the Debriefing phase, and from the Finalizing to the Debriefing phase. This was confirmed for the females, but in the case of males no differences were found between Finalizing and Debriefing parts (Table 6).
Wilcoxon tests results for number of frames across phases per minute

Pairwise comparisons (Wilcoxon tests) for number of frames in the process

Gender comparisons using Mann–Whitney U tests indicated that male students generated frames with higher semantic value during the Designing phase, but no statistically significant differences were found in the Designing and Debriefing phases (Table 6).
Mann-Whitney U test results for number of frames generated by males and females in the session

6. Discussion
6.1. Variation in the breadth of framing across the design process
The findings reveal a temporal pattern in framing behavior, where students generated the highest number of frames during the Designing phase, followed by a marked decline in the Finalizing and Debriefing phases. This progression reflects the well-established cognitive shift from divergent to convergent modes of thinking in design (Reference CrossCross, 2007; Reference Dorst and CrossDorst & Cross, 2001). At the start of the process, students actively looked for multiple interpretations and solution directions, engaging in broad conceptual exploration. They engaged in extensive exploration, generating new frames to structure and expand the design space. As the task advanced, framing activity decreased, suggesting that designers increasingly stabilized their understanding of the problem and narrowed their focus. Their efforts concentrated on refining chosen ideas, leading to fewer new frames but more semantically integrated conceptual structures. This dynamic aligns with models of constructive memory (Reference GeroGero, 1999; Reference Liew and GeroLiew & Gero, 2004), in which cognitive focus and contextual constraints guide what is retrieved, reinterpreted, or discarded over time.
Gender-related differences were minor and not statistically significant overall, though male students exhibited slightly higher frame counts in the initial stages. This may reflect individual variation in exploratory behavior rather than systematic cognitive differences. Importantly, both male and female participants demonstrated similar temporal trajectories, suggesting that the underlying mechanisms of framing—activation, retrieval, and reinterpretation—operate consistently across individuals in early design education.
From a cognitive perspective, the results support the assumption that memory activation and decay underlie the evolution of framing behavior. As designers progress, recently activated ideas are reinforced while less relevant concepts fade (Reference BaddeleyBaddeley, 2012). This process mirrors the transition from constructing multiple provisional frames to consolidating coherent representations that guide final design decisions. Thus, the NLP-based Memory Model effectively captures temporal variation in cognitive engagement and provides an empirical representation of framing as a dynamic process of knowledge organization. Beyond the present study, this approach may be applied to examine how variations in task conditions, constraints, or design settings influence framing behavior across design phases.
6.2. Variation in the semantic value of frames across the design process
The analysis of semantic values offers additional insights into the qualitative evolution of framing. Results indicate that frames were semantically richer and more diverse in the Designing phase, then became more homogeneous in the Finalizing phase, and slightly increased in variety again during Debriefing. This pattern suggests that as design progresses, conceptual diversity narrows during solution development but re-expands when designers retrospectively articulate or justify their reasoning. The pattern is consistent with findings on phase-dependent shifts in design reasoning and performance (e.g., Reference McComb, Cagan and KotovskyMcComb et al., 2015). Results further highlight how the proposed method provides insight into the cognitive dynamics underlying design reasoning across phases.
The drop in semantic values between the Designing and Finalizing phases reflects a movement from exploratory interpretation toward consolidation, consistent with prior descriptions of co-evolutionary design processes (Reference DorstDorst, 2019). In cognitive terms, it represents a shift from the generation of novel associative links to the reinforcement of selected ones. The subsequent modest increase in the Debriefing phase may result from reflection and metacognitive reframing—students reinterpreting their process and reactivating earlier conceptual structures (Reference SchönSchön, 1983).
This evolution can also be understood through the lens of constructive memory theory. As Reference GeroGero (1999) and Reference Liew and GeroLiew & Gero (2004) propose, memory retrieval involves reconstructive processes based on current goals and context. During designing, multiple associative pathways are activated; as the problem definition stabilizes, only the most relevant conceptual associations remain active. This mechanism explains both the quantitative reduction in frame generation and the semantic convergence observed later in the process.
Gender comparisons further supported the robustness of these patterns. Although male students displayed higher semantic values in the initial stage, the absence of significant differences later suggests that all participants converged toward similar conceptual stability.
Together, these results validate the NLP-based memory model as a cognitively grounded tool capable of quantifying the temporal evolution of framing and reframing. It bridges the gap between qualitative theories of framing (Reference DorstDorst, 2015; Reference SchönSchön, 1983) and quantitative modeling of memory dynamics (Reference Gero and KannengiesserGero & Kannengiesser, 2004). By capturing both the number and semantic richness of frames, the model operationalizes the interplay between memory activation, decay, and conceptual restructuring. These findings demonstrate that reframing is not random but follows identifiable cognitive trajectories that reflect constructive memory and situated reasoning in design.
7. Conclusions
This study introduced an NLP-based memory model that quantifies how framing and reframing evolve during the design activity. By modeling memory as a dynamic network of conceptual activations and decays, the model captures how ideas are generated, reinforced, or fade over time.
Results show that framing activity peaks during early design exploration and decreases as designers converge on refined solutions, while semantic value follows a cyclical pattern—broadening, narrowing, and re-expanding during reflection. These patterns reflect constructive memory processes, in which recall and reinterpretation depend on current goals and context.
The study demonstrates that framing is a memory-driven process of continuous reinterpretation rather than a fixed problem definition. Conceptually, it connects design cognition to theories of constructive and situated memory. Methodologically, it shows that computational linguistic models can empirically trace these cognitive dynamics. Overall, the NLP-based memory model provides a theoretical and analytical bridge between cognitive science and design research, offering a structured way to study how designers activate and reorganize knowledge through framing and reframing.
Future research should expand this model to larger and more diverse design populations, including professional and cross-disciplinary teams. Future work may also benchmark model-derived frames against human-coded interpretations or simpler segmentation baselines to further examine interpretive alignment. Longitudinal studies could examine how memory-based framing behaviors evolve with expertise, while multimodal analyses integrating gestures and sketches could enrich the model’s cognitive fidelity. Further development may also adapt the framework for real-time feedback in design education, supporting reflection and reframing as active, iterative learning processes.
Acknowledgement
This research was supported by the ISRAEL SCIENCE FOUNDATION (grant no. 798/22). JSG’s time was supported in part by a grant from the US National Science Foundation (grant no. 1929896).




 Open access

