


1. Introduction
Fast radio bursts (FRBs) are short duration (millisecond timescale), dispersed, transient events in the radio spectrum known to originate from cosmological distances (Lorimer et al. Reference Lorimer, Bailes, McLaughlin, Narkevic and Crawford2007; Thornton et al. Reference Thornton2013; Chatterjee et al. Reference Chatterjee2017; Bannister et al. Reference Bannister2019). Current research has two major directions: to determine their progenitor source(s) and to use them as cosmological probes (Macquart et al. Reference Macquart2020). Accordingly, the FRB population statistics continues to be a topic of considerable conjecture (see e.g. Petroff, Hessels, & Lorimer Reference Petroff, Hessels and Lorimer2022, and references therein).
Determining the intrinsic energy distribution (i.e. luminosity function) of FRBs has, hitherto, proven to be problematic. The first impediment stems from radio telescopes with optics that make an accurate determination of the FRB location within the telescope beam difficult, such as Parkes/Murriyang (e.g. Thornton et al. Reference Thornton2013; Keane et al. Reference Keane2018), UTMOST (Farah et al. Reference Farah2019), FAST (Niu et al. Reference Niu2021), and the first FRB searches with CHIME (CHIME/FRB Collaboration: Amiri et al. 2021). This complicates the construction of a fluence-complete sample and determining the effective survey area (see Keane & Petroff Reference Keane and Petroff2015; Macquart & Ekers Reference Macquart and Ekers2018a). This issue is effectively mitigated when using telescope arrays to search for FRBs, as pioneered by the Australian Square Kilometre Array Pathfinder (ASKAP) telescope – which uses phased array feeds (PAFs) to provide a wide field of view (FoV) with dense coverage of the focal plane – permitting reliable estimates of the survey area and FRB fluences to be made (Bannister et al. Reference Bannister2017; Shannon et al. Reference Shannon2018). Even then, however, the relationship between a detected FRB’s signal-to-noise (S/N) and its fluence is distorted by dispersion measure smearing, scattering, and the nuances of the particular detection algorithm. A significant literature is now dedicated to modelling these effects (Cordes & McLaughlin Reference Cordes and McLaughlin2003; Keane & Petroff Reference Keane and Petroff2015; Qiu et al. Reference Qiu, Keane, Bannister, James and Shannon2023; Merryfield et al. Reference Merryfield2023; Hoffmann et al. Reference Hoffmann2024a), allowing them to be accounted for in FRB energy determination.
The second impediment is the difficulty in obtaining an FRB distance estimate, which yields the FRB energy and survey volume. This requires either arcsecond-precision FRB localisations, thereby permitting the identification of the host galaxy, or the existence of a relation between the FRB dispersion measure, DM, and redshift, z. ASKAP has helped provide both, with a large sample of FRBs localised to their host galaxies (Shannon et al. Reference Shannon2024), and the establishment of a z-DM relationship, known as the Macquart Relation (Macquart et al. Reference Macquart2020). Other instruments with similar capabilities include DSA 110 (Law et al. Reference Law2024), MeerKAT (Rajwade et al. Reference Rajwade2022), the VLA (Law et al. Reference Law2018), and CHIME’s outriggers (Leung et al. Reference Leung2021).
A great deal of literature has attempted to draw conclusions on the FRB luminosity function. Relatively few, however, have made a proper account for the above-mentioned effects, as emphasised by Connor (Reference Connor2019) – examples include Luo et al. (Reference Luo, Men, Lee, Wang, Lorimer and Zhang2020), James et al. (Reference James, Prochaska, Macquart, North-Hickey, Bannister and Dunning2021a), Shin et al. (Reference Shin2023), Hoffmann et al. (Reference Hoffmann, James, Glowacki, Prochaska, Gordon, Deller, Shannon and Ryder2024b). However, these fits rely on assumptions about the functional form of the FRB energy distribution and source evolution, which may differ from that of other classes of transients. A non-parametric way to determine both – the $V/V_{\mathrm{max}}$
method – was described by Schmidt (Reference Schmidt1968), in the context of studies of the quasar population. The simplest application of this method is to test for a spatially uniform distribution of FRB sources, which has been applied to FRB data by several authors (Oppermann, Connor, & Pen Reference Oppermann, Connor and Pen2016; Shannon et al. Reference Shannon2018; Locatelli et al. Reference Locatelli, Ronchi, Ghirlanda and Ghisellini2019). Others have applied the analysis determining the FRB energy distribution from non-localised FRBs (Lu & Piro Reference Lu and Piro2019; Hashimoto et al. Reference Hashimoto2022; Zhang et al. Reference Zhang, Li, Zou, Zhao, Zhang and Zhang2024), which has the aforementioned uncertainties of fluctuations in the Macquart relation.
$V/V_{\mathrm{max}}$
method – was described by Schmidt (Reference Schmidt1968), in the context of studies of the quasar population. The simplest application of this method is to test for a spatially uniform distribution of FRB sources, which has been applied to FRB data by several authors (Oppermann, Connor, & Pen Reference Oppermann, Connor and Pen2016; Shannon et al. Reference Shannon2018; Locatelli et al. Reference Locatelli, Ronchi, Ghirlanda and Ghisellini2019). Others have applied the analysis determining the FRB energy distribution from non-localised FRBs (Lu & Piro Reference Lu and Piro2019; Hashimoto et al. Reference Hashimoto2022; Zhang et al. Reference Zhang, Li, Zou, Zhao, Zhang and Zhang2024), which has the aforementioned uncertainties of fluctuations in the Macquart relation.
In this work, we update these analyses using FRBs detected by the Commensal Real-time ASKAP Fast Transients (CRAFT; Macquart et al. Reference Macquart2010) survey with ASKAP (Hotan et al. Reference Hotan2021). In particular, we use a large sample of FRBs with known redshift, allowing for the first time an accurate measurement of both V and $V_{\mathrm{max}}$
for FRBs. This allows unbiased estimates of their energy and spatial distributions to be used.
$V_{\mathrm{max}}$
for FRBs. This allows unbiased estimates of their energy and spatial distributions to be used.
In Section 2 we review the volumetrics and formation of the energy distribution for a sample being analysed. We then apply the approach to the ASKAP sample and outline our results and observations in Section 3. In Section 4 we discuss the implications of the energy distributions and present our conclusions in Section 5.
2. The energy function
2.1 The $\textbf{\textit{V/V}}_{\mathbf{max}}$
test
$\textbf{\textit{V/V}}_{\mathbf{max}}$
test

The discovery of FRBs in 2007 (Lorimer et al. Reference Lorimer, Bailes, McLaughlin, Narkevic and Crawford2007) has many similarities to the discovery of quasars (Schmidt Reference Schmidt1963); both are new classes of extragalactic objects catalogued in surveys with well-defined but complex detection limits.
To estimate the spatial distribution and luminosity function of quasars (then referred to as QSOs), Schmidt (Reference Schmidt1968) introduced the $V/V_{\mathrm{max}}$
parameter which, for each source, provides a measure of its position within the maximum volume over which it would have been observed in the complete sample. Due to the uncertainty in cosmological models at the time, Schmidt (Reference Schmidt1968) calculated volumes in co-moving coordinates using two cosmological models: luminosity distance
$V/V_{\mathrm{max}}$
parameter which, for each source, provides a measure of its position within the maximum volume over which it would have been observed in the complete sample. Due to the uncertainty in cosmological models at the time, Schmidt (Reference Schmidt1968) calculated volumes in co-moving coordinates using two cosmological models: luminosity distance $D_L \propto z$
, and
$D_L \propto z$
, and $D_L \propto z (1+0.5 z)$
. Schmidt notes that
$D_L \propto z (1+0.5 z)$
. Schmidt notes that $V/V_{\mathrm{max}}$
provides a very simple test of uniformity for the spatial distribution in a sensitivity-limited sample, with an expectation value
$V/V_{\mathrm{max}}$
provides a very simple test of uniformity for the spatial distribution in a sensitivity-limited sample, with an expectation value $ \lt +V/V_{\mathrm{max}}$ $ \gt = 0.5$
. In the case of quasars,
$ \gt = 0.5$
. In the case of quasars, $V/V_{\mathrm{max}}$
was found to be significantly larger than 0.5, and Schmidt concluded that the sample was strongly evolving. The expected uniformity in
$V/V_{\mathrm{max}}$
was found to be significantly larger than 0.5, and Schmidt concluded that the sample was strongly evolving. The expected uniformity in $V/V_{\mathrm{max}}$
was achieved by weighting the Cartesian volume
$V/V_{\mathrm{max}}$
was achieved by weighting the Cartesian volume $V \sim D_L^3$
by an assumed source evolution of
$V \sim D_L^3$
by an assumed source evolution of $(1+D_L)^2$
. Schmidt then estimated the local luminosity function by using
$(1+D_L)^2$
. Schmidt then estimated the local luminosity function by using $1/V_{\mathrm{max}}$
to weight the contribution to the spatial density from each source separately, and then grouped the sources in luminosity bins, wherein these luminosities were converted to the rest frequency.
$1/V_{\mathrm{max}}$
to weight the contribution to the spatial density from each source separately, and then grouped the sources in luminosity bins, wherein these luminosities were converted to the rest frequency.
Like quasars, FRBs are also cosmologically distributed, and the problems of analysing their redshift evolution and luminosity function are very similar. The $V/V_{\mathrm{max}}$
method requires a complete sample of sources above a well-defined flux (or fluence) limit. Even if the redshifts of these sources are unknown or poorly defined, the mean value of
$V/V_{\mathrm{max}}$
method requires a complete sample of sources above a well-defined flux (or fluence) limit. Even if the redshifts of these sources are unknown or poorly defined, the mean value of $V/V_{\mathrm{max}}$
can indicate whether the sources are distributed uniformly through the sample volume. A uniform distribution (with
$V/V_{\mathrm{max}}$
can indicate whether the sources are distributed uniformly through the sample volume. A uniform distribution (with $ \lt +V/V_{\mathrm{max}}$ $ \gt \approx 0.5$
) implies a population that is non-evolving (i.e. not changing with distance) within the sample volume, while a larger or smaller value implies either an incompleteness in selection, or a population that undergoes some form of redshift evolution within the sample volume.
$ \gt \approx 0.5$
) implies a population that is non-evolving (i.e. not changing with distance) within the sample volume, while a larger or smaller value implies either an incompleteness in selection, or a population that undergoes some form of redshift evolution within the sample volume.
For a source population where redshift measurements are available for individual objects, and where there is also little or no evolution within the sample volume, a luminosity function can be calculated by summing the values of 1/ $V_{\mathrm{max}}$
within different luminosity bins. Local radio luminosity functions (RLFs) for large, complete samples have been calculated by several authors (e.g. Condon, Cotton, & Broderick Reference Condon, Cotton and Broderick2002; Sadler et al. Reference Sadler2002; Best et al. Reference Best, Kauffmann, Heckman, Brinchmann and Charlot2005; Mauch & Sadler Reference Mauch and Sadler2007), and Pracy et al. (Reference Pracy2016) calculated the RLF for high- and low-excitation radio galaxies in several redshift bins out to
$V_{\mathrm{max}}$
within different luminosity bins. Local radio luminosity functions (RLFs) for large, complete samples have been calculated by several authors (e.g. Condon, Cotton, & Broderick Reference Condon, Cotton and Broderick2002; Sadler et al. Reference Sadler2002; Best et al. Reference Best, Kauffmann, Heckman, Brinchmann and Charlot2005; Mauch & Sadler Reference Mauch and Sadler2007), and Pracy et al. (Reference Pracy2016) calculated the RLF for high- and low-excitation radio galaxies in several redshift bins out to $z\sim0.75$
. Avni & Bahcall (Reference Avni and Bahcall1980) extended Schmidt (Reference Schmidt1968)’s method to samples with different completeness limits in two (or more) different parameters; this technique may be used to measure a bivariate luminosity function, for example, a set of RLFs for different bins in optical luminosity (Mauch & Sadler Reference Mauch and Sadler2007) or black hole mass determination (Best et al. Reference Best, Kauffmann, Heckman, Brinchmann and Charlot2005).
$z\sim0.75$
. Avni & Bahcall (Reference Avni and Bahcall1980) extended Schmidt (Reference Schmidt1968)’s method to samples with different completeness limits in two (or more) different parameters; this technique may be used to measure a bivariate luminosity function, for example, a set of RLFs for different bins in optical luminosity (Mauch & Sadler Reference Mauch and Sadler2007) or black hole mass determination (Best et al. Reference Best, Kauffmann, Heckman, Brinchmann and Charlot2005).
If the redshift range covered by a survey is large enough that redshift evolution occurs within the sample-volume (i.e. $V/V_{\mathrm{max}}$
has a value significantly different from 0.5), then this evolution must be taken into account. Examples from the literature include studies of the luminosity function of gamma-ray bursts (Schmidt Reference Schmidt2009) and the redshift evolution of powerful radio galaxies (Dunlop & Peacock Reference Dunlop and Peacock1990).
$V/V_{\mathrm{max}}$
has a value significantly different from 0.5), then this evolution must be taken into account. Examples from the literature include studies of the luminosity function of gamma-ray bursts (Schmidt Reference Schmidt2009) and the redshift evolution of powerful radio galaxies (Dunlop & Peacock Reference Dunlop and Peacock1990).
Schmidt’s methods may be applied directly to the FRB population, with a few significant differences. Since FRBs are transient rather than static sources of emission, the observing time should be included in the analysis as well as the survey area. Transients are typically characterised by their fluence and energy distribution rather than their flux and luminosity function. To keep notation consistent with Schmidt (Reference Schmidt1968), hereinafter we refer to FRB luminosities and their RLF when describing the distribution of their spectral energy density, $E_\nu$
. If the positions are not determined well enough during the outburst, the location in the FoV cannot be determined. Thus the sensitivity of the telescope beam at the detection point, hence the correction for that sensitivity, cannot be made. For the population of FRBs that have not been observed to repeat, only surveys which determine the position in the FoV can therefore be used – significantly reducing the applicable sample size.
$E_\nu$
. If the positions are not determined well enough during the outburst, the location in the FoV cannot be determined. Thus the sensitivity of the telescope beam at the detection point, hence the correction for that sensitivity, cannot be made. For the population of FRBs that have not been observed to repeat, only surveys which determine the position in the FoV can therefore be used – significantly reducing the applicable sample size.
First, we use the $V/V_{\mathrm{max}}$
test to check whether the FRBs in our sample are uniformly distributed in space. Then, following Schmidt, we use
$V/V_{\mathrm{max}}$
test to check whether the FRBs in our sample are uniformly distributed in space. Then, following Schmidt, we use $1/V_{\mathrm{max}}$
for each FRB to estimate its contribution to the density of FRBs of that luminosity. The estimation of
$1/V_{\mathrm{max}}$
for each FRB to estimate its contribution to the density of FRBs of that luminosity. The estimation of $V_{\mathrm{max}}$
is the critical aspect introduced by this analysis: for FRB surveys it can be applied on a per source basis, provided the survey detection limit, the detected S/N and the position in the FoV are known for each FRB. This requirement significantly limits the sample of FRBs that can be used, and we therefore confine our analysis to suitable FRBs from the CRAFT survey, which satisfy these criteria. We do this for FRBs with known host galaxies for which V and
$V_{\mathrm{max}}$
is the critical aspect introduced by this analysis: for FRB surveys it can be applied on a per source basis, provided the survey detection limit, the detected S/N and the position in the FoV are known for each FRB. This requirement significantly limits the sample of FRBs that can be used, and we therefore confine our analysis to suitable FRBs from the CRAFT survey, which satisfy these criteria. We do this for FRBs with known host galaxies for which V and $V_{\mathrm{max}}$
can be calculated. We also investigate the effect of using DM as a distance proxy by comparing this result to that obtained when estimating FRB distances from their DMs using the cosmological DM-z (‘Macquart’) relation (Macquart et al. Reference Macquart2020). For simplicity, in the main body of this work, we ignore FRB spectral dependence and source evolution; however, we consider both in Appendix A, and show that neither have a strong influence given current data. We do not explicitly calculate the time-dependence of the survey volume, thus we cannot calculate the FRB rate. Moreover, since we use data from both ASKAP’s Fly’s Eye and Incoherent Sum (ICS) modes in different proportions for the two samples, the relative normalisation is arbitrary. We discuss this further in Appendix B.
$V_{\mathrm{max}}$
can be calculated. We also investigate the effect of using DM as a distance proxy by comparing this result to that obtained when estimating FRB distances from their DMs using the cosmological DM-z (‘Macquart’) relation (Macquart et al. Reference Macquart2020). For simplicity, in the main body of this work, we ignore FRB spectral dependence and source evolution; however, we consider both in Appendix A, and show that neither have a strong influence given current data. We do not explicitly calculate the time-dependence of the survey volume, thus we cannot calculate the FRB rate. Moreover, since we use data from both ASKAP’s Fly’s Eye and Incoherent Sum (ICS) modes in different proportions for the two samples, the relative normalisation is arbitrary. We discuss this further in Appendix B.
The ratio of volumes from which the FRB has been detected, V, to that in which it could have been detected, $V_{\mathrm{max}}$
, is a measure of the position of the detected event within the probed volume. The statistic
$V_{\mathrm{max}}$
, is a measure of the position of the detected event within the probed volume. The statistic $\langle V/V_{\mathrm{max}}\rangle$
is the algebraic mean of events in a sample and is expressed as:
$\langle V/V_{\mathrm{max}}\rangle$
is the algebraic mean of events in a sample and is expressed as:
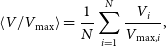 \begin{align} \langle V/V_{\mathrm{max}}\rangle = \frac{1}{N} \sum_{i=1}^{N} \frac{V_{i}}{V_{\mathrm{max},i}} \text{,}\end{align}
where i represents the $i^{\mathrm{th}}$
event in a sample of N events. A spatially uniform sample would be uniformly distributed over the range
$i^{\mathrm{th}}$
event in a sample of N events. A spatially uniform sample would be uniformly distributed over the range $\left[0, 1\right]$
with
$\left[0, 1\right]$
with $\langle V/V_{\mathrm{max}}\rangle=0.5$
(Schmidt Reference Schmidt1968). The luminosity function may be determined from a contribution of each event by taking the reciprocal of the volume in which each event could have been observed (i.e.
$\langle V/V_{\mathrm{max}}\rangle=0.5$
(Schmidt Reference Schmidt1968). The luminosity function may be determined from a contribution of each event by taking the reciprocal of the volume in which each event could have been observed (i.e. $1/V_{\mathrm{max},i}$
), and binning in terms of energy.
$1/V_{\mathrm{max},i}$
), and binning in terms of energy.
In the case of an evolving population (e.g. source density evolving with redshift, or source luminosity variations; Schmidt Reference Schmidt1968; Macquart & Ekers Reference Macquart and Ekers2018b) or incorrect assumptions regarding the nature of the volume, the distribution given through equation (1) will not, in general, be uniform. Re-weighting V by the correct source density, $\psi$
, within that volume, that is,
$\psi$
, within that volume, that is, $V \rightarrow V^\prime = V \cdot \psi\left(V\right)$
, would, however, restore the distribution to uniformity.
$V \rightarrow V^\prime = V \cdot \psi\left(V\right)$
, would, however, restore the distribution to uniformity.
Measurement of the FRB luminosity distribution presents a number of complications not typically encountered with static sources, since it is not possible to find all objects by scanning an area of sky with uniform sensitivity. For a sample of static sources, one may clearly define the volume over which a source would have been detectable, viz., the volume of a spherical sector whose radius is governed by the luminosity distance out to which an object could have been detected, given the telescope sensitivity. For radio transients such as FRBs, however, this is not the case: the instantaneous sensitivity across the FoV, when the FRB is detected, is non-uniform and the volume probed is therefore not a section of a sphere. When one is interested in the event rate rather than the source density per comoving volume, the additional effect of the observing time and time dilation as a function of distance needs to be taken into account.
The spectral energy density, $E_{\nu, 0}$
, of a given FRB, its observed fluence,
$E_{\nu, 0}$
, of a given FRB, its observed fluence, $F_{\nu,0}$
, and its luminosity distance,
$F_{\nu,0}$
, and its luminosity distance, $D_{L}$
, are related via equation (2)
$D_{L}$
, are related via equation (2)
 \begin{align} E_{\nu,0} = \frac{4 \pi F_{\nu,0} D_L^2}{ (1+z_b)^{2+\alpha}} \text{,}\end{align}
where $z_b$
is the redshift of the FRB and
$z_b$
is the redshift of the FRB and $\alpha$
the fluence spectral index. We define
$\alpha$
the fluence spectral index. We define $\alpha:F_{\nu}\propto\nu^{\alpha}$
– this is now common usage, however it is the opposite sign convention to that used in Macquart & Ekers (Reference Macquart and Ekers2018b) and subsequently in Arcus et al. (Reference Arcus, Macquart, Sammons, James and Ekers2020) and (2022).
$\alpha:F_{\nu}\propto\nu^{\alpha}$
– this is now common usage, however it is the opposite sign convention to that used in Macquart & Ekers (Reference Macquart and Ekers2018b) and subsequently in Arcus et al. (Reference Arcus, Macquart, Sammons, James and Ekers2020) and (2022).
2.2 The survey volume
Here we derive measures of both V and $V_{\mathrm{max}}$
that account for the beamshape of the FRB discoveryp antenna. We note that, for a non-evolving population in a Cartesian Universe, the antenna beamshape will not affect calculations of
$V_{\mathrm{max}}$
that account for the beamshape of the FRB discoveryp antenna. We note that, for a non-evolving population in a Cartesian Universe, the antenna beamshape will not affect calculations of $V/V_{\mathrm{max}}$
, since both V and
$V/V_{\mathrm{max}}$
, since both V and $V_{\mathrm{max}}$
will scale identically for all beam positions. Assuming a constant value of beam (hence telescope) sensitivity will, however, smear-out the luminosity function due to uncorrected-for differences between true fluence (which requires the beamshape at point of detection to be known) and the fluence calculated when ignoring beamshape.
$V_{\mathrm{max}}$
will scale identically for all beam positions. Assuming a constant value of beam (hence telescope) sensitivity will, however, smear-out the luminosity function due to uncorrected-for differences between true fluence (which requires the beamshape at point of detection to be known) and the fluence calculated when ignoring beamshape.
In the case of an evolving population, objects requiring spectral corrections, and/or a non-Euclidean Universe, the proportionality between V and $V_{\mathrm{max}}$
is lost, and beamshape corrections can become important in calculating
$V_{\mathrm{max}}$
is lost, and beamshape corrections can become important in calculating $V/V_{\mathrm{max}}$
as well as the luminosity function. Given that the FRB population may experience both source evolution and spectral dependence, and FRB observations now probe the
$V/V_{\mathrm{max}}$
as well as the luminosity function. Given that the FRB population may experience both source evolution and spectral dependence, and FRB observations now probe the $z \gt 1$
regime at which cosmological distance measures are significantly different from their Euclidean equivalents, we consider a proper treatment crucial when applying the
$z \gt 1$
regime at which cosmological distance measures are significantly different from their Euclidean equivalents, we consider a proper treatment crucial when applying the $V/V_{\mathrm{max}}$
method.
$V/V_{\mathrm{max}}$
method.
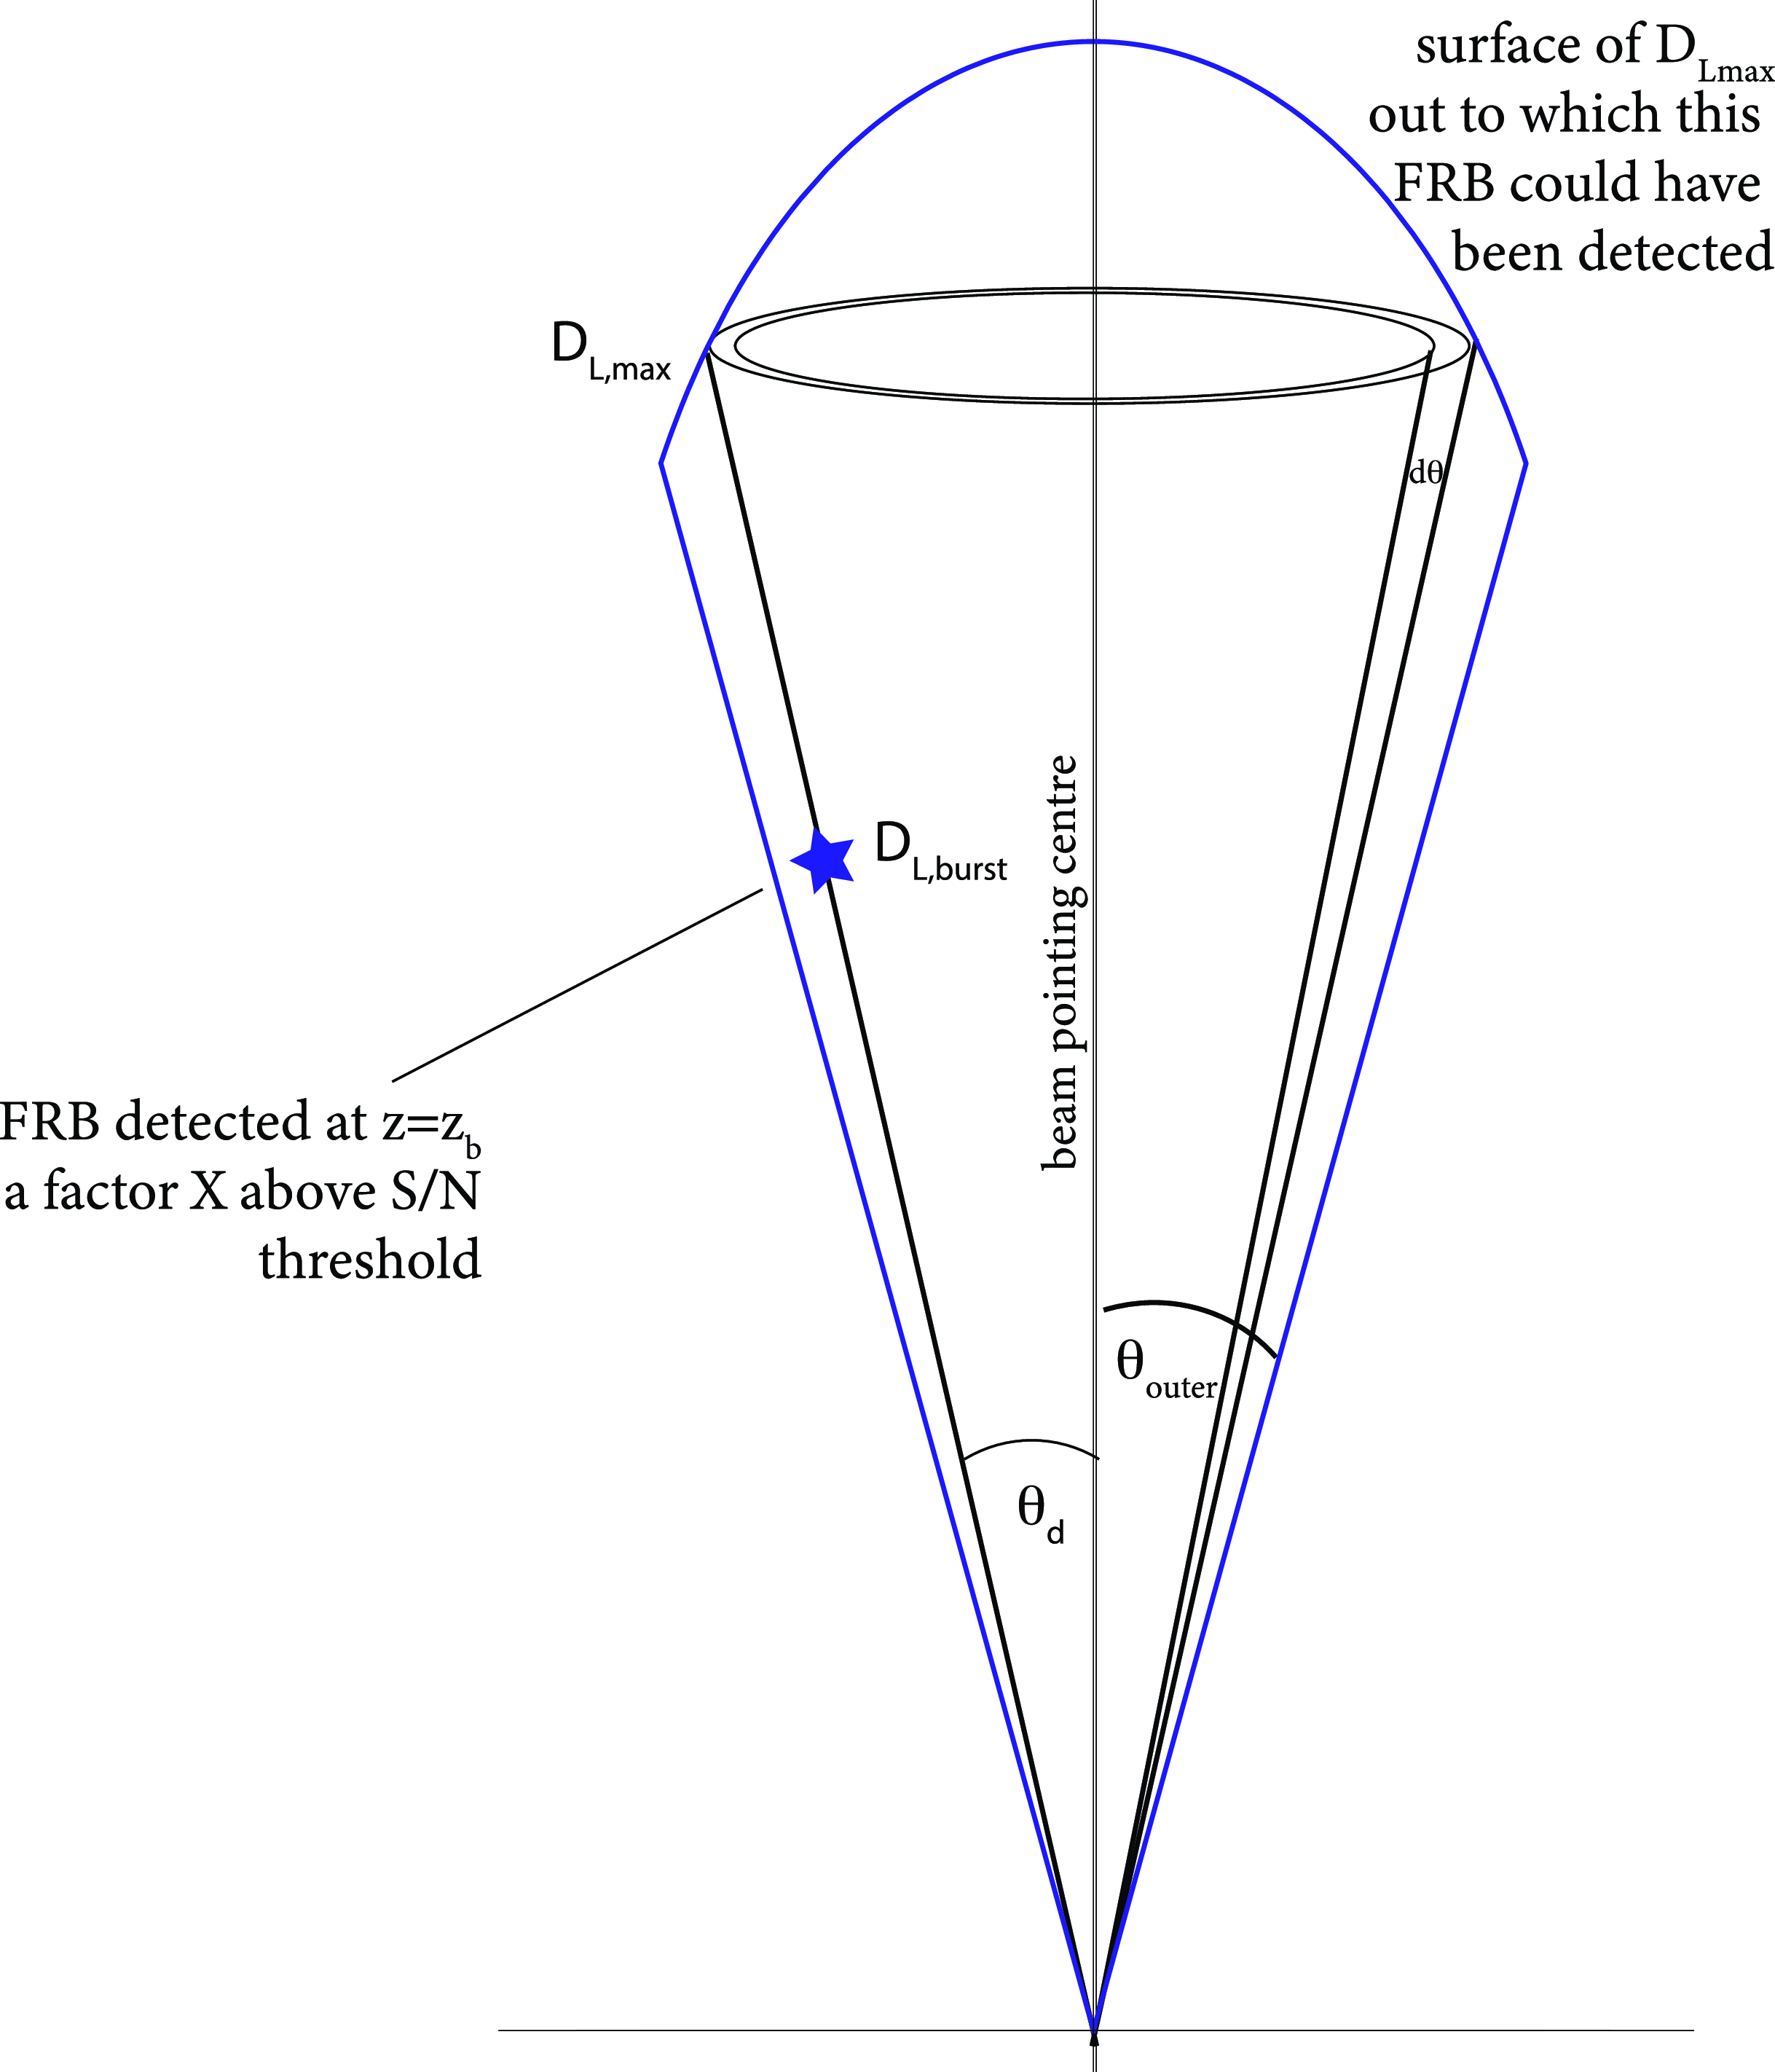
The geometry of the $V_{\mathrm{max}}$
region defining the total comoving volume out to which a given FRB may be detected with an S/N being a factor of X above the threshold detection S/N for a generic beam. Note that
$V_{\mathrm{max}}$
region defining the total comoving volume out to which a given FRB may be detected with an S/N being a factor of X above the threshold detection S/N for a generic beam. Note that $V_{\mathrm{max}}$
must be computed separately for each FRB since the S/N of a given FRB depends upon both the FRB fluence and duration: the
$V_{\mathrm{max}}$
must be computed separately for each FRB since the S/N of a given FRB depends upon both the FRB fluence and duration: the $D_{L,{\mathrm{max}}}$
surface cannot be specified solely in terms of a threshold fluence.
$D_{L,{\mathrm{max}}}$
surface cannot be specified solely in terms of a threshold fluence.
2.2.1 The maximum volume probed by a generic beam
Consider a FRB event occurring at a given offset, $\theta_{d}$
, from the beam centre of a generic telescope beam at an S/N value that is a factor of X above the cut-off S/N flux threshold
$\theta_{d}$
, from the beam centre of a generic telescope beam at an S/N value that is a factor of X above the cut-off S/N flux threshold $S_{\mathrm{cutoff}}$
(see Fig. 1). We would like to know over what volume this particular event, with FRB spectral energy density,
$S_{\mathrm{cutoff}}$
(see Fig. 1). We would like to know over what volume this particular event, with FRB spectral energy density, $E_\nu$
, and burst-width,
$E_\nu$
, and burst-width, $\Delta t$
, could have been detected. If the telescope beam is circularly symmetric, the comoving volume of space probed out to a redshift
$\Delta t$
, could have been detected. If the telescope beam is circularly symmetric, the comoving volume of space probed out to a redshift $z_{\mathrm{max}}$
is given by
$z_{\mathrm{max}}$
is given by
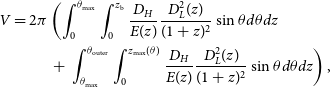
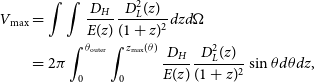 \begin{align} \begin{split} V_{\mathrm{max}} &= \int \int \frac{D_H}{E(z)} \frac{D_L^2(z)}{(1+z)^2} dz d\Omega \\ &=2 \pi \int_0^{\theta_{\mathrm{outer}}} \int_0^{z_{\mathrm{max}}(\theta)} \frac{D_H}{E(z)} \frac{D_L^2(z)}{(1+z)^2} \sin \theta d\theta dz \text{,} \end{split}\end{align}
where $\Omega$
is the solid angle of the telescope beam on the sky;
$\Omega$
is the solid angle of the telescope beam on the sky; $\theta$
, the bore-sight angle of the telescope beam; and
$\theta$
, the bore-sight angle of the telescope beam; and $\theta_{\mathrm{outer}}$
the outermost detectable angle of the beam. Moreover,
$\theta_{\mathrm{outer}}$
the outermost detectable angle of the beam. Moreover, $z_{\mathrm{max}}(\theta)$
is the redshift of the maximum luminosity distance that an event could be detected in the telescope beam and
$z_{\mathrm{max}}(\theta)$
is the redshift of the maximum luminosity distance that an event could be detected in the telescope beam and $D_H$
and
$D_H$
and $D_L(z)$
are the Hubble distance and luminosity distance for a given redshift, z, respectively.
$D_L(z)$
are the Hubble distance and luminosity distance for a given redshift, z, respectively.
We write $z_{\mathrm{max}}(\theta)$
as an explicit function of
$z_{\mathrm{max}}(\theta)$
as an explicit function of $\theta$
to emphasise that the telescope probes to a larger redshift at the beam centre relative to its periphery. We take the integral over the angular distance to extend out to an effective beam cut-off point; the objective here being to find
$\theta$
to emphasise that the telescope probes to a larger redshift at the beam centre relative to its periphery. We take the integral over the angular distance to extend out to an effective beam cut-off point; the objective here being to find $z_{\mathrm{max}}(\theta)$
for a given FRB so that the effective survey volume may be determined.
$z_{\mathrm{max}}(\theta)$
for a given FRB so that the effective survey volume may be determined.
We may compute the maximum detectable luminosity distance for each FRB at its particular location within the telescope beam via equation (2), to determine $E_{\nu, 0}$
, then find the luminosity distance at which the FRB of this energy density would be detectable at the threshold
$E_{\nu, 0}$
, then find the luminosity distance at which the FRB of this energy density would be detectable at the threshold $S_{\mathrm{cutoff}}$
.
$S_{\mathrm{cutoff}}$
.
An additional complication is that the detection S/N is not determined just by the FRB flux density; rather, S/N is proportional to a product involving the FRB flux density and its duration. Thus the threshold fluence is obtained by solving
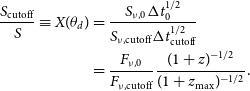 \begin{align} \begin{split} \frac{S_{\mathrm{cutoff}}}{S} \equiv X(\theta_d) &= \frac{S_{\nu,0} \Delta t_0^{1/2}}{S_{\nu,{\mathrm{cutoff}}} \Delta t_{\mathrm{cutoff}}^{1/2} } \\ &= \frac{F_{\nu,0} }{F_{\nu,{\mathrm{cutoff}}}} \frac{(1+z)^{-1/2}}{(1+z_{\mathrm{max}})^{-1/2}} . \end{split}\end{align}
The solution of equation (4) yields the following transcendental equation for the limiting detectable fluence for a given FRB:
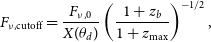 \begin{align} F_{\nu,{\mathrm{cutoff}}} = \frac{F_{\nu,0}}{X(\theta_d)} \left( \frac{1+z_b}{1+z_{\mathrm{max}}} \right)^{-1/2} \text{,}\end{align}
and we solve this equation to determine $z_{\mathrm{max}}(\theta)$
.
$z_{\mathrm{max}}(\theta)$
.
Yet a further complication is that the telescope detection efficiency decreases with increasing DM, which is nearly linearly proportional to redshift at $z \lesssim 1$
(see e.g. Arcus et al. Reference Arcus, James, Ekers and Wayth2022). If the telescope efficiency,
$z \lesssim 1$
(see e.g. Arcus et al. Reference Arcus, James, Ekers and Wayth2022). If the telescope efficiency, $\eta$
, is written in terms of DM, the maximum luminosity distance out to which the FRB is detectableFootnote
a
is given by:
$\eta$
, is written in terms of DM, the maximum luminosity distance out to which the FRB is detectableFootnote
a
is given by:
 \begin{align} \begin{split} D_{L,{\mathrm{cutoff}}} = D_{L,b} \, X^{1/2}(\theta_d) & \left( \frac{1+z_{\mathrm{max}}}{1+z_b} \right)^{(3/2+\alpha)/2} \\ & \left( \frac{\eta(\mathrm{DM}(z_{\mathrm{max}}))}{\eta(\mathrm{DM}(z_b))} \right)^{1/2} \text{,} \end{split}\end{align}
where we note explicitly that $\mathrm{DM}=\mathrm{DM}(z)$
.
$\mathrm{DM}=\mathrm{DM}(z)$
. $z_{\mathrm{max}}(\theta)$
may therefore be determined by noting that
$z_{\mathrm{max}}(\theta)$
may therefore be determined by noting that $X(\theta)$
changes according to the position in the beam. For a telescope beam whose sensitivity falls off as
$X(\theta)$
changes according to the position in the beam. For a telescope beam whose sensitivity falls off as $B(\theta)$
, telescope sensitivity changes as
$B(\theta)$
, telescope sensitivity changes as
 \begin{align} X(\theta) = X(\theta_d) \frac{B(\theta)}{B(\theta_d)}.\end{align}
Thus the limiting redshift at an angular distance, $\theta$
, from the beam centre may be found by solving the following equation for
$\theta$
, from the beam centre may be found by solving the following equation for $z_{\mathrm{max}}(\theta)$
via
$z_{\mathrm{max}}(\theta)$
via
 \begin{align} D_{L,{\mathrm{max}}} = D_{L,b} X^{1/2}(\theta_d) & \left( \frac{1+z_{\mathrm{max}}}{1+z_b} \right)^{(3/2+\alpha)/2} \nonumber \\ & \left(\frac{B(\theta)}{B(\theta_d)} \frac{\eta(\mathrm{DM}(z_{\mathrm{max}}))}{\eta(\mathrm{DM}(z_b))} \right)^{1/2} . \end{align}
Determination of $z_{\mathrm{max}}(\theta)$
via equation (8) is fully prescribed in terms of: (i) the FRB detection angle from beam centre,
$z_{\mathrm{max}}(\theta)$
via equation (8) is fully prescribed in terms of: (i) the FRB detection angle from beam centre, $\theta_{d}$
; (ii) the factor above the cut-off S/N threshold,
$\theta_{d}$
; (ii) the factor above the cut-off S/N threshold, $X(\theta_d)$
; (iii) the FRB redshift,
$X(\theta_d)$
; (iii) the FRB redshift, $z_b$
; (iv) the beam pattern,
$z_b$
; (iv) the beam pattern, $B(\theta)$
; and (v) the telescope efficiency,
$B(\theta)$
; and (v) the telescope efficiency, $\eta(\mathrm{DM}; w)$
. The maximum volume in which the FRB could have been detected,
$\eta(\mathrm{DM}; w)$
. The maximum volume in which the FRB could have been detected, $V_{\mathrm{max}}$
, may then be determined using equation (3).
$V_{\mathrm{max}}$
, may then be determined using equation (3).
2.2.2 The detection volume of a FRB within a generic beam
The volume in which a FRB is detected, V, for a generic beam may be determined via
 \begin{align} \begin{split} V = 2 \pi & \left(\int_0^{\theta_{\mathrm{max}}} \int_0^{z_{\mathrm{b}}} \frac{D_H}{E(z)} \frac{D_L^2(z)}{(1+z)^2} \sin \theta d\theta dz \right. \\ &\left. +\,\int_{\theta_{\mathrm{max}}}^{\theta_{\mathrm{outer}}} \int_0^{z_{\mathrm{max}}(\theta)} \frac{D_H}{E(z)} \frac{D_L^2(z)}{(1+z)^2} \sin \theta d\theta dz\right) \text{,} \end{split}\end{align}
where we integrate the constant luminosity distance of the detected FRB out to maximum angle, $\theta_{\mathrm{max}}$
, at the detection threshold (i.e. at the beam cut-off fluence, see equation (10)), then add the residual volume out to the limit of integration,
$\theta_{\mathrm{max}}$
, at the detection threshold (i.e. at the beam cut-off fluence, see equation (10)), then add the residual volume out to the limit of integration, $\theta_{\mathrm{outer}}$
. For an overview of determining
$\theta_{\mathrm{outer}}$
. For an overview of determining $V/V_{\mathrm{max}}$
in relation to a non-uniform sensitivity, see Appendix B.
$V/V_{\mathrm{max}}$
in relation to a non-uniform sensitivity, see Appendix B.
By rearranging and relabelling equation (8), and making the substitution $X(\theta_{\mathrm{max}}) B(\theta_{\mathrm{max}}) \rightarrow B^{2}(\theta_{\mathrm{max}}) X(\theta_{\mathrm{d}}) / B(\theta_{\mathrm{d}})$
via equation (7),
$X(\theta_{\mathrm{max}}) B(\theta_{\mathrm{max}}) \rightarrow B^{2}(\theta_{\mathrm{max}}) X(\theta_{\mathrm{d}}) / B(\theta_{\mathrm{d}})$
via equation (7), $\theta_{\mathrm{max}}$
may be determined by solving
$\theta_{\mathrm{max}}$
may be determined by solving
 \begin{align} \begin{split} B^{2}(\theta_{d}) \, & D^{2}_{L}(z_\mathrm{b}) \, \eta(\mathrm{DM}(z_{\mathrm{b}})) \, (1+z_{\mathrm{max}})^{2+\alpha} = \\ & B^{2}(\theta_{\mathrm{max}}) \, D^{2}_{L}(z_{\mathrm{max}}) \, \eta(\mathrm{DM}(z_{\mathrm{max}})) \, (1+z_\mathrm{b})^{2+\alpha} . \end{split}\end{align}
2.3 The volume probed by a specific beam
We further adapt the treatment of Section 2.2 to admit telescopes with arbitrary beamshapes (later in Section 3 we specifically admit the ASKAP telescope beamshape).
For a beam viewing a solid angle of sky, the inverse beamshape, $\Omega(B)$
(James et al. Reference James, Prochaska, Macquart, North-Hickey, Bannister and Dunning2021a) with beam function
$\Omega(B)$
(James et al. Reference James, Prochaska, Macquart, North-Hickey, Bannister and Dunning2021a) with beam function $B(\theta)$
, the maximum volume in which a FRB may have been detected, may be recast as
$B(\theta)$
, the maximum volume in which a FRB may have been detected, may be recast as
 \begin{align} \begin{split} V_{\mathrm{max}} &= \int \int \frac{D_H}{E(z)} \frac{D_L^2(z)}{(1+z)^2} dz d\Omega \\ &= \int_{0}^{1} \int_0^{z_{\mathrm{max}}(B)} \frac{D_H}{E(z)} \frac{D_L^2(z)}{(1+z)^2} \, \Omega(B) \, dz \, dB . \end{split}\end{align}
Likewise the volume in which the FRB was detected, for a specific beam-shape, is recast as
 \begin{align} \begin{split} V = & \int_{0}^{B_{0}(\theta_{d})} \int_0^{z_{\mathrm{max}}(B)} \frac{D_H}{E(z)} \frac{D_L^2(z)}{(1+z)^2} \, \Omega(B) \, dz \, dB \\ &+ \int_{B_{0}(\theta_{d})}^{1} \int_0^{z_{\mathrm{b}}} \frac{D_H}{E(z)} \frac{D_L^2(z)}{(1+z)^2} \, \Omega(B) \, dz \, dB \text{,} \end{split}\end{align}
where $B_{0}(\theta_{d}) = B(\theta_{d}) / X(\theta_{d})$
.
$B_{0}(\theta_{d}) = B(\theta_{d}) / X(\theta_{d})$
.
In order to determine the limits of integration in equation (12) and to solve equation (8) for $z_{\mathrm{max}}(B)$
, we utilise an Airy beam function as the underlying beam model where necessary (Arcus et al. Reference Arcus, James, Ekers and Wayth2022).
$z_{\mathrm{max}}(B)$
, we utilise an Airy beam function as the underlying beam model where necessary (Arcus et al. Reference Arcus, James, Ekers and Wayth2022).
Furthermore, consistent with (James et al. Reference James, Prochaska, Macquart, North-Hickey, Bannister and Dunning2021a, see Section 4.3 Numerical implementation), equations (11) & (12) are implemented as histogram approximations (i.e. Riemann sums), such that $\int B(\Omega) \, dB \approx \sum_{i=1}^{N_B} \Omega(B) \Delta B$
where we choose
$\int B(\Omega) \, dB \approx \sum_{i=1}^{N_B} \Omega(B) \Delta B$
where we choose $N_{B} = 10$
(James et al. Reference James, Prochaska, Macquart, North-Hickey, Bannister and Dunning2021a).
$N_{B} = 10$
(James et al. Reference James, Prochaska, Macquart, North-Hickey, Bannister and Dunning2021a).
As the source evolution function for FRBs is hitherto unknown, considered hypotheses generally take on the form of some function of the star formation rate (SFR; e.g. Macquart & Ekers Reference Macquart and Ekers2018b), or delayed with respect to star formation (e.g. Cao, Yu, & Zhou Reference Cao, Yu and Zhou2018). Current fitting methods favour source evolution consistent with the cosmic star formation rate (James et al. Reference James2022; Shin et al. Reference Shin2023), although this is equally consistent with a generic $(1+z)^n$
model. We show in Appendix A that with current data, the
$(1+z)^n$
model. We show in Appendix A that with current data, the $V/V_{\mathrm{max}}$
method cannot currently discriminate between source evolution models. Accordingly, we choose the simpler case of no source evolution and set
$V/V_{\mathrm{max}}$
method cannot currently discriminate between source evolution models. Accordingly, we choose the simpler case of no source evolution and set $V^\prime = V$
as discussed in Appendix A.
$V^\prime = V$
as discussed in Appendix A.
3. Application to ASKAP
We consider two discrete samples from the ASKAP telescope: the full set of 63 FRBs and a subset of 28 FRBs for which an identified host galaxy with measured redshift z has been obtained. We treat these two samples separately in order to determine whether the use of FRBs from the DM-only inferred redshift sample yields an energy distribution consistent with those from which redshift has been independently determined. We examine the FRB population and apply the luminosity-volume- or $V/V_{\mathrm{max}}$
-test to examine the source distribution of these transient sources, accounting for cosmological and instrumental effects, in order to determine the RLF for the sampled population. In Appendix A, we consider both
$V/V_{\mathrm{max}}$
-test to examine the source distribution of these transient sources, accounting for cosmological and instrumental effects, in order to determine the RLF for the sampled population. In Appendix A, we consider both $\alpha=0$
and
$\alpha=0$
and $\alpha=-1.5$
(Macquart et al. Reference Macquart, Shannon, Bannister, James, Ekers and Bunton2019), and also a cosmological evolution of the source population. However, we find little discriminating power between the two, hence we choose, hereinafter,
$\alpha=-1.5$
(Macquart et al. Reference Macquart, Shannon, Bannister, James, Ekers and Bunton2019), and also a cosmological evolution of the source population. However, we find little discriminating power between the two, hence we choose, hereinafter, $\alpha=0$
and no source evolution for simplicity.
$\alpha=0$
and no source evolution for simplicity.
We use the formalism outlined in Section 2.3 to determine the volumetrics necessary to conduct the $V/V_{\mathrm{max}}$
-test and apply the beamshape for the ASKAP telescope, as given by James et al. (Reference James, Prochaska, Macquart, North-Hickey, Bannister and Dunning2021a, see Figure 3 of Section 4.1 therein), via the inverse beamshape,
$V/V_{\mathrm{max}}$
-test and apply the beamshape for the ASKAP telescope, as given by James et al. (Reference James, Prochaska, Macquart, North-Hickey, Bannister and Dunning2021a, see Figure 3 of Section 4.1 therein), via the inverse beamshape, $\Omega(B)$
. We choose this approach to represent a realistic beamshape for ASKAP and to avoid complications in cases where a FRB detection occurs either in multiple beams or in an outer beam. Due to ASKAP’s beams overlapping approximately at the half-power points, the effect of beamshape in this analysis is not strong, and a short investigation shows that the effect of ignoring it for both and the luminosity function is minor.
$\Omega(B)$
. We choose this approach to represent a realistic beamshape for ASKAP and to avoid complications in cases where a FRB detection occurs either in multiple beams or in an outer beam. Due to ASKAP’s beams overlapping approximately at the half-power points, the effect of beamshape in this analysis is not strong, and a short investigation shows that the effect of ignoring it for both and the luminosity function is minor.
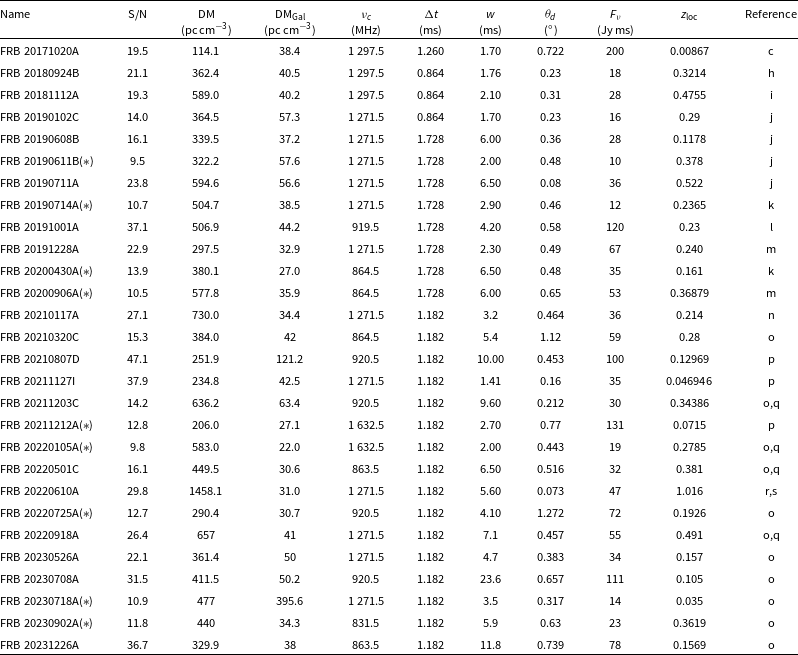
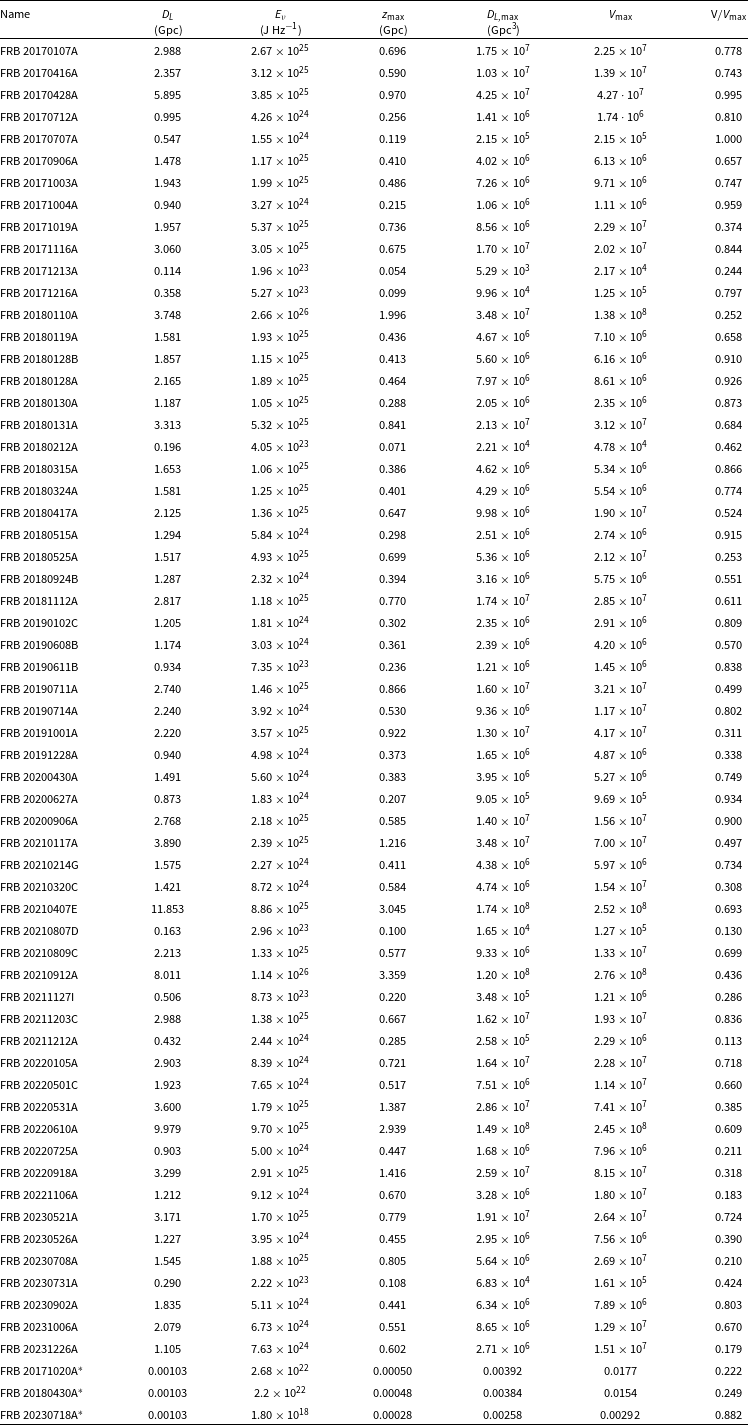
Table 1 lists the candidate localised sample of FRBs along with their relevant observational parameters applicable to our analysis. Since there is some suggestion that ASKAP ICS observations are incomplete in the range $\text{S/N} \lt 14$
(Shannon et al. Reference Shannon2024), and we wish to ensure the localised sample has minimum bias, only those FRBs for which the S/N exceeds the threshold of
$\text{S/N} \lt 14$
(Shannon et al. Reference Shannon2024), and we wish to ensure the localised sample has minimum bias, only those FRBs for which the S/N exceeds the threshold of $\mathrm{S/N}_{\mathrm{cutoff}}=14$
were subsequently admitted for further analysis. These are listed in Table 2 and are hereinafter identified as the Localised High S/N Sample, comprising 19 FRBs.
$\mathrm{S/N}_{\mathrm{cutoff}}=14$
were subsequently admitted for further analysis. These are listed in Table 2 and are hereinafter identified as the Localised High S/N Sample, comprising 19 FRBs.
Properties of the 28 localised ASKAP candidate FRBs for which a host galaxy redshift has been determined. FRBs identified with an asterisk below (*) are excluded from subsequent analysis since their detected $\text{S/N} \lt \text{S/N}_{\mathrm{cutoff}} (= 14)$
. Variables listed in this table are: (i) DM – Observed DM; (ii)
$\text{S/N} \lt \text{S/N}_{\mathrm{cutoff}} (= 14)$
. Variables listed in this table are: (i) DM – Observed DM; (ii) $\nu_{c}$
– Centre Frequency; (iii) S/N – Primary S/N; (iv) S/N
$\nu_{c}$
– Centre Frequency; (iii) S/N – Primary S/N; (iv) S/N $_{\mathrm{cuttoff}}$
– S/N threshold; (v) DM
$_{\mathrm{cuttoff}}$
– S/N threshold; (v) DM $_{\mathrm{Gal}}$
– DM of Milky Way disc using the NE2001 model; (vi)
$_{\mathrm{Gal}}$
– DM of Milky Way disc using the NE2001 model; (vi) $\Delta t$
– Sample Interval; (vii) w – Fitted Pulse-width (FWHM); (viii)
$\Delta t$
– Sample Interval; (vii) w – Fitted Pulse-width (FWHM); (viii) $\theta_{d}$
– Detection Angle; (ix)
$\theta_{d}$
– Detection Angle; (ix) $F_{\nu}$
– Corrected Fluence; & (x)
$F_{\nu}$
– Corrected Fluence; & (x) $z_{\mathrm{loc}}$
– Localized host redshift. References are: a: Bannister et al. (Reference Bannister2017), b: Shannon et al. (Reference Shannon2018), c: Mahony et al. (Reference Mahony2018), d: Macquart et al. (Reference Macquart, Shannon, Bannister, James, Ekers and Bunton2019), e: Agarwal et al. (Reference Agarwal2019), f: Qiu et al. (Reference Qiu, Bannister, Shannon, Murphy, Bhandari, Agarwal, Lorimer and Bunton2019), g: Bhandari et al. (Reference Bhandari, Bannister, James, Shannon, Flynn, Caleb and Bunton2019), h: Bannister et al. (Reference Bannister2019), i: Prochaska et al. (Reference Prochaska2019b), j: Macquart et al. (Reference Macquart2020), k: Heintz et al. (Reference Heintz2020), l: Bhandari et al. (Reference Bhandari2020), m: Bhandari et al. (Reference Bhandari2022), n: Bhandari et al. (Reference Bhandari2023) o: (Shannon et al. Reference Shannon2024), p: James et al. (Reference James2022), q: Baptista et al. (Reference Baptista2024), r: Ryder et al. (Reference Ryder2023), s: Gordon et al. (Reference Gordon2024).
$z_{\mathrm{loc}}$
– Localized host redshift. References are: a: Bannister et al. (Reference Bannister2017), b: Shannon et al. (Reference Shannon2018), c: Mahony et al. (Reference Mahony2018), d: Macquart et al. (Reference Macquart, Shannon, Bannister, James, Ekers and Bunton2019), e: Agarwal et al. (Reference Agarwal2019), f: Qiu et al. (Reference Qiu, Bannister, Shannon, Murphy, Bhandari, Agarwal, Lorimer and Bunton2019), g: Bhandari et al. (Reference Bhandari, Bannister, James, Shannon, Flynn, Caleb and Bunton2019), h: Bannister et al. (Reference Bannister2019), i: Prochaska et al. (Reference Prochaska2019b), j: Macquart et al. (Reference Macquart2020), k: Heintz et al. (Reference Heintz2020), l: Bhandari et al. (Reference Bhandari2020), m: Bhandari et al. (Reference Bhandari2022), n: Bhandari et al. (Reference Bhandari2023) o: (Shannon et al. Reference Shannon2024), p: James et al. (Reference James2022), q: Baptista et al. (Reference Baptista2024), r: Ryder et al. (Reference Ryder2023), s: Gordon et al. (Reference Gordon2024).
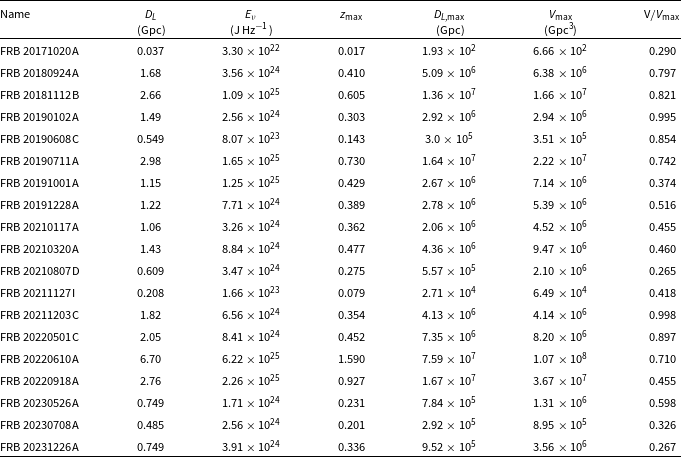
Derived properties of the 19 Localised High S/N Sample of ASKAP FRBs for which the S/N exceeds the threshold $\text{S/N} \ge \text{S/N}_{\mathrm{cutoff}} (= 14)$
, for fluence spectral indices of
$\text{S/N} \ge \text{S/N}_{\mathrm{cutoff}} (= 14)$
, for fluence spectral indices of $\alpha=0.0$
, and no source evolution. Note that this sample is a subset of the FRBs listed in Table 1.
$\alpha=0.0$
, and no source evolution. Note that this sample is a subset of the FRBs listed in Table 1.
Properties of the Full Sample. Columns and references are the same as in Table 1, excepting $z_{\mathrm{DM}}$
– Redshift inferred from the
$z_{\mathrm{DM}}$
– Redshift inferred from the $z-\text{DM}$
relation.
$z-\text{DM}$
relation.
 $^*$
These FRBs have
$^*$
These FRBs have $z_{\mathrm{DM}} \lt 0$
, and are excluded from initial analysis.
$z_{\mathrm{DM}} \lt 0$
, and are excluded from initial analysis. $^{\#}$
This FRB has S/N
$^{\#}$
This FRB has S/N $_{\mathrm{cutoff}}=8$
; all others are 9.5.
$_{\mathrm{cutoff}}=8$
; all others are 9.5. $^*$
These FRBs have
$^*$
These FRBs have $z_{\mathrm{DM}} \lt 0$
, and are excluded from initial analysis.
$z_{\mathrm{DM}} \lt 0$
, and are excluded from initial analysis.
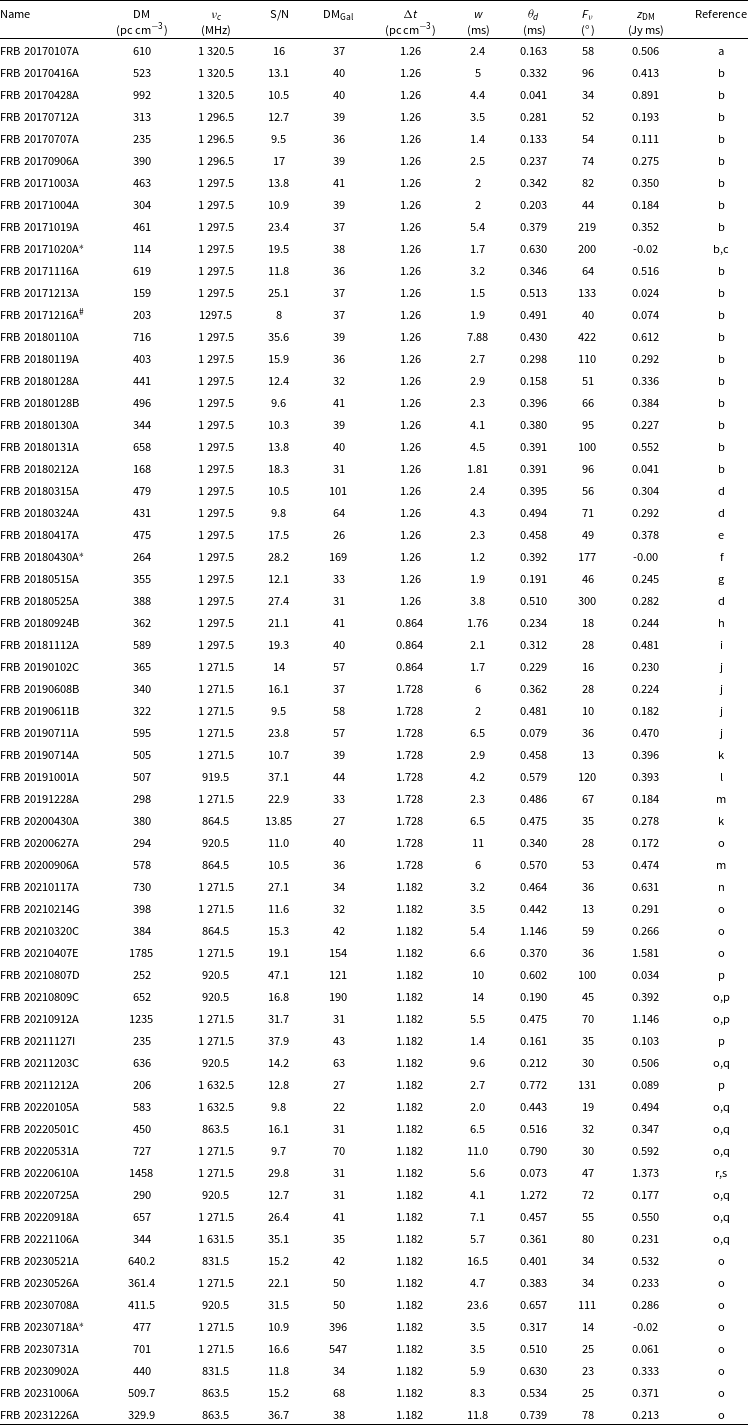
Table 3 lists the candidate full sample comprising 63 ASKAP FRBs along with their relevant observational parameters applicable to our analysis. In this sample, we include the 28 FRBs localised to their host galaxies. This constitutes the Full Sample (see Table 3), where the detection threshold of $\text{S/N}_{\mathrm{cutoff}} = 9.5$
as used in the CRAFT detection pipeline, is used for all FRBs irrespective of considerations of potential bias. The derived parameters of the Full Sample are provided in Table 4, whereby redshifts, even for FRBs with measured redshift, have been estimated from their DM budget via
$\text{S/N}_{\mathrm{cutoff}} = 9.5$
as used in the CRAFT detection pipeline, is used for all FRBs irrespective of considerations of potential bias. The derived parameters of the Full Sample are provided in Table 4, whereby redshifts, even for FRBs with measured redshift, have been estimated from their DM budget via
 \begin{align} \mathrm{DM}_{\mathrm{Obs}} = \mathrm{DM}_{\mathrm{MW}} + \mathrm{DM}_{\mathrm{Halo}} + \mathrm{DM}_{\mathrm{cosmic}} + \mathrm{DM}_{\mathrm{Host}}/(1+z) \text{,}\end{align}
where $\mathrm{DM}_{\mathrm{Obs}}$
is the observed DM of the FRB, while DM_MW,
$\mathrm{DM}_{\mathrm{Obs}}$
is the observed DM of the FRB, while DM_MW, $\mathrm{DM}_{\mathrm{Halo}}$
and
$\mathrm{DM}_{\mathrm{Halo}}$
and $\mathrm{DM}_{\mathrm{Host}}$
are the DM contributions due to the Milky Way disc, its halo, and the FRB host environment, respectively. We set the cosmological contribution
$\mathrm{DM}_{\mathrm{Host}}$
are the DM contributions due to the Milky Way disc, its halo, and the FRB host environment, respectively. We set the cosmological contribution $\mathrm{DM}_{\mathrm{cosmic}}$
to its mean,
$\mathrm{DM}_{\mathrm{cosmic}}$
to its mean, $\overline{\mathrm{DM}}(z)$
, using equation (14) and assume a constant host contribution of
$\overline{\mathrm{DM}}(z)$
, using equation (14) and assume a constant host contribution of $\mathrm{DM}_{\mathrm{Host}} = 50$
pc cm
$\mathrm{DM}_{\mathrm{Host}} = 50$
pc cm $^{-3}$
and halo contribution of
$^{-3}$
and halo contribution of $\mathrm{DM}_{\mathrm{Halo}} = 50$
pc cm
$\mathrm{DM}_{\mathrm{Halo}} = 50$
pc cm $^{-3}$
consistent with Arcus et al. (Reference Arcus, Macquart, Sammons, James and Ekers2020).
$^{-3}$
consistent with Arcus et al. (Reference Arcus, Macquart, Sammons, James and Ekers2020). $\mathrm{DM}_{\mathrm{MW}}$
is determined via the NE2001 model of Cordes & Lazio (Reference Cordes and Lazio2003). We note that uncertainties in these quantities can be large – of order a factor of two for
$\mathrm{DM}_{\mathrm{MW}}$
is determined via the NE2001 model of Cordes & Lazio (Reference Cordes and Lazio2003). We note that uncertainties in these quantities can be large – of order a factor of two for $\mathrm{DM}_{\mathrm{MW}}$
(Schnitzeler Reference Schnitzeler2012), and perhaps a similar uncertainty for
$\mathrm{DM}_{\mathrm{MW}}$
(Schnitzeler Reference Schnitzeler2012), and perhaps a similar uncertainty for $\mathrm{DM}_{\mathrm{Halo}}$
(Prochaska & Zheng Reference Prochaska and Zheng2019; Keating & Pen Reference Keating and Pen2020). Fluctuations in
$\mathrm{DM}_{\mathrm{Halo}}$
(Prochaska & Zheng Reference Prochaska and Zheng2019; Keating & Pen Reference Keating and Pen2020). Fluctuations in $\mathrm{DM}_{\mathrm{Host}}$
are not directly measured, but are estimated to be large (James et al. Reference James2022). This results in potentially large fluctuations about the Macquart relation, as evinced by FRBs with exceptionally low or high DMs for their redshifts, for example, FRB 20200120E with DM 87.82 pc cm
$\mathrm{DM}_{\mathrm{Host}}$
are not directly measured, but are estimated to be large (James et al. Reference James2022). This results in potentially large fluctuations about the Macquart relation, as evinced by FRBs with exceptionally low or high DMs for their redshifts, for example, FRB 20200120E with DM 87.82 pc cm $^{-3}$
at 3.6 Mpc (Bhardwaj et al. Reference Bhardwaj2021), and FRB 20190520B with DM
$^{-3}$
at 3.6 Mpc (Bhardwaj et al. Reference Bhardwaj2021), and FRB 20190520B with DM $1204.7$
pc cm
$1204.7$
pc cm $^{-3}$
at
$^{-3}$
at $z=0.241$
(Niu et al. Reference Niu2022a).
$z=0.241$
(Niu et al. Reference Niu2022a).
Derived properties of the Full Sample for a fluence spectral index of $\alpha = 0.0$
and no source evolution. For those with
$\alpha = 0.0$
and no source evolution. For those with $z_{\mathrm{DM}} \lt 0$
(marked with a
$z_{\mathrm{DM}} \lt 0$
(marked with a $^*$
: FRB 20171020A, FRB 20180430A, and FRB 20230718A), an assumed distance of 2 Mpc is used. Columns are identical to those of Table 2.
$^*$
: FRB 20171020A, FRB 20180430A, and FRB 20230718A), an assumed distance of 2 Mpc is used. Columns are identical to those of Table 2.
Consistent with Macquart et al. (Reference Macquart2020) and Arcus et al. (Reference Arcus, James, Ekers and Wayth2022), we determine the mean DM of a homogeneously distributed intergalactic medium (IGM) as given by Ioka (Reference Ioka2003), Inoue (Reference Inoue2004), updated to include the fraction $f_d$
of baryons in diffuse ionised gas as per Deng & Zhang (Reference Deng and Zhang2014)
$f_d$
of baryons in diffuse ionised gas as per Deng & Zhang (Reference Deng and Zhang2014)
 \begin{align} \begin{split} \overline{\mathrm{DM}}(z)=&\dfrac{3H_0c\Omega_b}{8 \pi G m_p}\\ &\int_{0}^{z} f_d(z') \dfrac{(1+z') \left[\frac{3}{4} X_{\mathrm{e,H}}(z') + \frac{1}{8}X_{\mathrm{e,He}}(z')\right] }{\sqrt{(1+z')^3 \Omega_m + \Omega_{\Lambda}}} dz' \text{,} \end{split}\end{align}
where the ionised fractions of Hydrogen and Helium are taken to be $X_{\mathrm{e,H}}=1$
for
$X_{\mathrm{e,H}}=1$
for $z \lt 8$
and
$z \lt 8$
and $X_{\mathrm{e,He}}=1$
for
$X_{\mathrm{e,He}}=1$
for $z \lt 2.5$
, respectively, or zero otherwise. Throughout this work we adopt a
$z \lt 2.5$
, respectively, or zero otherwise. Throughout this work we adopt a $\Lambda$
CDM universe with the cosmological parameters
$\Lambda$
CDM universe with the cosmological parameters $(h, H_{0}, \Omega_{b}, \Omega_{m}, \Omega_{\Lambda}, \Omega_{k}) = (0.7, 100 h \mathrm{km s}^{-1} \mathrm{Mpc}^{-1}, 0.0486, 0.308, 0.691, 0)$
, that is, an intermediate value of
$(h, H_{0}, \Omega_{b}, \Omega_{m}, \Omega_{\Lambda}, \Omega_{k}) = (0.7, 100 h \mathrm{km s}^{-1} \mathrm{Mpc}^{-1}, 0.0486, 0.308, 0.691, 0)$
, that is, an intermediate value of $H_0$
(Abdalla et al. Reference Abdalla2022), but otherwise in accordance with the (Planck Collaboration et al. 2016). We use the estimate of
$H_0$
(Abdalla et al. Reference Abdalla2022), but otherwise in accordance with the (Planck Collaboration et al. 2016). We use the estimate of $f_d(z)$
from the FRB code base (Prochaska et al. Reference Prochaska, Simha, Law, Tejos and Neeleman2019a), which ranges from 0.844 at
$f_d(z)$
from the FRB code base (Prochaska et al. Reference Prochaska, Simha, Law, Tejos and Neeleman2019a), which ranges from 0.844 at $z=0$
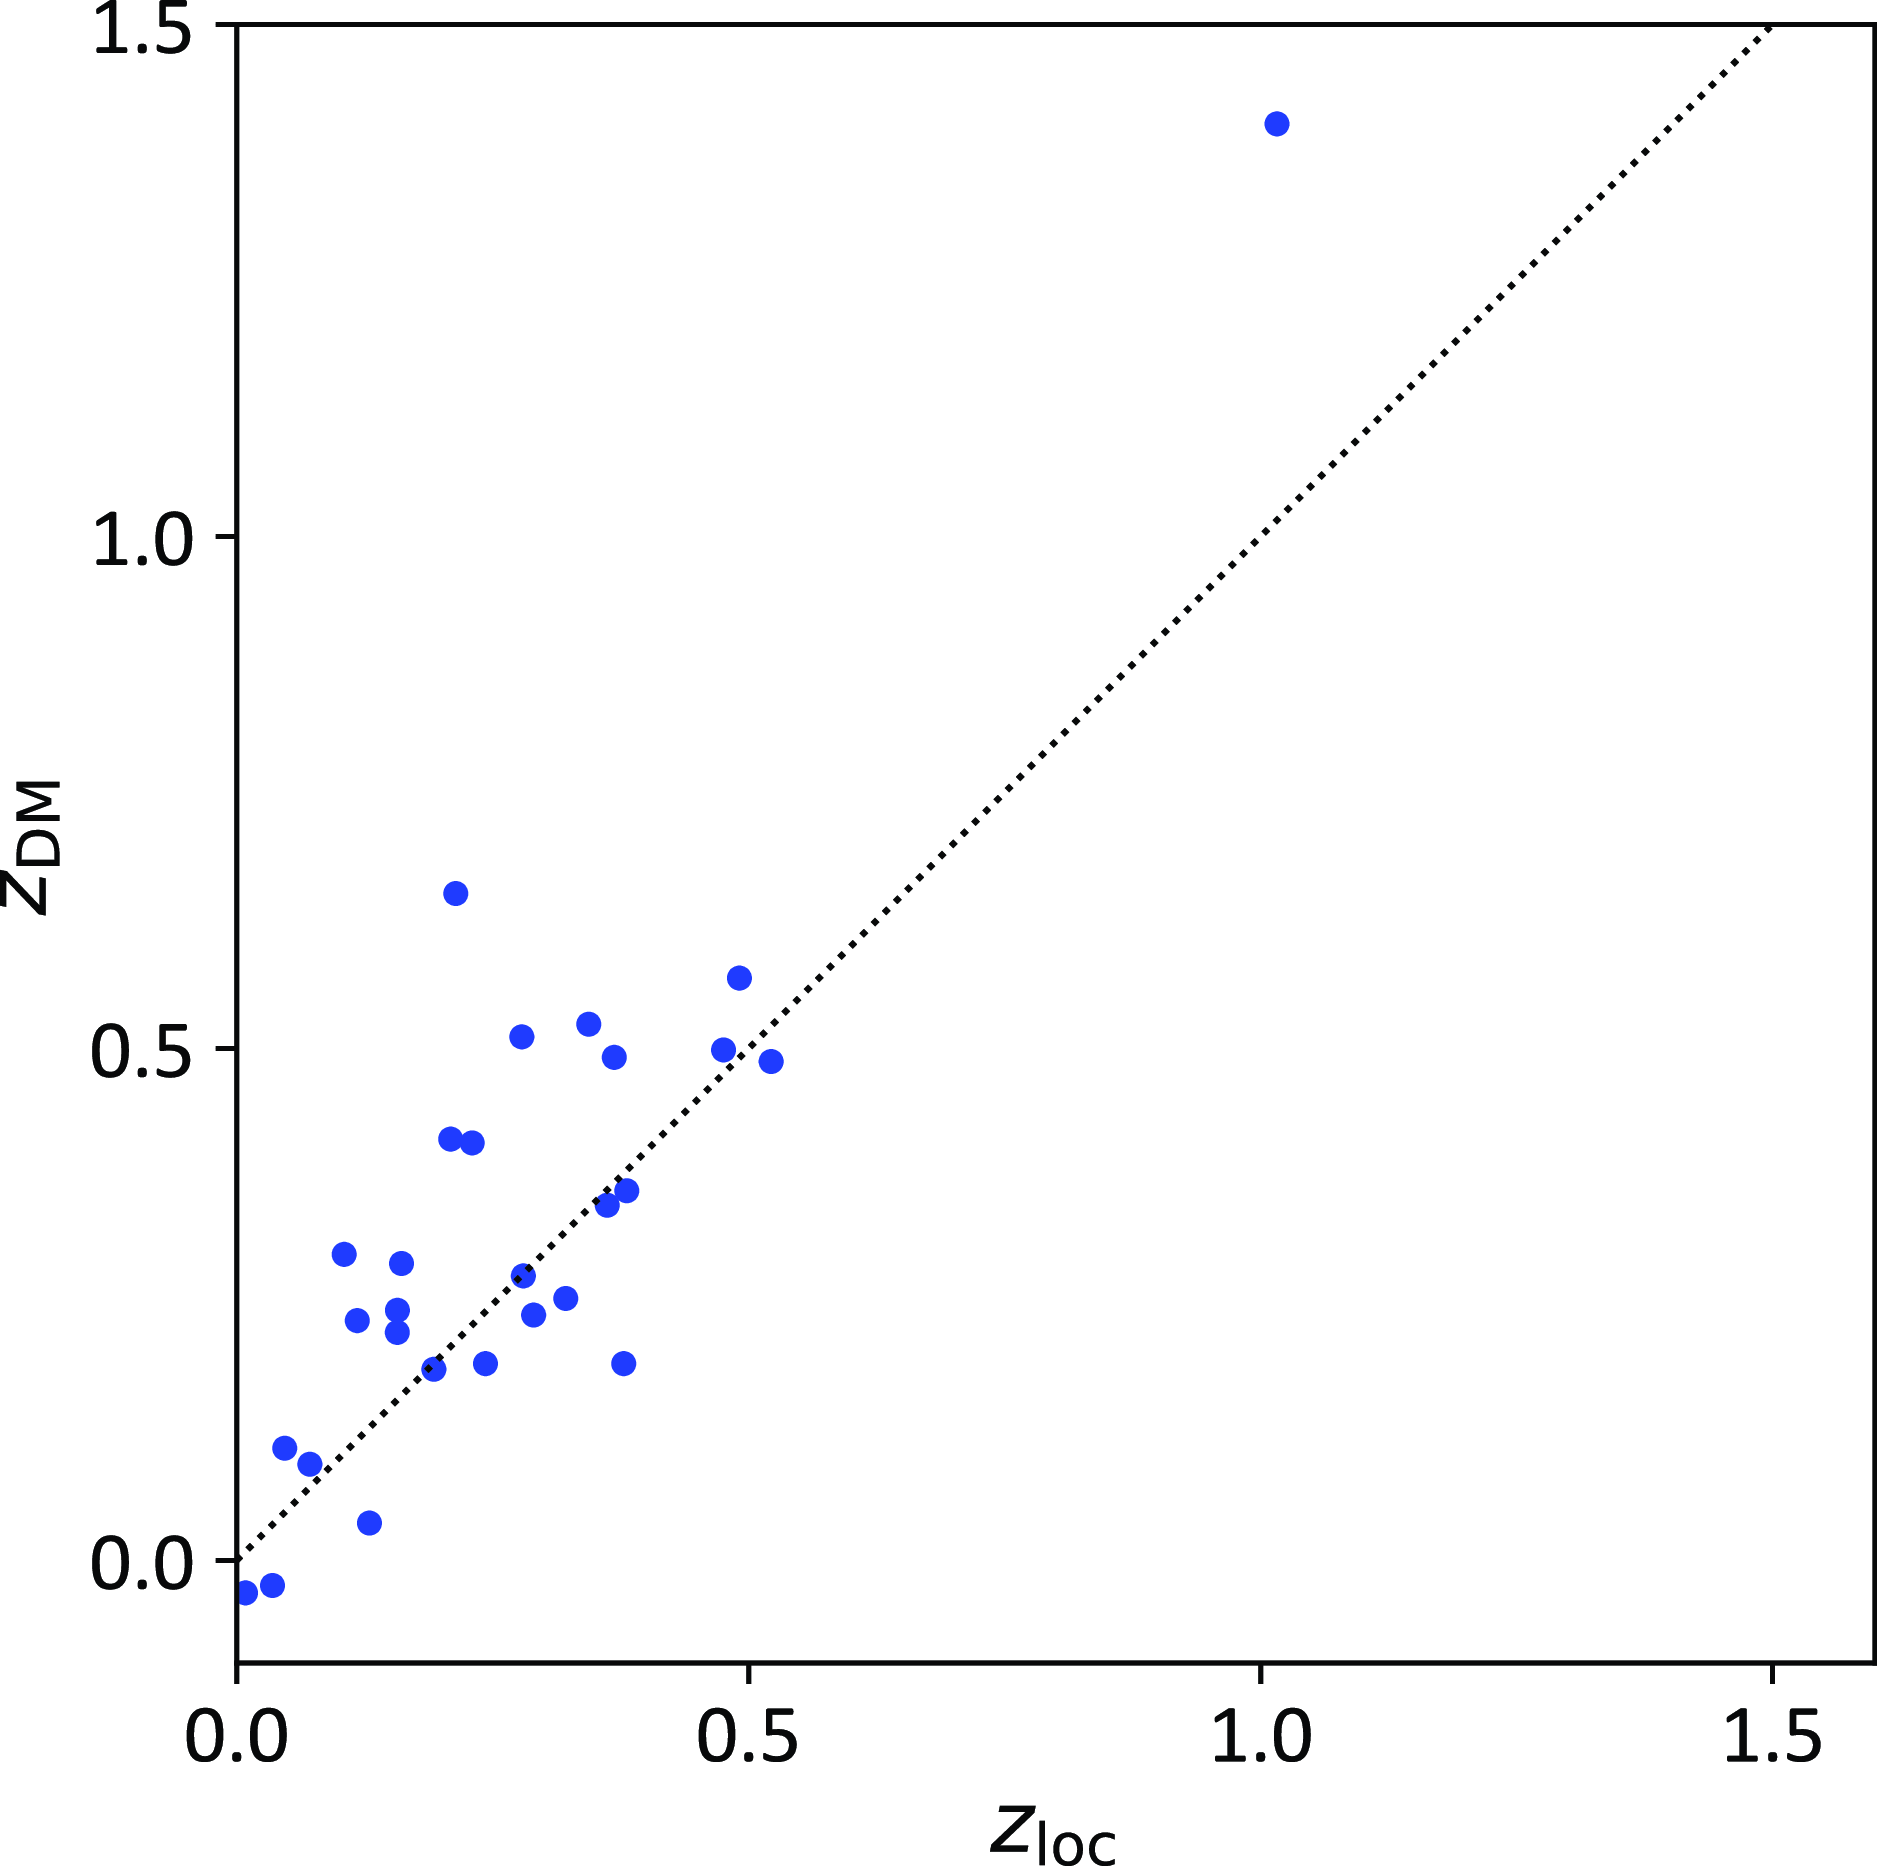
, and increases slowly with redshift. This relation between FRB redshift and expected DM was first verified by Macquart et al. (Reference Macquart2020), and is now known as the Macquart relation. Fig. 2 illustrates the scatter about the Macquart relation for the Localised High S/N Sample of FRBs. The scatter is large – up to a factor of two in redshift – and dominates over the uncertainties in the mean of the Macquart relation. We therefore estimate the error from using the Full Sample by comparing it to that of the Localised High S/N Sample, rather than marginalising over uncertainties in estimating
$z=0$
, and increases slowly with redshift. This relation between FRB redshift and expected DM was first verified by Macquart et al. (Reference Macquart2020), and is now known as the Macquart relation. Fig. 2 illustrates the scatter about the Macquart relation for the Localised High S/N Sample of FRBs. The scatter is large – up to a factor of two in redshift – and dominates over the uncertainties in the mean of the Macquart relation. We therefore estimate the error from using the Full Sample by comparing it to that of the Localised High S/N Sample, rather than marginalising over uncertainties in estimating $z_\mathrm{DM}$
. Three FRBs have an implied negative
$z_\mathrm{DM}$
. Three FRBs have an implied negative $z_\mathrm{DM}$
, and hence are omitted from our initial analysis of the Full Sample. The effects of this are discussed in Section 4.2.
$z_\mathrm{DM}$
, and hence are omitted from our initial analysis of the Full Sample. The effects of this are discussed in Section 4.2.
Scatter plot of spectroscopically measured host galaxy redshifts, $z_\mathrm{loc}$
, and those derived from the Macquart relation,
$z_\mathrm{loc}$
, and those derived from the Macquart relation, $z_\mathrm{DM}$
, for the Localised High S/N Sample.
$z_\mathrm{DM}$
, for the Localised High S/N Sample.
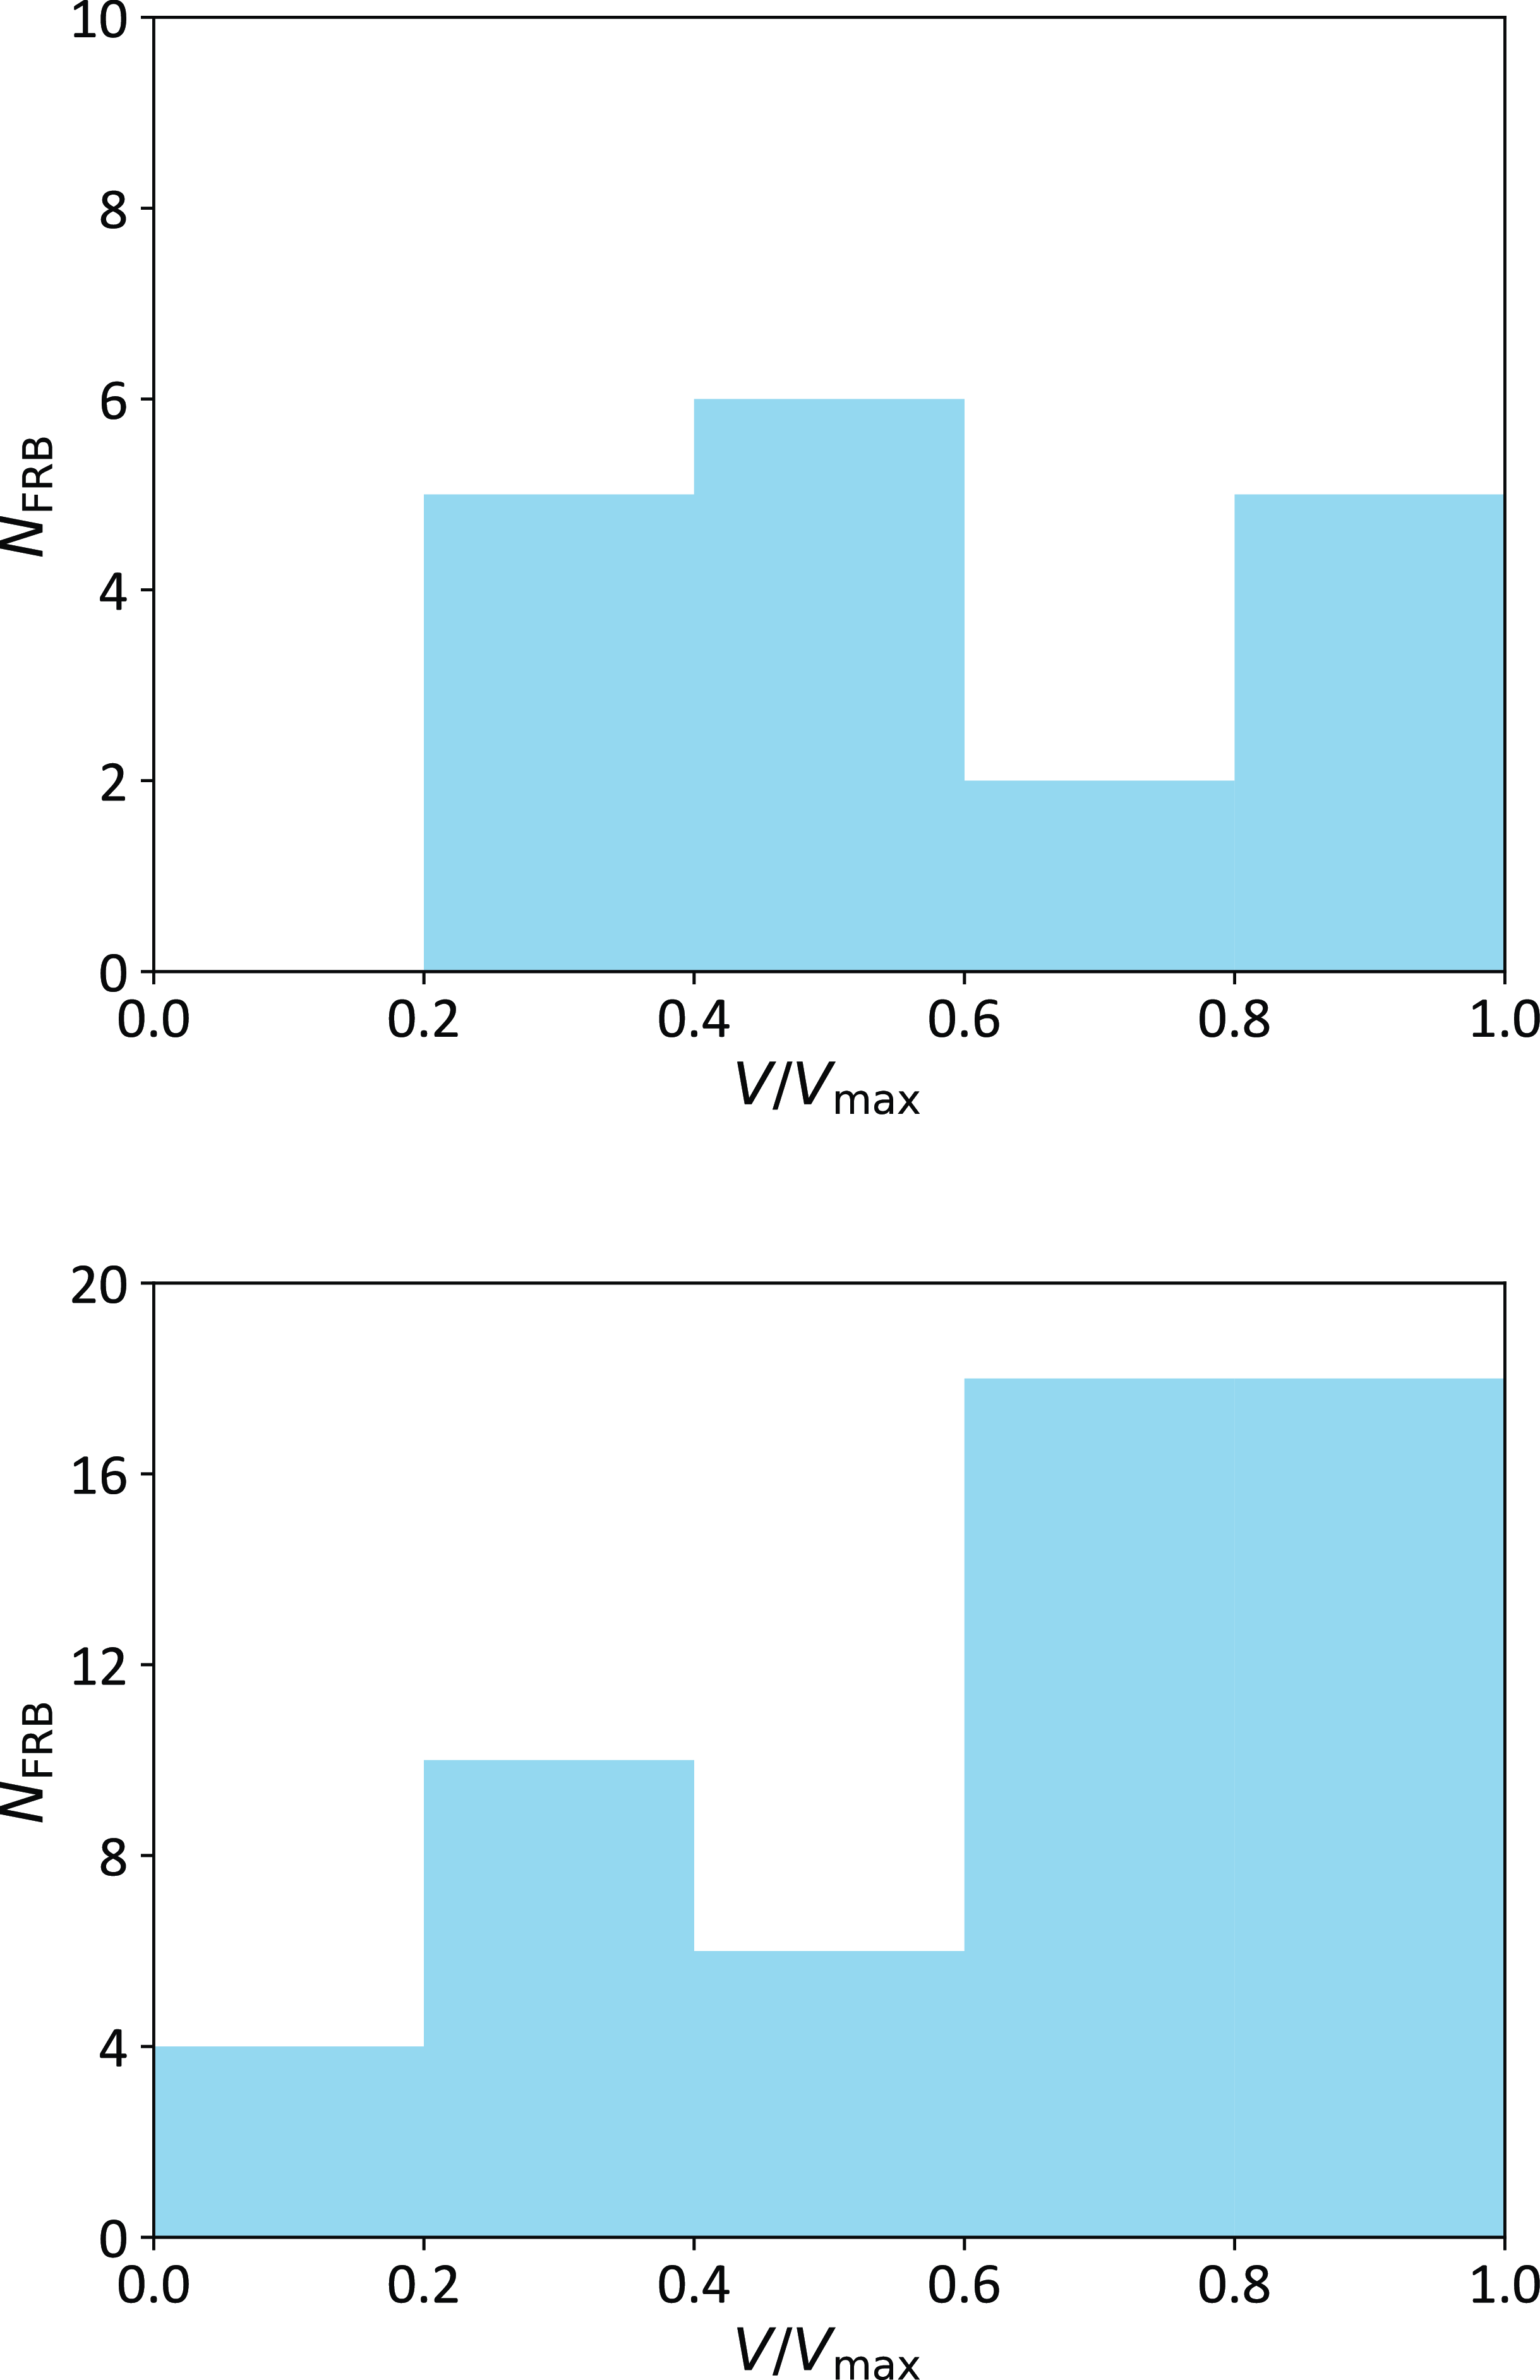
Histograms of $V/V_{\mathrm{max}}$
for both the Localised High S/N Sample (top) and Full Sample (bottom), under the assumption of no spectral dependence (
$V/V_{\mathrm{max}}$
for both the Localised High S/N Sample (top) and Full Sample (bottom), under the assumption of no spectral dependence ( $\alpha=0$
) or cosmological evolution (
$\alpha=0$
) or cosmological evolution ( $n_\mathrm{SFR}=0$
). Three FRBs with negative
$n_\mathrm{SFR}=0$
). Three FRBs with negative $z_\mathrm{ DM}$
values have been omitted from the Full Sample.
$z_\mathrm{ DM}$
values have been omitted from the Full Sample.
4. Discussion
4.1 The FRB radio luminosity function
The distributions of $V/V_{\mathrm{max}}$
for both samples are shown in Fig. 3. As discussed in Appendix A, the major deviation from uniformity is the deficit of FRBs with low
$V/V_{\mathrm{max}}$
for both samples are shown in Fig. 3. As discussed in Appendix A, the major deviation from uniformity is the deficit of FRBs with low $V/V_{\mathrm{max}}$
, which cannot be rectified for any reasonable source evolution function. Hence, we proceed to calculate the RLF from these samples, under the assumption of no spectral dependence (i.e.
$V/V_{\mathrm{max}}$
, which cannot be rectified for any reasonable source evolution function. Hence, we proceed to calculate the RLF from these samples, under the assumption of no spectral dependence (i.e. $\alpha=0$
) and no cosmological evolution of the source population.
$\alpha=0$
) and no cosmological evolution of the source population.
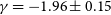
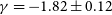
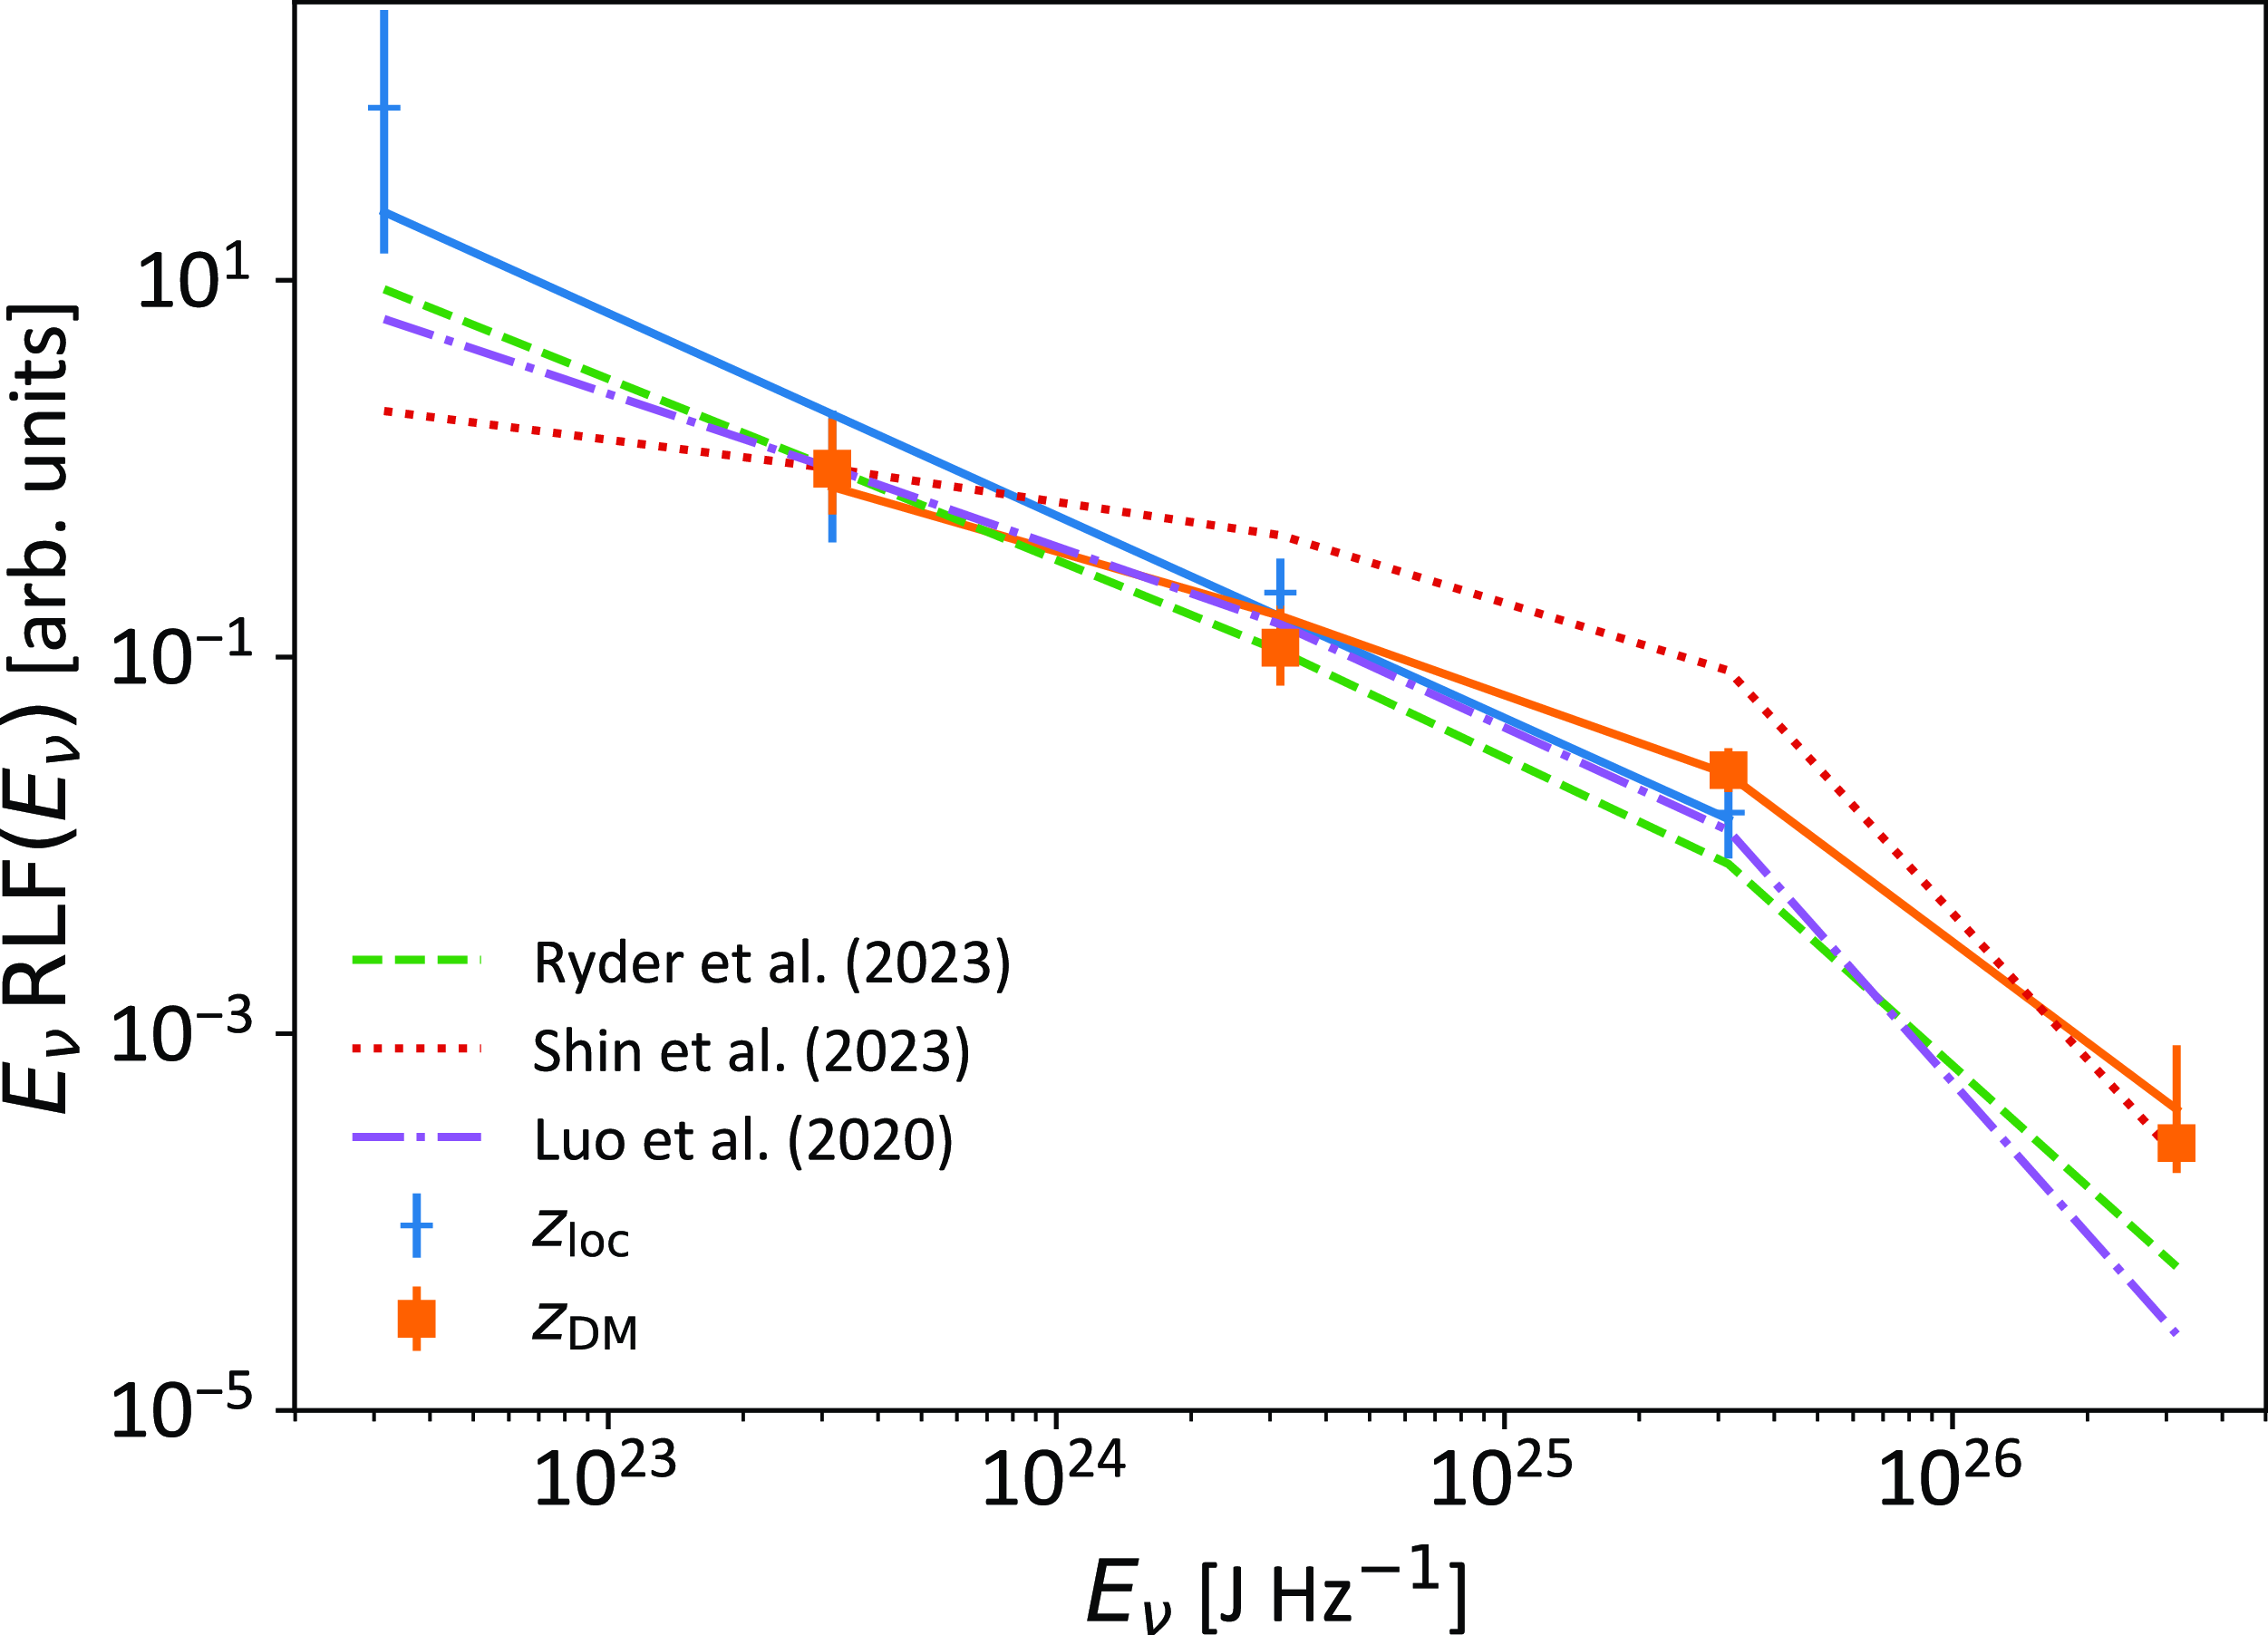
Fig. 4 depicts the derived RLF from the Localised High S/N Sample and Full Sample. Also shown are their best-fit functions (fitted parameters given in Table 5) and comparisons to values from the literature. A flatter RLF is preferred by the Full Sample ( $\gamma=-1.82 \pm 0.12$
) compared to the Localised High S/N Sample (
$\gamma=-1.82 \pm 0.12$
) compared to the Localised High S/N Sample ( $\gamma=-2.11 \pm 0.18$
). At high luminosities, the Full Sample shows some evidence for a high-energy down-turn near
$\gamma=-2.11 \pm 0.18$
). At high luminosities, the Full Sample shows some evidence for a high-energy down-turn near $\log_{10} E_\mathrm{max}\,(\mathrm {J\,Hz}^{-1})=25.8 \pm 0.39$
— likely due to the smaller Localised High S/N Sample containing no data in the
$\log_{10} E_\mathrm{max}\,(\mathrm {J\,Hz}^{-1})=25.8 \pm 0.39$
— likely due to the smaller Localised High S/N Sample containing no data in the $10^{26}{-}10^{27}\,{{\mathrm {J\,Hz}^{-1}}}$
bin. Conversely, the RLF data at
$10^{26}{-}10^{27}\,{{\mathrm {J\,Hz}^{-1}}}$
bin. Conversely, the RLF data at $E_\nu \lt 10^{23}{{\mathrm {J\,Hz}^{-1}}}$
from the Localised High S/N Sample shows an excess which is inconsistent with both a power-law or Schechter function, and the Full Sample contains no data in that luminosity bin. Such a low-energy excess has been observed in several repeating FRBs, with low-energy peaks becoming dominant in the
$E_\nu \lt 10^{23}{{\mathrm {J\,Hz}^{-1}}}$
from the Localised High S/N Sample shows an excess which is inconsistent with both a power-law or Schechter function, and the Full Sample contains no data in that luminosity bin. Such a low-energy excess has been observed in several repeating FRBs, with low-energy peaks becoming dominant in the $\sim+10^{22}{-}10^{23}{{\mathrm {J\,Hz}^{-1}}}$
range (Niu et al. Reference Niu2022b; Li et al. Reference Li2021). Furthermore, Kirsten et al. (Reference Kirsten2024) have found evidence for a flatter power-law index at energies above
$\sim+10^{22}{-}10^{23}{{\mathrm {J\,Hz}^{-1}}}$
range (Niu et al. Reference Niu2022b; Li et al. Reference Li2021). Furthermore, Kirsten et al. (Reference Kirsten2024) have found evidence for a flatter power-law index at energies above $10^{24}{{\mathrm {J\,Hz}^{-1}}}$
for FRB 20201124A. This suggests that apparently once-off FRBs localised with ASKAP exhibit a qualitatively similar hardening of the RLF above
$10^{24}{{\mathrm {J\,Hz}^{-1}}}$
for FRB 20201124A. This suggests that apparently once-off FRBs localised with ASKAP exhibit a qualitatively similar hardening of the RLF above $10^{23}\,{{\mathrm {J\,Hz}^{-1}}}$
, though this is an ensemble average over the behaviour of many objects, and there are quantitative differences both within and between the RLFs measured for repeating FRBs; these samples may be subject to systematic biases, as discussed below.
$10^{23}\,{{\mathrm {J\,Hz}^{-1}}}$
, though this is an ensemble average over the behaviour of many objects, and there are quantitative differences both within and between the RLFs measured for repeating FRBs; these samples may be subject to systematic biases, as discussed below.
Radio luminosity functions (RLFs) calculated from the Localised High S/N Sample (using $z_\mathrm{loc}$
) and Full Sample (using
$z_\mathrm{loc}$
) and Full Sample (using $z_\mathrm{DM}$
). The (arbitrary) normalisation is fixed to unity at the
$z_\mathrm{DM}$
). The (arbitrary) normalisation is fixed to unity at the $10^{23}$
–
$10^{23}$
– $10^{24}$
bin. The best-fit Schechter functions for each sample are depicted for reference purposes. Also shown are luminosity functions derived from ASKAP and Parkes data by Ryder et al. (Reference Ryder2023), CHIME data by Shin et al. (Reference Shin2023), and a mixed sample by Luo et al. (Reference Luo, Men, Lee, Wang, Lorimer and Zhang2020). The data are binned in log-space, so that the ordinate (y-axis) is effectively the RLF multiplied by the spectral fluence,
$10^{24}$
bin. The best-fit Schechter functions for each sample are depicted for reference purposes. Also shown are luminosity functions derived from ASKAP and Parkes data by Ryder et al. (Reference Ryder2023), CHIME data by Shin et al. (Reference Shin2023), and a mixed sample by Luo et al. (Reference Luo, Men, Lee, Wang, Lorimer and Zhang2020). The data are binned in log-space, so that the ordinate (y-axis) is effectively the RLF multiplied by the spectral fluence, $E_\nu$
.
$E_\nu$
.
4.2 Systematic biases – full sample
The Full Sample includes three low-DM FRBs with implied negative redshifts, which cannot therefore be trivially included in calculations. This results in the RLF that uses $z_\mathrm{DM}$
missing these events, which invariably occur in the nearby Universe, where under-fluctuations in
$z_\mathrm{DM}$
missing these events, which invariably occur in the nearby Universe, where under-fluctuations in $\mathrm{DM}_\mathrm{Host}$
,
$\mathrm{DM}_\mathrm{Host}$
, $\mathrm{DM}_\mathrm{Halo}$
, and/or
$\mathrm{DM}_\mathrm{Halo}$
, and/or $\mathrm{ DM}_\mathrm{MW}$
could result in low measured values of
$\mathrm{ DM}_\mathrm{MW}$
could result in low measured values of $\mathrm{DM}_\mathrm{Obs}$
, such that only a negative value of z will satisfy equation (13). This effect can be seen most clearly in the missing data point for the Full Sample in the
$\mathrm{DM}_\mathrm{Obs}$
, such that only a negative value of z will satisfy equation (13). This effect can be seen most clearly in the missing data point for the Full Sample in the $10^{22}$
–
$10^{22}$
– $10^{23}$
J Hz
$10^{23}$
J Hz $^{-1}$
bin in Fig. 4, which in the Localised High S/N Sample, is entirely due to FRB 20171020A. One method of avoiding such a bias is to marginalise over distributions of Milky Way and host galaxy DM contributions, as performed by Locatelli et al. (Reference Locatelli, Ronchi, Ghirlanda and Ghisellini2019) – see Section 4.5 for further discussion of this approach.
$^{-1}$
bin in Fig. 4, which in the Localised High S/N Sample, is entirely due to FRB 20171020A. One method of avoiding such a bias is to marginalise over distributions of Milky Way and host galaxy DM contributions, as performed by Locatelli et al. (Reference Locatelli, Ronchi, Ghirlanda and Ghisellini2019) – see Section 4.5 for further discussion of this approach.
The effect of this bias can be estimated by placing robust bounds on the true distance to these $z_\mathrm{DM} \lt 0$
FRBs. A lower bound assumes they are not located in Local Group galaxies, limiting the luminosity distance
$z_\mathrm{DM} \lt 0$
FRBs. A lower bound assumes they are not located in Local Group galaxies, limiting the luminosity distance $D_L \gtrsim 2$
Mpc (which equates to
$D_L \gtrsim 2$
Mpc (which equates to $z_\mathrm{min} = 0.00024$
, ignoring peculiar velocities). An upper bound assumes that the entire DM contribution is cosmological in nature, that is,
$z_\mathrm{min} = 0.00024$
, ignoring peculiar velocities). An upper bound assumes that the entire DM contribution is cosmological in nature, that is, $z_\mathrm{max} = z_\mathrm{DM}(\mathrm{DM}_\mathrm{cosmic} = \mathrm{ DM}_\mathrm{Obs})$
. We vary between these extremes, using
$z_\mathrm{max} = z_\mathrm{DM}(\mathrm{DM}_\mathrm{cosmic} = \mathrm{ DM}_\mathrm{Obs})$
. We vary between these extremes, using $z = z_\mathrm{min} + k (z_\mathrm{max}-z_\mathrm{min})$
, for
$z = z_\mathrm{min} + k (z_\mathrm{max}-z_\mathrm{min})$
, for $k=0,0.1,1.0$
. We find that for
$k=0,0.1,1.0$
. We find that for $k\ge0.2$
, the effect on the RLF is negligible. However, for very low values of k, the RLF extends to very low luminosities, with a dependence
$k\ge0.2$
, the effect on the RLF is negligible. However, for very low values of k, the RLF extends to very low luminosities, with a dependence $\propto E_\nu^{-1.5}$
, since these FRBs invariably occupy the local Universe with approximately Euclidean geometry. The case of
$\propto E_\nu^{-1.5}$
, since these FRBs invariably occupy the local Universe with approximately Euclidean geometry. The case of $k=0$
only is shown in Fig. 5.
$k=0$
only is shown in Fig. 5.
When assuming very nearby FRBs, the low-luminosity form of the RLF is significantly changed, and we are unable to obtain consistent fits. Excluding data below $10^{22}\,{{\mathrm {J\,Hz}^{-1}}}$
produces almost identical values for
$10^{22}\,{{\mathrm {J\,Hz}^{-1}}}$
produces almost identical values for $\gamma$
and
$\gamma$
and $E_\mathrm{max}$
as those previously found for the Full Sample. We therefore conclude that this bias limits our ability to probe the low-luminosity end of the RLF.
$E_\mathrm{max}$
as those previously found for the Full Sample. We therefore conclude that this bias limits our ability to probe the low-luminosity end of the RLF.
4.3 Systematic biases – localised high S/N sample
The inclusion of FRB 20171020A in the Localised High S/N Sample highlights our second source of systematic bias. FRB 20171020A only has a confident redshift precisely because it is nearby, thus its host galaxy can be identified despite the relatively large localisation errors of the CRAFT Fly’s Eye observations. The analysis presented here has no means of accounting for the likely more-distant, higher-DM FRBs of the Fly’s Eye sample (those from FRB 20170107A to FRB 20180525A) which cannot be included in the Localised High S/N Sample. A similar effect also occurs for high-redshift – and necessarily high-luminosity – FRBs, the host galaxies of which may be unidentifiable due to their large distance. An example of this is FRB 20210912A, where optical limits on the as-yet unseen host galaxy suggests $z \gt 0.7$
, with
$z \gt 0.7$
, with $z=1$
implying
$z=1$
implying $E_\nu = 9.7 \cdot 10^{25}\,\mathrm{J}\,\mathrm{Hz}^{-1}$
in the case of
$E_\nu = 9.7 \cdot 10^{25}\,\mathrm{J}\,\mathrm{Hz}^{-1}$
in the case of $\alpha=0$
(Marnoch et al. Reference Marnoch2023). However, without this firm localisation, this undoubtedly energetic FRB cannot be included in the Localised High S/N Sample.
$\alpha=0$
(Marnoch et al. Reference Marnoch2023). However, without this firm localisation, this undoubtedly energetic FRB cannot be included in the Localised High S/N Sample.
The biases mentioned above can be overcome in the case of the Localised High S/N Sample by using a limiting redshift $z_\mathrm{ lim}$
such that all FRBs with
$z_\mathrm{ lim}$
such that all FRBs with $z \lt z_\mathrm{lim}$
are guaranteed to have their host galaxies identified. To do this, we first remove FRB 20171020A from the sample, since
$z \lt z_\mathrm{lim}$
are guaranteed to have their host galaxies identified. To do this, we first remove FRB 20171020A from the sample, since $z_\mathrm{lim}$
for the CRAFT Fly’s Eye observations are poorly defined and set
$z_\mathrm{lim}$
for the CRAFT Fly’s Eye observations are poorly defined and set $z_\mathrm{lim}=0.7$
for the remaining FRBs localised with ICS observations. All integrals over z in the calculations for V and
$z_\mathrm{lim}=0.7$
for the remaining FRBs localised with ICS observations. All integrals over z in the calculations for V and $V_{\mathrm{max}}$
in Section 3 are then terminated at
$V_{\mathrm{max}}$
in Section 3 are then terminated at $z_\mathrm{lim}$
, while FRBs located outside this volume are excluded. Thus, the definition of
$z_\mathrm{lim}$
, while FRBs located outside this volume are excluded. Thus, the definition of $V_{\mathrm{max}}$
becomes ‘the volume within which this FRB would have been included in the analysis’. A limiting case of this method is to use only FRBs in a thin slice of redshift, between z and
$V_{\mathrm{max}}$
becomes ‘the volume within which this FRB would have been included in the analysis’. A limiting case of this method is to use only FRBs in a thin slice of redshift, between z and $z+dz$
. In such a case,
$z+dz$
. In such a case, $V=V_\mathrm{max}$
, and is constant for each and every FRB, such that every FRB has equal weight in the calculation of the luminosity function, consistent with expectation.
$V=V_\mathrm{max}$
, and is constant for each and every FRB, such that every FRB has equal weight in the calculation of the luminosity function, consistent with expectation.
Mean $V/V_{\mathrm{max}}$
and best fit parameters (
$V/V_{\mathrm{max}}$
and best fit parameters ( $\gamma$
,
$\gamma$
, $E_\mathrm{max}$
) of the pure power-law and Schechter function fits to the FRB luminosity function for different data-sets, assuming no spectral dependence (i.e.
$E_\mathrm{max}$
) of the pure power-law and Schechter function fits to the FRB luminosity function for different data-sets, assuming no spectral dependence (i.e. $\alpha=0$
) or evolution of the source population. The p-values for the power-law fits are the probability of observing a
$\alpha=0$
) or evolution of the source population. The p-values for the power-law fits are the probability of observing a $\chi^2$
that value or higher should the power-law be the true model (high values indicate a good fit); for the Schechter function, the p-value is the probability of observing such a significant improvement in
$\chi^2$
that value or higher should the power-law be the true model (high values indicate a good fit); for the Schechter function, the p-value is the probability of observing such a significant improvement in $\chi^2$
should the power-law be the true model (low values are evidence for a Schechter function).
$\chi^2$
should the power-law be the true model (low values are evidence for a Schechter function).
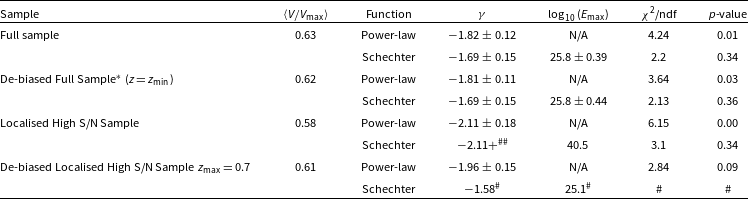
 $^*$
Assumes FRBs with a negative
$^*$
Assumes FRBs with a negative $z_\mathrm{DM}$
are located at a distance of
$z_\mathrm{DM}$
are located at a distance of $z_\mathrm{min}=0.00024$
(2 Mpc); fit excludes data below
$z_\mathrm{min}=0.00024$
(2 Mpc); fit excludes data below $10^{22}$
J Hz
$10^{22}$
J Hz $^{-1}$
.
$^{-1}$
. ${}^{\#}$
No errors can be estimated for these parameters, due to the number of degrees of freedom (ndf.) of the fit being zero.
${}^{\#}$
No errors can be estimated for these parameters, due to the number of degrees of freedom (ndf.) of the fit being zero. $^{\#\#}$
The best-fit value of
$^{\#\#}$
The best-fit value of $E_\mathrm{max}$
is effectively infinite, rendering error calculations for the parameters meaningless.
$E_\mathrm{max}$
is effectively infinite, rendering error calculations for the parameters meaningless.
Data on radio luminosity functions (RLFs) calculated so as to account for observational biases, showing the full range allowing for a minimum distance at $z_\mathrm{min}$
. The line indicating the
$z_\mathrm{min}$
. The line indicating the $E_\nu$
RLF
$E_\nu$
RLF $ \propto E_\nu^{-1.5}$
is to guide the eye only.
$ \propto E_\nu^{-1.5}$
is to guide the eye only.
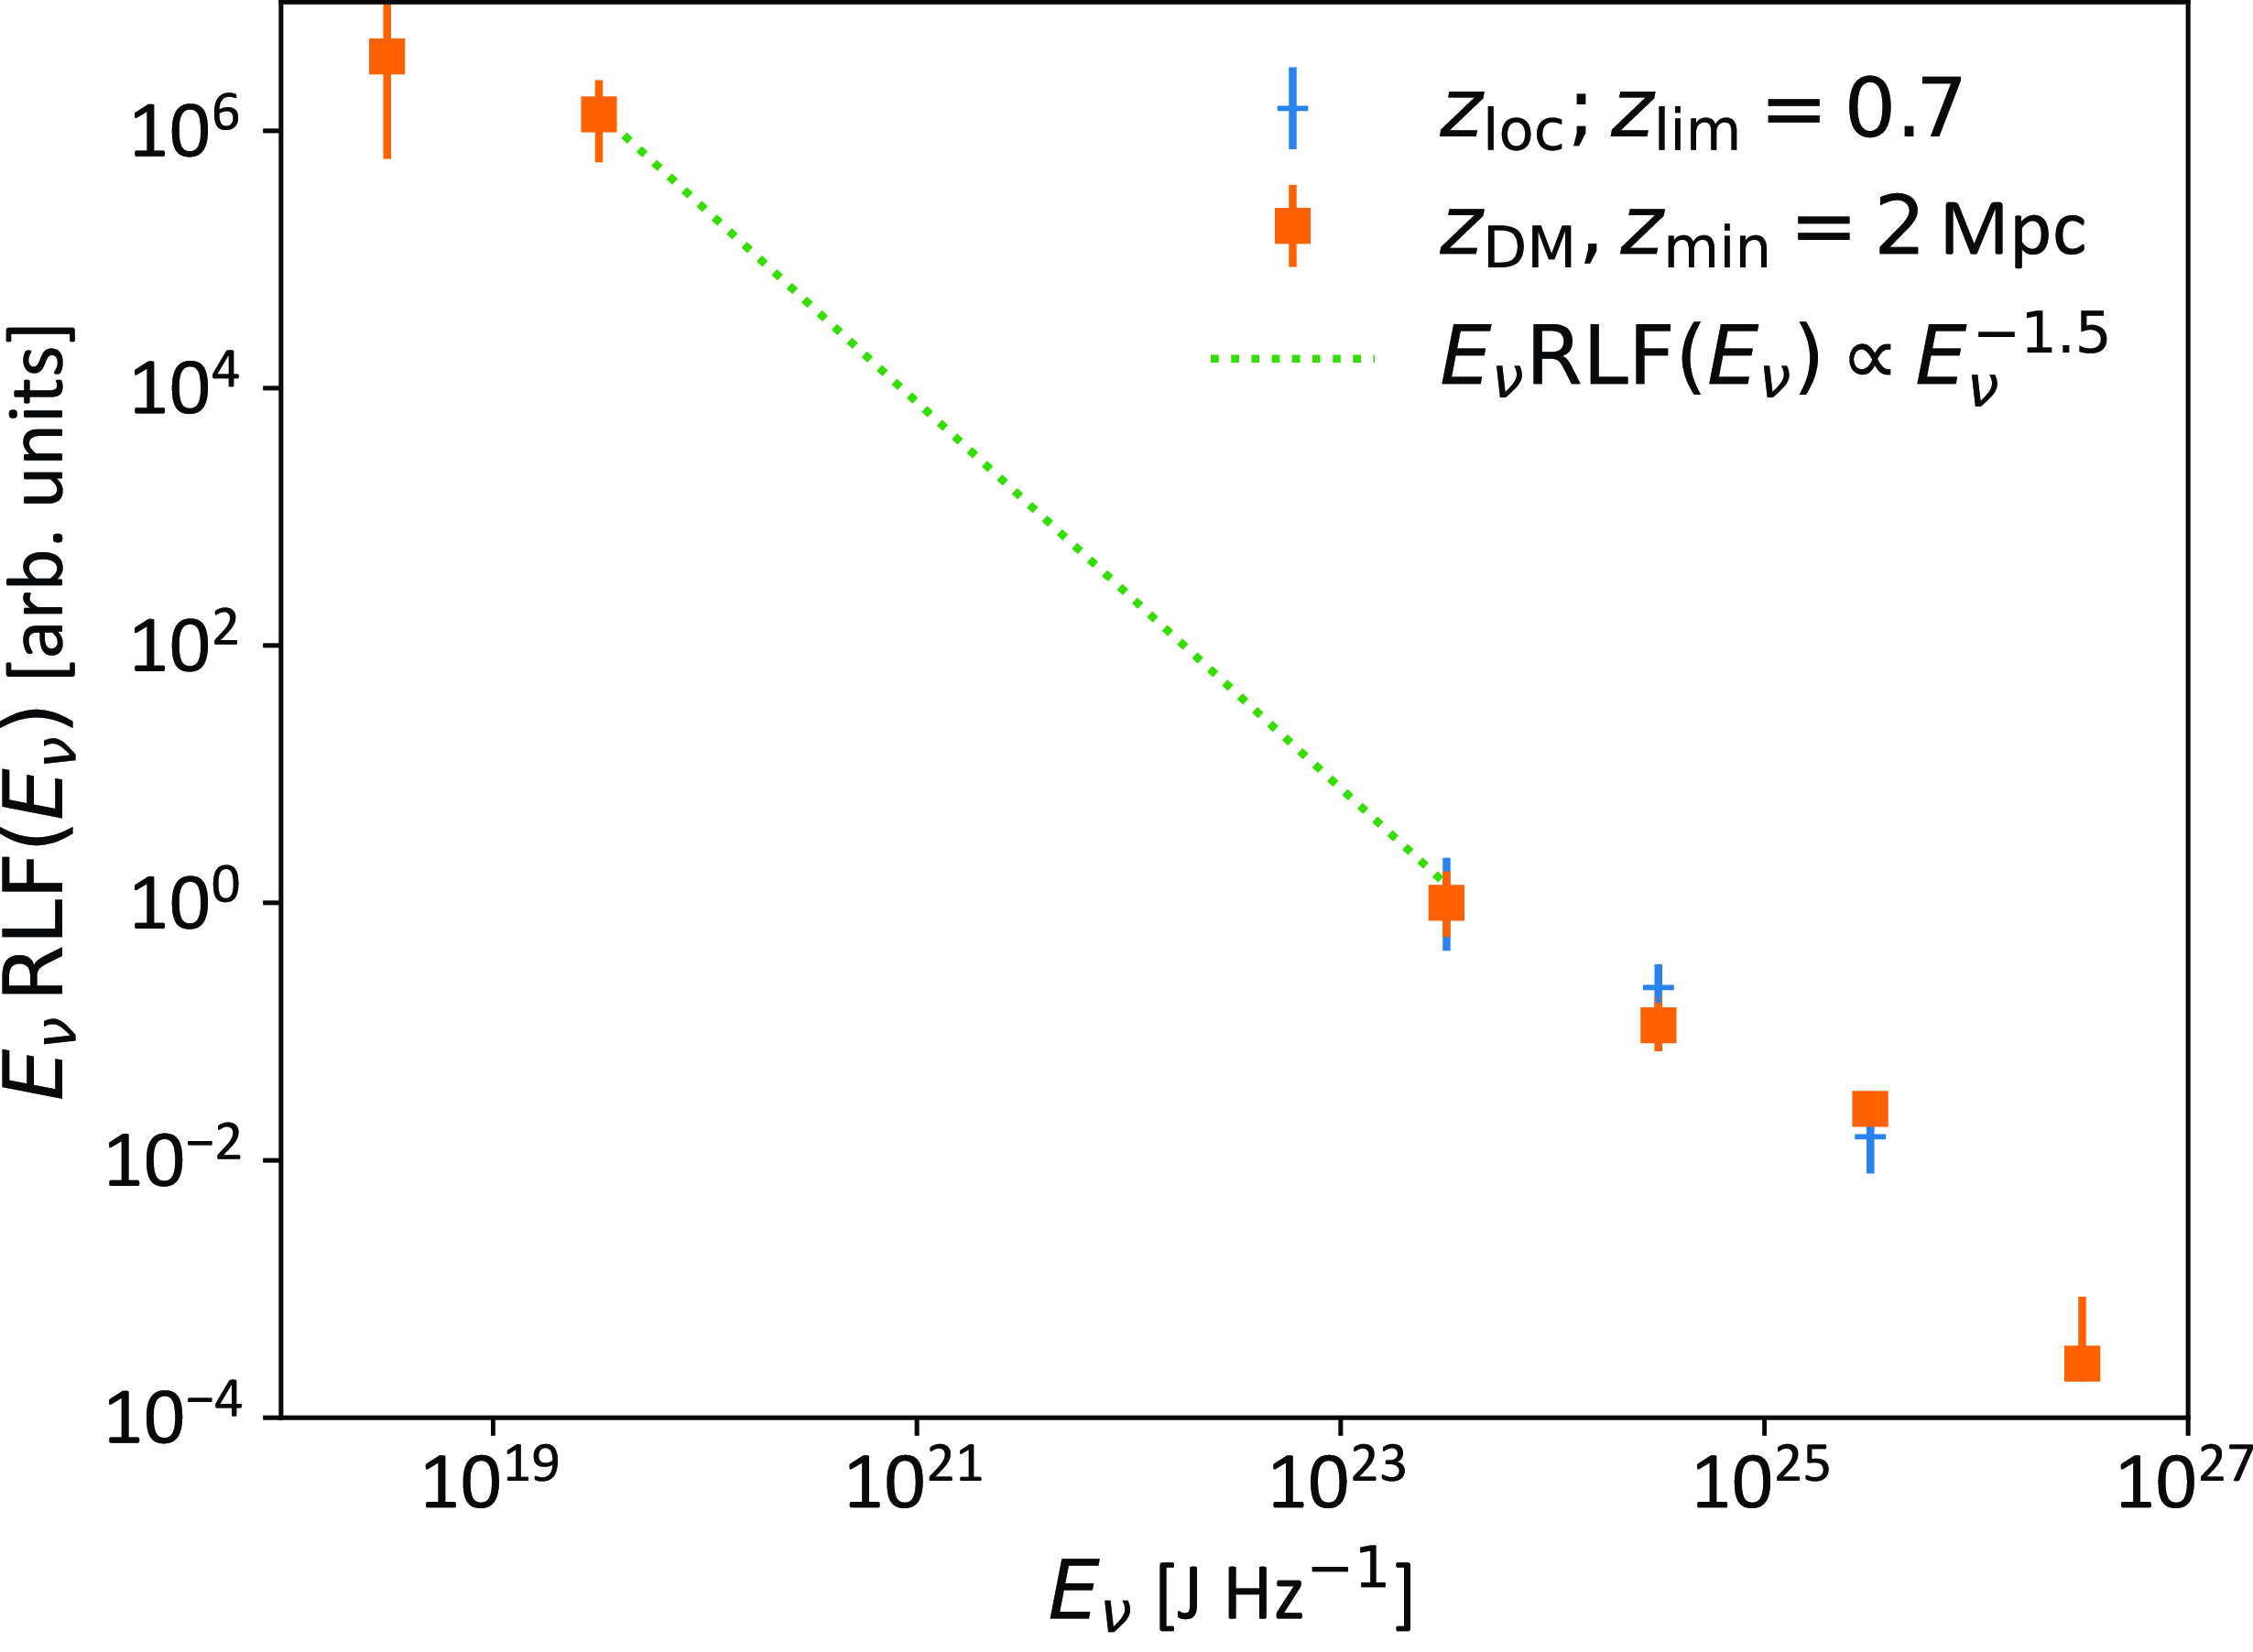
Fig. 5 shows the RLF for this updated sample of FRBs. It is only measured in the range $10^{23}$
–
$10^{23}$
– $10^{25}$
J Hz
$10^{25}$
J Hz $^{-1}$
, and in this range, is consistent with a pure power-law with slope
$^{-1}$
, and in this range, is consistent with a pure power-law with slope $\gamma = -1.96 \pm 0.15$
(p-value of linear fit 0.09); a Schechter function produces a much flatter differential slope
$\gamma = -1.96 \pm 0.15$
(p-value of linear fit 0.09); a Schechter function produces a much flatter differential slope $\gamma = -1.58$
and turn-over energy of
$\gamma = -1.58$
and turn-over energy of $E_\mathrm{max} = 1.2\,\times 10^{25}$
J Hz
$E_\mathrm{max} = 1.2\,\times 10^{25}$
J Hz $^{-1}$
(errors cannot be estimated since the number of variables equals the number of points, i.e. it is statistically ill-posed).
$^{-1}$
(errors cannot be estimated since the number of variables equals the number of points, i.e. it is statistically ill-posed).
4.4 Comparison with other results
Fits of the FRB RLF have been undertaken by several authors. While many assume a 1:1 z–DM relation, we concentrate on those which have fully modelled uncertainties in FRB redshift given DM, and/or used a sample of localised FRBs, while accounting for selection effects as per Connor (Reference Connor2019). Luo et al. (Reference Luo, Men, Lee, Wang, Lorimer and Zhang2020) uses a mixed sample of mostly unlocalised FRBs from several instruments – including Parkes and ASKAP – to fit a Schechter function with differential index $\gamma = -1.79^{+0.31}_{-0.35}$
and
$\gamma = -1.79^{+0.31}_{-0.35}$
and $E_\mathrm{max} = 2.9_{-1.7}^{+11.9} \cdot 10^{25}{{\mathrm {J\,Hz}^{-1}}}$
(assuming a 1 ms burst width and 1 GHz bandwidth). James et al. (Reference James2022) uses a sample of 16 FRBs with host redshifts, and approximately 60 without, to find an index of
$E_\mathrm{max} = 2.9_{-1.7}^{+11.9} \cdot 10^{25}{{\mathrm {J\,Hz}^{-1}}}$
(assuming a 1 ms burst width and 1 GHz bandwidth). James et al. (Reference James2022) uses a sample of 16 FRBs with host redshifts, and approximately 60 without, to find an index of $-1.95^{+0.18}_{-0.15}$
, with Ryder et al. (Reference Ryder2023) updating
$-1.95^{+0.18}_{-0.15}$
, with Ryder et al. (Reference Ryder2023) updating $E_\mathrm{max}$
to
$E_\mathrm{max}$
to $5_{-2}^{+3} \cdot 10^{25}{{\mathrm {J\,Hz}^{-1}}}$
. Shin et al. (Reference Shin2023) fits the dispersion measure of 536 FRBs observed by CHIME to find an index of
$5_{-2}^{+3} \cdot 10^{25}{{\mathrm {J\,Hz}^{-1}}}$
. Shin et al. (Reference Shin2023) fits the dispersion measure of 536 FRBs observed by CHIME to find an index of $-1.3^{+0.7}_{-0.4}$
and
$-1.3^{+0.7}_{-0.4}$
and $E_\mathrm{max} = 2.38^{+5.65}_{-1.64} \cdot 10^{25}{{\mathrm {J\,Hz}^{-1}}}$
. These results are broadly consistent with the range of RLFs derived in this work, although they would have difficulty fitting the possible low-energy excess observed in the potentially biased Localised High S/N Sample, and the fit of Shin et al. (Reference Shin2023) is flatter, and has a downturn which is stronger, than allowed by our data. We note that James et al. (Reference James2022) accounts for the biases discussed in Section 4.2 by not using the localisation of FRB 20171020A or FRBs above DM
$E_\mathrm{max} = 2.38^{+5.65}_{-1.64} \cdot 10^{25}{{\mathrm {J\,Hz}^{-1}}}$
. These results are broadly consistent with the range of RLFs derived in this work, although they would have difficulty fitting the possible low-energy excess observed in the potentially biased Localised High S/N Sample, and the fit of Shin et al. (Reference Shin2023) is flatter, and has a downturn which is stronger, than allowed by our data. We note that James et al. (Reference James2022) accounts for the biases discussed in Section 4.2 by not using the localisation of FRB 20171020A or FRBs above DM $_\mathrm{EG}$
of 1 000 pc cm
$_\mathrm{EG}$
of 1 000 pc cm $^{-3}$
, while Shin et al. (Reference Shin2023) fits FRBs at lower frequency which may have a different underlying RLF. The possible minimum energy (or downturn) at
$^{-3}$
, while Shin et al. (Reference Shin2023) fits FRBs at lower frequency which may have a different underlying RLF. The possible minimum energy (or downturn) at $23.47_{-1.28}^{0.54}$
J Hz
$23.47_{-1.28}^{0.54}$
J Hz $^{-1}$
suggested by Hoffmann et al. (Reference Hoffmann2024a) is not observed, but lies at the lower end of the RLF which we can probe. We therefore conclude that, given uncertainties in FRB spectral behaviour and source evolution, and possible biased effects in our own analysis, we cannot discriminate between these previous fits.
$^{-1}$
suggested by Hoffmann et al. (Reference Hoffmann2024a) is not observed, but lies at the lower end of the RLF which we can probe. We therefore conclude that, given uncertainties in FRB spectral behaviour and source evolution, and possible biased effects in our own analysis, we cannot discriminate between these previous fits.
4.5 Comparison with Locatelli et al. (Reference Locatelli, Ronchi, Ghirlanda and Ghisellini2019)
Locatelli et al. (Reference Locatelli, Ronchi, Ghirlanda and Ghisellini2019) also apply the $V/V_{\mathrm{max}}$
test to FRBs by comparing 23 FRBs discovered by ASKAP with 20 of the FRBs found by Parkes up to 2019. Their paper focuses on the use of the
$V/V_{\mathrm{max}}$
test to FRBs by comparing 23 FRBs discovered by ASKAP with 20 of the FRBs found by Parkes up to 2019. Their paper focuses on the use of the $V/V_{\mathrm{max}}$
distribution to explore evolution, while our paper uses the
$V/V_{\mathrm{max}}$
distribution to explore evolution, while our paper uses the $V_{\mathrm{max}}$
method to estimate the luminosity distribution. These are different uses, and analysis of
$V_{\mathrm{max}}$
method to estimate the luminosity distribution. These are different uses, and analysis of $V/V_{\mathrm{max}}$
needs complete unbiased samples which is quite problematic for FRBs as discussed in Section 4.3. They find evidence for cosmological source evolution in the ASKAP sample, with
$V/V_{\mathrm{max}}$
needs complete unbiased samples which is quite problematic for FRBs as discussed in Section 4.3. They find evidence for cosmological source evolution in the ASKAP sample, with $\langle V/V_{\mathrm{max}}\rangle$ $= 0.68 \pm 0.05$
, but less so for the Parkes data, with
$= 0.68 \pm 0.05$
, but less so for the Parkes data, with $\langle V/V_{\mathrm{max}}\rangle$ $ = 0.54 \pm 0.04$
, assuming a spectral evolution of
$ = 0.54 \pm 0.04$
, assuming a spectral evolution of $\alpha=1.6$
.
$\alpha=1.6$
.
For ASKAP, Locatelli et al. (Reference Locatelli, Ronchi, Ghirlanda and Ghisellini2019) only analyse the ICS sample, which was all that was available at the time. They also include the Parkes FRB sample; however, for these FRBs the location in the beam is not known, so neither $V_{\mathrm{max}}$
nor the actual beam-corrected fluences are known; we therefore excluded the Parkes FRB sample in our analysis. This difficulty will also apply to the much larger CHIME sample. The authors also omit discussion of beam areas for Parkes and ASKAP.
$V_{\mathrm{max}}$
nor the actual beam-corrected fluences are known; we therefore excluded the Parkes FRB sample in our analysis. This difficulty will also apply to the much larger CHIME sample. The authors also omit discussion of beam areas for Parkes and ASKAP.
As discussed in Section 4.2, Locatelli et al. (Reference Locatelli, Ronchi, Ghirlanda and Ghisellini2019) builds appropriate probability functions to estimate the redshift PDF(z) instead of using a unique value. This treatment is an elegant way to avoid the bias due to negative apparent redshifts encountered when only the mean DM correction is used. We note that the zDM code is able to produce such PDFs, for example, as per Lee-Waddell et al. (Reference Lee-Waddell2023).
Our results for $\langle V/V_{\mathrm{max}}\rangle$
for the Localised High S/N Sample and Full Sample are 0.58 and 0.63, respectively (0.61 and 0.62 when debiased); when we include a spectral dependence of
$\langle V/V_{\mathrm{max}}\rangle$
for the Localised High S/N Sample and Full Sample are 0.58 and 0.63, respectively (0.61 and 0.62 when debiased); when we include a spectral dependence of $\alpha=-1.5$
(see Appendix A), we find
$\alpha=-1.5$
(see Appendix A), we find $\langle V/V_{\mathrm{max}}\rangle$ $=0.67$
for the Full Sample, consistent with the result of Locatelli et al. (Reference Locatelli, Ronchi, Ghirlanda and Ghisellini2019).
$=0.67$
for the Full Sample, consistent with the result of Locatelli et al. (Reference Locatelli, Ronchi, Ghirlanda and Ghisellini2019).
5. Conclusions
We have shown how to apply the $V/V_{\mathrm{max}}$
method of Schmidt (Reference Schmidt1968) to a population of transient sources and applied this to FRBs. We find that the current sample of FRBs detected by ASKAP/CRAFT is insufficient to distinguish between competing evolutionary and spectral models, with the greatest departure from uniformity in the
$V/V_{\mathrm{max}}$
method of Schmidt (Reference Schmidt1968) to a population of transient sources and applied this to FRBs. We find that the current sample of FRBs detected by ASKAP/CRAFT is insufficient to distinguish between competing evolutionary and spectral models, with the greatest departure from uniformity in the $V/V_{\mathrm{max}}$
distribution being due to a dearth of very high S/N FRBs.
$V/V_{\mathrm{max}}$
distribution being due to a dearth of very high S/N FRBs.
Using both FRBs with known redshift, $z_\mathrm{loc}$
, and a larger sample of FRBs with
$z_\mathrm{loc}$
, and a larger sample of FRBs with $z_\mathrm{DM}$
estimated from the Macquart relation, we plot the FRB energy distribution in the range
$z_\mathrm{DM}$
estimated from the Macquart relation, we plot the FRB energy distribution in the range $10^{23}$
–
$10^{23}$
– $10^{26}$
J Hz
$10^{26}$
J Hz $^{-1}$
. We find it to be fairly consistent (
$^{-1}$
. We find it to be fairly consistent ( $p=0.09$
) with a power-law with differential slope
$p=0.09$
) with a power-law with differential slope $\gamma=-1.96 \pm 0.15$
using
$\gamma=-1.96 \pm 0.15$
using $z_\mathrm{loc}$
. Above this energy, we find some evidence of a downturn consistent with a Schechter function with
$z_\mathrm{loc}$
. Above this energy, we find some evidence of a downturn consistent with a Schechter function with $E_\mathrm{max} = 6.3 \, \times 10^{25}$
when using
$E_\mathrm{max} = 6.3 \, \times 10^{25}$
when using $z_\mathrm{DM}$
. We have also identified several systematic effects in the analysis and shown how to take these into account. In particular, the difficulty of identifying high-z host galaxies limits our knowledge of the tip of the FRB energy distribution, as it is unclear if the downturn in the energy distribution seen in the
$z_\mathrm{DM}$
. We have also identified several systematic effects in the analysis and shown how to take these into account. In particular, the difficulty of identifying high-z host galaxies limits our knowledge of the tip of the FRB energy distribution, as it is unclear if the downturn in the energy distribution seen in the $z_\mathrm{DM}$
result is physical, or an artefact of smearing in the Macquart relation.
$z_\mathrm{DM}$
result is physical, or an artefact of smearing in the Macquart relation.
In the near future, FRB surveys will detect too many bursts to follow up their host galaxies individually with 8 m-class telescope time (e.g. CHORD; Vanderlinde et al. Reference Vanderlinde2019). Low-DM, near-Universe host galaxies can likely be identified in existing or impending (e.g. LSST) optical surveys without further follow-up, allowing an unbiased sample of the $E_\nu \lt 10^{23}$
J Hz
$E_\nu \lt 10^{23}$
J Hz $^{-1}$
region to be formed. Moreover, we find that the use of
$^{-1}$
region to be formed. Moreover, we find that the use of $z_\mathrm{DM}$
compared to
$z_\mathrm{DM}$
compared to $z_\mathrm{loc}$
does not significantly affect the luminosity function in the range
$z_\mathrm{loc}$
does not significantly affect the luminosity function in the range $10^{23}$
–
$10^{23}$
– $10^{26}$
J Hz
$10^{26}$
J Hz $^{-1}$
. We therefore recommend that optical follow-up time be focused on identifying high-DM/
$^{-1}$
. We therefore recommend that optical follow-up time be focused on identifying high-DM/ $z_\mathrm{loc}$
FRBs, to allow the high-end of the FRB luminosity function to be studied.
$z_\mathrm{loc}$
FRBs, to allow the high-end of the FRB luminosity function to be studied.
Acknowledgement
This scientific work uses data obtained from Inyarrimanha Ilgari Bundara/the Murchison Radio-astronomy Observatory. We acknowledge the Wajarri Yamaji People as the Traditional Owners and native title holders of the Observatory site. CSIRO’s ASKAP radio telescope is part of the Australia Telescope National Facility (https://ror.org/05qajvd42). Operation of ASKAP is funded by the Australian Government with support from the National Collaborative Research Infrastructure Strategy. ASKAP uses the resources of the Pawsey Supercomputing Research Centre. Establishment of ASKAP, Inyarrimanha Ilgari Bundara, the CSIRO Murchison Radio-astronomy Observatory and the Pawsey Supercomputing Research Centre are initiatives of the Australian Government, with support from the Government of Western Australia and the Science and Industry Endowment Fund.
Funding statement
W.A. acknowledges the contribution of an Australian Government Research Training Program Scholarship in support of this research. C.W.J. and M.G. acknowledge support by the Australian Government through the Australian Research Council’s Discovery Projects funding scheme (project DP 210102103). A.T.D. and R.M.S. acknowledge support through ARC Discovery Project DP 220102305. R.M.S. acknowledges support through ARC Discovery Project DP 220102305. This research was supported by the Australian Research Council Centre of Excellence for All Sky Astrophysics in 3 Dimensions (ASTRO 3D) through project no. CE 170100013. A.C.G. and the Fong Group at Northwestern acknowledges support by the National Science Foundation under grant Nos. AST-1909358, AST-2308182 and CAREER grant No. AST-2047919. A.C.G. acknowledges support from NSF grants AST-1911140, AST-1910471 and AST-2206490 as a member of the Fast and Fortunate for FRB Follow-up team.
Competing interests
None.
Data availability statement
Data underlying this article are available within this article. Code to generate $V/V_{\mathrm{max}}$
and luminosity functions is contained in the FRB repository (James, Prochaska, & Ghosh Reference James, Prochaska and Ghosh2021b). Digitised versions of the figures are available upon reasonable request to the authors.
$V/V_{\mathrm{max}}$
and luminosity functions is contained in the FRB repository (James, Prochaska, & Ghosh Reference James, Prochaska and Ghosh2021b). Digitised versions of the figures are available upon reasonable request to the authors.
Appendix A. Investigation of Spectral Dependence and Source Evolution
For simplicity, in the main body of this work, we treated the case of no spectral dependence and no cosmological source evolution. Here, we show that with current data, the $V/V_{\mathrm{max}}$
test cannot determine whether either effect is present, and show the resulting systematic effects on the luminosity function.
$V/V_{\mathrm{max}}$
test cannot determine whether either effect is present, and show the resulting systematic effects on the luminosity function.
Calculated values of $\langle V/V_\mathrm{max} \rangle$
, considering two values of the spectral index
$\langle V/V_\mathrm{max} \rangle$
, considering two values of the spectral index $\alpha = \left\{0,-1.5\right\}$
, for both the Localised High S/N Sample (using
$\alpha = \left\{0,-1.5\right\}$
, for both the Localised High S/N Sample (using $z_\mathrm{loc}$
) and the Full Sample (using
$z_\mathrm{loc}$
) and the Full Sample (using $z_\mathrm{ DM}$
), as a function of the star formation rate scaling parameter
$z_\mathrm{ DM}$
), as a function of the star formation rate scaling parameter $n_\mathrm{SFR}$
.
$n_\mathrm{SFR}$
.
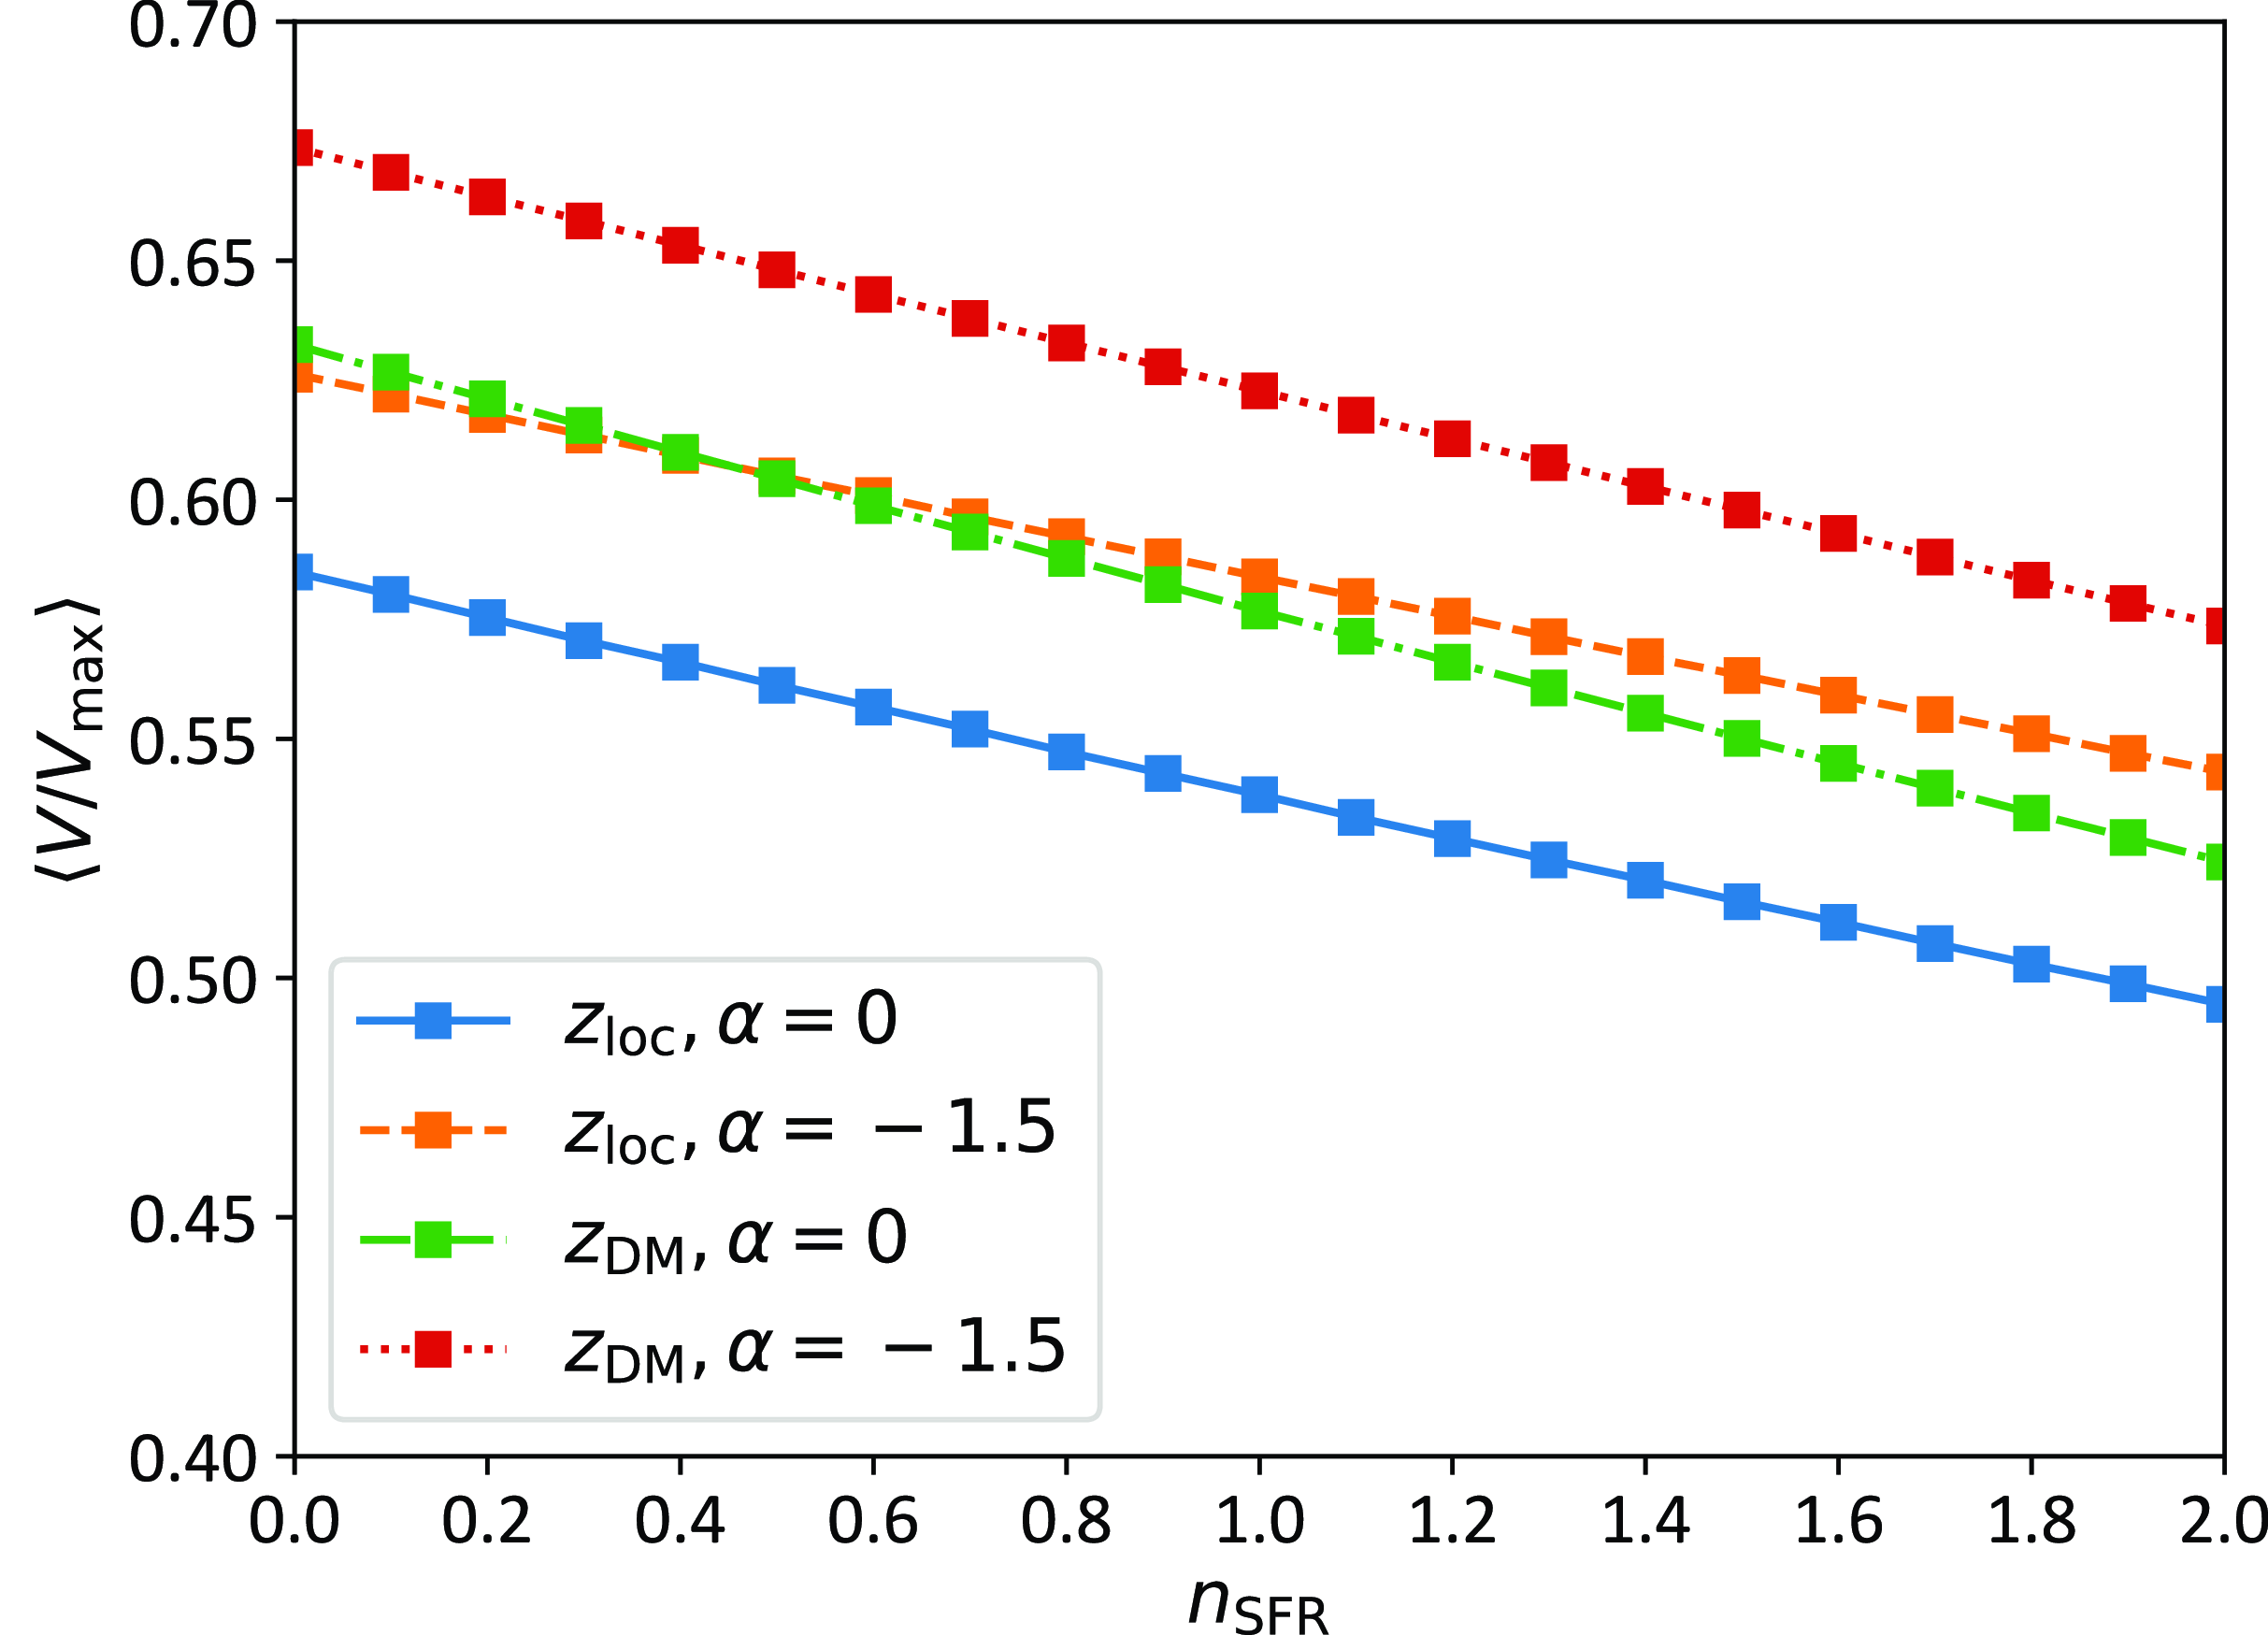
P-values resulting from the KS-test for uniformity in $V/V_\mathrm{max}$
, considering two values of the spectral index
$V/V_\mathrm{max}$
, considering two values of the spectral index $\alpha = \left\{0,-1.5\right\}$
, for both the Localised High S/N Sample (using
$\alpha = \left\{0,-1.5\right\}$
, for both the Localised High S/N Sample (using $z_\mathrm{loc}$
) and the Full Sample (using
$z_\mathrm{loc}$
) and the Full Sample (using $z_\mathrm{DM}$
), as a function of the star formation rate scaling parameter
$z_\mathrm{DM}$
), as a function of the star formation rate scaling parameter $n_\mathrm{SFR}$
.
$n_\mathrm{SFR}$
.
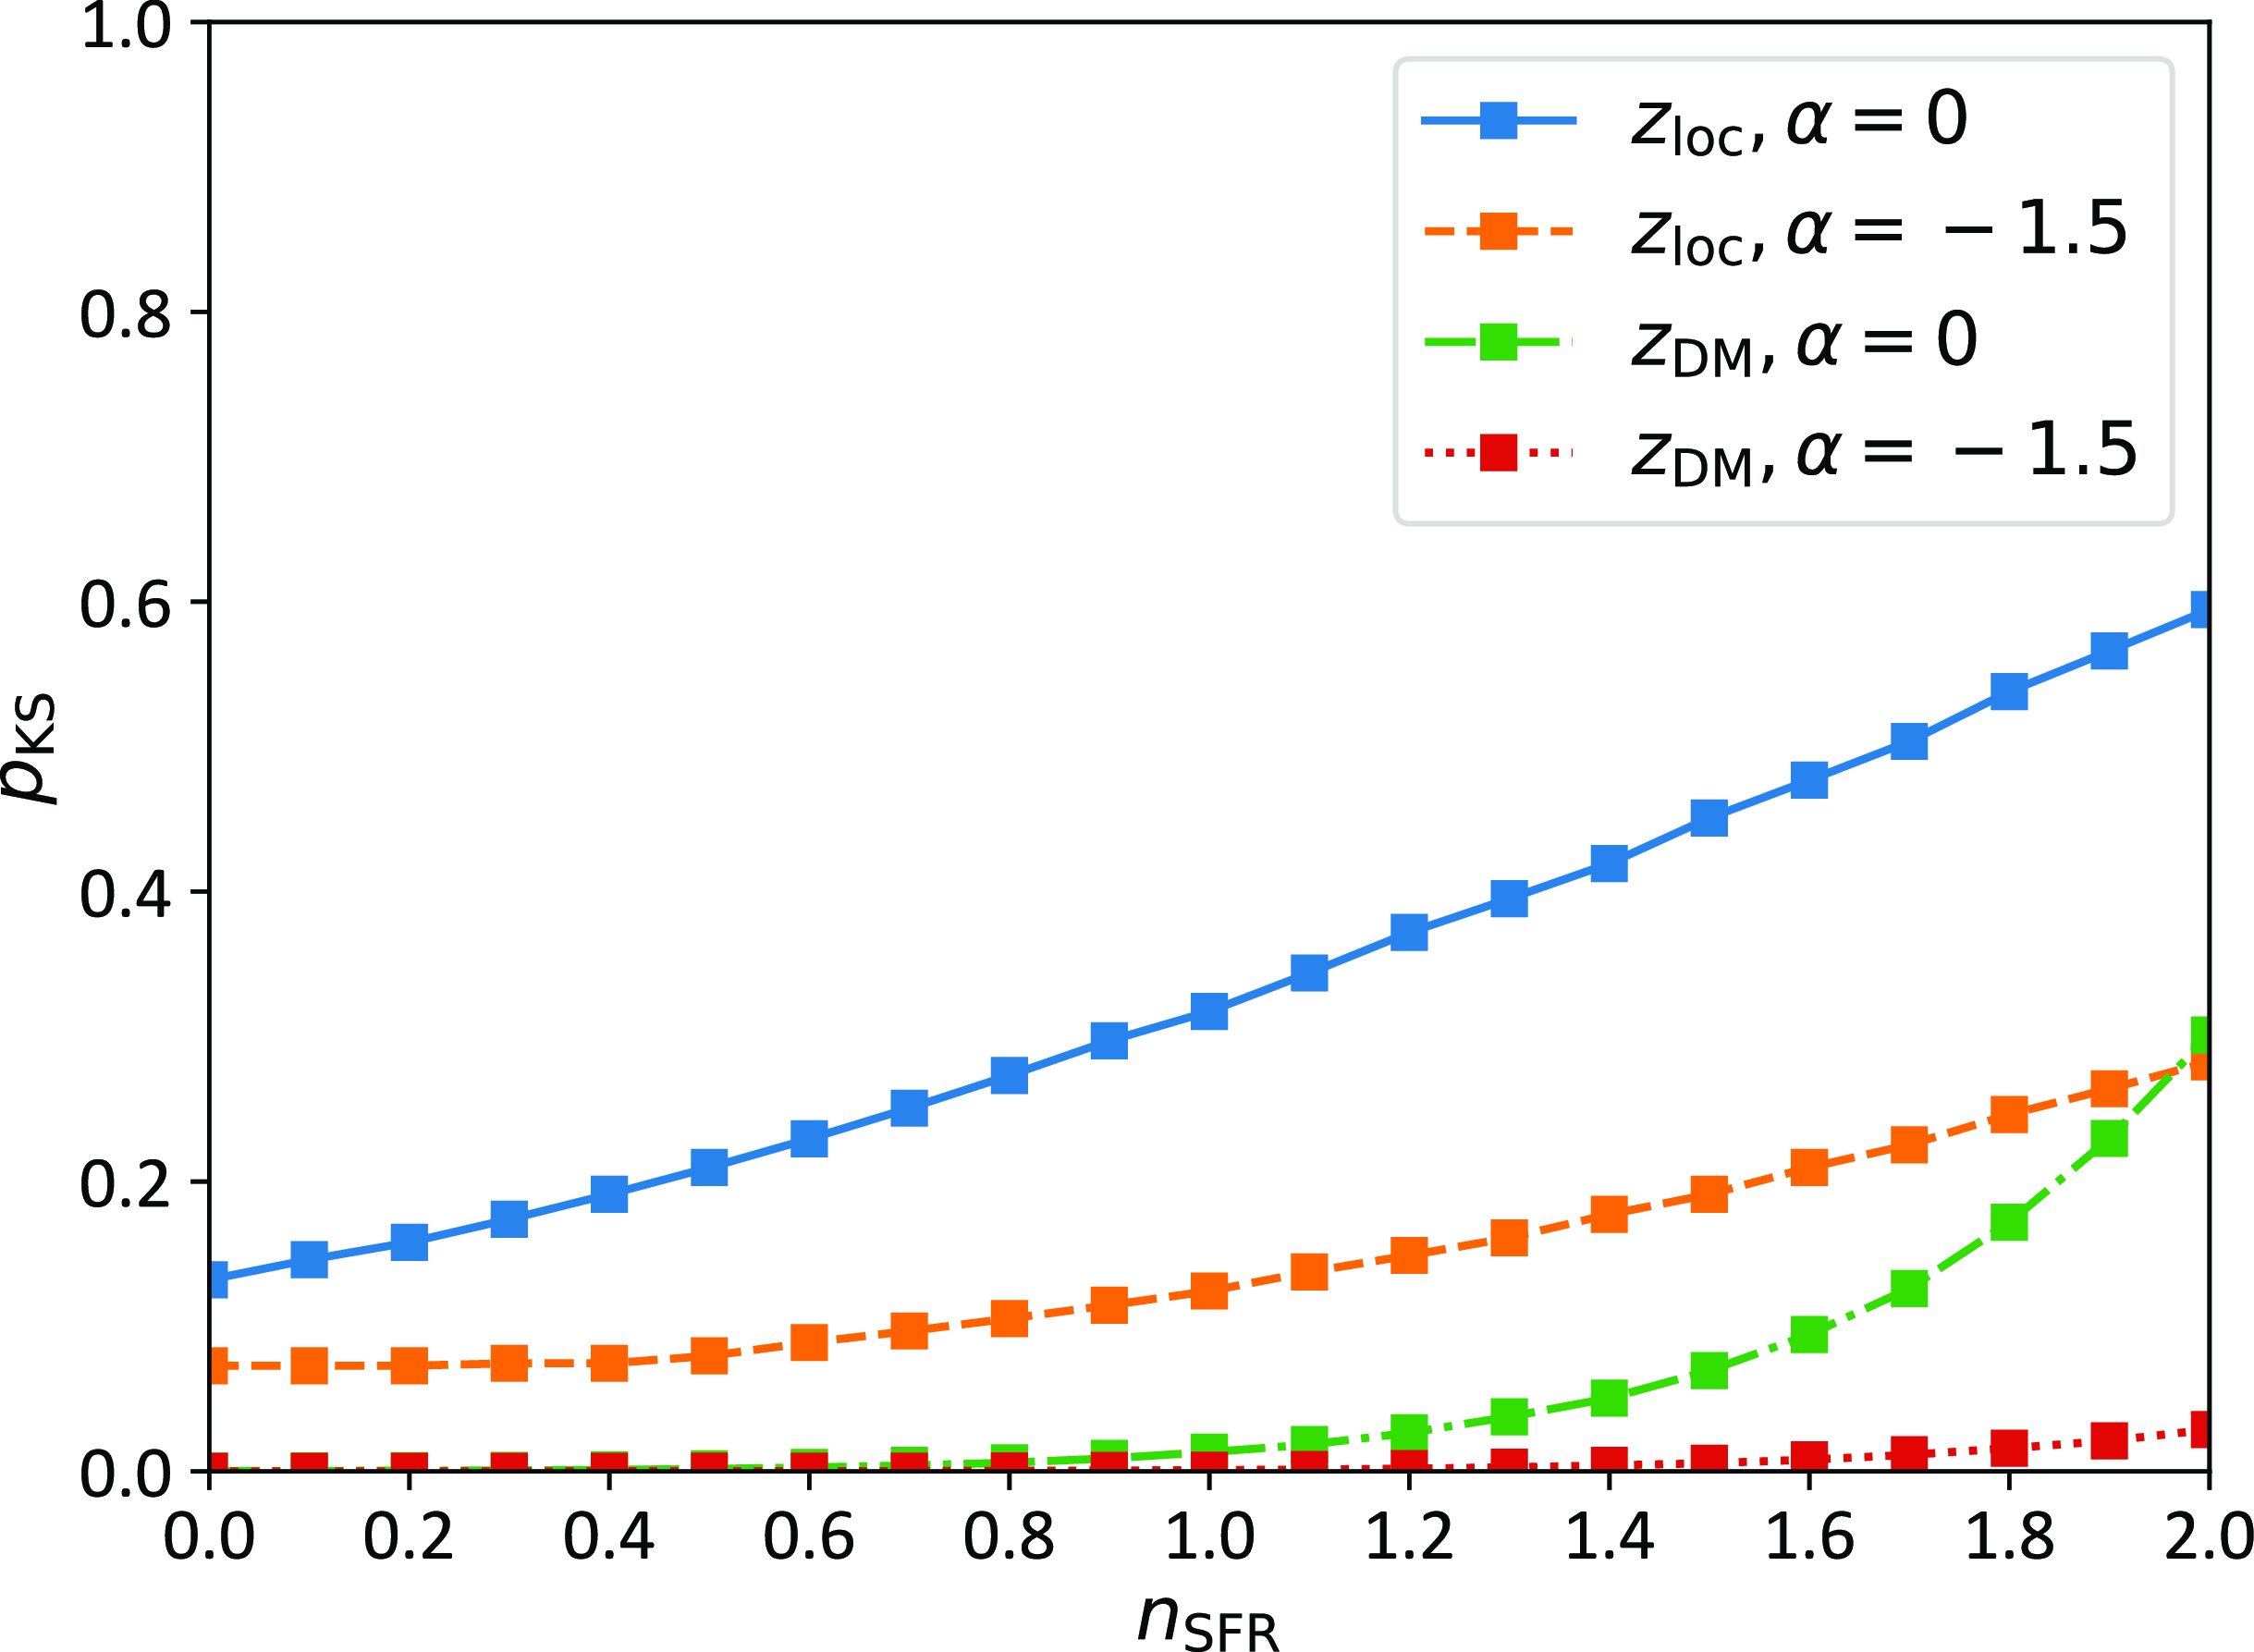
The spectral dependence of FRBs is still uncertain. Macquart et al. (Reference Macquart, Shannon, Bannister, James, Ekers and Bunton2019) used ASKAP FRBs to determine a spectral dependence of $F_\nu \propto \nu^\alpha$
, with
$F_\nu \propto \nu^\alpha$
, with $\alpha = -1.5_{-0.3}^{+0.2}$
, though as noted by James et al. (Reference James, Prochaska, Macquart, North-Hickey, Bannister and Dunning2021a), selection biases due to FRBs being narrow-band might imply the true dependence is
$\alpha = -1.5_{-0.3}^{+0.2}$
, though as noted by James et al. (Reference James, Prochaska, Macquart, North-Hickey, Bannister and Dunning2021a), selection biases due to FRBs being narrow-band might imply the true dependence is $\alpha = -0.65$
. The apparent rate of FRBs measured by CHIME appears to be frequency-independent; however as noted by the authors, this does not account for selection biases (CHIME/FRB Collaboration: Amiri et al. 2021). Population modelling by James et al. (Reference James2022) and Shin et al. (Reference Shin2023) find some evidence for increased spectral strength at lower frequencies, however constraints are very weak, as are those from studies of the frequency-dependent detection rate measured by ASKAP. We therefore consider both
$\alpha = -0.65$
. The apparent rate of FRBs measured by CHIME appears to be frequency-independent; however as noted by the authors, this does not account for selection biases (CHIME/FRB Collaboration: Amiri et al. 2021). Population modelling by James et al. (Reference James2022) and Shin et al. (Reference Shin2023) find some evidence for increased spectral strength at lower frequencies, however constraints are very weak, as are those from studies of the frequency-dependent detection rate measured by ASKAP. We therefore consider both $\alpha = 0$
and
$\alpha = 0$
and $\alpha = -1.5$
in this investigation.
$\alpha = -1.5$
in this investigation.
The source evolution function, $\psi$
, weights the physical volume, V, to produce an effective volume,
$\psi$
, weights the physical volume, V, to produce an effective volume, $V^\prime$
. If the source density in the Universe varies with redshift, then only the distribution of
$V^\prime$
. If the source density in the Universe varies with redshift, then only the distribution of $V^\prime/V_\mathrm{max}{\prime}$
will be uniform between 0 and 1. The source evolution function
$V^\prime/V_\mathrm{max}{\prime}$
will be uniform between 0 and 1. The source evolution function $\psi(z)$
is inserted into the integrals over redshift, viz., equations (11) and (12) to calculate
$\psi(z)$
is inserted into the integrals over redshift, viz., equations (11) and (12) to calculate $V_\mathrm{max}^\prime$
and
$V_\mathrm{max}^\prime$
and $V^\prime$
, respectively. Since
$V^\prime$
, respectively. Since $V^\prime = V$
only in the case that the FRB population does not cosmologically evolve – a situation which we do not deem likely – we henceforth drop the
$V^\prime = V$
only in the case that the FRB population does not cosmologically evolve – a situation which we do not deem likely – we henceforth drop the ${}^\prime$
notation so that both V and
${}^\prime$
notation so that both V and $V_\mathrm{max}$
are implicitly understood to be weighted by
$V_\mathrm{max}$
are implicitly understood to be weighted by $\psi(z)$
.
$\psi(z)$
.
We consider source evolution by scaling V to some power of the star formation rate as parameterised by Madau & Dickinson (Reference Madau and Dickinson2014), A
 \begin{eqnarray}\mathrm{SFR}(z) & \propto & \frac{(1+z)^{2.7}}{1 + \left(\frac{1+z}{2.9}\right)^{5.6}}, \end{eqnarray}
 \begin{eqnarray} \psi(z) & = & \left( \mathrm{SFR}(z)\right)^{n_\mathrm{SFR}}.\end{eqnarray}
Given that the majority of this sample represents the $z \lt 0.5$
Universe, where the denominator of equation (A1) changes by at most 2.5%, this scaling is almost equivalent to a scaling of
$z \lt 0.5$
Universe, where the denominator of equation (A1) changes by at most 2.5%, this scaling is almost equivalent to a scaling of $\psi(z) = (1+z)^{2.7 n_\mathrm{SFR}}$
. A
$\psi(z) = (1+z)^{2.7 n_\mathrm{SFR}}$
. A
Fig. A1 plots the $\langle V/V_{\mathrm{max}}\rangle$
values for both the Localised High S/N Sample and Full Sample along with their 95% confidence intervals, determined using the bootstrap method described in Appendix C. To check for population uniformity, we further conduct a Kolmogorov-Smirnoff (K-S)-test with respect to a uniform distribution for both samples. The resulting p-values are shown in Fig. A2.
$\langle V/V_{\mathrm{max}}\rangle$
values for both the Localised High S/N Sample and Full Sample along with their 95% confidence intervals, determined using the bootstrap method described in Appendix C. To check for population uniformity, we further conduct a Kolmogorov-Smirnoff (K-S)-test with respect to a uniform distribution for both samples. The resulting p-values are shown in Fig. A2.
A.1 Uniformity of
$\textbf{\textit{V/V}}_{\mathbf{max}}$

Varying both $\alpha$
and
$\alpha$
and $n_\mathrm{SFR}$
produces our results on the uniformity of
$n_\mathrm{SFR}$
produces our results on the uniformity of $V/V_\mathrm{max}$
shown in Figs. A1–A3. Requiring only that
$V/V_\mathrm{max}$
shown in Figs. A1–A3. Requiring only that $\langle V / V_\mathrm{max} \rangle = 0.5$
favours a strongly evolving FRB population, with
$\langle V / V_\mathrm{max} \rangle = 0.5$
favours a strongly evolving FRB population, with $n_\mathrm{SFR}=1.7$
for
$n_\mathrm{SFR}=1.7$
for $\alpha=0$
, and
$\alpha=0$
, and $n_\mathrm{SFR} \gt 2$
for
$n_\mathrm{SFR} \gt 2$
for $\alpha=-1.5$
. Both the Localised High S/N Sample and Full Sample yield almost identical values of
$\alpha=-1.5$
. Both the Localised High S/N Sample and Full Sample yield almost identical values of $\langle V / V_\mathrm{max} \rangle$
. The p-values of the KS-statistics shown in Fig. A2 confirm this, however at the
$\langle V / V_\mathrm{max} \rangle$
. The p-values of the KS-statistics shown in Fig. A2 confirm this, however at the $2 \sigma$
level (p <
$2 \sigma$
level (p < $0.05$
), no value of
$0.05$
), no value of $n_\mathrm{SFR}$
is excluded for the Localised High S/N Sample, while the Full Sample shows stronger evidence against uniformity for low
$n_\mathrm{SFR}$
is excluded for the Localised High S/N Sample, while the Full Sample shows stronger evidence against uniformity for low $n_\mathrm{SFR}$
.
$n_\mathrm{SFR}$
.
The driver of these results, as shown in Fig. A3, is the lack of events with very low $V/V_{\mathrm{max}}$
– equivalently, a lack of very high S/N events. Indeed, none of the cumulative
$V/V_{\mathrm{max}}$
– equivalently, a lack of very high S/N events. Indeed, none of the cumulative $V/V_{\mathrm{max}}$
distributions give a very good fit to uniformity. We have considered in Shannon et al. (in preparation) whether or not this effect could be due to instrumental bias, and concluded that high S/N events would still be detectable in adjacent beams even if a primary beam was saturated. We therefore conclude that the lack of low
$V/V_{\mathrm{max}}$
distributions give a very good fit to uniformity. We have considered in Shannon et al. (in preparation) whether or not this effect could be due to instrumental bias, and concluded that high S/N events would still be detectable in adjacent beams even if a primary beam was saturated. We therefore conclude that the lack of low $V/V_\mathrm{max}$
events is probably a statistical under-fluctuation, and that uniformity in
$V/V_\mathrm{max}$
events is probably a statistical under-fluctuation, and that uniformity in $\langle V/V_{\mathrm{max}}\rangle$
does not currently discriminate between different values of
$\langle V/V_{\mathrm{max}}\rangle$
does not currently discriminate between different values of $n_\mathrm{SFR}$
and
$n_\mathrm{SFR}$
and $\alpha$
. Fig. A3 also illustrates the degeneracy between
$\alpha$
. Fig. A3 also illustrates the degeneracy between $n_\mathrm{SFR}$
and
$n_\mathrm{SFR}$
and $\alpha$
: a steeper spectral index, and hence k-correction, allows for a more strongly evolving source population, as noted by James et al. (Reference James, Prochaska, Macquart, North-Hickey, Bannister and Dunning2021a).
$\alpha$
: a steeper spectral index, and hence k-correction, allows for a more strongly evolving source population, as noted by James et al. (Reference James, Prochaska, Macquart, North-Hickey, Bannister and Dunning2021a).
Cumulative histograms of $V/V_\mathrm{max}$
for six combinations of
$V/V_\mathrm{max}$
for six combinations of $\alpha$
and
$\alpha$
and $n_\mathrm{SFR}$
for the Localised High S/N Sample, compared to the expectation (black dotted line). Note that the
$n_\mathrm{SFR}$
for the Localised High S/N Sample, compared to the expectation (black dotted line). Note that the $n_\mathrm{SFR} = 0, \alpha = 0$
and
$n_\mathrm{SFR} = 0, \alpha = 0$
and $n_\mathrm{SFR} = 1, \alpha = -1.5$
plots almost overlap, as do the
$n_\mathrm{SFR} = 1, \alpha = -1.5$
plots almost overlap, as do the $n_\mathrm{SFR} = 1, \alpha = 0$
and
$n_\mathrm{SFR} = 1, \alpha = 0$
and $n_\mathrm{SFR} = 2, \alpha = -1.5$
plots.
$n_\mathrm{SFR} = 2, \alpha = -1.5$
plots.

Our inability to distinguish between plausible values of $\alpha$
and
$\alpha$
and $n_\mathrm{SFR}$
results in a difference in the behaviour of the luminosity functions at high energies, as shown in Fig. A4. No spectral evolution (
$n_\mathrm{SFR}$
results in a difference in the behaviour of the luminosity functions at high energies, as shown in Fig. A4. No spectral evolution ( $\alpha=0$
) predicts distributions consistent with a pure power-law, while
$\alpha=0$
) predicts distributions consistent with a pure power-law, while $\alpha=-1.5$
produces a high-energy downturn consistent with the Schechter function. The effect of increasing
$\alpha=-1.5$
produces a high-energy downturn consistent with the Schechter function. The effect of increasing $n_\mathrm{SFR}$
is primarily to produce a stronger downturn (lower
$n_\mathrm{SFR}$
is primarily to produce a stronger downturn (lower $E_\mathrm{max}$
), though this is only evident for
$E_\mathrm{max}$
), though this is only evident for $\alpha = -1.5$
.
$\alpha = -1.5$
.
Radio luminosity functions (RLFs) calculated from the Localised High S/N Sample (using $z_\mathrm{loc}$
) for combinations of
$z_\mathrm{loc}$
) for combinations of $\alpha = \left\{0,-1.5\right\}$
and
$\alpha = \left\{0,-1.5\right\}$
and $n_\mathrm{SFR} = \left\{0,2\right\}$
, and from the Full Sample (using
$n_\mathrm{SFR} = \left\{0,2\right\}$
, and from the Full Sample (using $z_\mathrm{DM}$
) for
$z_\mathrm{DM}$
) for $\alpha=0,n_\mathrm{SFR}=0$
. The (arbitrary) normalisation is fixed to unity at the
$\alpha=0,n_\mathrm{SFR}=0$
. The (arbitrary) normalisation is fixed to unity at the $10^{23}$
–
$10^{23}$
– $10^{24}$
bin. The best-fit Schechter functions for each sample are depicted for reference purposes.
$10^{24}$
bin. The best-fit Schechter functions for each sample are depicted for reference purposes.
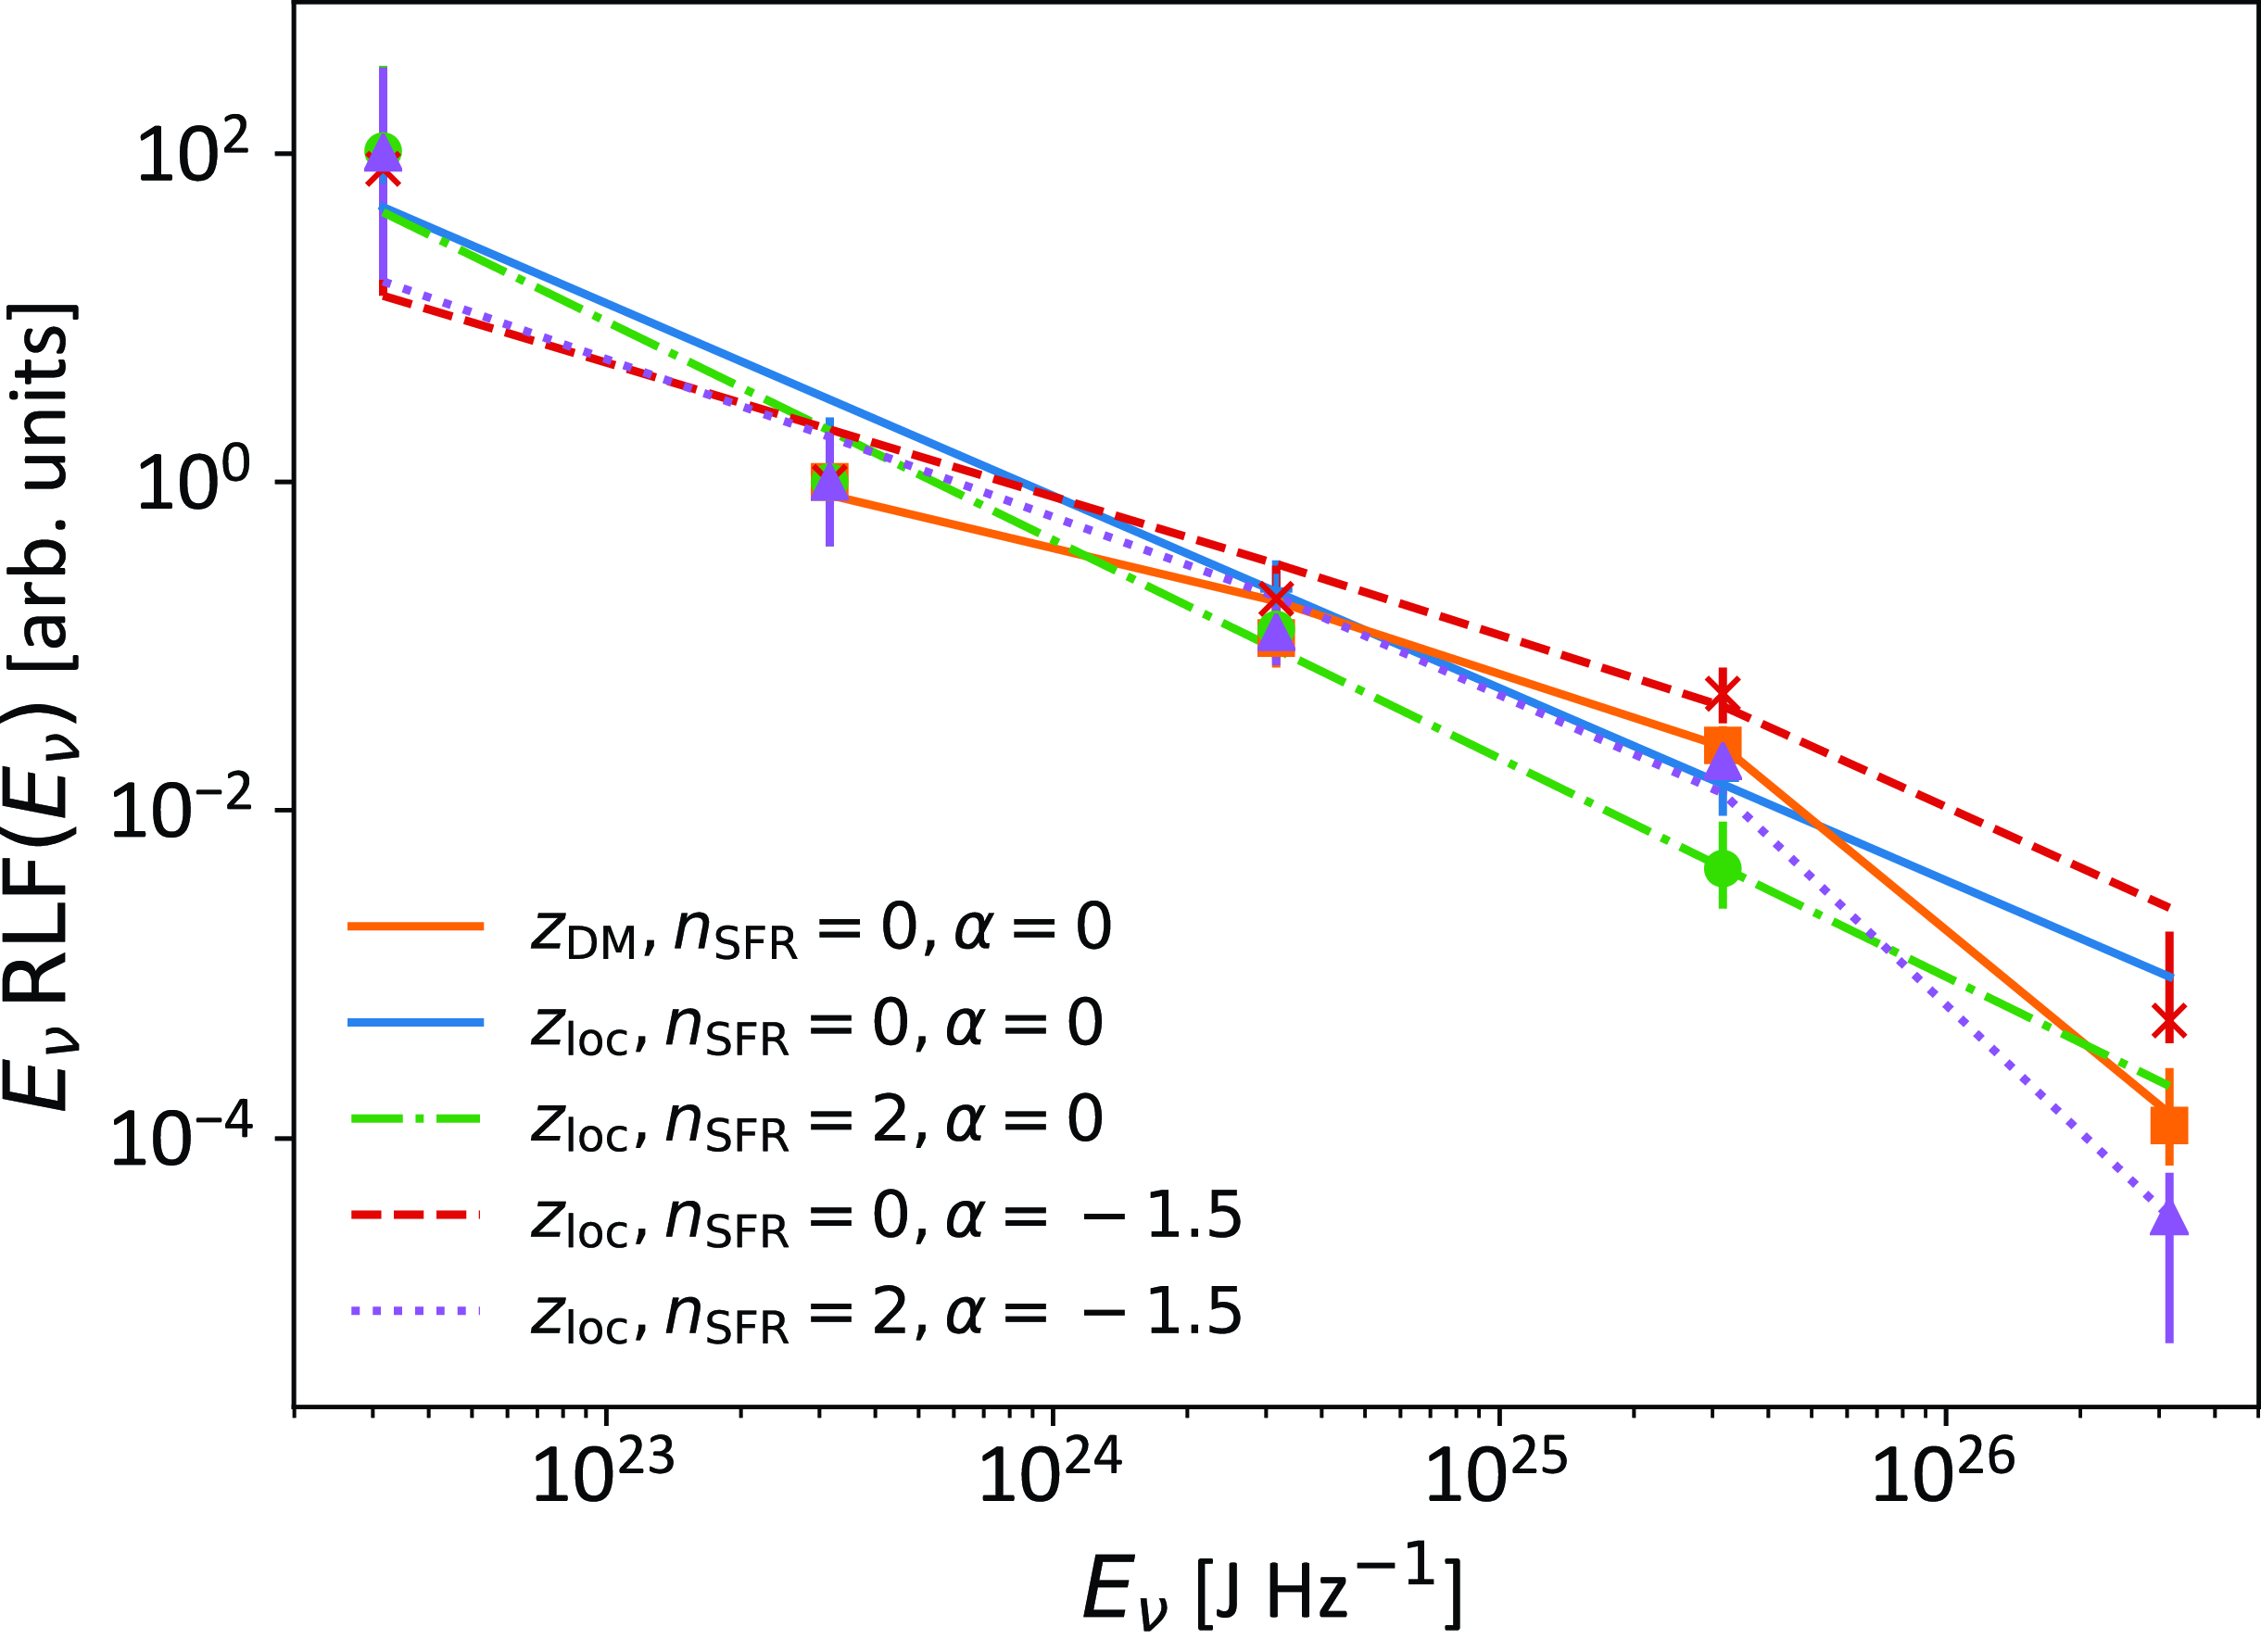
The uncertainty in the luminosity function, due to our inability to determine the population evolution or the spectral dependence with $V/V_{\mathrm{max}}$
, is comparable to the systematic errors identified in the Full Sample and Localised High S/N Sample discussed in Section 4.2. However, this method could be used to constrain these parameters in a future analysis.
$V/V_{\mathrm{max}}$
, is comparable to the systematic errors identified in the Full Sample and Localised High S/N Sample discussed in Section 4.2. However, this method could be used to constrain these parameters in a future analysis.
Appendix B. Using
$\boldsymbol{{V/V}}_{\mathbf{max}}$
with Non-uniform Sensitivity

The original formulation of the $V/V_{\mathrm{max}}$
-test by Schmidt (Reference Schmidt1968) was provided in the context of optical and radio quasar surveys with well-defined luminosity thresholds,
$V/V_{\mathrm{max}}$
-test by Schmidt (Reference Schmidt1968) was provided in the context of optical and radio quasar surveys with well-defined luminosity thresholds, $S_{\mathrm{cutoff}}$
, and survey areas,
$S_{\mathrm{cutoff}}$
, and survey areas, $\Omega$
. This allowed for conceptually easy definitions of survey volumes V and
$\Omega$
. This allowed for conceptually easy definitions of survey volumes V and $V_{\mathrm{max}}$
for a given cosmology. For transient sources such as FRBs however, the definition of these quantities becomes less obvious. Here we show how to construct V and
$V_{\mathrm{max}}$
for a given cosmology. For transient sources such as FRBs however, the definition of these quantities becomes less obvious. Here we show how to construct V and $V_{\mathrm{max}}$
in the case of spatial- and time-varying sensitivity.
$V_{\mathrm{max}}$
in the case of spatial- and time-varying sensitivity.
Appendix B.1. Spatially Varying Sensitivity
FRBs are transients, and as such they will be observed at a particular part of a telescope’s beam, with sensitivity, B, with respect to the beam centre (where $B=1$
). Unlike steady sources, where multiple pointings can, to a large extent, correct for sources viewed far from the beam centre,
$B=1$
). Unlike steady sources, where multiple pointings can, to a large extent, correct for sources viewed far from the beam centre, $S_{\mathrm{cutoff}}$
– or in our formulation,
$S_{\mathrm{cutoff}}$
– or in our formulation, $F_{\nu,{\mathrm{cutoff}}}$
– varies over solid angle, hence from event-to-event. While this approach generalises to any spatially varying sensitivity, we consider only the beamshape B, where
$F_{\nu,{\mathrm{cutoff}}}$
– varies over solid angle, hence from event-to-event. While this approach generalises to any spatially varying sensitivity, we consider only the beamshape B, where $F_{\nu,{\mathrm{cutoff}}} \propto B^{-1}$
, hereinafter.
$F_{\nu,{\mathrm{cutoff}}} \propto B^{-1}$
, hereinafter.
One approach (a differential method) to deal with this is to consider only an infinitesimal solid angle, $d\Omega$
, about the point of detection. In this case, the fluence cutoff,
$d\Omega$
, about the point of detection. In this case, the fluence cutoff, $F_{\nu,{\mathrm{cutoff}}}$
, is well-defined since the beam sensitivity is locally constant. Each and every detection therefore becomes its own survey over an infinitesimal solid angle
$F_{\nu,{\mathrm{cutoff}}}$
, is well-defined since the beam sensitivity is locally constant. Each and every detection therefore becomes its own survey over an infinitesimal solid angle $d\Omega$
, resulting in infinitesimally small
$d\Omega$
, resulting in infinitesimally small $V \to dV$
and
$V \to dV$
and $V_{\mathrm{max}} \to dV_{\mathrm{max}}$
. In such a case, the absolute values of dV and
$V_{\mathrm{max}} \to dV_{\mathrm{max}}$
. In such a case, the absolute values of dV and $dV_{\mathrm{max}}$
have little meaning, preventing the total source density from being derived; their ratio, however, is well-defined and preserves the properties of the
$dV_{\mathrm{max}}$
have little meaning, preventing the total source density from being derived; their ratio, however, is well-defined and preserves the properties of the $V/V_{\mathrm{max}}$
-test. B
$V/V_{\mathrm{max}}$
-test. B
An alternative approach (an integral method) is to consider the total volume viewed by the telescope beam and the regions over which the FRB could have been detected. This situation is illustrated in Fig. B1. Suppose an FRB is detected at position $\theta_{\mathrm{FRB}}$
away from the beam centre, and came from a distance
$\theta_{\mathrm{FRB}}$
away from the beam centre, and came from a distance $D_{\mathrm{FRB}}$
; where it could have been detected out to a distance
$D_{\mathrm{FRB}}$
; where it could have been detected out to a distance $D_{\mathrm{max}}(\theta_{\mathrm{FRB}})$
at that position in beam.
$D_{\mathrm{max}}(\theta_{\mathrm{FRB}})$
at that position in beam.
Illustration of the volumes V and $V_{\mathrm{max}}$
for an FRB detected at distance
$V_{\mathrm{max}}$
for an FRB detected at distance $D_{\mathrm{FRB}}$
at position
$D_{\mathrm{FRB}}$
at position $\theta_{\mathrm{FRB}}$
away from the beam centre.
$\theta_{\mathrm{FRB}}$
away from the beam centre.

Since the beam sensitivity varies with position on the sky, the event at distance $D_{\mathrm{FRB}}$
would have been detectable at any point in the beam between the beam centre (
$D_{\mathrm{FRB}}$
would have been detectable at any point in the beam between the beam centre ( $\theta=0$
) and some maximum angle
$\theta=0$
) and some maximum angle $\theta_{\mathrm{max}}$
. However, it could have been detected at a maximum distance
$\theta_{\mathrm{max}}$
. However, it could have been detected at a maximum distance $D_{\mathrm{max}}(\theta)$
that varies with beam angle
$D_{\mathrm{max}}(\theta)$
that varies with beam angle $\theta$
. Therefore, the total volume
$\theta$
. Therefore, the total volume $V_{\mathrm{max}}$
in which the FRB could have been detected is the region contained beneath the
$V_{\mathrm{max}}$
in which the FRB could have been detected is the region contained beneath the $D_{\mathrm{max}}(\theta)$
curve, while the volume V in which it was detected is the same region, albeit limited by the actual distance to the event,
$D_{\mathrm{max}}(\theta)$
curve, while the volume V in which it was detected is the same region, albeit limited by the actual distance to the event, $D_{\mathrm{FRB}}$
.
$D_{\mathrm{FRB}}$
.
It is interesting to compare the results of the integral method with that of the differential method, where V and $V_{\mathrm{max}}$
depend only on the values
$V_{\mathrm{max}}$
depend only on the values $D_{\mathrm{FRB}}$
and
$D_{\mathrm{FRB}}$
and $D_{\mathrm{max}}(\theta_{\mathrm{FRB}})$
at the point
$D_{\mathrm{max}}(\theta_{\mathrm{FRB}})$
at the point $\theta_{\mathrm{FRB}}$
– the point at which the FRB was detected. Clearly, for any given event, the value
$\theta_{\mathrm{FRB}}$
– the point at which the FRB was detected. Clearly, for any given event, the value $V/V_{\mathrm{max}}$
will be different between the two methods. Yet, statistically, they give identical results.
$V/V_{\mathrm{max}}$
will be different between the two methods. Yet, statistically, they give identical results.
We have tested the differential and integral methods using a simple simulation of FRBs distributed in a Euclidean space viewed by a 2-dimensional Gaussian beamshape. We generated a sample of $10^6$
FRBs uniformly in the sensitive volume, and calculated
$10^6$
FRBs uniformly in the sensitive volume, and calculated $V/V_{\mathrm{max}}$
for each simulated FRB using both methods. In both cases a uniform distribution of
$V/V_{\mathrm{max}}$
for each simulated FRB using both methods. In both cases a uniform distribution of $V/V_{\mathrm{max}}$
over the range
$V/V_{\mathrm{max}}$
over the range $\left[0, 1\right]$
was obtained within statistical errors.
$\left[0, 1\right]$
was obtained within statistical errors.
Appendix B.2. Time-varying Sensitivity
Time-variation of survey sensitivity, $F_{\nu,{\mathrm{cutoff}}}$
, is no different to variation over a beam pattern – it is just another dimension. Analogously, a transients survey is characterised not just by the survey area,
$F_{\nu,{\mathrm{cutoff}}}$
, is no different to variation over a beam pattern – it is just another dimension. Analogously, a transients survey is characterised not just by the survey area, $\Delta \Omega$
, and threshold,
$\Delta \Omega$
, and threshold, $F_{\nu,{\mathrm{cutoff}}}$
, it is also characterised by its duration,
$F_{\nu,{\mathrm{cutoff}}}$
, it is also characterised by its duration, $T_{\mathrm{obs}}$
. Likewise, the instantaneous volume element of the Universe in which transients occur is
$T_{\mathrm{obs}}$
. Likewise, the instantaneous volume element of the Universe in which transients occur is $d\Omega dzd\tau$
, where proper time,
$d\Omega dzd\tau$
, where proper time, $d\tau$
, is simply another dimension of the volume.
$d\tau$
, is simply another dimension of the volume.
Furthermore, the sensitivity of FRB surveys can also vary with time, either on rapid timescales (e.g. due to RFI) or on slow timescales (e.g. due to varying telescope configurations). The latter is a particular problem for commensal observations.
The differential and integral methods discussed above therefore apply identically to the time dimension. The differential method requires knowing the survey sensitivity only at the time of detection, whereas the integral method requires knowing the survey sensitivity for the entire duration of the survey, and integrating the volumes V(t) and $V_{\mathrm{max}}(t)$
over survey time, t.
$V_{\mathrm{max}}(t)$
over survey time, t.
Appendix B.3. Application to the Current Work
Holographic observations have allowed accurate measurements of ASKAP’s beamshape (James et al. Reference James2019) to be made, allowing the integral method to be used to account for ASKAP’s spatial variation in sensitivity over $\Delta \Omega$
. However, a proper accounting of changing detector conditions with time makes the integral method too complex to deal with this dimension; we therefore use the differential method in the time domain for our analysis, by taking the survey conditions at the instant at which each FRB has been detected.
$\Delta \Omega$
. However, a proper accounting of changing detector conditions with time makes the integral method too complex to deal with this dimension; we therefore use the differential method in the time domain for our analysis, by taking the survey conditions at the instant at which each FRB has been detected.
Appendix C. Error calculations for the luminosity function
The luminosity histogram is built by summing the inverse values of $V_{\mathrm{max}}$
. Treating this process as a weighted sum produces an error corresponding to C
$V_{\mathrm{max}}$
. Treating this process as a weighted sum produces an error corresponding to C
 \begin{eqnarray}\sigma_v & = \ & \sqrt{\sum_{i=1}^{N} \frac{1}{(V_\mathrm{max}^i)^2}},\end{eqnarray}
for N FRBs in a histogram bin. Equivalently, we can use resampling – replacing each FRB with M copies of itself, where M is an integer sampled from a Poissonian distribution of mean unity – to estimate the error. These methods produce statistically identical estimates of $\sigma_v$
. However, both formally treat the problem of ‘if the observation is the truth, what is the plausible range of alternate observations?’ rather than the inverse ‘what range of plausible truths could reproduce this observation?’. While the latter formulation is formally correct, for many statistical problems, the difference between these two statements is small. Here, however, different values of beam efficiency B, and sparse histogram binning, lead to
$\sigma_v$
. However, both formally treat the problem of ‘if the observation is the truth, what is the plausible range of alternate observations?’ rather than the inverse ‘what range of plausible truths could reproduce this observation?’. While the latter formulation is formally correct, for many statistical problems, the difference between these two statements is small. Here, however, different values of beam efficiency B, and sparse histogram binning, lead to $V_{\mathrm{max}}$
varying by up to a factor of 300 within a given bin, so that individual samples dominate, and the effective sample size approaches unity. This then leads to the uncertainty in that bin being comparable to the value in the bin itself, which is a clear miscalculation of the error.
$V_{\mathrm{max}}$
varying by up to a factor of 300 within a given bin, so that individual samples dominate, and the effective sample size approaches unity. This then leads to the uncertainty in that bin being comparable to the value in the bin itself, which is a clear miscalculation of the error.
To estimate the error in each luminosity function bin therefore, we use the bootstrap resampling method above, but vary the expected mean of the Poissonian distribution by a factor k. We generate lower (upper) limits on each bin by finding the smallest (largest) factor k such that $0.5 (1-0.6827) = 15.865\%$
of resampled values are greater than (less than) the measured value. The lower (upper) bound then becomes that bin value multiplied by k. For this purpose, we use
$0.5 (1-0.6827) = 15.865\%$
of resampled values are greater than (less than) the measured value. The lower (upper) bound then becomes that bin value multiplied by k. For this purpose, we use $10^{4}$
resamplings per bin.
$10^{4}$
resamplings per bin.


 Open access