


Introduction
Amplified Arctic warming has led to an increase in the magnitude and inland extent of melting on the Greenland ice sheet (van den Broeke and others, Reference van den Broeke2023). Meltwater contributes to ice-sheet mass loss directly, via runoff and indirectly, through ice dynamic discharge, by modulating subglacial water pressures and sliding once it reaches ice sheet's base. Meltwater can be transferred from the ice-sheet surface to the ice–bedrock interface through the hydraulic fracture of crevasses to the bed. With sufficient meltwater supply, full-thickness crevasses can transport large volumes of water to subglacial drainage systems (Andrews and others, Reference Andrews2014; Mejia and others, Reference Mejia2022). These surface-to-bed hydraulic connections are more prevalent at low elevations and decline with distance inland on the ice sheet (Phillips and others, Reference Phillips2011; Yang and Smith, Reference Yang and Smith2016). Far inland, these connections are located in the accumulation area where high-elevation melting in snow-covered areas can also form full-thickness crevasses (Poinar and others, Reference Poinar2015).
High on the ice sheet above the equilibrium line altitude, snow cover persists throughout the year. Meltwater percolates down through the snowpack, and in areas with high winter accumulation rates the thick annual snow layer protects liquid water from refreezing and allows the formation of firn aquifers that perennially store liquid water beneath the snow surface (Forster and others, Reference Forster2014). Firn aquifers are thermally bounded at their base and are resupplied with surface meltwater that percolates down through snow and firn to recharge the aquifer before laterally flowing downslope through the firn pore space (Meyer and Hewitt, Reference Meyer and Hewitt2017). If a crevasse intersects a firn aquifer, water discharge from the firn aquifer into the crevasse can drive full-thickness hydrofracture (Poinar and others, Reference Poinar2017), bringing water directly to the subglacial drainage system and establishing surface-to-bed hydraulic connections at inland locations far from the ice-sheet margin (Cicero and others, Reference Cicero2023).
Climatic warming has caused the Greenland ice sheet to experience melt at higher elevations, resulting in the seasonal snowline retreating to higher elevations (Steger and others, Reference Steger2017b). This high-elevation melting has similarly caused the upstream boundary of Greenland firn aquifers to migrate inland between 1993 and 2018 (Miège and others, Reference Miège2016; Miller and others, Reference Miller2020; Horlings and others, Reference Horlings, Christianson and Miège2022). Here we investigate the hypothesis that the downstream boundary of the firn aquifer is also changing. The location where firn aquifers drain is important because models suggest that firn aquifer water within the subglacial drainage system can potentially elevate water pressures over large areas (>120 km2) to influence ice velocity and the seasonal evolution of and water residence times within the downstream drainage system (Poinar and others, Reference Poinar, Dow and Andrews2019). Ultimately, firn aquifer drainage at higher elevations would supply aquifer-sourced water to new regions of the bed overlaid by ice thicknesses that exceed our current observations of the development of subglacial drainage systems. These new inputs have the potential to influence subglacial water pressures, ice velocity and the evolution of the downstream drainage system with potentially widespread and significant ramifications for ice dynamics and ultimately mass loss (Bartholomew and others, Reference Bartholomew2011; Doyle and others, Reference Doyle2014; Poinar and others, Reference Poinar2015; Mejia and others, Reference Mejia2022; Sommers and others, Reference Sommers2024).
To test our hypothesis that the drainage region of firn aquifers can move inland, an understanding of the physical processes that control the formation of crevasses that drain the firn aquifer is required. While initial work found that firn aquifers have the ability to drive full-thickness hydrofracture (Poinar and others, Reference Poinar2017), the initiation of hydrofracture is poorly constrained due to the difficulty of collecting direct observations. To address this gap, we investigate the requirements for firn aquifer-fed hydrofracture initiation using linear elastic fracture mechanics (LEFMs), complemented with in situ and satellite-derived observations, to calculate dry crevasse depths for a region on Helheim Glacier to determine if crevasses can penetrate the firn aquifer upon formation. We interpret our results to evaluate the potential for the inland migration of the region draining the firn aquifer under future climatic warming.
Methods
Field site
Helheim Glacier is a fast-flowing outlet glacier in southeast Greenland with an extensive firn aquifer located in the accumulation area spanning elevations of 1400 to 1800 m a.s.l. (Fig. 1a). Here, we focus on a 23 km segment along an approximate flowline on the southern branch of Helheim Glacier (Fig. 1). This specific region was chosen to align with repeat firn aquifer locations detected by NASA's Operation IceBridge (OIB) between 2010 and 2017 (Miège and others, Reference Miège2016) and existing data from geophysical field campaigns undertaken during 2015 and 2016 (Miller and others, Reference Miller2017, Reference Miller2018; Montgomery and others, Reference Montgomery2017). In June 2023 we established a camp ($66.3538^\circ$ N, $-39.1560^\circ$
 E) located 4 km up-glacier from the crevasse field bounding the firn aquifer (Fig. 1) where the ice is 1140 m thick (Morlighem and others, Reference Morlighem2017). We installed eight Global Navigation Satellite System (GNSS) stations in a strain diamond configuration that extended from our base camp to the crevasse field in June and July 2023 (Fig. 1a). We now briefly describe our remote-sensing analysis, field measurements and LEFM model; see Appendices A and B for additional details.
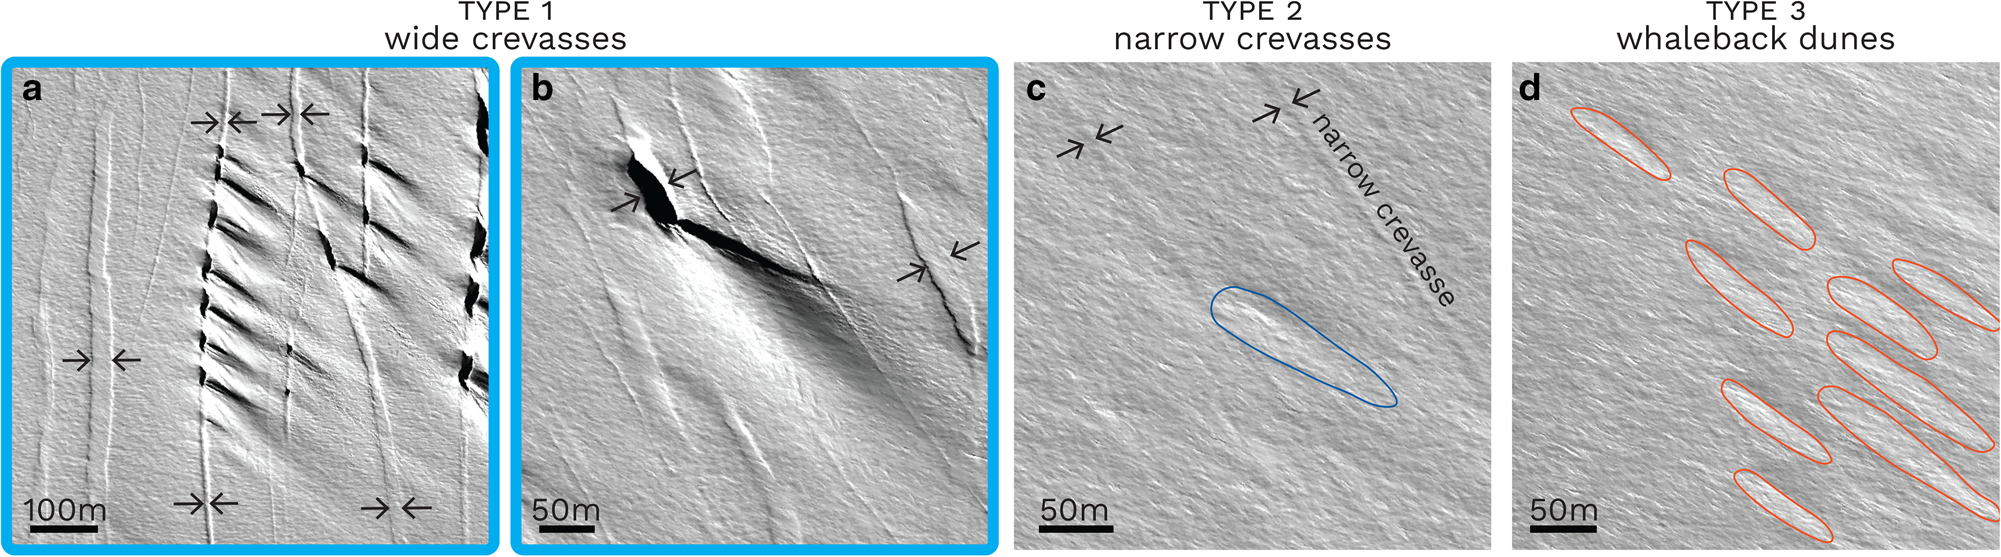
(a) Study area location (red box) on Helheim Glacier with OIB firn aquifer locations (colored as depth) along flight (black) lines. The 100 m ice surface elevation contours in m a.s.l. accessed through BedMachine-v3 based on Greenland Ice Mapping Project DEMs (Howat and others, Reference Howat, Negrete and Smith2014; Morlighem and others, Reference Morlighem2017). Inset shows location in southeast Greenland. (b) Firn aquifer profile, aquifer detections and flight lines, shaded according to the more-extensional principal stress (σ 1) in MPa. Surface elevation contours in m above WGS84 ellipsoid (Porter and others, Reference Porter2023). (c) Details (5 km × 3 km) of narrow (blue) and wide (pink) crevasses delineated from 28 March 2024 WorldView-2 imagery.

Firn aquifer detection
We use firn aquifer locations detected by NASA OIB accumulation radar (AR) data over 2010–17 (Miège and others, Reference Miège2016; Miége, Reference Miége2018), which locate the depth of the firn aquifer water table – the upper surface of saturated firn layer – beneath the snow surface (Fig. 1a). Specifically, we use a subset of data from Miège and others (Reference Miège2016), the surface elevation and firn aquifer depth observed at repeat flight lines covering the 23 km segment of the firn aquifer intersecting our field site (Fig. 1b). Miège and others (Reference Miège2016) identified bright internal reflectors indicative of the firn aquifer water table (saturated firn) from AR data and estimated water table depth by calculating the two-way travel time for the emitted electromagnetic wave which produces an aquifer water table depth with an associated uncertainty of ±0.72 m. OIB flight lines maintained spatial consistency between years with a maximum offset of 250 m in the north–south (across-flow) direction. Small deviations in campaign flight track, winter snow accumulation and survey date introduced variability in surface elevation measurements between years (std dev.=3.4 m). Notably, ice-sheet surface elevations observed in 2010 and 2011 were consistently higher than all other years. To reduce variability in surface elevation between years we apply a correction of −4.0 m for 2010, and −3.0 m for 2011 data, amounting to the average surface elevation offset from 2016. This correction is imperative because the ice-sheet surface elevation acts as a datum when converting the aquifer water table depth to water table elevation and we use 2016 surface elevations as our reference for calculated dry crevasse depth. Failure to adjust for 2010–11 offsets could erroneously imply a reduced water table depth when comparing 2010–11 water table elevations to the 2016 ice-sheet surface. Aquifer thickness and bottom elevation are extrapolated from 2016 surface elevations and point observations of aquifer water table and bottom depths measured in 2015 and 2016 (Fig. 1b; Montgomery and others, Reference Montgomery2017).
Stress regime and crevasse detection
We calculate primary principal strain rates using NASA MEaSUREs program Multi-year Greenland Ice Sheet Velocity Mosaic velocities (Joughin and others, Reference Joughin, Smith, Howat and Scambos2016). This velocity product comprises a year-round velocity average that is selected to be representative of the 1995–2015 period and has a pixel size of 250 m × 250 m. We smooth surface velocity with a 1 km2 Savitzky–Golay filter to derive 2-D horizontal principal strain rates over Helheim Glacier (cf. Meyer and Minchew, Reference Meyer and Minchew2018; Minchew and others, Reference Minchew, Meyer, Robel, Gudmundsson and Simons2018; Poinar and Andrews, Reference Poinar and Andrews2021). We use the more extensional principal strain rate ($\dot \epsilon _1$ ) alongside the more compressional principal strain rate ($\dot \epsilon _3$
 ), as defined in (A2), and the shear strain rate ($\dot \epsilon _{xy}$
 ) to calculate the more-extensional principal stress, σ 1, along the OIB firn aquifer profile as follows:
where the creep exponent is n = 3, the creep parameter is A = 3.5 × 10⁻²⁵ Pa−3 s−1 for ice temperature of $-10^\circ$ C and $\dot \epsilon _{\rm eff}$
 is the effective strain rate defined as $\dot \epsilon _{\rm eff} = \sqrt {{1\over 2}( \dot {\epsilon }_1^{2} + \dot {\epsilon }_3^{2}) + \dot {\epsilon }_{xy}^{2}}$
 .
.
On-ice GNSS stations
We use kinematic site positions for our three on-ice GNSS stations to calculate strain rates between station pairs, see Appendix A for a full description of GNSS station deployment, analysis (Herring and others, Reference Herring, King and McClusky2010), and stress calculation. We smooth the station position timeseries using a 3 h centered rolling average. We then calculate strain rates between station pairs HLM8–HLM6 and HLM6–HLM5 from 15 min downsampled station positions. Specifically, we calculate daily logarithmic strain rate, $\dot \epsilon$ , for a rolling window applied to the 15 min station positions:

where Δt is 24 h, ℓ0 and ℓ1 are station separations in m at the beginning and end of the 24 h time span, respectively. This technique produces strain rates between station pairs at a 15 min frequency for times when data are available at each station.
Crevasse identification from satellite imagery
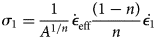
We manually located crevasses across our study area using WorldView imagery acquired between 2015 and 2023. We use 13 WorldView-1 panchromatic scenes with a ~0.5 m resolution, and two WorldView-2 multi-spectral scenes with a ~2 m resolution. Satellite geolocation accuracy is reported at ~5.0 m CE90, circular error in the 90th percentile, without ground control (Maxar, 2021). However, through comparison between features in WorldView and Landsat images we estimate a geodetic location accuracy of 80 m, a similar finding to Poinar and Andrews (Reference Poinar and Andrews2021). Crevasses were user-identified in QGIS for one acquisition date at a time and a digitizing radius of >2 m. We searched for crevasses using a screen scale of 1:10 000 within the region coinciding with the firn aquifer extent determined by Miège and others (Reference Miège2016). The opening direction of visible crevasses were aligned with the primary principal stress σ 1. We divide accumulation area crevasses into three categories: (1) groups of crevasses with widths >5 m (Figs 2a, b), (2) narrow crevasses that appear as linear features and have widths on the order of 1–2 m (Fig. 2c) and (3) crevasse-related longitudinal whaleback dunes where the nucleating crevasse is not visible in satellite imagery (Fig. 2d). We explain our reasoning for class 3 below.
Accumulation area crevasses with whaleback dunes. Type 1 wide crevasses (>5 m) with (a) multiple or (b) a single dune. Arrows point to crevasses and blue boxes denote wide hydrofractured crevasses. (c) Type 2 narrow crevasses with a single dune (blue), and (d) type 3 whaleback dunes (orange) without a visible nucleating crevasse. Subplot locations are marked in Figures 1b, c. All panels show WorldView-2 imagery acquired on 28 March 2024.
Whaleback dunes are depositional snow bedforms created in regions with strong winds above 15 m s−1 and are elongated parallel to the wind direction (Kobayashi, Reference Kobayashi1980). There are two potential scenarios for the formation of whaleback dunes in Helheim Glacier's accumulation area. In the first scenario, dunes form on flat terrain whereby layers of wind-packed snow build up and erode throughout the winter, forming sastrugi. In this case, dunes and sastrugi have similar dimensions (lengths ~10 m), with whaleback dunes forming when a dune becomes polished and rounded on top, and can achieve lengths of up to 20 m (Li and Sturm, Reference Li and Sturm2002). In the second scenario, whaleback dunes form when snow is transported under high wind speeds until it is deposited on the lee side of a sharp break on the snow surface. Dunes formed under this process are large, having widths over 10 m and lengths over 100 m (Filhol and Sturm, Reference Filhol and Sturm2015), and are persistent because erosion will rarely remove the feature after deposition (Li and Sturm, Reference Li and Sturm2002). We observe both types of whaleback dunes on Helheim Glacier. The first type is small (<20 m) and ubiquitous, the second type is large (>100 m) and forms when wind-deposited snow accumulates on a crevasse wall from the created discontinuity in the snow surface of any size, even <2 m (Fig. 2). We therefore use the presence of large whaleback dunes, with lengths exceeding 100 m, as a proxy for the existence of small crevasses that are undetectable in WorldView imagery.
LEFM model for dry crevasse depth
Dry crevasse depth along OIB flight lines is calculated for locations where a firn aquifer was detected by Miège and others (Reference Miège2016) (Fig. 1a). The LEFM model used to determine dry crevasse depth is informed by primary principal stress, σ 1, at points along OIB flight lines (Figs 3a, b) and field-calibrated model parameters for the low-density firn layer with a surface density of ρ s = 400 kg m−3 (B3) and an average crevasse spacing of 50 m. As we will later show, the value used for ρ s has a much smaller influence on dry crevasse depth than crevasse spacing. We describe LEFM model formulation and parameter values below with additional details available in Appendices A and B. We use these model results to compare initial dry crevasse depth with 2010–17 firn aquifer water table elevations to determine inland areas potentially vulnerable to future hydrofracture, supported by additional observations of crevasse opening and distribution changes that indicate the stress conditions required for crevasse formation are already being met over the firn aquifer.
(a) Plan-view of OIB flight lines and firn aquifer locations with background stress field, colors and symbology as in Figure 1. (b) Primary principal stress along OIB flight lines in MPa. (c) LEFM dry crevasse depth calculations plotted in m above WGS84 ellipsoid showing 2016 snow surface (navy) and dry crevasse penetration depth (orange) calculated for our base case. OIB water table locations, 2015–16 aquifer measurements (Montgomery and others, Reference Montgomery2017) and extrapolated aquifer bottom (dashed). (d) Same as (c) with data plotted in m below the snow surface. Orange shading shows dry crevasse depth uncertainty for variable crevasse spacing of 50 ± 20 m.
Model formulation
The penetration depth of a water-free crevasse undergoing mode I cracking is found following the LEFM formulation of van der Veen (Reference van der Veen2007). The net stress intensity factor, $K_{\rm I}^{\rm NET}$ , describes the concentration of stresses at the crack tip which is the sum of the tensile, $K_{\rm I}^{( 1) }$
 , and lithostatic, $K_{\rm I}^{( 2) }$
 , stress components. Fracture propagation occurs when stresses at the crack tip reach the fracture toughness of ice, K IC. We therefore solve for dry crevasse depth by equating $K_{\rm I}^{\rm NET}$
 to K IC, taken here as 0.1 MPa m1/2 such that $K_{~I}^{\rm NET} = K_{~I}^{( 1) } + K_{~I}^{( 2) } = K_{~IC}$
 .
.
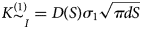
The stress intensity factor $K_{\rm I}^{( 1) }$ for crevasse opening under an applied normal stress, σ 1, is calculated for a crevasse located in a field of closely spaced crevasses following van der Veen (Reference van der Veen1998):
where D(S) is a polynomial function (B1) that describes the shielding effect of multiple crevasses that impede stress from concentrating at crevasse tips (van der Veen and Whillans, Reference van der Veen and Whillans1989). S = W/(W + d) for crevasse depth d and the spacing between neighboring crevasses is 2W. The far-field resistive stress is taken as the primary principal stress σ 1. In our study area, crevasses readily identifiable from satellite imagery (i.e. types 1 and 2 crevasses) are closely spaced with separations ranging from 20 to 200 m and a mean spacing of 2W = 50 m within the main crevasse field intersecting OIB flight lines (Fig. 1c).
Crevasse closure due to ice overburden pressure is accounted for by calculating $K_{\rm I}^{( 2) }$ which yields the stress intensity factor for the weight of the overlying ice as
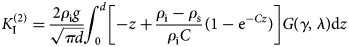
where z is the depth below the surface, d is the crevasse depth, g is the acceleration due to gravity, ρ i is the ice density taken as 917 kg m−2 and ρ s is the surface density accounting for a low-density firn layer. G(γ, λ) is a functional expression described in (B2) for γ = z/d and λ = d/H where H is the ice thickness (Tada and others, Reference Tada, Paris and Irwin1973). We account for the presence of a low-density firn layer at the surface using the relationship in (B3), where ρ s = 400 kg m−1 and C = 0.0314 m−1 whose determination is discussed in Appendix B.
Results
Dry crevasse depth
We calculate dry crevasse depth from the primary principal stress (σ 1) at locations where a firn aquifer was identified along OIB flight lines (Figs 1a, 3a, b; Miège and others, Reference Miège2016). Figures 3c, d show OIB surface elevation, 2010–17 firn aquifer water table surface elevation (Miège and others, Reference Miège2016), approximated firn aquifer depth extrapolated from 2015–16 borehole observations (Montgomery and others, Reference Montgomery2017) and LEFM-calculated dry crevasse depth. Dry crevasse depth is modeled using parameters chosen for our field site on Helheim Glacier with our base case of firn with a fracture toughness, K IC, of 0.1 MPa m1/2, a surface density, ρ s, of 400 kg m−3, and crevasses with a uniform spacing of 50 m. Dry crevasse depth in Figure 3d includes an uncertainty ranges with upper (shallower) bounds denoting a crevasse spacing of 30 m and lower (deeper) bounds denoting a crevasse spacing of 70 m, these limits encompass the ±1 m uncertainty related to firn density, ρ s = 400 ± 50 kg m−3. Dry crevasse depth sensitivity to various model parameters is found in Figure 4. In the 1 km wide main crevasse field, dry crevasses will penetrate 27.9 ± 4.0 m, which is deep enough to intersect the 2016 aquifer water table 22.7 ± 0.6 m below the snow surface (Figs 3c, d). This area of peak surface stress occurs along a 250 m wide area that immediately precedes the onset of active crevasse widening identified from WorldView image-pairs over 2015–23 (white lines in Fig. 3a). On the downstream boundary of the main crevasse field, dry crevasse depth shallows until becoming equivalent to the water table depth (Fig. 3). Similarly, dry crevasse depth shallows to the water table depth 0.5 km up-glacier from the main crevasse field (blue shading, Fig. 3c) in the area where narrow crevasses are present (Figs 1c, 3).
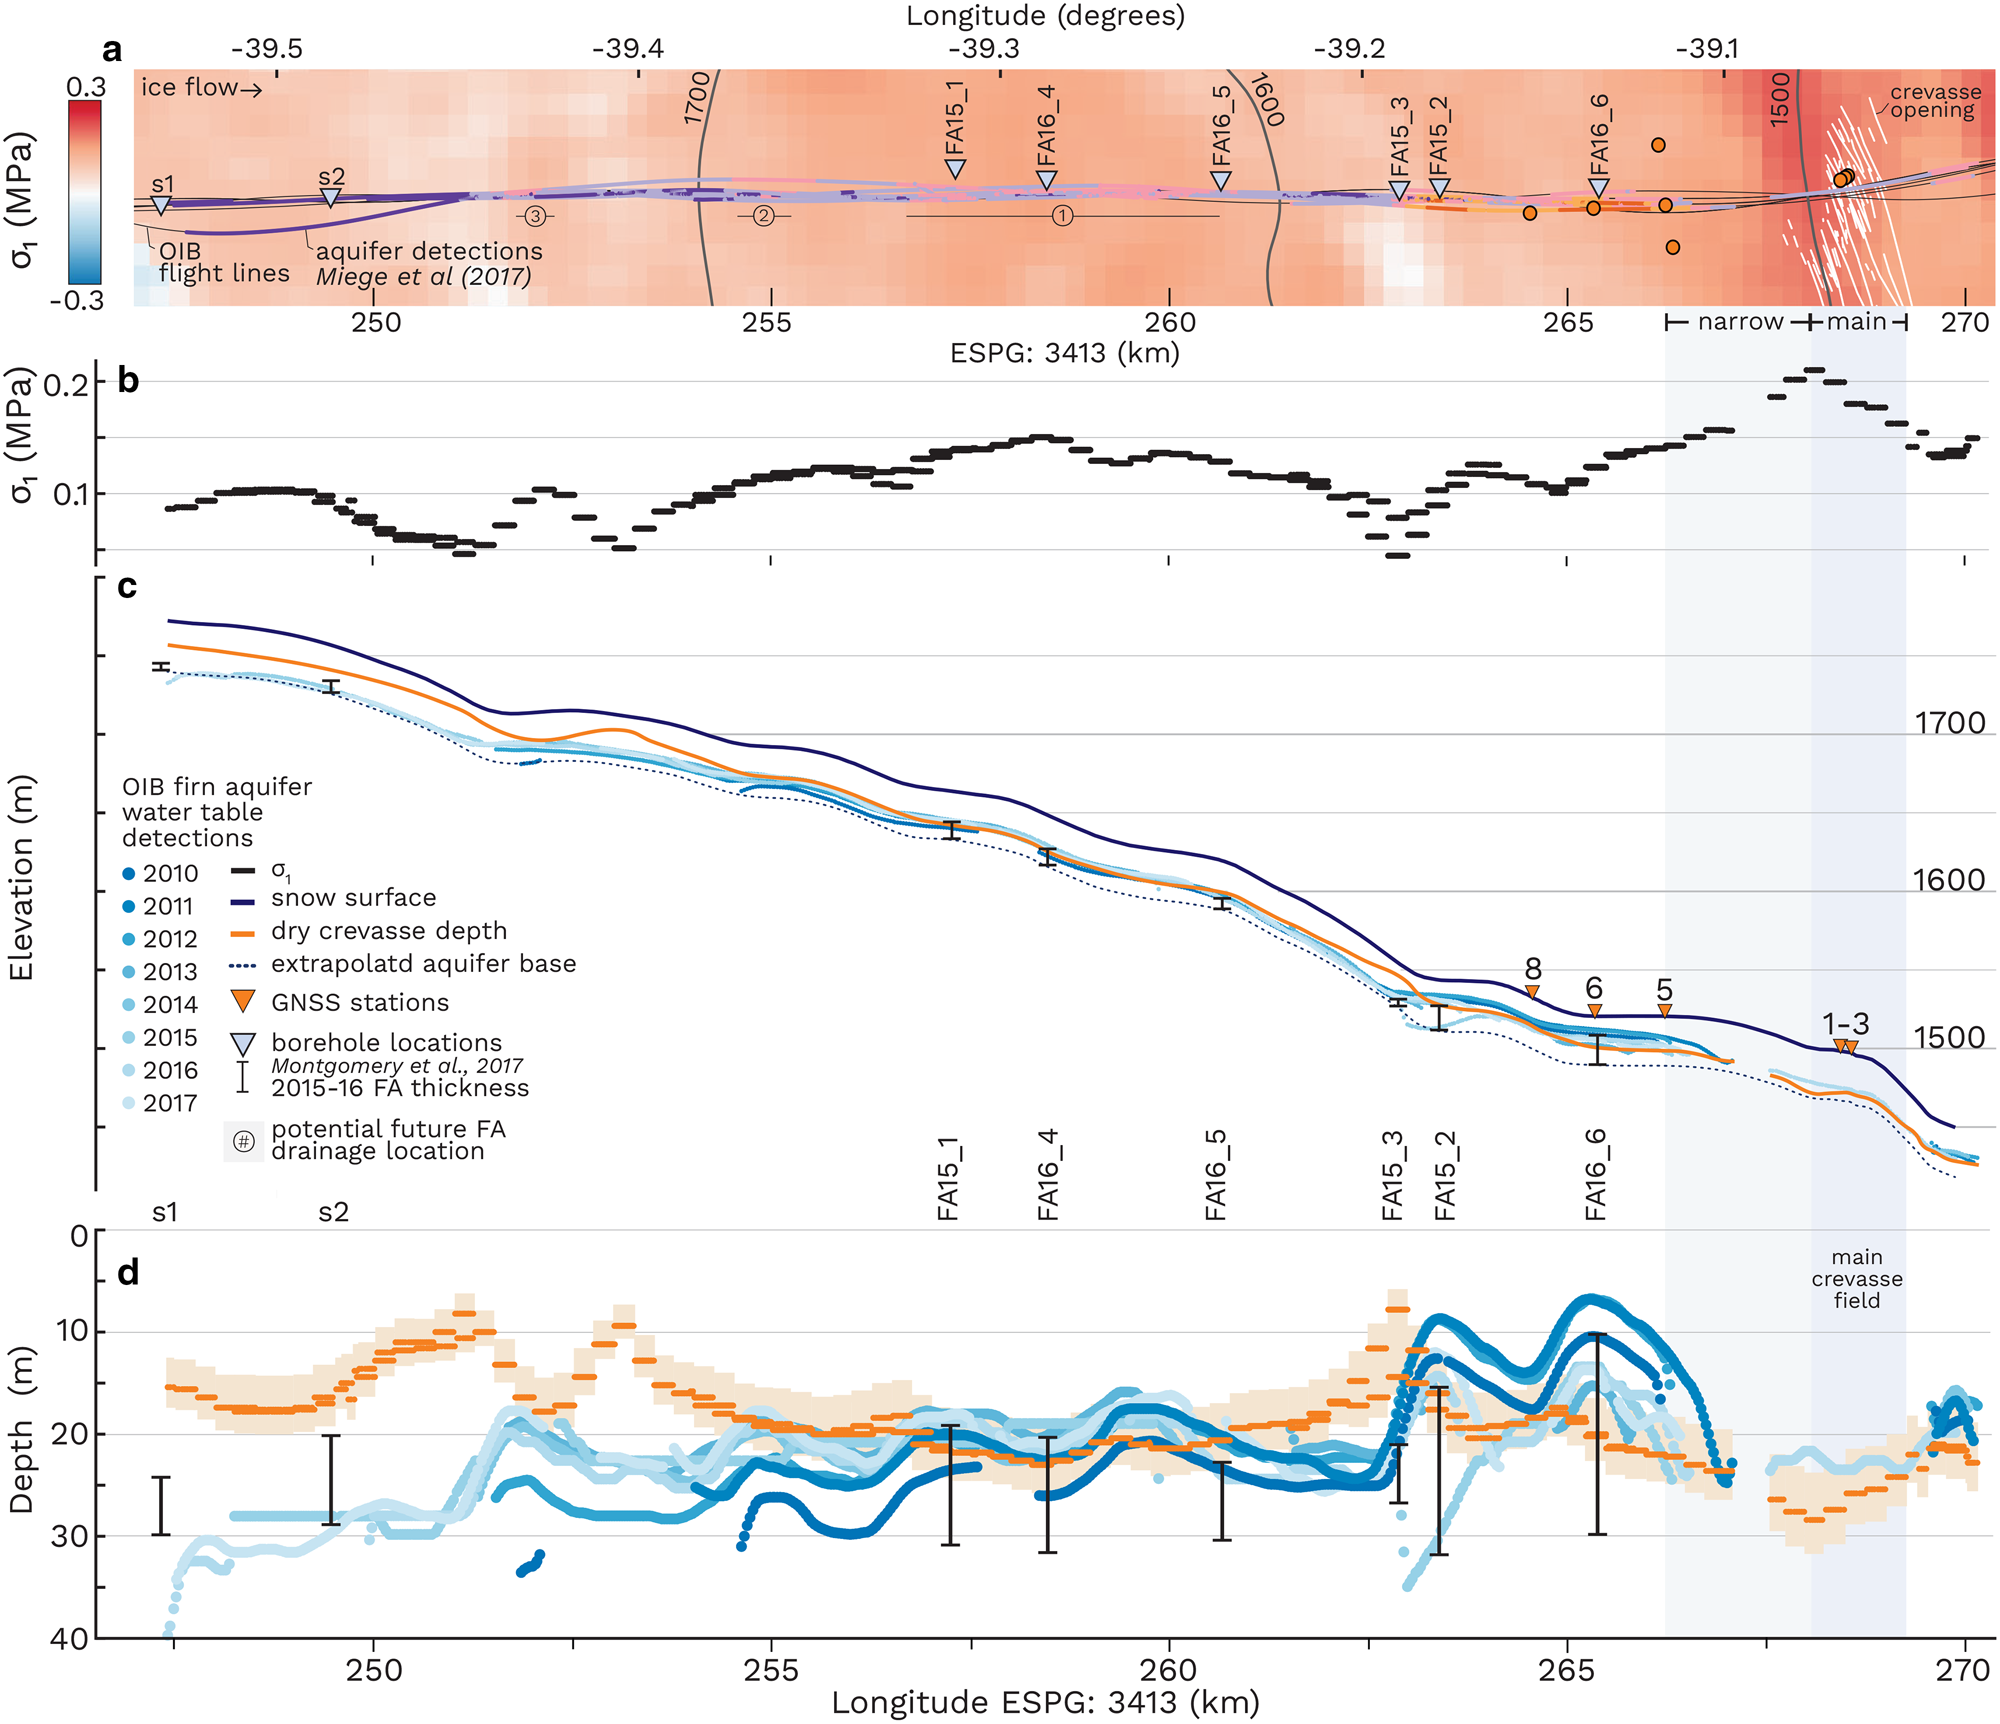
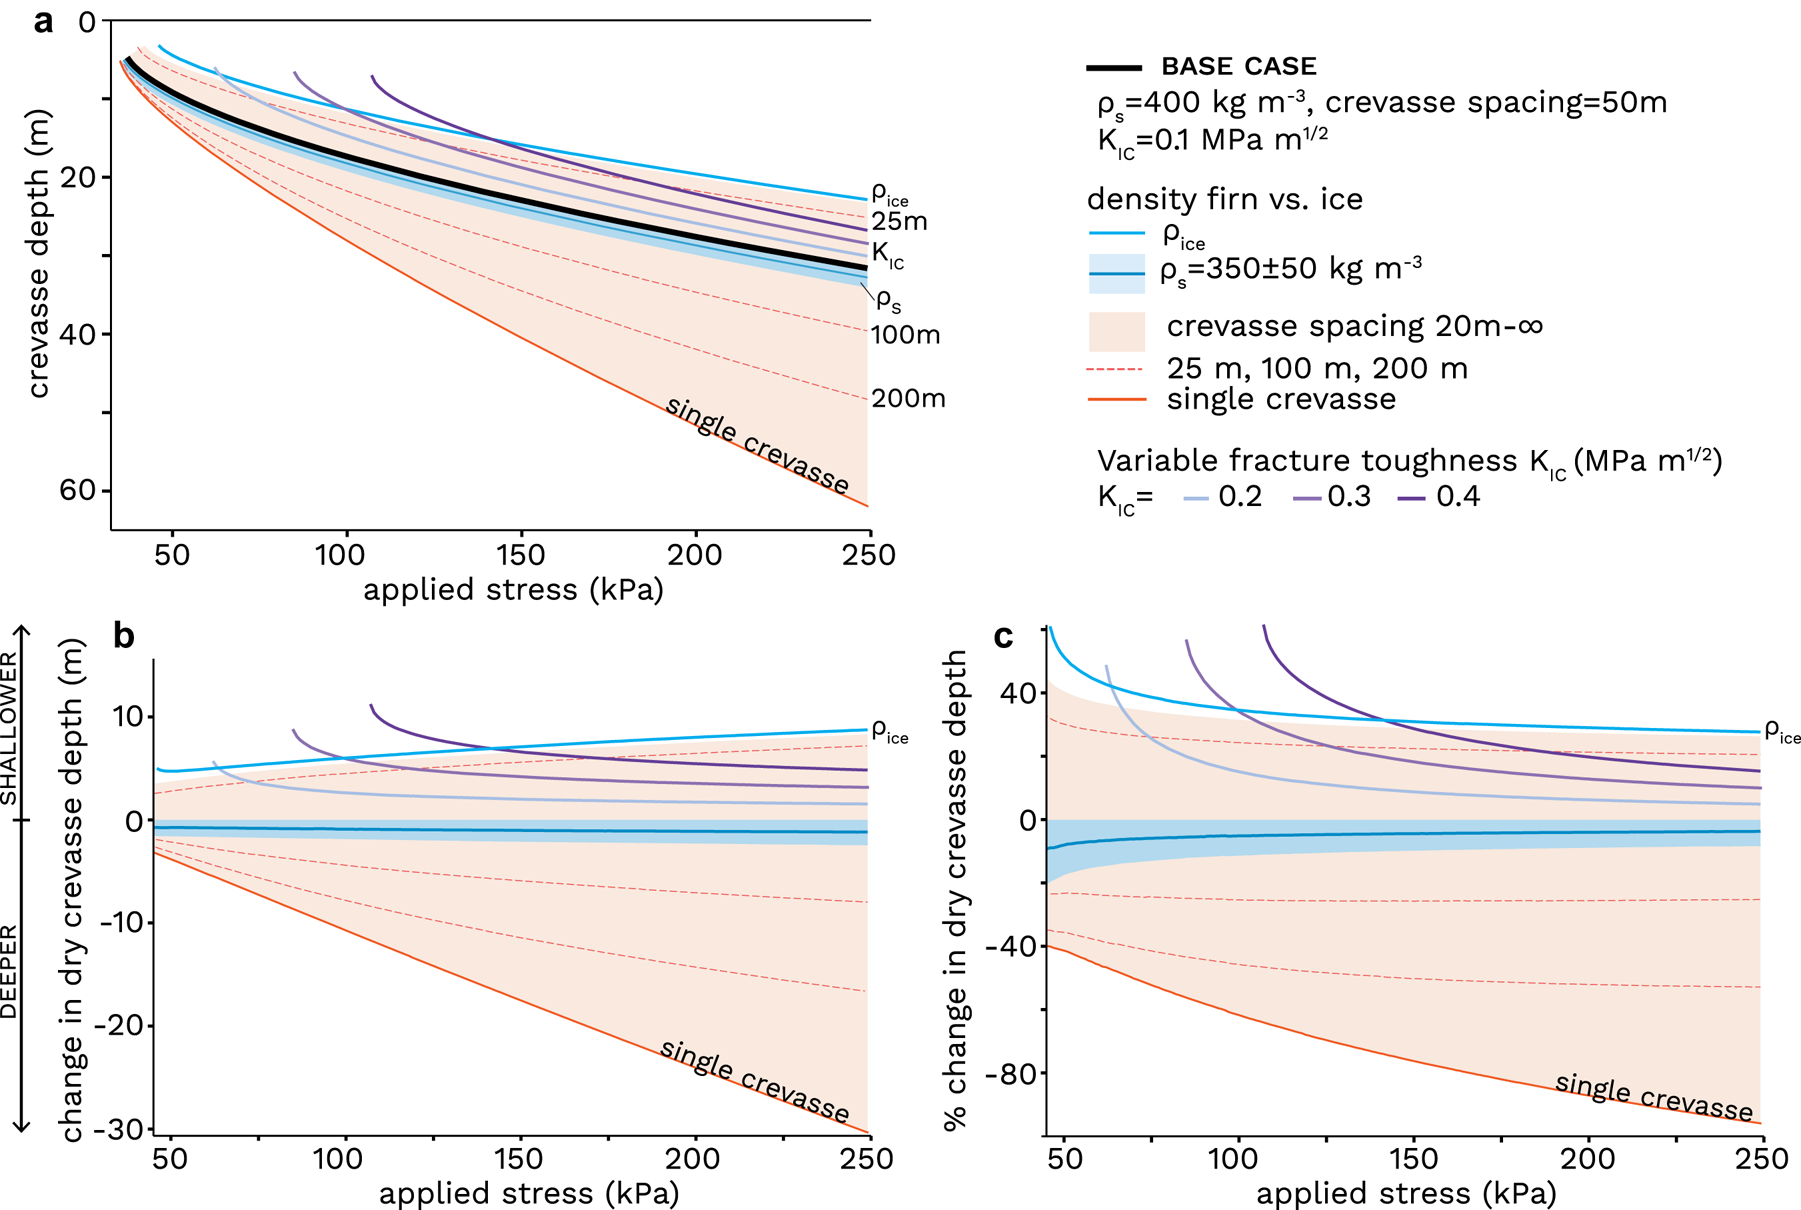
(a) Dry crevasse depth for model parameters (see legend) under an applied stress. (b) Change in dry crevasse depth from base case in m and (c) as a percent difference from base case. Parameters explored are ρ s firn density (blue), crevasse spacing (orange shading and lines) and fracture toughness K IC (purple).
Dry crevasse penetration depth generally shallows with distance up-glacier from the main crevasse field, following the surface stress distribution (Fig. 3d). The up-glacier edge of the main crevasse field marks a 1.5 km region of narrow crevasses that extend to GNSS station HLM5 (Figs 1c, 3a). At this intersection, dry crevasse depth reaches the water table at a depth of 23.2 m and shallows over 1.5 km, reaching 21.0 m near station HLM5. In this area, measurements of the firn aquifer's water level are sparse and variable. Inspection of AR and MCoRDS (Multichannel Coherent Radar Depth Sounder) radiograms confirm this gap in aquifer locations, likely caused by a combination of the heavily crevassed area, a thin aquifer potentially caused by drawdown from the nearby crevasses draining the firn aquifer, both of which would obscure the water table in radiograms. The aquifer water table meets calculated dry crevasse depth at locations 0.53 km (2011), 1.09 km (2016) and 1.29 km (2015) up-glacier from the main crevasse field. In the 3.2 km region between HLM5 and borehole site FA15_3 the water table shallows to its minimum depth of 6.8 ± 0.72 m in 2011 and 2012. The shallowest water table detection is located near GNSS station HLM6 and the aquifer sampling site FA16_6, which recorded a water table depth of 10 m in 2016 Montgomery and others (Reference Montgomery2017) (Fig. 3d). Due to these shallow water table depths (<20 m), 11.8–22.0 m deep dry crevasses should penetrate the water table in the 3.2 km region between HLM5 and FA15_3.
In the 15.5 km up-glacier-most region of our profile, west of FA15_3 at elevations above 1550 m, dry crevasse depth is predominately above the aquifer water table except for three areas where dry crevasse depth falls within or comes close to the range of water table variability of 2010–17. The first region is 7.8 km from the main crevasse field and spans the 4 km between FA16_5 and FA15_1, in this area dry crevasse depths are deeper than the aquifer water table in 2011–17 (Figs 3a, d). The second region spans 170 m where the water table reaches a local minima of 17.7–26.9 m and is located 12.7 km from the main crevasse field at an elevation of 1692 m. In 2017 and 2013 the water table height of 17.7 m and 18.0 m, respectively, is close to dry crevasse depth of 18.4 ± 3.2 m. The third region spans 370 m and is located 15.7 km up-glacier from the main crevasse field at an elevation of 1714 m (Figs 3b–d). The minimum water table depth ranges from 18.7 m to 33.6 m which is within 1.0 m of dry crevasses with a maximum depth of 17.25 ± 2.75 m. This region corresponds with the up-glacier firn aquifer extent in 2010 and 2012–13. In 2015–17 the firn aquifer extended 4.3 km further inland, reaching an elevation of 1770 m, the final 2.8 km is located in an extensional stress regime with dry crevasse depths ranging from 14 to 17 m. The water table in this area was consistently below dry crevasse depths with OIB reported depths of 26.8–39.7 m and field measurements of 24 m at s1 and 20 m at s2 (Figs 3c, d).
Sensitivity to parameter values
Here we report the range of dry crevasse depths that would be obtained with other plausible parameter values different than our base case. A low-density firn layer reduces the lithostatic compressive stress acting to close the crevasse, and produces deeper crevasses than for a constant ice density. We used a depth varying density profile with ρ s = 400 kg m−3, a crevasse spacing of 50 m, and fracture toughness K IC = 0.1 MPa m1/2 to obtain the results presented in the previous section (black line in Fig. 4a). If we instead used a constant ice density, ρ i, of 917 kg m−3, under an applied stress σ 1 = 45–250 kPa, dry crevasses would be 4.7–8.8 m (61–27%) too shallow. Alternatively, a lower ρ s of 300 kg m−3 would produce dry crevasses 1.6–2.5 m (20–8%) deeper than our base case (Fig. 4).
The influence of multiple closely spaced crevasses, however, shields each crevasse from the far-field resistive stress acting to open the crevasse, and produces shallower crevasses than for a single crevasse. Crevasses become shallower as they are spaced closer together. For example, a single, isolated crevasse formed under an applied stress of 45–250 kPa would be 2.3–30.3 m (40–96%) deeper than our base case with a crevasse spacing of 50 m, whereas crevasses spaced 20 m apart would be 45–26% or 3.7–8.3 m more shallow (Fig. 4). Finally, larger values of K IC would produce shallower crevasses than our base case while increasing the minimum applied stress required for a crevasse to exist. For example, in our base case, K IC = 0.1 MPa m1/2, the minimum applied stress required for a crevasse to exist is 37 kPa. If instead K IC = 0.4 MPa m1/2, the minimum required stress for a crevasse to exist would increase to 107 kPa and crevasses shallower than 20 m in Figure 3d would not exist (Fig. 4). Overall, we find that plausible parameter values are likely to change our resulting dry crevasse depth by up to 20 m (Fig. 4). This uncertainty increases with background stress and, at higher stresses, is asymmetric in depth: crevasses may be up to 20 m deeper than our base case, but no more than 10 m shallower.
Crevasse opening and distribution
GNSS station observations
We report on data from the three up-glacier-most center-line stations from our strain-diamond deployment. The two up-glacier-most GNSS stations, HLM8 and HLM6, captured crevasse opening on 25 June 2023, within 3 d of the onset of melting at our field site (Fig. 5). MERRA-2 air temperatures for our study area remained above 1$^\circ$ C from 24 to 28 June 2023, marking the first multi-day period with above-freezing air temperatures for the 2023 melt season (Fig. 5a; additional details in Appendix A; Rienecker and others, Reference Rienecker2011; M2SDNXSLV; Global Modeling and Assimilation Office, 2015). This warm period coincided with an abrupt increase in the strain rate between the station pair HLM8–HLM6, whereby the strain rate increased from 0.057 to 0.877 a−1 between 13.30 and 19.30 local time (02.00 UTC) on 25 June 2023. This strain corresponds to a lengthening of 3.4 ± 2.0 cm over the 790.3 m length span between stations. The abruptness of the lengthening makes it unlikely to be caused by viscous stretching of the ice. We consider the alternative interpretation, that this signal resulted from fracture, the opening of a 3.4 ± 2.0 cm wide crevasse located at some position between stations HLM8 and HLM6. This fracture would have formed from an applied stress of 125–141 kPa (Fig. 5b), calculated with A for ice of $-10^\circ$
 C in (A1). We did not find multiple distinct opening events in the GNSS data, as would have been produced by several crevasses opening in quick succession, but we cannot completely rule out this possibility.
Crevasse opening during 2023 melt onset (a) MERRA-2 derived mean air temperature for our field site, the dashed line marks $0^\circ$ C, shading denotes daily minimum and maximum values with time reported in local time 02.00 UTC. (b) GNSS-measured strain rate between station pairs HEL8 to HLM6 (blue) and HLM6 to HLM5 (orange) with 15 min observations (points) and smoothed (lines) data. Right axis shows strain rates converted to stress in kPa.
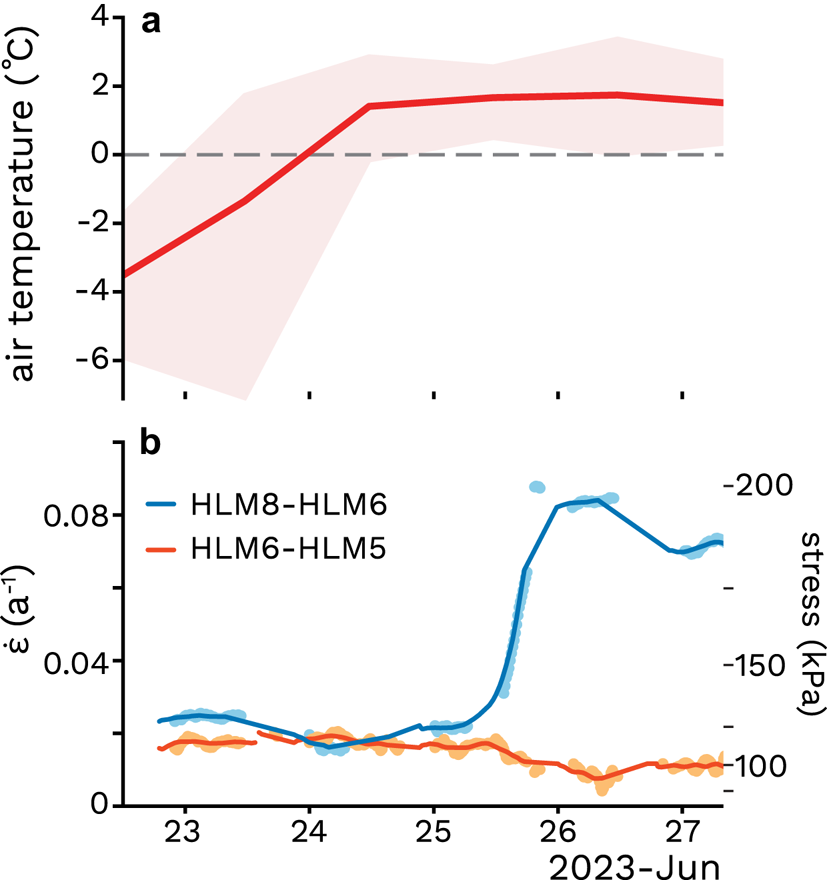
The jump in the strain rate detected by HLM8–HLM6 was not reflected in the measurements by the down-glacier station pair HLM6–HLM5. Over this same time period, strain rates between HLM6–HLM5 slightly decreased from 0.0157 to 0.0093 a−1. We did not observe any significant net lengthening between stations HLM6–HLM5 accompanying the change in strain rates during the crevasse opening event which amounted to 0.5 mm over the 896.2 m length span between stations, which is below our measurement confidence. Therefore, we interpret strain rates between HLM6–HLM5 during this period as representative of typical slow viscous deformation.
Crevasse distribution
Crevasses with whaleback dunes (Fig. 2) are abundant in our study area of Helheim Glacier. Large whaleback dunes form on the downwind side of crevasses, where wind-blown snow is deposited on the discontinuity produced by the crevasse, to create dunes that then sinter in place and can achieve lengths exceeding 100 m. These whaleback dunes have been identified in OIB Digital Mapping System imagery by Poinar and others (Reference Poinar2017), we therefore have some confidence in extrapolating them to smaller, sub-WorldView-pixel-scale crevasses. Because crevasses are required for the formation of whaleback dunes on Helheim Glacier (henceforth referred to as simply dunes), the presence of a dune without an observable crevasse suggests that either the crevasse is <0.4 m wide and is therefore undetectable on satellite imagery or the crevasse had formed then subsequently closed between the time of formation and image acquisition. Dunes with and without visible crevasses have similar orientations and geometries to each other (Fig. 6c) and with the median wind direction during high wind speed events (>15 m s−1) recorded by the PROMICE weather station NSE (Appendix A; Fausto and others, Reference Fausto2021; How and others, Reference How2022; Steffen and others, Reference Steffen2022). The shorter lengths of dunes with visible crevasses can be attributed to our conservative approach in delineating dunes without visible crevasses producing calculated geometries for the larger dunes in dune fields (Fig. 6b). The close spacing of large crevasses on Helheim glacier contributes to the shorter dune lengths because neighboring crevasses frequently truncate dunes created by crevasses upwind. We therefore use the criteria of dunes with lengths >100 m to distinguish dunes without visible nucleating crevasses.
Whaleback dune geometry. Whaleback dune examples (a) with and (b) without a visible crevasse in WorldView Imagery acquired on 28 March 2023. Annotations as in Figure 2. Dune geometry comparison for dunes with (blue) and without (orange) visible crevasses. The black arrow marks wind direction during high wind events at the PROMICE weather station NSE. (c) Dune orientation histogram as azimuth angle in degrees from north (0$^\circ$ ). Histograms for whaleback dune (d) length and (e) width in m.

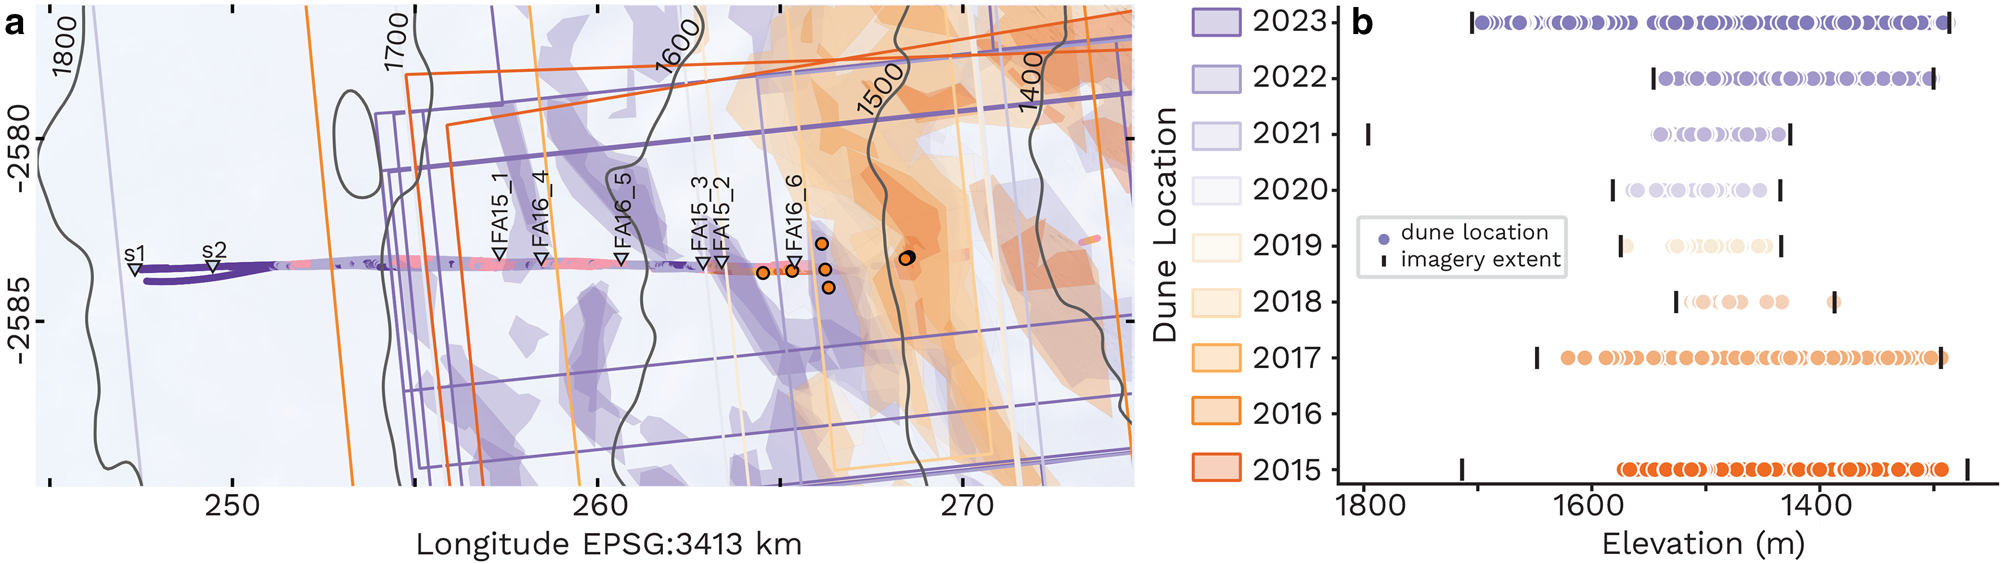
We observed dunes up to 13 km inland from our main crevasse in 2023 WorldView imagery, at elevations up to 1696 m (Fig. 7). The dunes were present in four WorldView imagery scenes acquired from 21 March through 8 September 2023; they were not present in the preceding scene captured on 12 April 2022, indicating dune field formation occurrence over the 344 d separating observations. Dunes maintained the same relative sizes and ~50 m spacing, and occupied the same areas in WorldView imagery acquired through 8 September 2023. Because the 2023 inland extent of dunes was limited by WorldView imagery bounds (Fig. 6), dunes may have been present further inland and at higher elevations than the 1696 m reported here during 2023.
Dune and crevasse locations in 2015–24. (a) Map view of dune and crevasse locations with imagery extent delineated by solid lines. Symbols as in Figure 1b for firn aquifer depth, borehole and GNSS station sites. (b) Dune and crevasse elevations in m above the WGS84 ellipsoid. Satellite imagery extent is marked by back bars.
Discussion
Our application of LEFM modeling to the crevasses in our study area shows that dry crevasses in sufficiently extensional stress settings can reach the depth of the firn aquifer water table, without the need for surface melt. When these crack tips reach the water table, the inflow of firn aquifer water is likely sufficient to hydrofracture to the bed (Poinar and others, Reference Poinar2017). Thus, we find that water table height and stress state determine whether a crevasse can hydrofracture to the bed, not surface melt as previously suggested by Poinar and others (Reference Poinar2017). Our observations of crevasse opening and the distribution of crevasse-nucleated whaleback dunes indicate crevasses are forming over the firn aquifer, but their narrow surface widths suggest they are not yet water-filled. While these crevasses are not presently draining the firn aquifer, future changes in the magnitude of the local stress regime or in water table height could produce the conditions required for crevasses forming in these higher-elevation areas to hydrofracture to the bed and drain the firn aquifer. As a result, the downstream boundary of the firn aquifer could migrate to higher elevations, allowing meltwater to access the bed in new, further inland regions. Given historical and ongoing climatic warming, the inland migration of firn aquifer draining crevasses is likely a continuous process whereby firn aquifer draining crevasses have migrated to their present locations over the past 40 + years since their formation in the 1980s (Miller and others, Reference Miller2020).
Requirements for firn aquifer drainage
Our results demonstrate that the drainage of firn aquifers requires a balance between (1) dry crevasse depth at the time of formation, (2) firn aquifer water table height and (3) an influx of water to the crevasse sufficient to drive the hydrofracturing process. Since Poinar and others (Reference Poinar2017) studied point (3), we focus on the first two requirements.
Controls on dry crevasse depth
The magnitude of applied stress exerts the strongest control on dry crevasse depth. We use primary principal strain rates calculated from 1995 to 2010 multi-year ice velocities (Joughin and others, Reference Joughin, Smith, Howat and Scambos2016) as representative surface strain rates over our study area. The calculated values of surface stress are likely a good approximation for the inland region of our profile where we expect the seasonal effects of subglacial hydrology and stress perturbations from downstream fractures to be minimal. Calculated surface stress values are likely too conservative in the 3–8 km region upstream of the main crevasse field, where hydrologic connections can induce transient changes to the stress field that are important in creating new fractures (Gudmundsson, Reference Gudmundsson2003), but are not captured by our calculated stress field. Induced stress perturbations would decay with distance from the hydrofractured crevasses where they originate to produce the highest magnitude stresses in the region closest to the crevasse field. Therefore, actual dry crevasse depths may be deeper than we predict, especially near known crevasse fields.
We find that the stress required to initiate fractures is 125–141 kPa, which is lower than observed in contexts such as on Vatnajökull Ice Cap in Iceland where the ice is overlying a cauldron (Ultee and others, Reference Ultee, Meyer and Minchew2020), but falls within the range of observations on polar ice sheets (Vaughan, Reference Vaughan1993; Cuffey and Paterson, Reference Cuffey and Paterson2010; Ultee, Reference Ultee2020). The values of surface stress presented here are calculated with the creep parameter A for ice of $-10^\circ$ C (Cuffey and Paterson, Reference Cuffey and Paterson2010, p. 73). For a given strain rate, the lower A values for colder, stiffer ice would produce a higher calculated stress, increasing our observed yield strength of ice and producing deeper crevasses. Conversely, the higher A values for warmer, softer ice would produce a lower calculated stress, decreasing our observed yield strength of ice and producing shallower crevasses. We would expect a similar effect for using variable A for a vertical temperature profile due to the warmer temperatures near the firn surface. For example, under an applied stress of 0.1 MPa our base case model calculates a 17.4 m deep crevasse, changing A to 9.3 × 10⁻²⁵ Pa−3 s−1 for $-5^\circ$
 C would lower the applied stress by 0.028 MPa (28%) and reduce crevasse depth by 3.9 m (22%). We would therefore expect the formation of shallower dry crevasses for warmer ice/firn temperatures.
For the purposes of determining if a dry crevasse will reach the depth of a firn aquifer's water table, it is important to consider the effect of low-density firn layer which can increase dry crevasse depth by up to 67%, however, the exact surface density value used is less important. Interspersing higher-density ice layers within the firn pack increases ice density and produces a re-shallowing effect whereby dry crevasses are 4–20% shallower. Our results agree with the work of Clayton and others (Reference Clayton, Duddu, Hageman and Martinez-Paneda2024), who found the incorporation of a low-density firn layer can increase crevasse depth by up to 20% for a thin glacier (H≤250 m). Even though our work is applied to areas where the ice is thick (H≥1000 m) and the effect of a surficial firn layer will be minimized with depth, our focus on dry crevasse depth within the top 50 m of the ice sheet reveals a similar importance for incorporating the low density firn layer in LEFM modeling.
We account for the presence of multiple closely spaced crevasses by considering the shielding effect of neighboring crevasses that dampens the far-field stress concentration at the crack tip (Sassolas and others, Reference Sassolas, Pfeffer and Amadei1996). Without accounting for the effect of multiple crevasses, calculated dry crevasse depths would be 40–90% too deep and would overpredict where crevasses should intersect the firn aquifer water table. Crevasse fields with a greater spacing between neighboring crevasses would produce deeper crevasses which may increase the likelihood of intersecting the aquifer water table. However, lower applied stresses would be required for these crevasses to reach the same depth as another area with more closely spaced crevasses. Crevasses located on the outer boundaries of a crevasse field can penetrate slightly deeper because they are only shielded on one side (Clayton and others, Reference Clayton, Duddu, Siegert and Martínez-Pañeda2022), potentially aiding the up-glacier-most crevasses in reaching the water table to initiate hydrofracture.
An increase in the fracture toughness of ice increases the applied stress required for the crevasse to exist and reduces dry crevasse depth by 61–15% for applied stresses of 107–250 kPa. For K IC = 0.1 MPa, including a low-density firn layer reduces the applied stress required for a crevasse to exist by <27% (33–45 kPa) for a single crevasse, or 24% (35–46 kPa) for crevasses spaced 50 m apart. If the fracture toughness of ice is increased to 0.4 MPa m−2 an applied stress 2.9 times larger, of 107 kPa, is required for a crevasse to exist under the same conditions (Fig. 4).
We find that our LEFM model produces deeper crevasses than the Nye depth (Fig. 11 in Appendix C) where crevasse depth is calculated as T/ρ ig where T is the traction stress acting to open the crevasse (Nye, Reference Nye1954; Weertman, Reference Weertman1977). This result is expected and aligns with the analysis of van der Veen (Reference van der Veen1998) as the Nye depth uses a constant ice density and is insensitive to crevasse spacing. For an applied stress of <125 kPa the Nye criterion is similar to the model scenario with a constant ice density (Fig. 4a); for applied stresses between 125 and 225 kPa the Nye criterion is similar to the model scenario where K IC = 0.4 MPa m1/2. While LEFM models do not capture the visco-elastic deformation of ice which can be important when considering hydraulically driven crevasse propagation (Hageman and others, Reference Hageman, Mejía, Duddu and Martínez-Pañeda2024), we find its application to the initial depth of dry crevasses is a significant improvement to the simple Nye depth formulation.
Influence of firn aquifer hydrology on hydrofracture initiation
For a crevasse to drain the firn aquifer it must penetrate deep enough to reach the water table which supplies the water necessary to drive crevasse hydrofracture to the bed (Poinar and others, Reference Poinar2017). The firn aquifer water table height responds to the magnitude of surface melt supplied as recharge and the horizontal flux of water within the saturated zone as it is transported downslope following the hydraulic gradient until draining into downstream crevasses. The firn aquifer water table varies over seasonal and interannual timescales; thus, the critical dry fracture depth is also time-variable. The water table height is closely tied to the slope of the snow surface, such that in steep areas the water table is deeper and in less steeply sloping areas the water table is shallower (Miège and others, Reference Miège2016). The depth to water table in low-slope areas is consistently the shallowest along our profile and these areas experience more temporal variability than steeper areas do (Figs 3c, d).
On interannual timescales, aquifer water table height varies at a rate similar to that of surface mass loss (Miège and others, Reference Miège2016; Chu and others, Reference Chu, Schroeder and Siegfried2018), whereby the water table height increases during high melt intensity years and falls during subsequent years (Miège and others, Reference Miège2016; Meyer and Hewitt, Reference Meyer and Hewitt2017; Poinar and others, Reference Poinar2017). Notably, 2010–17 OIB detected water table locations demonstrate the aquifer's water table can vary by over 10 m between years at a single location (Fig. 3). Crevasses formed during years with high magnitude melting would be more likely to hydrofracture and drain the firn aquifer.
On seasonal timescales, meltwater recharge to the aquifer can raise the water table by up to 4 m (Miller and others, Reference Miller2020), peaking in September after the end of the melt season. This lag between peak melting and peak water table height likely reflects the lateral (downslope) flow of water within the aquifer that continues after surface melting ceases for the year (Miège and others, Reference Miège2016). A seasonal increase in water table height of a few meters could determine whether a dry crevasse can hydrofracture to the bed, particularly in the three regions identified as potential future aquifer drainage locations in Figure 3. The timing of dry crevasse formation may therefore play an important role in determining the inland migration of aquifer drainage because dry crevasses are deepest immediately following their formation, before creep closure causes the crevasse to shrink. The June 2023 crevasse opening event should have preceded the period of rising water table which may have prevented this crevasse from intersecting the water table. Crevasses that instead form during the fall may have an increased likelihood of reaching the water table and hydrofracturing due to the higher water table from the full integrated melt accumulated over the summer and the absence of snowfall. Although surficial meltwater discharge into crevasses has been suggested as a requirement to begin firn aquifer drainage, we find that dry crevasses can penetrate the water table upon formation to immediately initiate hydrofracture. Therefore, the timing of firn aquifer drainage would not be constrained to the melt season but would still require the stress conditions conducive to fracturing.
Inland migration of firn aquifer drainage
The downstream boundary of the firn aquifer in our study area has been relatively steady (fluctuating ±2 km) since 2010 (Miège and others, Reference Miège2016). Similarly, the locations of the widest crevasses, which are hypothesized to drain firn aquifer water to the bed, have also been relatively steady (±1 km) since 2010 (Fig. 1b; Poinar and others, Reference Poinar2017). Firn aquifer drainage has been thought to require surface-generated meltwater to begin the hydrofracturing process that then continues when crevasses penetrate deep enough to access aquifer sourced discharge (McNerney, Reference McNerney2016). However, our modeling results indicate that surface generated meltwater is not required to begin hydrofracturing, instead surface stresses can produce dry crevasses deep enough to intersect the firn aquifer water table. Crevasses that intersect the firn aquifer could immediately access the water required to initiate hydrofracture, regardless of the seasonal timing or availability of surface melt. Furthermore, our observations of crevasse-nucleated dunes and narrow crevasses at higher elevations than crevasses draining the firn aquifer indicate crevasses are forming in these further inland regions, but they may not propagating deep enough to intersect the water table. In this case, an increase in either the surface stresses or the aquifer water table height could enable firn aquifer drainage at higher elevations if they hydrofracture to the bed. Alternatively, if high-elevation crevasses are not supplied with enough water to hydrofracture to the bed and instead refreeze englacially they would warm the surrounding ice which could reduce the rate of refreezing for downstream hydrofractures while also increasing deformational ice motion (Poinar and others, Reference Poinar2017; Chandler and Hubbard, Reference Chandler and Hubbard2023).
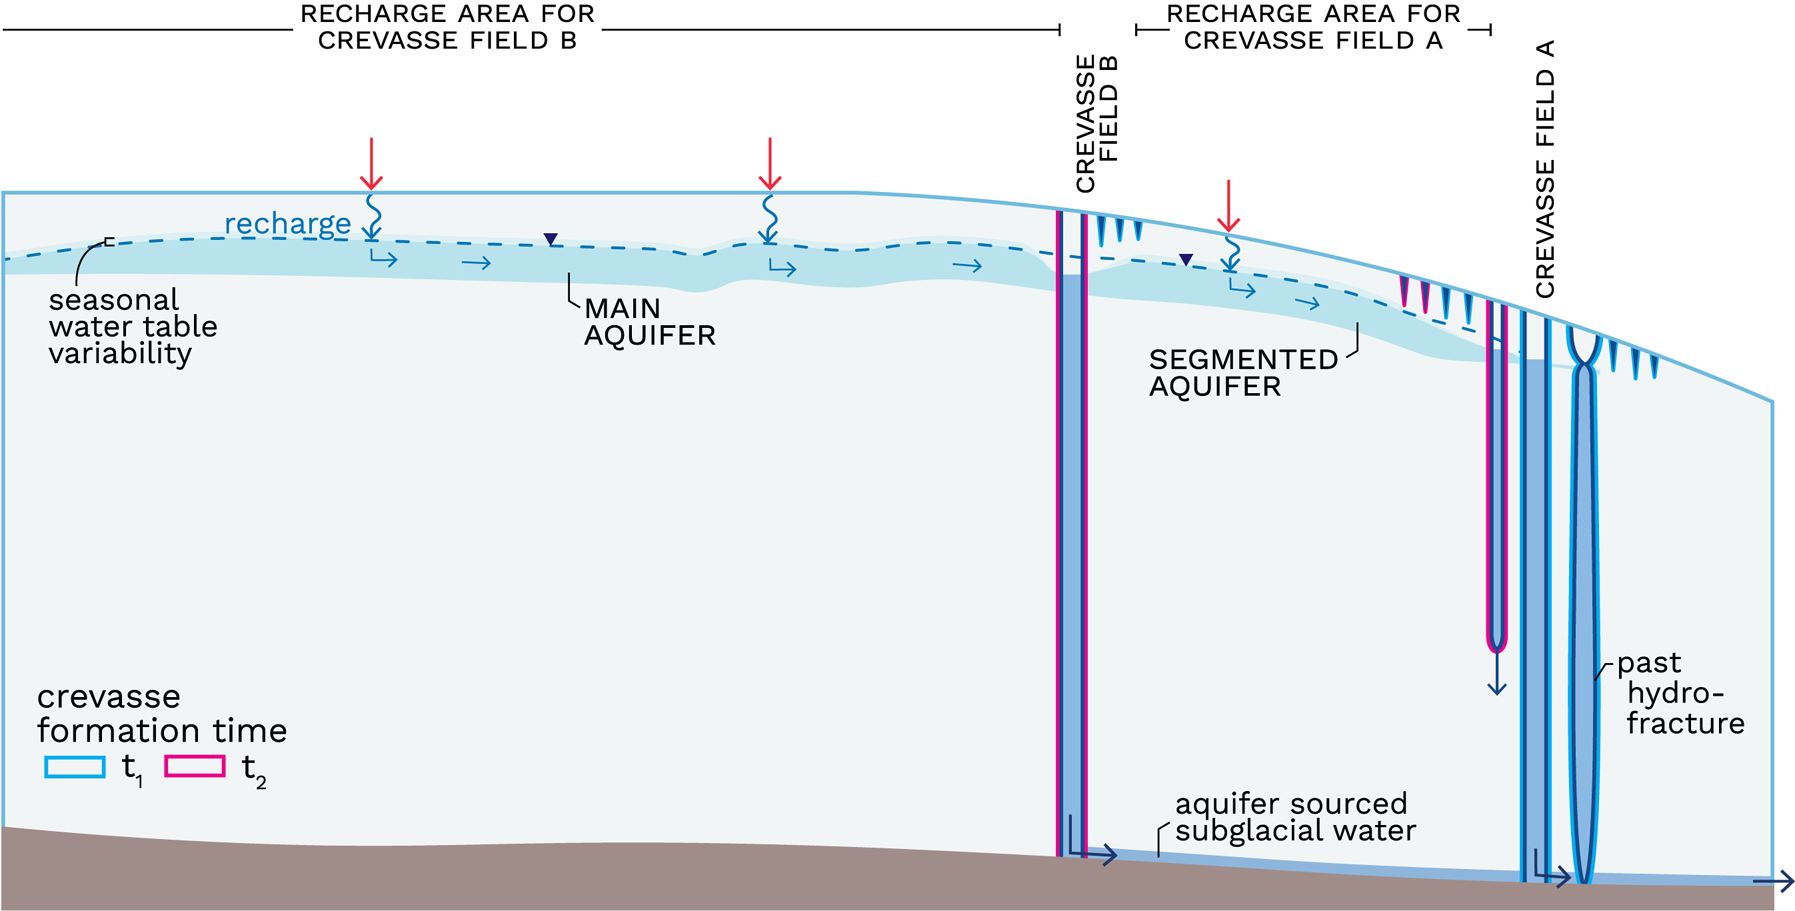
Along our transect on Helheim's southern branch, we identified three areas as potential future aquifer drainage locations where dry crevasses either reach or come within a meter of the OIB water table height (Figs 3c, d). Crevasses formed in these areas could hydrofracture given a small (<1 m) increase in water table height, which is within the bounds of the expected seasonal and interannual variability of up to 4 and 10 m, respectively (Miège and others, Reference Miège2016; Miller and others, Reference Miller2020). In response to the inland migration of firn aquifer draining crevasses, the firn aquifer could either recede inland and abandon downstream crevasses or the aquifer could become segmented such that smaller aquifers occupy compressional areas and drain into downstream crevasses (Fig. 8). We would expect the latter scenario as long as the region between full-thickness crevasses is sufficiently large and maintains a thick firn layer, so that sustained aquifer recharge between crevasse fields can keep the smaller aquifers intact. This concept of a segmented firn aquifer is consistent with observations of small, isolated firn aquifers located between crevasse fields at lower elevations (Miège and others, Reference Miège2016).
Conceptual model of the inland migration of firn aquifer drainage from crevasse field A to crevasse field B with segmented aquifer development between the two crevasse fields. Crevasses are outlined according to formation time with time t 1 (cyan) and time t 2 (magenta). Black inverted triangles denote water table surface and arrows trace melt water movement from the surface, through the aquifer, crevasse and subglacial drainage system.
The inland migration of firn aquifer drainage would allow aquifer-sourced water to reach new areas of the bed to affect the structure of, and pressures within, the subglacial drainage system that controls sliding. In a scenario where full-thickness crevasses form in region 1 (Fig. 3), water would enter the subglacial drainage system 7.8–11.6 km further inland than it currently does. The movement of the injection point would increase subglacial water pressure at the inland location while potentially decreasing pressures downstream according to idealized simulations by Poinar and others (Reference Poinar, Dow and Andrews2019), which suggested that this change in water pressure is long-lasting (>4 years). However, how the downstream subglacial drainage system will respond to the inland migration of firn aquifer drainage is unresolved. We would expect subglacial pressurization, and therefore elevated ice velocities, to expand inland resulting in a larger area exposed to higher subglacial water pressures than at present. The increased basal lubrication and higher sliding speeds would likely raise wintertime or ‘background’ sliding speeds that are used as a baseline to measure seasonal, melt-induced velocity changes against (Sommers and others, Reference Sommers2023). Consequences of higher winter sliding speeds, in terms of ice-sheet mass loss, could be magnified as firn aquifer drainage migrates further inland and as higher wintertime velocities persist if they are not compensated for by summertime slowdowns at lower elevations.
These surface-to-bed connections are particularly important because firn aquifers have expanded and can continue to expand inland under enhanced melting (Miège and others, Reference Miège2016; Steger and others, Reference Steger, Reijmer and Van Den Broeke2017a; Horlings and others, Reference Horlings, Christianson and Miège2022). By constraining the conditions required for crevasses to drain firn aquifers, dry crevasse depth and aquifer water table height, we find that the location of aquifer-draining crevasses can migrate inland. Furthermore, the detection of crevasse formation over the firn aquifer suggests the process of the inland firn aquifer drainage migration may already be underway. For these reasons, future work should assess the impact of firn aquifer drainage at higher elevations on subglacial hydrology, ice dynamics, and downstream ramifications such as the potential for changes in subglacial discharge to affect fjord biogeochemistry (Hawkings and others, Reference Hawkings2015).
Conclusions
Our findings suggest that crevasses formed over a firn aquifer on Helheim Glacier can reach the water table depth to initiate hydrofracture without direct surface melt inputs. We identify inland areas that are the most vulnerable to full-thickness hydrofracture given rises in the firn aquifer water table, increases in surface stresses or both. These full-thickness crevasses would drain aquifer water to the bed at new inland locations, moving the downstream boundary of the aquifer inland. This inland expansion may be underway as evidenced by our in situ observations of a crevasse opening event 4 km from the main crevasse field and of crevasse-nucleated whaleback dunes expanding 14 km inland from the main crevasse field in 2023. New surface-to-bed connections at even higher elevations than those observed presently would allow meltwater to access new regions of the bed with potentially significant impacts on downstream subglacial hydrology, ice sliding velocity.
Supplementary material
The supplementary material for this article can be found at https://doi.org/10.1017/jog.2024.78.
Acknowledgements
This study was supported by the Heising-Simons Foundation grant Nos. 2020-1909, 2020-1910 and 2020-1911 as well as by the Army Research Office No. 78811EG (CRM). We thank M. Coyle, R. Mansfield, L. Stearns, I. McDowell, C. Shafer, A. Tarzona, T.J. Young, R. Clavette and E. Horlings for their contributions to fieldwork. We also thank pilots Jean-Marie Bärtsch, Samuel Müller and Tim Nicolaisen of GreenlandCopter for their support during field endeavors. Geospatial support for this work provided by the Polar Geospatial Center under NSF-OPP awards 1043681, 1559691 and 2129685. ArcticDEM v4.1 provided by the Polar Geospatial Center under NSF-OPP awards 1043681, 1559691, 1542736, 1810976 and 2129685. Data from the Programme for Monitoring of the Greenland Ice Sheet (PROMICE) are provided by the Geological Survey of Denmark and Greenland (GEUS) at http://www.promice.dk.


 Open access