


Introduction
The surveillance of geodynamic phenomena, and particularly of active volcanoes, represents one of the greatest scientific challenges of our time. Continuous and precise monitoring of tectonically and volcanically active regions is essential for effective mitigation of hazard. Among the most direct and quantitative approaches to this end, ground displacement monitoring is recognized as a primary volcanological observation methods (Donovan et al. Reference Donovan, Oppenheimer and Bravo2012), especially in environments where eruptive activity, although sporadic, may trigger high-risk emergencies. Indeed, deformation measurements provide critical insights into the location, depth, geometry and - most importantly - rate of stress accumulation within the magmatic system. Consequently, accurate displacement monitoring is fundamental for anticipating volcanic unrest, evaluating hazards and implementing efficient early-warning procedures.
The increased pressure on the lithosphere produced by an injection of magma generates a deformation that propagates to the surface with a magnitude that depends on the homogeneity of the medium and existing geological structures (Tibaldi Reference Tibaldi2015) from a few millimetres to metres of displacement in a volcanic unrest process or a brady seismic component that is maintained over time (Dzurisin Reference Dzurisin2007). Therefore, ground deformation constitutes a crucial proxy for tracking subsurface magmatic processes.
Over recent decades, geodetic techniques have advanced considerably. In particular, Global Navigation Satellite Systems (GNSS) have revolutionized geodynamic monitoring due to their ability to record crustal motion with high temporal resolution, millimetric precision and at high sampling rates. In addition, Interferometric Synthetic Aperture Radar (InSAR) techniques provide ground deformation maps measured by differences in the backscatter phase signal between two or more images limited by the acquisition time interval over a given area (Dzurisin Reference Dzurisin2007). Hence, GNSS-measured ground displacements have high temporal resolution, whereas InSAR enables the measurement of ground displacements with high spatial resolution. Thus, GNSS provides superior temporal resolution, and InSAR complements this with enhanced spatial coverage.
Most volcanic areas are related to regional tectonics. Volcanism is correlated with tectonics in arc and back-arc volcanism near subduction zones or in oceanic and continental spreading rifts (rift valleys; Wright et al. Reference Wright, Sigmundsson, Pagli, Belachew, Hamling and Brandsdóttir2012, Tibaldi & Bonali Reference Tibaldi and Bonali2017). Apart from hotspots, volcanism occurs near tectonic plate boundaries, and the ground deformation related to those processes should be acknowledged. A regional ground displacement velocities model and geotectonic reference frame are therefore essential. Determining ground displacement anomalies from the regional geotectonic reference frame (Taylor et al. Reference Taylor, Bevis, Dalziel, Smalley, Frohlich and Kendrick2008, Berrocoso et al. Reference Berrocoso, Fernández-Ros, Prates, García and Kraus2016) allows us to detect and define a geodynamic anomalous area subjected to active volcanism or active fault systems, among other causes.
In volcanic processes we distinguish between monitoring (non-real-time) and surveillance (near-real-time). Monitoring provides a posteriori time evolution of the volcano, which is essential for understanding the deep volcano structures and magmatic system. Surveillance provides the near-real-time process status. Depending on the promptness (minutes to days) required by the volcanic process, higher or lower precisions in the GNSS data processing can be obtained (Berrocoso et al. Reference Berrocoso, Prates, Fernández-Ros and García2012, Prates et al. Reference Prates, Berrocoso, Fernández-Ros and García2013a). Maximizing both promptness and precision are the main problems in the design of GNSS networks, in the adequacy of techniques and methods for data processing and analysis and in the selection of the appropriate ground deformation observable.
Nevertheless, the deployment of such sophisticated GNSS systems in remote, isolated and harsh environments still poses major logistical challenges. Recent developments in autonomous energy supply, wireless communications and data storage have enabled the transition towards permanent monitoring infrastructures and near-real-time analytical workflows.
Deception Island and its surroundings have been a natural laboratory since 1987 (i.e. almost from the start of GNSS availability), enabling the sequential development of a holistic approach to assessing volcano activity that involves a 1) regional tectonics model and geotectonic reference frame for the 2) volcano monitoring (non-real-time) of deep structures and magmatic system detection, the knowledge of which forms the basis for 3) volcano surveillance (near-real-time) and 4) volcanic hazard forecasting. Located in a highly complex plate interaction environment involving the South American and Antarctic major plates and the Scotia, Phoenix and South Shetland minor plates, Deception Island constitutes an exceptional setting for studying lithospheric dynamics and subduction-related volcanism in the Bransfield Strait.
Here, we present the results from more than 2 decades of continuous GNSS observations on Deception Island, processed using combined real-time and post-processed strategies and validated through repeated field surveys. Special emphasis is placed on the period of increased activity detected between 2012 and 2015. Furthermore, the integrated perspective adopted in this study provides a dual benefit: on the one hand, it enhances the understanding of the regional geodynamic framework across the South Shetland Islands, and, on the other, it isolates with high precision the deformation signals strictly related to local volcanic dynamics.
Overall, Deception Island represents a paradigmatic example of the potential of GNSS as an advanced surveillance tool in remote volcanic settings. The continuous evolution of these observational systems undoubtedly strengthens early-warning capabilities and contributes to improved mitigation strategies where they are most critically needed.
Geodynamic context and geodetic network
The South Shetland Islands, north-west of the Antarctic Peninsula, are formed from an inactive volcanic arc and an active volcanic back-arc, parallel to each other and separated by a few tens of kilometres. The only three islands of the archipelago with active back-arc volcanism are Bridgeman Island, Penguin Island and Deception Island. Penguin Island and Bridgeman Island are small islands near King Jorge Island, whereas Deception Island near Livingston Island is the largest and most active volcano in the region, covering the Antarctic Peninsula, the Bransfield Basin and the South Shetland Islands (Fig. 1a; Smellie Reference Smellie2001, Pedrazzi et al. Reference Pedrazzi, Aguirre-Díaz, Bartolini, Martí and Geyer2014).
a. Map of the Bransfield Strait and South Shetland Islands showing the major regional faults. The South Shetland Islands included are King George, Nelson, Robert, Greenwich, Livingston, Deception, Snow, Low and Smith. Submarine volcanoes shown are Humpback, Three Sisters and Orca. The International GNSS Service station PALM (located at the US Palmer Base) used for geodetic processing is marked in red, and BEJC station (Livingston Island) is marked in blue. b. Map of Deception Island, detailing the location of all stations belonging to the local REGID (Geodetic Network for Geodynamic Studies on Deception Island) monitoring network. The point symbology is colour-coded according to the year of construction of each benchmark. Maps were generated using the Quantarctica package for QGIS from the Norwegian Polar Institute: https://npolar.no/quantarctica/toggle-id-6.

This region is defined by a highly intricate and unique geotectonic setting, where two major tectonic plates converge (the South American and the Antarctic plates) and three minor tectonic plates engage (the Scotia, Phoenix and South Shetland plates; Fig. 1a; Galindo-Zaldívar et al. Reference Galindo-Zaldívar, Gamboa, Maldonado, Nakao and Bochu2004, Maestro et al. Reference Maestro, Somoza, Rey, Martinez-Frias and Lopez-Martinez2007). At the South Shetland Trench (i.e. the Antarctic-Phoenix boundary), the recent convergence rate was inferred as close to 10 mm/year and accredited both to the north-north-west to south-south-east Bransfield Basin back-arc extension and Phoenix Plate subduction or shortening (Dietrich et al. Reference Dietrich, Rülke, Ihde, Lindner, Miller and Niemeier2004, Maestro et al. Reference Maestro, Somoza, Rey, Martinez-Frias and Lopez-Martinez2007, Taylor et al. Reference Taylor, Bevis, Dalziel, Smalley, Frohlich and Kendrick2008, Jiang et al. Reference Jiang, D.-C, Zhan and Liu2009). Regional seismic data also suggest that seismicity in the region is related to the slow subduction of the young lithosphere, transcurrent plate boundaries, rifting and active volcanism (Robertson et al. Reference Robertson, Wiens, Shore, Smith and Vera2002).
Recent GNSS-based modelling of regional deformation fields in the South Shetland-Antarctic Peninsula-northern Antarctic region has demonstrated the significant geodynamic impact of the Orca submarine volcano. These models offer spatially explicit insights into surface displacement, stress and strain patterns, and they reinforce the understanding of crustal deformation driven by both tectonic and magmatic processes at a regional scale (Rosado et al. Reference Rosado, Jiménez, Pérez-Peña, Martín, de Gil and Carmona2025). Additionally, long-term seawater temperature records from Livingston and Deception islands have been fundamental to establishing oceanographic baselines. These measurements contribute to the interpretation of geothermal trends and anomalies, supporting the integration of geodetic, seismic and thermal observations within a holistic volcanic monitoring approach for the region (Luengo-Sánchez et al. Reference Luengo-Sánchez, Rosado, Jiménez-Morales, de Gil, Gómez-Enríquez, Bruno and Berrocoso2025).
The South Shetland Trench also has a left-lateral component (Fig. 1a) that extends to the left-lateral South Scotia Ridge (i.e. the Antarctic-Scotia boundary; Maestro et al. Reference Maestro, Somoza, Rey, Martinez-Frias and Lopez-Martinez2007), related to the regional north-eastwards movement of the Antarctic Plate. In addition to plate subduction and slab rollback associated with the slow subduction rate, the South Scotia Ridge propagation south-westwards related to left-lateral simple-shear coupling relating the Antarctic and the Scotia plates may also contribute to the Bransfield Basin transtensional stress (González-Casado et al. Reference González-Casado, Giner-Roles and López-Martinez2000, Fretzdorff et al. Reference Fretzdorff, Worthington, Haase, Hékinian, Franz, Keller and Stoffers2004).
Deception Island is a horseshoe-shaped stratovolcano whose major volcano-tectonic feature is a central submerged depression that has been conventionally defined as a collapse caldera (Smellie, Reference Smellie2001) or related to progressive passive normal faulting (Marti et al. Reference Marti, Vila, Rey, McGuire, Jones and Neuberg1996). Recent studies suggest that it was formed as a result of the explosive eruption with strong regional tectonic control that controlled pre- and post-caldera volcanism on the island, which took place between ca. 8300 and 3980 years BCE. Deception Island has undergone several confirmed volcanic eruptions in the last 200 years (Fig. 1b; Bartolini et al. Reference Bartolini, Geyer, Martí, Pedrazzi and Aguirre-Díaz2014, Pedrazzi et al. Reference Pedrazzi, Németh, Geyer, Álvarez-Valero, Aguirre-Díaz and Bartolini2018), of which the most recent occurred from 1967 to 1970 (Roobol Reference Roobol1980, Pedrazzi et al. Reference Pedrazzi, Aguirre-Díaz, Bartolini, Martí and Geyer2014). Today, evidence of major volcanic activity at the surface consists of: the occurrences of fumarolic emissions in Whalers Bay and Fumarole Bay at 100°C and 70°C, respectively; hot soil in Cerro Caliente at 100°C; and thermal springs in Whalers Bay and Pendulum Cove at 45°C and 65°C, respectively (Fig. 1b). Remarkable seismic activity has also been registered reflecting basin extension, the subduction process and volcanism, most of which being shallow and of low energy (Carmona et al. Reference Carmona, Almendros, Serrano, Stich and Ibáñez2012). Geomagnetic, gravimetric and seismic refraction studies support the existence of magma beneath the submerged caldera at a depth of ~2 km (Muñoz-Martín et al. Reference Muñoz-Martín, Catalán, Martín-Dávila and Carbó2005, Zandomeneghi et al. Reference Zandomeneghi, Barclay, Almendros, Ibañez, Godoy, Wilcock and Ben-Zvi2009).
In the 1998–1999 campaign, a seismic-volcanic unrest occurred along with a significant increase in seismicity in the north-west area of the island. The hypocentre depths of those events were ~1 km. The seismicity included volcano-tectonic earthquakes, long-period events and volcanic tremors, and the energy released was significantly higher than that calculated in previous campaigns, with Richter scale magnitudes of 3–4 detected (Ibáñez et al. Reference Ibáñez, Carmona, Almendros, Saccorotti, del Pezzo, Abril and Ortiz2003). It must be noted that only seismic monitoring was available, since only in the 1995–1996 campaign had GNSS data been acquired there. In December 1999, a multidisciplinary campaign for geophysical and geodetic data acquisition was undertaken. As a result, it became clear that there had been a reactivation of the volcanic activity on the island, indicated by increased seismic activity and ground deformation, changes in the volume and composition of gases and detected gravimetric and geomagnetic anomalies. These data have been interpreted as indicating the intrusion of young magma between 0.5 and 1.0 km deep, altering the geothermal and geodynamic balance of the island (Garcia et al. 2002). Ground deformation in that period showed extension of ~40 cm from 1995–1996 to 1999–2000 and significant uplift (Berrocoso et al. Reference Berrocoso, Fernández-Ros, Ramírez, Salamanca, Torrecillas, Pérez-Peña, Capra and Dietrich2008). From then on, Deception Island volcano monitoring became permanent, mainly based on seismicity (Carmona et al. Reference Carmona, Almendros, Serrano, Stich and Ibáñez2012) and ground displacement (Berrocoso et al. Reference Berrocoso, Prates, Fernández-Ros and García2012, Prates et al. Reference Prates, Berrocoso, Fernández-Ros and García2013a), and later also based on thermal data (Peci et al. Reference Peci, Berrocoso, Fernández-Ros, García, Marrero and Ortiz2014, Berrocoso et al. Reference Berrocoso, Prates, Fernández-Ros, Peci, de Gil and Rosado2018). Prior to the establishment of continuous GNSS monitoring, ground deformation was periodically assessed using traditional geodetic techniques such as electronic distance measurement and precise levelling. In the 2014–2015 campaign, seismic activity increased significantly compared to previous campaigns since 1999. This increase in activity resulted in a change in the alert level to yellow for the Deception Island volcano (Almendros et al. Reference Almendros, Carmona, Jiménez, Díaz, Lorenzo, Berrocoso and Venzke2015). A few thousand volcano-tectonic earthquakes were registered, together with a high intensity and frequency of long-period seismicity, as were regional events located south-east of Livingston Island, between December 2014 and April 2015. This crisis was the consequence of a deep intrusion that modified the stress field of the entire volcano.
The intrusion process began earlier than these recordings, according to deformation data. A significant and highly variable level of seismic activity has been recorded, ranging from shallow low-energy earthquakes of magnitude 1–2 on the Richter scale (Carmona et al. Reference Carmona, Almendros, Serrano, Stich and Ibáñez2012), to a gradual increase in the number and energy of volcano-tectonic earthquakes and long-period seismicity, to intense seismic swarms on Deception Island and its surrounding areas. However, the increased thermal activity detected in 2012 and 2013 (Berrocoso et al. Reference Berrocoso, Prates, Fernández-Ros, Peci, de Gil and Rosado2018) and the ground deformation in 2019 and 2020, both forcing the volcano alert level to be raised, indicate that Deception Island has a highly active volcano.
To investigate the volcano-tectonic evolution of Deception Island, a high-precision geodetic network named REGID (Geodetic Network for Geodynamic Studies on Deception Island) was established during the 1989–1990 summer and has since been systematically expanded and improved (Rosado et al. Reference Rosado, Fernández-Ros, Berrocoso, Prates, Gárate, de Gil and Geyer2019). The network currently comprises 15 benchmarks distributed radially around Port Foster, the island’s inner bay, complemented by an external reference station on Livingston Island (BEJC, 36 km away; Fig. 1a) that provides a stable control point for distinguishing local volcanic deformation from regional tectonic trends (Berrocoso et al. Reference Berrocoso, Fernández-Ros, Prates, García and Kraus2016). The deployment of REGID was completed in three main phases, progressively incorporating improved geodetic monument designs, lighter and more energy-efficient GPS receivers and upgraded data transmission systems. Each benchmark consists of a reinforced concrete pillar anchored to permafrost with stainless-steel rods, as well as a precisely calibrated mount that ensures replicable antenna positioning during all observation campaigns.
The underlying model relies on high-precision positioning solutions. For the episodic sites, observations are obtained from periodic occupations, typically spanning 5–6 days per benchmark during each summer campaign. To guarantee data quality and minimize centring errors, the GNSS antenna centre position relative to the benchmark is strictly controlled using a specially designed forcing system. Since 2001, the core stations FUMA, PEND and BEGC on Deception Island have been continuously observed throughout the campaigns at a high frequency (1 Hz; Berrocoso et al. Reference Berrocoso, Fernández-Ros, Ramírez, Salamanca, Torrecillas, Pérez-Peña, Capra and Dietrich2008, Peci et al. Reference Peci, Berrocoso, Páez, Fernández-Ros and De Gil2012). These campaign positioning solutions, including the external reference BEJC, are processed relative to the International GNSS Service (IGS) reference benchmark PALM (Palmer Station, Anvers Island).
Over successive Antarctic campaigns, REGID has evolved into a comprehensive monitoring infrastructure that achieves millimetric precision in the detection of ground deformation. GPS observations are conducted mainly during the summer, when environmental conditions allow stable data collection. In contrast to the episodic sites, the BEGC, FUMA and PEND stations operate in a semi-continuous mode, forming a wireless transmission network that relays positional data in near real time to a control centre, allowing rapid assessment of surface deformation and volcanic activity (Peci et al. Reference Peci, Berrocoso, Páez, Fernández-Ros and De Gil2012, Rosado et al. Reference Rosado, Fernández-Ros, Berrocoso, Prates, Gárate, de Gil and Geyer2019). The radial geometry and long temporal continuity of REGID make it a cornerstone of the geodetic surveillance programme on Deception Island, providing the spatial framework for integrating complementary geophysical methods such as levelling, gravimetry and seismic monitoring (Carmona et al. Reference Carmona, Almendros, Serrano, Stich and Ibáñez2012). Overall, REGID constitutes one of the most extensive and enduring geodetic datasets in Antarctica, offering valuable insights into the coupling between regional tectonics, magmatic processes and surface deformation in an active volcanic environment.
Methodological overview
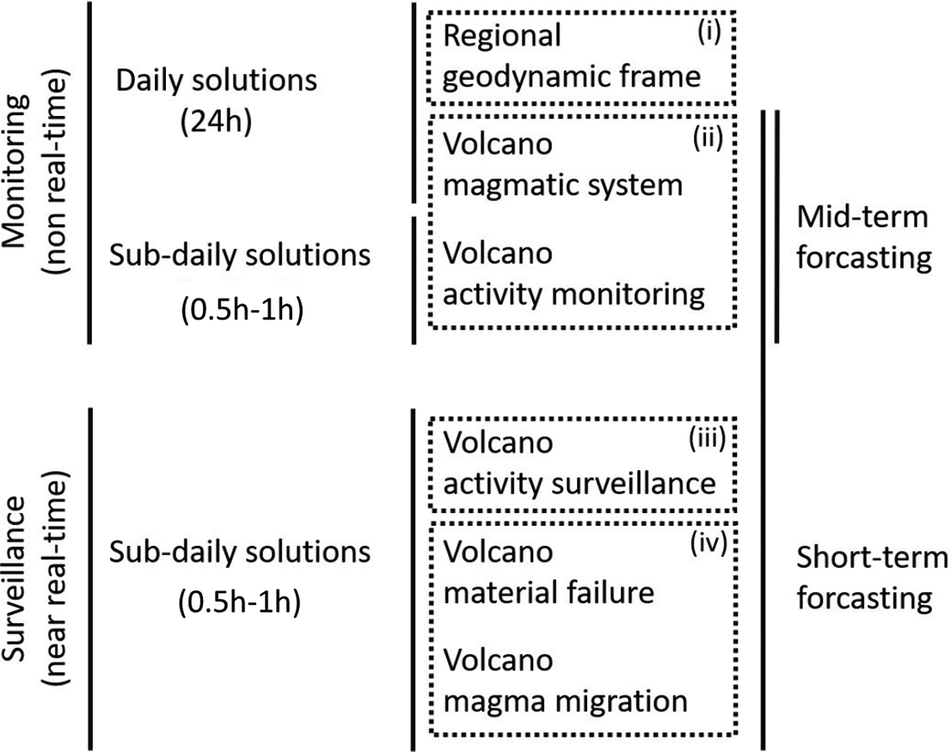
The methodology followed in this work is schematically summarized in Fig. 2. This structured approach provides the organizational framework for this section, sequentially integrating four fundamental components: 1) defining the geotectonic reference frame, 2) non-real-time monitoring for deep structure and magmatic system detection, 3) near-real-time activity surveillance and 4) the subsequent when-and-where hazard forecasting. The following subsections detail the specific procedures and techniques employed for data processing and analysis within each of these four steps.
Methodological approach to monitoring (non-real-time) and surveillance (near-real-time) and the following obtainables: (i) geodynamic frame, (ii) magmatic system and activity monitoring, (iii) activity surveillance and (iv) when-and-where hazard forecast.

Regional tectonics modelling
The IGS continuously operating stations’ network provides global geotectonic models defining the ground displacement of each tectonic plate relative to an appropriate geodetic reference system (Argus et al. Reference Argus, Gordon and DeMets2011, Altamimi et al. Reference Altamimi, Rebischung, Métivier and Collilieux2016). These stations represent the reference frame for regional GNSS networks and subnetworks. The ground displacement velocities obtained for these regional networks characterize regional geodynamics. Precise geodetically measured ground displacement velocities are useful to explain the geotectonic structures involved in tectonic processes.
Different GNSS data processing methods are applied to determine the ground displacement velocities from which regional geodynamic models are inferred. Both differential relative positioning (Vanicek et al. Reference Vaníček, Langley, Wells and Delikaraoglou1984) and precise point positioning (Zumberge et al. Reference Zumberge, Heflin, Jefferson, Watkins and Webb1997) are recommended. Precise point positioning does not require a continuously operating reference station in which the ground displacement is considered accurately known, as with differential relative positioning, which usually allows for greater precision. Therefore, ideally both should be applied to provide confirmation regarding the accuracy of the ground displacement velocities. For determining accurate geotectonic models, topocentric coordinate variations are the main observables. Scientific software packages, such as the Bernese GPS Software (Dach et al. Reference Dach, Hugentobler, Fridez and Meindl2007), should be applied for data processing. The best possible precision is required regardless of speed, so precise satellite ephemeris, clocks and code biases, ionospheric total electron content grids and Earth rotation parameters are integrated in the data processing (Dach et al. Reference Dach, Hugentobler, Fridez and Meindl2007). To further minimize atmospheric effects on signal propagation, the ionosphere-free combination, hourly estimates of tropospheric-delay corrections to the Saastamoinen model (Saastamoinen Reference Saastamoinen1972) and Neill mapping functions (Niell, Reference Niell1996) and a 10° cut-off angle are applied. Every other systematic error must be processed in agreement with the IGS standards, such as that of the Center for Orbit Determination in Europe accessed through the Bernese Processing Engine (Dach et al. Reference Dach, Hugentobler, Fridez and Meindl2007), including solid Earth tides and ocean tide loading (Scherneck Reference Scherneck1991).
Geodetic monuments and benchmarks must be constructed to ensure submillimetre-level accuracy in the GNSS antenna mounting, which is necessarily well rooted in the sediment if no bedrock is available and with an appropriate forcing system calibrated in the laboratory to mount the GNSS antenna. Furthermore, sites with clear skies and the absence of electromagnetic interferences should be preferred. Additional continuously operating stations and periodically observed benchmarks should also be considered to achieve the best possible spatial resolution, bearing in mind the different ground displacement velocity accuracies obtainable in each case, particularly on absolute vertical velocities, associated with atmospheric water vapour and hydrologic or snow mass seasonal loads, among other factors (He et al. Reference He, Montillet, Fernandes, Bos, Yu, Hua and Jiang2017). In the case of periodically observed benchmarks, the differential relative positioning processing method is preferable.
Ground displacement velocities are computed from the topocentric coordinate time series and separated into horizontal and vertical velocities. No geodetic network adjustment or compensation is applied to avoid the homogeneous distribution of the measured ground displacements among the observed sites. The complexity of the time series should only be related to the nature, status and evolution of the phenomenon studied. To accurately determine the ground displacement velocities, the topocentric coordinate time series are thoroughly analysed. Outliers are detected and removed from the time series depending on their dispersion relative to a least square linear fit (Rosado et al. Reference Rosado, Barbero, Jiménez, Páez, Prates, Fernández-Ros, Freymueller and Sánchez2016). Then, seasonal effects are computed in annual and semi-annual wavelengths while applying harmonic functions, and the Heaviside step function is applied correctly for time series offsets related to station configuration or reference frame discontinuities (Williams Reference Williams2008, Bevis & Brown Reference Bevis and Brown2014, He et al. Reference He, Montillet, Fernandes, Bos, Yu, Hua and Jiang2017). Therefore, time series with refined linear trends and offsets are obtained from which the ground displacement velocities are computed.
The anomalous ground displacement velocities can then be determined either from the regional geotectonic reference frame or from global models (Goudarzi et al. Reference Goudarzi, Cocard and Santerre2014). It is then possible to identify blocks from geodynamic patterns associated with an active volcano or with an active fault system (Taylor et al. Reference Taylor, Bevis, Dalziel, Smalley, Frohlich and Kendrick2008, Berrocoso et al. Reference Berrocoso, Fernández-Ros, Prates, García and Kraus2016). Patterns correlated with existing geodynamic activity can be further explained by computing strain maps, and these help us to infer the regional stress field (Segall Reference Segall2010).
Volcanic dynamics modelling
The anomalous displacement velocities from the regional geotectonic reference frame enable the modelling of volcano dynamics and deep structures. In general, patterns of inflation and deflation that interchange in time are detected. Therefore, shifts in ground displacement trends are usually observed in volcano dynamics monitoring, where ground displacements, even in absence of volcanic unrest, are considerably larger than in tectonic processes (Dzurisin Reference Dzurisin2007), apart from strong-motion earthquakes (Ikuta et al. Reference Ikuta, Satomura, Fujita, Shimada and Ando2012). Other phenomena to those driven by magma injection, such as acknowledged landslides, must be ruled out.
Integration of continuous stations and periodically surveyed benchmarks is more demanding if the time series show clear seasonal effects (He et al. Reference He, Montillet, Fernandes, Bos, Yu, Hua and Jiang2017), particularly in the vertical displacement component. Consequently, different precisions will be achieved depending on the ground displacement being measured by continuous stations or periodic surveys. However, the increased spatial resolution provided by periodically observed benchmarks benefit the volcano dynamics and deep structure identifications, such as dikes, magma pockets and magma chambers.
Deep structures and their evolution can be identified by applying inversion models, from the more basic Mogi point source hypothesis (Mogi Reference Mogi1958) and Okada linear source hypothesis or fault plane (Okada Reference Okada1985) in a homogeneous half-space to more complex models using finite elements that require knowledge of the existing structures from the surface to the magmatic system (Hickey & Gottsmann Reference Hickey and Gottsmann2014). The more complex the model, the more independent data (e.g. seismic, geological and petrological data) are required to achieve the convergence of these methods by constraining the inversion solution’s non-uniqueness.
For volcano monitoring (non-real-time), the applied GNSS data processing method is differential relative positioning. Therefore, the GNSS network requires the existence of one continuously operating reference station, not necessarily from the IGS global network. The reference station should be located close enough to the volcanic area but be unaffected by the volcano’s dynamics. The distance to the monitored volcano depends on the regional geography (e.g. island volcanism) and geodynamics, as the reference station ground displacement is considered accurately known. It is recommended to identify one or more control station(s) continuously operating but unaffected by volcano dynamics and with known ground displacement to discriminate ground displacement anomalies of non-volcanic origin at stations within the volcano’s area of influence.
Volcano near-real-time surveillance
Volcano surveillance in near-real time demands promptness, which adversely affects the precision of GNSS-measured ground displacement (Prates et al. Reference Prates, Berrocoso, Fernández-Ros and García2013a). GNSS data need to be continuously acquired and available in real time through continuous communication between continuously operating stations and the monitoring office where GNSS data processing and analysis are conducted. Possible such communication systems are the internet, wireless communication or telemetry. Promptness and internet availability limit the access to precise satellite ephemeris, clocks and code biases, ionospheric total electron content grids and Earth rotation parameters. Broadcasted ephemeris and medium-term predicted Earth rotation parameters (International Earth Rotation and Reference Systems Services (IERS) Bulletin A pole file, https://www.iers.org/IERS/EN/Publications/Bulletins/bulletins) are used instead.
Furthermore, GNSS data from the global IGS network or other regional networks are unavailable without internet access, which limits the distance that can be selected between monitored and reference stations such that they all might be inside the volcano dynamics-affected area, and therefore the reference station ground displacement cannot be accurately known. In this case, the slope distance or direct line distance is the ground deformation observable that is to be analysed. The selection of reference and monitored stations must reflect this limitation, considering the usual volcano dynamics that characterize changes in the deep magmatic system. Otherwise, topocentric coordinates are computed at sub-daily time intervals. Due to semi-diurnal and diurnal periodic effects on the sub-daily topocentric coordinates driven by the GNSS constellation’s orbital revolution and the gravitational motion of the Earth, Moon and Sun, these must be filtered out to reach to millimetre-level precision (Prates et al. Reference Prates, Berrocoso, Fernández-Ros and García2013a). The Kalman filter is an optimal linear filtering method in a minimum mean square error sense affected by Gaussian noise that should give similar measured and filtered averages at all time interval considered, after removing the phase shift that usually affects recursive filters (Kalman Reference Kalman1960, Prates et al. Reference Prates, Berrocoso, Fernández-Ros and García2013a,Reference Prates, García, Fernández-Ros, Marrero, Ortiz and Berrocosob).
From filtered topocentric coordinates the magnitude and inclination of the normal vector to triangle units can be computed. The normal-vector magnitude is an indicator of the compression or extension of the triangle unit (Fig. 3), while the normal-vector inclination is an indicator of relative uplift or subsidence between the three vertices. Several triangles may also be used to cover the volcano’s surface (Berrocoso et al. Reference Berrocoso, Prates, Fernández-Ros and García2012). Promptness is addressed by sub-daily measured slope distances of 30 min to 1 h. If internet access is available, topocentric coordinates are also computed with ultra-rapid (half-predicted) ephemeris and GNSS data from the reference and control stations outside the volcano dynamics-affected area, and the magnitude and inclination of the normal vector to triangle units are also computed (Berrocoso et al. Reference Berrocoso, Prates, Fernández-Ros and García2012). The advantage of the slope distance and the normal-vector analysis is that the movement of the reference station is part of both the baseline and triangle variations.
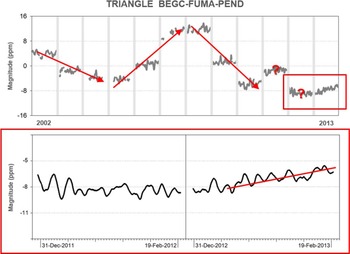
Deception Island non-real-time monitoring of volcanic activity. Normal-vector magnitude time series of the BEGC-FUMA-PEND triangle during summers (BEJC (Livingston Island) reference benchmark in the processing strategy). Volcano activity has shown alternating inflation/deflation periods of ~3 years. Mid-term forecasting is based on this acknowledged periodicity and the normal-vector magnitude trend from the last summer campaign.

Alternatively, topocentric coordinate time series can be filtered with wavelet multi-resolution techniques to determine the volcano activity level (Fig. 4; Ramirez et al. Reference Ramírez, Berrocoso, González, Fernández, Donner and Barbosa2008, Rosado et al. Reference Rosado, Barbero, Jiménez, Páez, Prates, Fernández-Ros, Freymueller and Sánchez2016). Wavelet analysis minimizes dispersion without losing relevant information that may correspond to significant ground deformation events. It is a local analysis technique in the time frequency domain that is effective in the study of non-stationary time series such as geodetic time series, enabling multi-resolution analysis. The wavelet transform is suited to analysing the time evolution of periodic and transient signals, as it decomposes the signal in both physical space (time) and spectral space (frequency) by fitting a wavelet function via their dilation and translation (Ramirez et al. Reference Ramírez, Berrocoso, González, Fernández, Donner and Barbosa2008).
Deception Island near-real-time monitoring of volcanic activity using the DIESID (Deception Island Spatial Dilatometer and Inclinometer) system. a. Slope distance time series in near-real time of BEGC-FUMA (red), BEGC-PEND (blue) and with wavelet filtering (black); a BEGC-PEND slope distance increase was observed in the 2006–2007 summer campaign, culminating a 3 year inflation period. b. The 2004–2005 and 2005–2006 and c. the 2005–2006 and 2006–2007 velocity vectors between summers.

Volcanic activity forecast
During volcanic unrest, forecasting is essential for volcanic risk mitigation. Forecasting has an associated uncertainty level (Marzocchi & Bebbington Reference Marzocchi and Bebbington2012). Forecast promptness depends on the volcanic unrest level and assessed risk. Correlation between high seismic energy release and ground deformation has been reported (Prates et al. Reference Prates, García, Fernández-Ros, Marrero, Ortiz and Berrocoso2013b, García et al. Reference García, Berrocoso, Marrero, Fernández-Ros, Prates, De la Cruz-Reyna and Ortiz2014a). The acceleration of both ground deformation and seismic energy is a useful criterion to establish volcanic unrest level alerts (García et al. Reference García, Fernández-Ros, Berrocoso, Marrero, Prates, De la Cruz-Reyna and Ortiz2014b). The Failure Forecast Method (Voight Reference Voight1988) reflects, for constant temperature and stress conditions, a general physical law that governs material failure and that, on hyperbolic ground displacement acceleration, acknowledges the inverse velocity curve as linear and the graphical time forecast of material failure via the inverse velocity linear intersection with the time axis (Fig. 4; Fukuzono Reference Fukuzono1985).
Vertical displacements are usually larger if they are directly above the pressure source (Mogi Reference Mogi1958, Dzurisin Reference Dzurisin2007), and they have shown good correlation with seismo-volcanic events when measured with millimetre-level precision and sub-daily sampling rates (Prates et al. Reference Prates, García, Fernández-Ros, Marrero, Ortiz and Berrocoso2013b, García et al. Reference García, Berrocoso, Marrero, Fernández-Ros, Prates, De la Cruz-Reyna and Ortiz2014a). Kalman filtering allows a rapid assessment (i.e. at the scale of hours) of ground displacements and consequently their associated volcanic pressure sources (Prates et al. Reference Prates, García, Fernández-Ros, Marrero, Ortiz and Berrocoso2013b). Between significant ground displacement accelerations or trend shifts, a near-real-time Mogi pressure source analysis must be conducted (Dzurisin Reference Dzurisin2007), the inversion model must be computed (Mogi Reference Mogi1958, Cervelli et al. Reference Cervelli, Murray, Segall, Auki and Kato2001, Garcia et al. Reference García, Berrocoso, Marrero, Fernández-Ros, Prates, De la Cruz-Reyna and Ortiz2014a) and the pressure point source evolution must be inferred.
An injection model (De la Cruz-Reyna & Yokoyama Reference De la Cruz-Reyna and Yokoyama2011) is applied that proposes a simplified three-dimensional stress field that is represented by a vertical cone that integrates all directions that form with the zenith direction of ~39° from a pressure source to the surface, determining the maximum shear stress directions (Fig. 5). In fact, spatial distribution of seismicity has shown a good correlation with the geometry of the magma injection cone inferred from ground deformation data (García et al. Reference García, Berrocoso, Marrero, Fernández-Ros, Prates, De la Cruz-Reyna and Ortiz2014a). This magma injection cone, integrated with the known deep structures, allows for the establishing of scenarios regarding the most probable location of seismic hypocentres, associated landslides and eruption vent openings and the forecasting of volcanic hazard.
Mogi point source and De la Cruz-Reyna and Yokoyama injection cone. The 2005–2006 and 2006–2007 inflation inferred point source and injection cone are shown from measured ground displacement at the three DIESID (Deception Island Spatial Dilatometer and Inclinometer) stations: BEGC, FUMA and PEND. Pressure source at a 2900 m depth and dashed circle are shown marking the higher shear stress directions/cone intersecting the Earth surface.

The operational aspects of forecasting rely on the displacement watch-out warning (D-WOW) criterion, derived from highly positive accelerations, and the graphical failure forecast method (D-FFM), computed from the inverse of the displacement velocity. The application of these techniques to height ground displacement time series recorded during the 2003–2004 summer is presented as an example in Fig. 6. It is worth noting that, in volcanic unrest, experience shows that communications blackouts can occur because of communication saturation (e.g. from scientific committees, media, tourists, curious individuals, etc.). Therefore, it is recommended to establish in advance a classification within the network stations to be able to apply this method during such a situation (García et al. Reference García, Berrocoso, Marrero, Fernández-Ros, Prates, De la Cruz-Reyna and Ortiz2014a) based on volcano dynamics and evolution.
Application of the short-term hazard forecasting methodology to the height of ground displacement time series recorded during the 2003–2004 summer. The figure illustrates the two operational criteria: the displacement watch-out warning (D-WOW), defined by high positive accelerations; and the graphical failure forecast method (D-FFM), based on the linear projection of the inverse displacement velocity to the time axis.

Results
Regional tectonics modelling
A regional geotectonic model for the Antarctic Peninsula, Bransfield Basin and South Shetland Islands region based on ground displacement (Fig. 7a) was proposed, supported partially by the Spanish Antarctic Geodetic Network (RGAE), which today consists of 10 benchmarks deployed on the South Shetland Islands and another two on the Antarctic Peninsula (Berrocoso et al. Reference Berrocoso, Fernández-Ros, Ramírez, Salamanca, Torrecillas, Pérez-Peña, Capra and Dietrich2008, Reference Berrocoso, Fernández-Ros, Prates, García and Kraus2016).
a. Absolute horizontal and vertical displacement model in the ITRF2008 reference frame. The tectonic velocity field detected in the South Shetland Islands, Bransfield Strait and Antarctic Peninsula region is shown. Velocity vectors are shown at Global Navigation Satellite Systems (GNSS) benchmarks of the Spanish Antarctic Geodetic Network (RGAE), based on data from Berrocoso et al. (Reference Berrocoso, Fernández-Ros, Prates, García and Kraus2016), with additional vectors from Dietrich et al. (Reference Dietrich, Rülke, Ihde, Lindner, Miller and Niemeier2004) and Jiang et al. (Reference Jiang, D.-C, Zhan and Liu2009). A slight change in the direction of horizontal velocities is observed near Byers Peninsula and Deception Island. b. Horizontal displacement model relative to the Antarctic Plate in the ITRF2008 reference frame.

Geodetically inferred ground displacement horizontal velocities in the South Shetland Islands and Antarctic Peninsula suggest that the north-north-east-directed velocities progressively increase from the former Phoenix Plate and Shackleton Fracture Zone side towards the Antarctic Peninsula and South Scotia Ridge side near the wedge formed by the South Scotia Ridge meeting the Shackleton Fracture Zone. This results in the Phoenix Plate’s rollback at the South Shetland Trench (due to the higher north-north-east-directed velocities of the South Shetland Islands and Bransfield Basin region) and in the extension and opening of the Bransfield Basin (due to the even higher north-north-east-directed velocities of the Antarctic Peninsula region; Fig. 7a; Berrocoso et al. Reference Berrocoso, Fernández-Ros, Prates, García and Kraus2016). A transition zone along the South Shetland Islands alignment was also identified covering Snow, Deception and Livingston islands. These islands’ inferred subsidence have a similar magnitude to that observed to the north-east; hence, they must be affected by the same tectonic processes acting on the South Shetland Trench, unlike Low Island and the Antarctic Peninsula. Snow Island’s north-directed velocity is similar to that to the south-west, while Byers Peninsula’s north-west-directed velocity is similar to that to the north-east.
Evidence of north-east to south-west compression between Snow Island and Byers Peninsula (Livingston Island) was also inferred in recent years on Deception Island (Prates et al. Reference Prates, García, Fernández-Ros, Marrero, Ortiz and Berrocoso2013b, Berrocoso et al. Reference Berrocoso, Fernández-Ros, Prates, García and Kraus2016). The south-east to north-west Bransfield Basin extension, the north-east to south-west compressional regime inferred on Byers Peninsula and the subsidence caused by slab rollback at the South Shetland Trench are all present on Deception Island (Fig. 7b). Deception Island and Byers Peninsula may well be closely affected by active faults related to the local compressive state, being a key area for understanding present-day crustal movements in the South Shetland Islands, as well as for identifying the Deception Island and Byers Peninsula region as an area of crustal instability (Berrocoso et al. Reference Berrocoso, Fernández-Ros, Prates, García and Kraus2016).
Volcanic dynamics modelling
The overall volcano dynamics of Deception Island are robustly inferred from the ground displacement data derived from the REGID network (Figs 1b & 8a,b). Volcano dynamics are subsequently obtained by comparing ground displacements between successive campaigns, with horizontal displacements of volcanic origin being rigorously isolated by removing the horizontal component of the regional geotectonic reference frame from the raw ground displacements of the BEGC, FUMA and PEND benchmarks (Fig. 4b,c).
a. Geodynamic horizontal and vertical deformation model for Livingston Island (tectonic) and Deception Island (volcano-tectonic). The average horizontal displacement is orientated north-west and indicates a subsidence process associated with the subduction of the Phoenix microplate. b. Non-tectonic residual deformation model for Deception Island, obtained relative to reference stations located on Livingston Island. In this model, the horizontal displacement vectors exhibit a north-north-west to south-south-east direction with a predominant south-south-west orientation. Adapted from Rosado et al. (Reference Rosado, Fernández-Ros, Berrocoso, Prates, Gárate, de Gil and Geyer2019).

Successive inflation and deflation periods, with transitional phases, were notably observed during the 2012–2013 to 2014–2015 crisis (Rosado et al. Reference Rosado, Fernández-Ros, Berrocoso, Prates, Gárate, de Gil and Geyer2019). Volcano activity since 2001 has demonstrated alternating periods of increase/decrease in seismic activity (Carmona et al. Reference Carmona, Almendros, Serrano, Stich and Ibáñez2012) associated with ~3 year inflation/deflation periods (Fig. 3). Periods of inflation correlate with higher seismicity, suggesting active pressure build-up, whereas deflation is interpreted as a probable consequence of magmatic system relaxation (Ramírez et al. Reference Ramírez, Berrocoso, González, Fernández, Donner and Barbosa2008, Almendros et al. Reference Almendros, Carmona, Jiménez, Díaz, Lorenzo, Berrocoso and Venzke2015).
A significant period of inflation was detected from 2003–2004 to 2006–2007 (Figs 3 & 4a). Later, the inflation and uplift observed, which started during the 2012–2013 campaign and persisted through the 2014–2015 campaign, reflected a clear increase in volcanic internal pressure, exhibiting average radial extensions of 1.8 and 1.9 cm/year, respectively. Furthermore, signs of precursors to the 2014–2015 seismic-volcanic crisis, including a documented rise in seawater temperatures, soil temperatures and hot spring locations, were evident in June 2012 (Berrocoso et al. Reference Berrocoso, Prates, Fernández-Ros, Peci, de Gil and Rosado2018, Rosado et al. Reference Rosado, Fernández-Ros, Berrocoso, Prates, Gárate, de Gil and Geyer2019).
Volcano near-real-time surveillance
The development of a wireless connection infrastructure for the real-time transmission of data represents a considerable improvement in terms of both the power monitoring and management of large datasets. In addition, this development means that it is no longer required to attend the GNSS receivers physically, as they are remotely controlled. The system’s wireless transmitter selection, equipment protection and power requirements were constrained by the inhospitable Antarctic environment (Peci et al. Reference Peci, Berrocoso, Páez, Fernández-Ros and De Gil2012, Reference Peci, Berrocoso, Fernández-Ros, García, Marrero and Ortiz2014).
In terms of differential relative positioning, the reference station is BEJC for non-real-time monitoring, which is outside the Deception Island volcano, and BEGC (inside the volcano-affected region) for near-real-time surveillance, with solutions obtained at 30 min to 1 h intervals.
Without stable internet communications, data are processed using broadcast ephemeris and the IERS Bulletin A pole file (https://www.iers.org/IERS/EN/Publications/Bulletins/bulletins), and ground deformation observables are the BEGC-FUMA and BEGC-PEND slope distances. On Deception Island, inflation processes are usually related to increases in the BEGC-PEND slope distance, while deflation processes are related to its decrease (Figs 3 & 4a). Otherwise, with stable internet communications, data are processed with half-predicted precise ephemeris and pole files in near-real time to achieve topocentric coordinates. Topocentric coordinates allow for the normal vector to the triangle BEGC-FUMA-PEND to be also computed (Berrocoso et al. Reference Berrocoso, Prates, Fernández-Ros and García2012, Prates et al. Reference Prates, Berrocoso, Fernández-Ros and García2013a).
The noise input of the GNSS constellation’s revolution and Earth’s gravitationally related effects that affect sub-daily data processing is minimized with a Kalman filter (Prates et al. Reference Prates, Berrocoso, Fernández-Ros and García2013a,Reference Prates, García, Fernández-Ros, Marrero, Ortiz and Berrocosob), and the volcanic activity level can be assessed by wavelet multi-resolution analysis applied to unfiltered data (Fig. 4a).
Volcanic activity forecast
When analysing the normal vector magnitude time series, interchanging periods of inflation and deflation can be identified that, at low to moderate volcano activity levels, allow forecasts to be made for the medium term (i.e. months). For volcanoes in inhospitable regions (e.g. Antarctica), where the continuous observation of stations and data access may be complex or even impossible, such medium-term forecasts provide a probable scenario before the next surveillance period becomes possible (Fig. 3).
The inability to remain in these extreme conditions all year makes such medium-term forecasts fundamentally important, as before each summer campaign the volcanic activity on the island is unknown, increasing the risk to ships and people entering Port Foster. Therefore, after each campaign end (i.e. March), a medium-term forecast of volcanic activity for the next campaign start (i.e. December) is provided based on all of the information extracted from the methods described earlier. In inflation processes, the Mogi point source model and the De la Cruz-Reyna and Yokoyama injection model are computed, providing the most likely spatial evolution of magma migration and seismic hypocentre location (Fig. 6). Here, the Mogi point source inversion model is solved using the Monte Carlo simulated annealing method (Cervelli et al. Reference Cervelli, Murray, Segall, Auki and Kato2001, Garcia et al. Reference García, Berrocoso, Marrero, Fernández-Ros, Prates, De la Cruz-Reyna and Ortiz2014a). Ground displacements and pressure point sources obtained for inflation processes explain the space and time aspects of the volcano’s activity, which are crucial to establishing such scenarios.
During high volcano activity, forecasts need to be made for the short term (i.e. days). Here, ground displacement acceleration and the inverse of its velocity are computed in order to issue D-WOWs (García et al. Reference García, Fernández-Ros, Berrocoso, Marrero, Prates, De la Cruz-Reyna and Ortiz2014b) and time forecasts (Fig. 6) related to potentially higher fumarolic and degassing activity, seismic energy release or eruption vent openings based on the D-FFM (Voight Reference Voight1988).
During greater ground displacements, where the magnitude is sufficient to be resolved via local processing without the need for internet-based corrections, topocentric coordinates and velocity vectors are computed, and the most probable location of seismic hypocentres, associated landslides and eruption vents are then determined from the computed Mogi’s pressure point source and injection model (Fig. 5) of De la Cruz-Reyna & Yokoyama (Reference De la Cruz-Reyna and Yokoyama2011), combined with the necessary knowledge regarding the deep magmatic system and structures.
These models facilitate the rapid identification of potential vent locations. Had the 2005–2006 to 2006–2007 or the 2012–2013 to 2014–2015 processes continued (Fig. 5), the models would project possible vent openings either within the submerged caldera - similar to the 1967 eruption north-east of Telefon Bay (Roobol Reference Roobol1980, Pedrazzi et al. Reference Pedrazzi, Aguirre-Díaz, Bartolini, Martí and Geyer2014) - or inland, as occurred during the 1969 and 1970 eruptions, where several historical eruption vents are located (Fig. 1b; Bartolini et al. Reference Bartolini, Geyer, Martí, Pedrazzi and Aguirre-Díaz2014, Pedrazzi et al. Reference Pedrazzi, Németh, Geyer, Álvarez-Valero, Aguirre-Díaz and Bartolini2018). As full methodological and technologic capability was reached in 2008, no short-term forecasting was required; however, short-term forecasting has been tested in various volcanic unrest scenarios (Prates et al. Reference Prates, García, Fernández-Ros, Marrero, Ortiz and Berrocoso2013b, García et al. Reference García, Berrocoso, Marrero, Fernández-Ros, Prates, De la Cruz-Reyna and Ortiz2014a,Reference Prates, García, Fernández-Ros, Marrero, Ortiz and Berrocosob).
Discussion
The geodetic monitoring results from Deception Island, obtained through the integrated RGAE and REGID networks, provide a definitive and high-resolution understanding of the complex geodynamics driving volcanic unrest in this unique polar environment. Fundamentally, the study solidifies the conceptual model whereby local magmatic dynamics are superimposed upon a highly active and transitional regional tectonic regime. Analysis of the velocity field, as depicted in the ITRF2008 reference frame (Fig. 7a), confirms that the overall kinematics are governed by the north-north-east-directed extension resulting from Phoenix Plate rollback at the South Shetland Trench and the widening of the Bransfield Basin (Berrocoso et al. Reference Berrocoso, Fernández-Ros, Prates, García and Kraus2016). The convergence of this extension with an orthogonal north-east to south-west compressional regime on Deception Island itself, which is particularly evident near Byers Peninsula in the relative displacement model (Fig. 7b), confirms its location within a crucial zone of crustal instability. Establishing this precise regional kinematic context is methodologically paramount, as its systematic subtraction from the raw displacement data ensures the accurate isolation and robust modelling of purely volcanic ground movements (Fig. 4b,c).
The isolated volcanic deformation time series, spanning observations since 2001, reveals a clear and consistent pattern of alternating inflation and deflation cycles, typically recurring over ~3 year periods (Fig. 3). This periodicity, coupled with the observed correlation between inflation and heightened seismicity (Carmona et al. Reference Carmona, Almendros, Serrano, Stich and Ibáñez2012), establishes ground deformation as a reliable and quantifiable proxy for the cyclical pressurization and depressurization of the sub-caldera magmatic reservoir (Ramírez et al. Reference Ramírez, Berrocoso, González, Fernández, Donner and Barbosa2008). Significant inflation events, such as the one culminating in the 2014–2015 unrest, characterized by radial uplift rates up to 1.9 cm/year, were accurately modelled. The computed evolution of the pressure sources, derived from the Mogi point source model and the De la Cruz-Reyna and Yokoyama injection model (Fig. 5), provides essential spatial constraints on the reservoir’s location and potential pathways for magma and fluid migration, directly linking surface movements to subsurface architecture.
Although other techniques such as InSAR can provide wider spatial coverage, they often suffer from temporal decorrelation and atmospheric noise in polar regions. The point-based, high-frequency GNSS approach presented here, despite its logistical challenges and higher installation costs, is therefore essential for capturing the rapid, sub-daily dynamics of such a volcano. A significant methodological advancement presented here is the establishment of a near-real-time surveillance system via the wireless communication infrastructure deployed since 2008 (Peci et al. Reference Peci, Berrocoso, Páez, Fernández-Ros and De Gil2012, Reference Peci, Berrocoso, Fernández-Ros, García, Marrero and Ortiz2014). This capability is critical for achieving the high promptness and resolution required for dynamic hazard assessment in an environment where continuous year-round access is infeasible. The strategy is designed for resilience: although precise topocentric coordinates and the normal-vector magnitude of the core BEGC-FUMA-PEND triangle are computed with stable internet access, the system defaults to the reliable slope-distance observable (BEGC-PEND) when such communication is limited (Fig. 4a). Furthermore, the integration of advanced signal processing techniques, including the Kalman filter for noise reduction and wavelet multi-resolution analysis for activity assessment (Prates et al. Reference Prates, Berrocoso, Fernández-Ros and García2013a,Reference Prates, García, Fernández-Ros, Marrero, Ortiz and Berrocosob), ensures that the deformation observables maintain the required millimetre-level precision for reliable threat assessment under highly dynamic, sub-daily sampling rates.
This robust framework underpins a crucial dual-term forecasting capability. Given the logistical constraints of the Antarctic environment, the medium-term forecasts (i.e. months), derived from the long-term trend analysis of the normal-vector magnitude (Fig. 3), are an indispensable prerequisite for the safe operational planning of summer campaigns. In periods of escalated unrest, the system is adapted to provide quantitative short-term (i.e. days) forecasts. This is achieved through the calculation of ground displacement velocity and acceleration, allowing the application of the D-FFM (Voight Reference Voight1988) to issue rapid D-WOWs. The projected temporal and spatial evolution of potential failure, as visualized in Fig. 6, provides critical information on the probable location and timing of significant seismic or eruptive events. Ultimately, the proposed methodology constitutes a validated and comprehensive model that integrates tectonic context, high-precision monitoring and multi-temporal forecasting, offering a transferable template for the rigorous geodetic assessment of other active, isolated volcanic systems globally.
Conclusions
The established GNSS monitoring framework on Deception Island, rigorously validated through successive summers since 2001, has successfully identified and modelled alternating inflation and deflation processes lasting ~3 years, consistently detecting associated heightened seismicity during inflation periods. This methodology, which combines non-real-time data processing for deep structure identification with near-real-time surveillance capabilities, forms a robust basis for providing both mid-term and short-term forecasting of volcanic activity and seismic events. Crucially, the practical application of GNSS in the extreme Antarctic environment reveals specific findings: its unparalleled precision and instrument autonomy are significant advantages for remote monitoring; however, limitations include instrument stability challenges due to the extreme cold and data transmission unreliability. These factors necessitate stringent requirements, particularly the use of robust, reinforced instrumentation and a network design prioritizing redundancy and energy autonomy to ensure continuous and reliable volcano activity surveillance.
Since 2001, three benchmarks have been measured continuously during summer campaigns and non-real-time ground displacement monitoring has been offered. Real-time data access was added from 2008, and near-real-time slope distance surveillance has also been offered. Volcano dynamics have been detected and modelled to alternating inflation and deflation processes of ~3 years in duration, identified through higher seismicity being detected in inflation periods. Normal-vector magnitude time series have been computed, providing instantaneous strain data, and medium-term forecasts have been offered given the moderate to low volcanic activity detected in recent years; however, it is essential to establish a probable scenario for each subsequent Deception Island summer campaign. Inflation processes, such as those of 2003–2004 to 2006–2007, the pressure point source and the magma injection cone are computed. The complete GNSS dataset has allowed the consideration of the volcano dynamics and tectonic context that, together with near-real-time surveillance capability, form the basis of accurate forecasting.
The proposed methodology for the holistic assessment of volcano dynamics is based on the definition of 1) a regional tectonics model, 2) non-real-time monitoring and deep structure detection, 3) near-real-time surveillance and 4) volcanic hazard forecasting. Each has different specific requirements regarding promptness and precision and hence the measured ground displacement observable.
Non-real-time monitoring of continuously operating stations and periodically observed benchmarks for higher spatial resolution allow the establishment of volcano dynamics and the identification of active deep structures and the tectonic context. The complete GNSS dataset is processed to achieve the highest ground displacement precision regardless of promptness. The ground displacement time series are analysed to provide refined ground displacement velocities. Geodetic network adjustment and compensation shall not be applied to avoid the even distribution of the measured ground displacements. Strain maps may also be computed. Volcano pressure point source evolution from the Mogi model is computed, and from this the higher shear-stress paths of the De la Cruz-Reyna and Yokoyama model are determined.
Near-real-time surveillance requires prompt access to the continuously operating stations’ data via a communication system to compute ground displacement on sub-daily sampling rates for greater time resolution. Wavelet multi-resolution analysis and Kalman filtering are applied to determine the volcano activity level and improve ground displacement precision to the millimetre level. Topocentric coordinates are computed if internet access is available. Slope distance and normal-vector magnitude and inclination regarding triangle units are assessed for ground deformation. If no internet access is possible only slope distances are assessed. Proper selection of the locations for the continuously operating stations according to volcano dynamics representativeness, data quality and real-time access will constrain the GNSS network design to guarantee a sufficient assessment of the volcanic activity based on ground deformation surveillance. Therefore, both promptness and millimetre-level precision must be accounted for when designing a GNSS network, enhancing the techniques and methods for data access and processing and choosing the ground deformation observable to analyse for volcano activity assessment.
Ground displacement velocities and accelerations are computed, and, between significant ground displacement accelerations, the pressure point source and magma injection models are also computed to enable short-term when-and-where hazard forecasts. Knowledge of volcano dynamics and deep structures and additional geophysical data provide further information that is essential to such forecasts. In extreme volcanic environments where time series continuity may not be possible, such knowledge allows for medium-term forecasts that provide scenarios prior to the next monitoring period start date. Nevertheless, there is always an uncertainty level associated with forecasting that must never be ignored.
Dedication
To Andrés Barbosa and Manuel Catalan - exceptional scientists, and the best people and friends.
Author contributions
Research design: A. Pérez-Peña, G. Prates, B. Rosado, A. Fernández-Ros, M. Berrocoso. Data collection (participation in the Spanish Antarctic campaigns): G. Prates, A. de Gil, B. Rosado, L.M. Peci, C. González-Bielsa, M. Berrocoso. Data processing and manuscript preparation: G. Prates, A. de Gil, A. Fernández-Ros, L.M. Peci, J.A. Ramírez-Zelaya, V. Jiménez, J. Gárate, M. Berrocoso. Manuscript final editing: A. Pérez-Peña, G. Prates, B. Rosado, V. Jiménez, M. Berrocoso.
Financial support
The geodetic and geodynamic research on Deception Island has been carried out with the support of the Spanish Ministry of Education and Science as part of the National Antarctic Program. The following research projects contributed directly to this work: ‘Recognition and fast evaluation of volcanic activity on Deception Island (GEODESY) (ANT1999-1430-E/HESP)’; ‘Geodetic Studies on Deception Island: deformation models, geoid determination and Scientific Information System (REN2000-0551-C03-01/ANT)’; ‘Acquisition of scientific software for GPS data processing (REN2000-2690-E)’; ‘Geodetic Control of the volcanic activity of Deception Island (CGL2004-21547-E/ANT)’; ‘Update of the Spanish Cartography for Deception Island (CGL2004-20408-ANT)’; ‘Volcano-tectonic activity on Deception Island: geodetic, geophysical investigations and Remote Sensing on Deception Island and its surroundings (CGLl2005-07589-C03-01/ANT)’; and ‘Geodetic and Geothermal Researches, Time Serial Analysis and Volcanic Innovation in Antarctica (South Shetland Islands and Antarctic Peninsula (GEOTINANT) (CTM2009-07251/ANT)’. We also acknowledge support provided through a series of annual projects aimed at maintaining historical geodetic, geothermal and oceanographic time series on Deception and Livingston islands, Antarctica, spanning from the 2013–2014 campaign to the 2024–2025 campaign.
Competing interests
The authors declare none.


 Open access