


Introduction
The radiocarbon marine reservoir age offset (ΔR) from the global mean has varied through the late glacial period in the North Atlantic and Norwegian Sea (e.g. Austin et al. Reference Austin, Telford, Ninnemann, Brown, Wilson, Small and Bryant2011; Bondevik et al. Reference Bondevik, Mangerud, Birks, Gulliksen and Reimer2006; Brendryen et al. Reference Brendryen, Haflidason, Yokoyama, Haaga and Hannisdal2020; Skinner et al. Reference Skinner, Muschitiello and Scrivner2019). The ΔR value is the difference between the 14C reservoir age of a regional part of the ocean to the 14C reservoir age of the modeled global ocean (Stuiver et al. Reference Stuiver, Pearson and Braziunas1986) and is needed for the calibration of marine 14C ages to calibrated years when using the Marine20 curve (Heaton et al. Reference Heaton, Köhler, Butzin, Bard, Reimer, Austin, Bronk Ramsey, Grootes, Hughen, Kromer, Reimer, Adkins, Burke, Cook, Olsen and Skinner2020). The problem of a varying ΔR value for 14C calibration can be overcome by constructing a regional marine radiocarbon calibration curve without the need for a ΔR value (e.g. Brendryen et al. Reference Brendryen, Haflidason, Yokoyama, Haaga and Hannisdal2020; Skinner et al. Reference Skinner, Muschitiello and Scrivner2019). Here, I present such a regional calibration curve for the Norwegian coast, called Norcoast25, which covers the period from 11,000 to 14,400 cal BP.
The Norcoast25 curve is based on paired terrestrial and marine radiocarbon ages from sediment cores in two shallow marine basins on the west coast of Norway—Kulturmyra (62°20’N, 5°39’E) and Kvaltjern (60°25’N, 4°59’E) (Figure 1). Details of the basins, the radiocarbon dated samples and deposits have previously been published (Bondevik et al. Reference Bondevik, Birks, Gulliksen and Mangerud1999, Reference Bondevik, Mangerud and Gulliksen2001, Reference Bondevik, Mangerud, Birks, Gulliksen and Reimer2006). In short, the basins are now bogs, 7 to 10 m deep, but from the Bølling to the Early Holocene they were marine bays situated about 5 to 15 m below sea level. The Vedde Ash (Mangerud et al. Reference Mangerud, Lie, Furnes, Kristiansen and Lømo1984) is present as a visible layer in the cores. The transitions from the Allerød to the YD and from the YD to the Early Holocene are seen as distinct changes in lithology in the cores (Figure 2).
Location of the Kulturmyra and Kvaltjern basins on the extreme west coast of Norway. During the Late Weichselian, they were shallow marine bays. Arrows indicate the ocean currents.

Composite sediment cores from Kulturmyra and Kvaltjern. The coloring of the sediments reflects the organic content—warmer and darker colors show higher organic content. Terrestrial 14C ages on the left side of the core, marine 14C ages on the right side of the core. 14C ages marked with a star (*) were not used in the construction of the calibration curve. Each vertical depth bar is 20 cm.

The obtained reservoir ages should be representative of the surface water flowing along the Norwegian coast. About 4 m of the deepest deposits in the basins are shallow marine deposits that contain well preserved terrestrial moss stems and leaves, blown or washed into the basins from the surrounding land, and in situ marine shells, shell fragments and fishbones (Figures 2 and 3). Both δ13C and δ18O values show that the shells calcified in marine water (Bondevik et al. Reference Bondevik, Birks, Gulliksen and Mangerud1999, Reference Bondevik, Mangerud, Birks, Gulliksen and Reimer2006).

My idea for the construction of the Norcoast25 calibration curve was to use the Marine20 calibration curve but adjust it so it would fit the calibrated age positions of the marine 14C ages from the sediment cores. The Marine20 calibration curve has been constructed from computer simulations using a box model of the global carbon cycle forced by the radiocarbon activity in the atmosphere (Δ14C) derived from the IntCal20 tree-ring record and ice core CO2 data (Heaton et al. Reference Heaton, Köhler, Butzin, Bard, Reimer, Austin, Bronk Ramsey, Grootes, Hughen, Kromer, Reimer, Adkins, Burke, Cook, Olsen and Skinner2020) and is the standard curve for calibration of marine 14C ages. Although the rapid changes in radiocarbon activity in the atmosphere are attenuated in the ocean, the Marine20 curve still shows wiggles and fluctuations that are likely to be present to some extent in the coastal surface waters along the Norwegian coast. To construct the Norcoast25 curve I thus used the Marine20 curve but adjusted it according to the changing 14C reservoir ages. The 14C reservoir ages were calculated from 14C dated samples of terrestrial plant fragments and marine shells from the same sediment cores.
Methods
The terrestrial 14C ages of the sediment cores were calibrated to the IntCal20 tree-ring record (Reimer et al. Reference Reimer, Austin, Bard, Bayliss, Blackwell, Bronk Ramsey, Butzin, Cheng, Edwards, Friedrich, Grootes, Guilderson, Hajdas, Heaton, Hogg, Hughen, Kromer, Manning, Muscheler, Palmer, Pearson, van der Plicht, Reimer, Richards, Scott, Southon, Turney, Wacker, Adolphi, Büntgen, Capano, Fahrni, Fogtmann-Schulz, Friedrich, Köhler, Kudsk, Miyake, Olsen, Reinig, Sakamoto, Sookdeo and Talamo2020) to obtain calibrated years for each centimeter down the cores. I then, read off the calibrated age for each 14C-dated marine sample according to depth (Tables 1–3). I used these calibrated ages to construct the Norcoast25 calibration curve. The construction of the curve is further described in the results section.
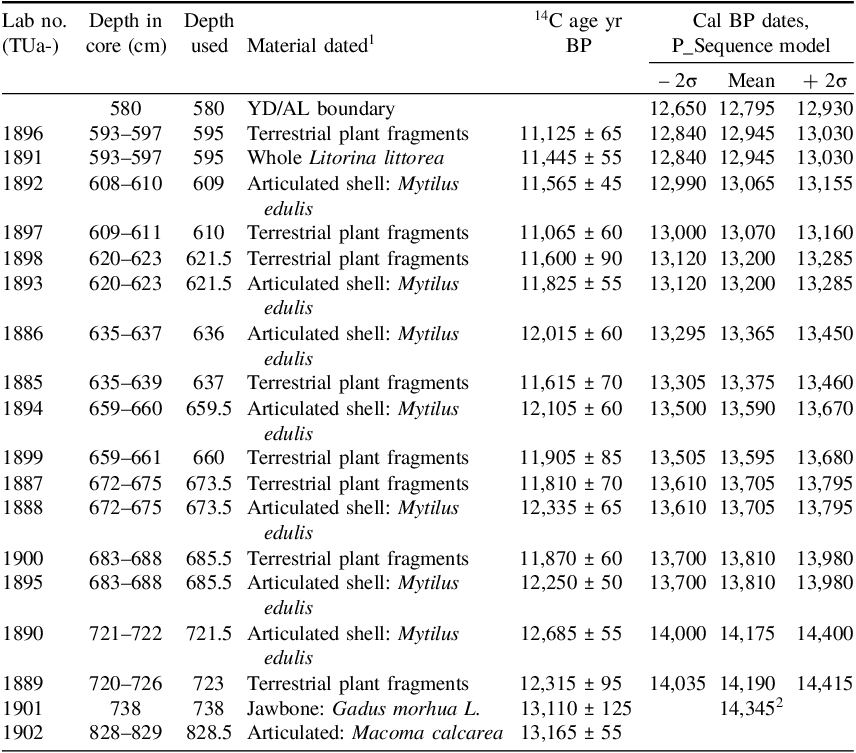
Kulturmyra: Radiocarbon ages and calibrated dates from the P_Sequence model

Calibrated dates rounded to nearest five years.
1 For a complete list of species, δ13C and sample size, see Bondevik et al. (Reference Bondevik, Birks, Gulliksen and Mangerud1999).
2 Date extrapolated using the same sedimentation rate as modeled for the above sample (0.98 mm/yr).
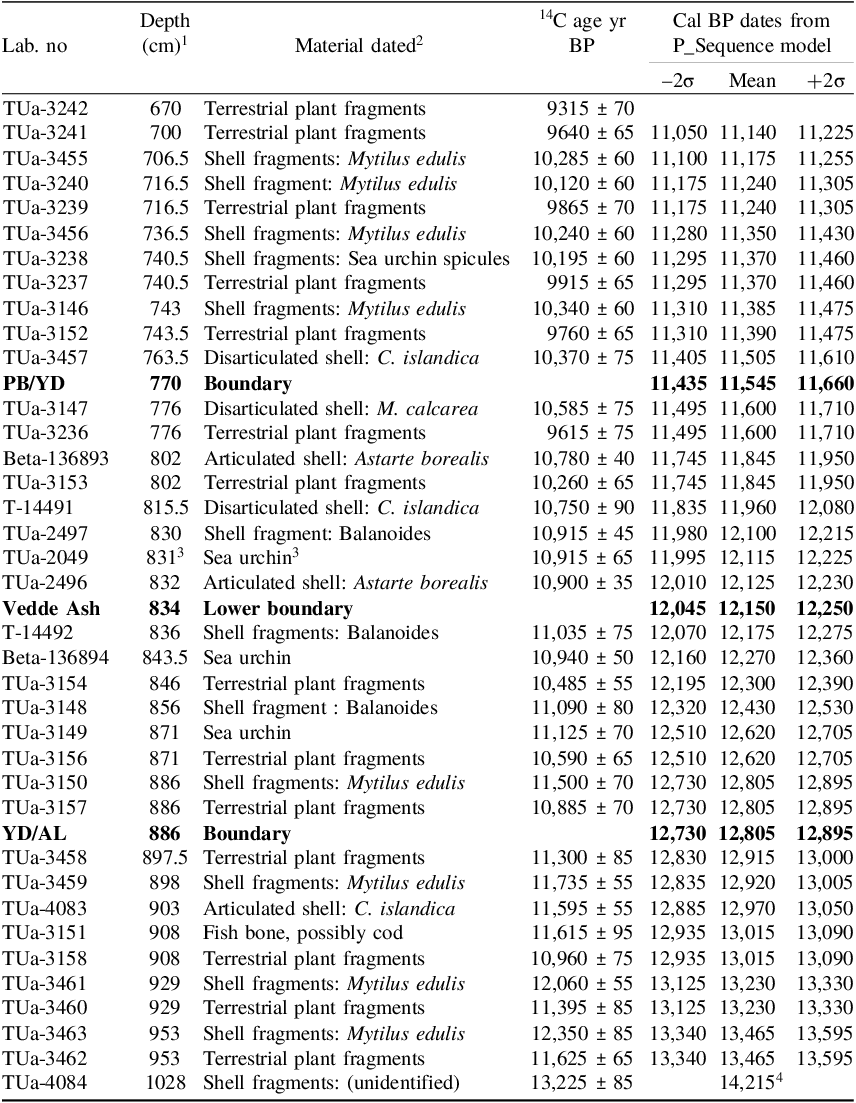
Kvaltjern: Radiocarbon ages and calibrated dates from the P_sequence model

Table 2 Long description
.
Calibrated dates rounded to nearest five years.
1 Depths used in wiggle-matching and P_Sequence model. For more information about the correlation between cores and sample depths, see supplementary table S1 in Bondevik et al. Reference Bondevik, Mangerud, Birks, Gulliksen and Reimer2006.
2 For a complete list of species, sample size, δ13C, see supplementary table S1 in Bondevik et al. Reference Bondevik, Mangerud, Birks, Gulliksen and Reimer2006.
3 Sample 3 cm above lower boundary of Vedde Ash in core 505-14-02 in Lysevågvatnet, 30 km south of Kvaltjern, correlates to 831 cm in Kvaltjern, see Bondevik et al. Reference Bondevik, Mangerud and Gulliksen2001 for details.
4 Calibrated date extrapolated using calculated sedimentation rate from the P_Sequence model (1 mm/yr).
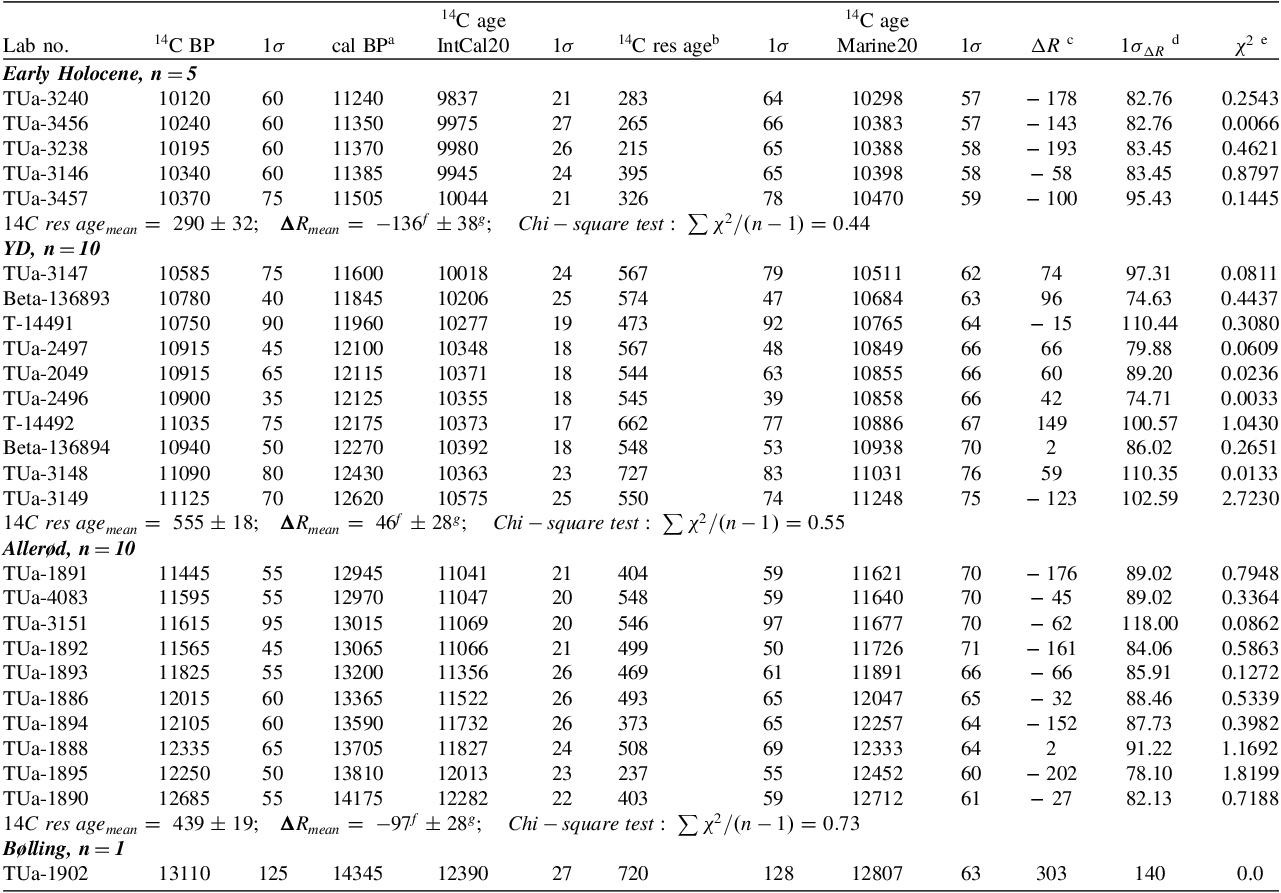
14 C reservoir ages and ΔR values relative to the Marine20 calibration curve

b ${}_{}^{14}C{\rm{\;}}res{\rm{\;}}age = {}_{}^{14}C{\rm{\;}}BP - {}_{}^{14}C{\rm{\;}}ag{e_{IntCal20}}$
c ${\rm{\Delta }}R = {}_{}^{14}C{\rm{\;}}BP - {}_{}^{14}C{\rm{\;}}ag{e_{Marine20}}$
d ${\rm{\;}}{\sigma _{{\rm{\Delta }}R}} = \sqrt {{\sigma ^2}_{{{14}_C}{\rm{\;}}} + {\sigma ^2}_{{{14}_{{C_{Marine20}}{\rm{\;}}}}{\rm{\;}}}} $
e $\displaystyle{{x^2}\; = \;{{{{\left( {\Delta R - \Delta {R_{mean}}} \right)}^2}} \over {{{\left( {{\sigma _{\Delta R}}} \right)}^2}}}}$
f

g $\displaystyle{{\sigma _{\Delta {R_{mean}}}}\; = \;\sqrt {{1 \over {\sum {{1 \over {{{\left( {{\sigma _{\Delta R}}} \right)}^2}}}} }}}} $
First, to construct the calibrated age models, I excluded radiocarbon ages that indicated redeposition of the dated material. All marine samples are from suspension feeders and most of them are articulated or whole individual shells (e.g. Figure 3), although some intervals were dated from shell fragments. Some of the shell-fragment ages are significantly older than articulated or whole individual shells and indicate that the fragments must have been redeposited. Also a few of the terrestrial 14C ages were found to be outliers and rejected through the age-depth modeling. All 14C ages considered to be outliers were excluded from the construction of the calibration curve. These omitted ages are marked by a star in Figure 2.
Next, I tried both wiggle-matching the sequence of terrestrial 14C ages to IntCal20 and using the P_Sequence model in OxCal v4.4.4 (Bronk Ramsey Reference Bronk Ramsey2008). For the construction of the Norcoast25 curve, I decided to use the P_Sequence age model because it allowed for gradual changes in sedimentation rates and returned larger and more satisfactory uncertainties than the wiggle-matching. Nevertheless, the result of the wiggle-matching is described in the Supplementary material. The difference between the results of the two methods is rather small. For most depths it is < 30 years (Supplementary material).
The wiggle-matching was conducted by assuming a constant sedimentation rate for each sedimentary unit and sliding the sequence of terrestrial 14C ages within that unit along the 14C ages of the IntCal20 tree-ring curve at increments of one year. For each position and sedimentation rate, I calculated the difference between the 14C age of the sample and the 14C age of the curve in that position, divided by the standard deviation of the 14C age of the sample: ${\chi ^2} = \sum\limits_{i = 1}^n {{{{{\left( {^{14}{C_{sample{_i}}}{ - ^{14}}{C_{IntCal.curv{e_i}}}} \right)}^2}} \over {{\sigma ^2}_{sampl{e_i}}}}} $
As an estimate of uncertainties with the positioning, I accepted all sedimentation rates and positions that gave ${\chi ^2}$
- smaller than
${\chi ^2}$
- smaller than ${\chi ^2}_{0.05}$
i.e. within 95% confidence. The results from the wiggle-matching are presented in the Supplementary material.
${\chi ^2}_{0.05}$
i.e. within 95% confidence. The results from the wiggle-matching are presented in the Supplementary material.
The P_Sequence model allows variations in sedimentation rates within each sedimentary unit and is more flexible than the wiggle matching. The so-called k-factor in the P_Sequence model defines the “stiffness” of the age-depth model, and I obtained reasonably good agreements using k values of 0.5–1 cm to 5–1 cm (corresponds to depositional increments of 0.2 –2 cm). In the model I placed “boundaries” at distinct changes in lithology and at the Allerød–YD and YD–Holocene boundaries. The OxCal codes I used are given in Tables S1 and S2. In Tables 1 and 2 I present the calibrated ages from the P_Sequence modeling, and those ages were further used to calculate the ΔR values (Table 3) and to construct the Norcoast25 calibration curve. The ΔR value is calculated by subtracting the 14C age of the marine sample from the modeled Marine20 14C age at the calendar age of the depth in the sediment core from where the marine sample was found.
Results
Age model for Kulturmyra
The composite sediment core has eight pairs of marine and terrestrial 14C dates, all from below the depth of the Allerød/YD boundary (Figure 2). Unfortunately, we could not find enough terrestrial material for reliable 14C dates in the deepest part of the stratigraphy. The oldest 14C dates are of a large cod bone (Figure 3B) and an articulated shell—both dated to approx. 13,100–13,200 BP (Figure 2, Table 1).
The age modeling showed rather constant sedimentation rates of around 1 mm/yr. Both the wiggle-matching and the P_Sequence model (Figure 4A) excluded the 14C date of 11,600 ± 90 BP at a depth of 621.5 cm, judged to be too old (Figure 2). The wiggle-matching showed good fits for sedimentation rates between 1.1 and 1.2 mm/yr (Supplementary material). Since the sedimentation rate is rather constant with depth, I decided to use the smallest possible k value in the P_Sequence model. k values from 0.5–1 cm to 1–1 cm (1–2 cm depositional increments) returned an agreement index of 76% to 57% for the age model. A higher k value than 1–1 cm yielded too low agreement. I used k = 1–1 cm and placed a boundary in the P_Sequence model at the distinct change in lithology that occurs at the Allerød/YD boundary at 580 cm (see Table S1 for code). The modeling returned a mean age for this boundary of 12,795 ± 65 cal BP (Table 1).
Age-depth model of the terrestrial 14C dates using the P_Sequence function in OxCal, k = 1 cm–1. Each age is shown with probability distributions; light gray is the original distribution, in darker gray is the distribution after running the depth model. (a) Kulturmyra. (b) Kvaltjern, color change in the age-depth curve shows a change (boundary) in the sediment core included in the P_Sequence model (see Table S2 for code).

Age model for Kvaltjern
The P_Sequence model confirmed the slight changes in sedimentation rates down the core. I placed boundaries in the P_Sequence model at the Allerød/YD boundary at 886 cm, at the change in lithology to pebbles at 825 cm, and at the YD/Holocene boundary at 770 cm depth (Figure 2). I also used the calendar date of the Vedde Ash of 12,121 ±57 cal BP (Rasmussen et al. Reference Rasmussen, Andersen, Svensson, Steffensen, Vinther, Clausen, Siggaard-Andersen, Johnsen, Larsen, Dahl-Jensen, Bigler, Röthlisberger, Fischer, Goto-Azuma, Hansson and Ruth2006) at 834 cm and the calibrated date of the YD/Holocene boundary from lake sediments in western Norway of 11,535 ± 58 cal BP (Lohne et al. Reference Lohne, Mangerud and BIrks2013, Reference Lohne, Mangerud and Birks2014) at 770 cm depth (Figure 4B; see Table S2 for code). The modeled sedimentation rates are 1.7 mm/yr for the Early Holocene, decreases down the core to a minimum of 0.8 mm/yr in the lower part of the YD, and below the Allerød/YD boundary it is close to 1 mm/yr (Figure S1).
The overall agreement index of the P_Sequence model is 95.7%. I tried different k values and found 1 cm–1 to be reasonable. The model considered three out of the 11 terrestrial 14C ages as outliers (9760 ± 65 BP at 743.5 cm depth, 9615 ± 75 BP at 776 cm depth and 11,300 ± 85 BP at a depth of 897.5 cm (Table 2). The same ages had to be excluded also in the wiggle matching to obtain statistically accepted results (Supplementary material).
14C reservoir ages and ΔR values for the late glacial Norwegian west coast
I calculated both the 14C reservoir age and the ΔR value for our marine 14C dates. The 14C reservoir age is the difference between the 14C age of a marine sample and the contemporaneous 14C age of the atmosphere (IntCal20). The ΔR value is the difference between the 14C age of a marine sample and the 14C age of the Marine20 model for a certain calibrated date. From the age-depth modeling I obtained the calibrated age for each centimeter down the cores (Tables 1 and 2) and could read off the corresponding terrestrial 14C age from IntCal20 and the marine 14C age from Marine20. See footnotes to Table 3 for further details.
I used the χ2 test to check the internal variability within a group of calculated ΔR values (cf. Ascough et al. Reference Ascough, Cook, Dugmore, Scott and Freeman2005; Ward and Wilson Reference Ward and Wilson1978). The deviation of a single ΔR value ( $\Delta {R_i}$
) from the weighted mean (
$\Delta {R_i}$
) from the weighted mean ( $\Delta {R_W}$
) should, on average, be close to the combined error (
$\Delta {R_W}$
) should, on average, be close to the combined error ( ${E_i}$
) of the 14C age and the 14C age of the Marine20 curve,
${E_i}$
) of the 14C age and the 14C age of the Marine20 curve, ${E_i} = \big ({\sqrt {{\sigma ^2}_{14C} + {\sigma ^2}_{14{C_{Marine20}}}} }\big).$
χ2 is the sum of the squared differences between ΔR values and the weighted mean divided by the squared error, given as $\mathop \sum \nolimits_1^n {(\Delta {R_i} - \Delta {R_w})^2}/{E_i}^2$
, and should therefore be close to the number of measurements
$\mathop \sum \nolimits_1^n {(\Delta {R_i} - \Delta {R_w})^2}/{E_i}^2$
, and should therefore be close to the number of measurements $n$
, or more precisely the degrees of freedom,
$n$
, or more precisely the degrees of freedom, $\left( {n - 1} \right)$
. Thus, if the quantity
$\left( {n - 1} \right)$
. Thus, if the quantity ${\raise0.5ex\hbox{$\scriptstyle {{{\chi ^2}}}$}\kern-0.1em/\kern-0.15em\lower0.25ex\hbox{$\scriptstyle {\left( {n - 1} \right)}$}}$
is ≤ 1, it means that the measurement uncertainties explain the variance, while values >1 indicates that the group has additional variance.
${\raise0.5ex\hbox{$\scriptstyle {{{\chi ^2}}}$}\kern-0.1em/\kern-0.15em\lower0.25ex\hbox{$\scriptstyle {\left( {n - 1} \right)}$}}$
is ≤ 1, it means that the measurement uncertainties explain the variance, while values >1 indicates that the group has additional variance.
All the Early Holocene to Bølling ΔR values cannot be combined into one mean value. The ${\raise0.5ex\hbox{$\scriptstyle {{{\chi ^2}}}$}\kern-0.1em/\kern-0.15em\lower0.25ex\hbox{$\scriptstyle {\left( {n - 1} \right)}$}}$
value for all 25 ΔR values is 1.28 (> 1). This is a strong indication that there is additional variance within the group of values, and we cannot pool the values into one mean value. I also tried to combine the YD and the Allerød–Bølling ΔR values into one group but the χ2/n-1 value is also here larger than 1 (1.05), indicating that the two groups have different means. However, statistically, the ΔR values of the Early Holocene and the Allerød–Bølling cannot be said to differ from each other.
${\raise0.5ex\hbox{$\scriptstyle {{{\chi ^2}}}$}\kern-0.1em/\kern-0.15em\lower0.25ex\hbox{$\scriptstyle {\left( {n - 1} \right)}$}}$
value for all 25 ΔR values is 1.28 (> 1). This is a strong indication that there is additional variance within the group of values, and we cannot pool the values into one mean value. I also tried to combine the YD and the Allerød–Bølling ΔR values into one group but the χ2/n-1 value is also here larger than 1 (1.05), indicating that the two groups have different means. However, statistically, the ΔR values of the Early Holocene and the Allerød–Bølling cannot be said to differ from each other.
The calculations show that the YD ΔR values are significantly higher than the ΔR values in the Allerød and in the Early Holocene. Weighted ΔR values for the Early Holocene were found to be − 136 ± 38 14C yr, for the YD it is + 46 ± 28 14C yr and − 97 ± 28 14C yr for the Allerød period (Table 3). The ΔR values within each of these time periods have χ2/n-1 values < 1, indicating that the measurement uncertainties explain the variance within the group. Thus, we could combine the measurements into weighted means of ΔR values for each time period (Table 3).
The Norcoast25 marine calibration curve
13,900–12,720 (Allerød into the YD)
For this period, the marine 14C ages plot below, but almost parallel with the Marine20 curve (Figure 5). I therefore reduced the Marine20 curve by the weighted mean of the ΔR values for this period, − 97 14C yr (Table 3). All marine 14C ages ± 1 σ are on or very close to this curve (Figure 5).
The Norcoast25 calibration curve (purple line) shown together with the IntCal20 curve (black lower line) (Reimer et al. Reference Reimer, Austin, Bard, Bayliss, Blackwell, Bronk Ramsey, Butzin, Cheng, Edwards, Friedrich, Grootes, Guilderson, Hajdas, Heaton, Hogg, Hughen, Kromer, Manning, Muscheler, Palmer, Pearson, van der Plicht, Reimer, Richards, Scott, Southon, Turney, Wacker, Adolphi, Büntgen, Capano, Fahrni, Fogtmann-Schulz, Friedrich, Köhler, Kudsk, Miyake, Olsen, Reinig, Sakamoto, Sookdeo and Talamo2020) and the Marine20 curve (black upper line) (Heaton et al. Reference Heaton, Köhler, Butzin, Bard, Reimer, Austin, Bronk Ramsey, Grootes, Hughen, Kromer, Reimer, Adkins, Burke, Cook, Olsen and Skinner2020). The green stippled curve is the Normarine18 curve (Brendryen et al. Reference Brendryen, Haflidason, Yokoyama, Haaga and Hannisdal2020). Terrestrial 14C ages (green filled symbols) and marine 14C ages (blue filled symbols) are plotted with 1σ error bars at their mean calibrated ages.

As an additional check, I moved the ten marine 14C ages from this period at one-year increments upward and downward along the y-axis of Figure 5 to find the best position for this sequence of ages. For each increment I calculated the squared difference between the 14C age of the marine samples and the 14C age of the Marine20 curve and divided this difference by the squared standard deviation of the 14C age of the sample plus the standard deviation of the Marine20 curve. In turn, best fit was obtained with a ΔR value of − 97 14C yr.
The uncertainty of the Norcoast25 calibration curve is the uncertainty of the Marine20 curve plus the uncertainty of the mean ΔR value, 28 years and is equal to $\sqrt {{\sigma ^2}_{14{C_{Marine20}}} + {{28}^2}} $
. To sum up, for the period 12,720–13,900 cal BP, the Norcoast25 curve is equal to Marine20 minus 97 14C yr with the uncertainty increased by the standard deviation of the mean ΔR value of 28 years (Figure 5). In practice, this means that for this period there will be identical results by calibrating a marine 14C age with the Marine20 curve and ΔR = − 97 ± 28 14C yr or using the Norcoast25 calibration curve directly.
$\sqrt {{\sigma ^2}_{14{C_{Marine20}}} + {{28}^2}} $
. To sum up, for the period 12,720–13,900 cal BP, the Norcoast25 curve is equal to Marine20 minus 97 14C yr with the uncertainty increased by the standard deviation of the mean ΔR value of 28 years (Figure 5). In practice, this means that for this period there will be identical results by calibrating a marine 14C age with the Marine20 curve and ΔR = − 97 ± 28 14C yr or using the Norcoast25 calibration curve directly.
12,710–11,000 (YD–Early Holocene)
The ΔR value increases from the beginning of the YD, from − 97 14C yr at 12,710 cal BP to a maximum of + 80 14C yr in the middle of the YD (at 12,100–11,900 cal BP) and drops across the boundary to the Early Holocene to a minimum of − 170 14C yr at 11,250–11,300 cal BP. Despite the changing ΔR value, I also used the Marine20 curve as a basis for this period.
First, I derived a smooth curve, using the weighted smoothing method called LOESS (e.g. Cleveland Reference Cleveland1994) through the marine 14C ages at their calibrated age positions. To obtain good fits to the older and younger ends of the curve, I included about 100 years of data from both sides. The smooth curve with the best fit was obtained with the LOESS parameters: span 0.9 and polynomial degree 4. Then I calculated the difference in 14C years between this smooth curve and the Marine20 curve, in principle, ΔR. Then I used these values of ΔR for each calibrated year (at 10-year increments) to correct the 14C years of the Marine20 curve. This allowed me to use the Marine20 curve, but the curve has been adjusted with the changing ΔR values.
I increased the uncertainties of the Norcoast25 curve by adding the uncertainty of the mean ΔR values to the uncertainties of the Marine20 curve. In the YD, the uncertainty of the mean is 28 years and in the Early Holocene it is 38 years (Table 3). For the period 12,710 to 11,600 cal BP, the uncertainty of the Norcoast25 curve is $\sqrt {{\sigma ^2}_{14{C_{Marine20}}} + {{28}^2}} $
. From 11,600 to 11,400, the uncertainty of the Norcoast25 curve gradually increases to
$\sqrt {{\sigma ^2}_{14{C_{Marine20}}} + {{28}^2}} $
. From 11,600 to 11,400, the uncertainty of the Norcoast25 curve gradually increases to $\sqrt {{\sigma ^2}_{14{C_{Marine20}}} + {{38}^2}} $
.
$\sqrt {{\sigma ^2}_{14{C_{Marine20}}} + {{38}^2}} $
.
13,910–14,370 (“Bridge” between Norcoast25 and Normarine18)
The two oldest ages suggest an increase in reservoir ages toward the time of the deglaciation of the outer Norwegian coast around 14.6 cal ka BP. The oldest articulated Mytilus edulis shell and a large cod jawbone (Kulturmyra, Table 1 and Figure 2) indicate a higher ΔR value than − 97 14C yr and match better to the Normarine18 calibration curve (green curve in Figure 5). I therefore calculated a LOESS curve that bridges the Norcoast25 curve and Normarine18 curve (Brendryen et al. Reference Brendryen, Haflidason, Yokoyama, Haaga and Hannisdal2020) together between 13,910 to 14,370 cal BP (Figure 5). From 14,370 cal BP and older, the Norcoast25 calibration curve is identical to the Normarine18 curve.
11,000–0 (Early Holocene until today)
I connected the Norcoast25 curve to the Marine20−136 yr at 11,000 cal BP. The weighted ΔR value for the ages in the Early Holocene is − 136 ± 38 14C yr (Table 3). The recent ΔR value for marine shells in shallow water (≤ 100 m) in southern Norway is slightly lower, I found − 164 ± 47 14C yr from six radiocarbon ages of shells (lab. no: T–951, T–954A/B, T–955, T–956, T–960 and T–1532 in Mangerud et al. (Reference Mangerud, Bondevik, Gulliksen, Karin Hufthammer and Høisæter2006)) using http://calib.org/marine/ (last accessed November 18, 2024). However, I used a constant ΔR value of −136 14C yr for the last 11,000 years. I have therefore connected the Norcoast25 curve to the Marine20−136 yr as the calibration curve from 11,000 until today and increased the uncertainty of the Marine20 curve by 38 years.
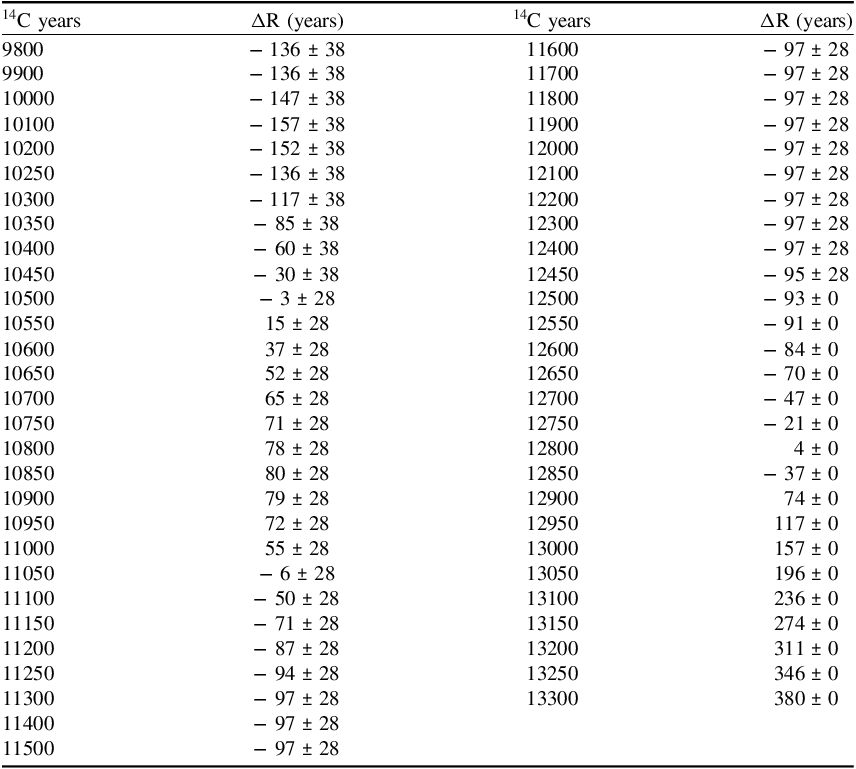
Alternative calibration using time dependent ΔR values and Marine20
I have made a table of ΔR values between 9800 and 13,300 marine 14C years as an alternative for those who want to use Marine20 instead of Norcoast25 for calibration (Table 4). The ΔR value is the 14C age from Marine20 minus the 14C age in Norcoast25 for the same calibrated year. For 14C ages between 9800 and 12,400 BP, the uncertainty is ± 38 and for 14C ages between 10,500 and 12,450 BP the uncertainty is ± 28 as calculated in Table 3. For 14C ages older than 12,500 I set the uncertainty to 0. The user can read off the needed ΔR value for a specific marine 14C age in Table 4 and calibrate the 14C age using Marine20. I have tested the two ways of conducting the calibration (Norcoast25 versus Marine20 with a ΔR value) and the results are similar, but with some differences for certain ages.
ΔR years relative to Marine20 (Norcoast25 – Marine20) for every 50 and 100 14C year in Early Holocene to Bølling

The reason for these differences is because Marine20 and Norcoast25 have different gradients at those times. For example, the Norcoast25 curve is steeper at the YD–Holocene transition than the Marine20 curve. A calibration of an age from this time, for instance, a marine sample of 10,200 14C years, will give a narrower calibrated distribution with Norcoast25 than using the Marine20 curve and a ΔR value of − 152 ± 38 14C yr (Table 4). However, when the Norcoast25 curve is flatter than the Marine20 curve, for instance, at the beginning of the YD, then the calibrated result using the Norcoast25 curve will have a wider distribution than the result from the Marine20 calibration (Figure 6, lower panel). Dates at transitions from one period to the next are best calibrated using the Norcoast25 calibration curve.
Probability distribution from the calibration of a marine sample with a conventional 14C age of 13,000 ± 60 BP (upper panel) and 11,000 ± 60 BP (lower panel) using the Norcoast25 calibration curve and the Marine20 curve minus ΔR values (blue filled area), as given in Table 4. The widths of the distributions are different, and this will affect both the mean and the median, the mode is virtually identical for both methods. Purple filled area shows calibration using present day ΔR value of −136 ± 38 14C yr.

Figure 6 Long description
The image contains two probability distribution graphs. Panel A: The upper graph shows the probability distribution for a marine sample with a conventional radiocarbon age of 13,000 ± 60 BP. The x-axis represents age in calibrated years before present (cal yr BP), ranging from 13,500 to 15,500. The y-axis represents probability, ranging from 0.000 to 0.004. The graph includes three curves: a pink filled area for Marine20 with present-day R value, a blue filled area for Marine20 with R value of 157, and a black dashed line for Norcoast25. The Norcoast25 curve peaks around 14,500 cal yr BP, while the Marine20 curves peak around 15,000 cal yr BP. Panel B: The lower graph shows the probability distribution for a marine sample with a conventional radiocarbon age of 11,000 ± 60 BP. The x-axis represents age in calibrated years before present (cal yr BP), ranging from 11,500 to 13,000. The y-axis represents probability, ranging from 0.000 to 0.005. The graph includes three curves: a pink filled area for Marine20 with present-day R value, a blue filled area for Marine20 with R value of 55 ± 28, and a black dashed line for Norcoast25. The Norcoast25 curve peaks around 12,000 cal yr BP, while the Marine20 curves peak around 12,500 cal yr BP.
Discussion
Decrease in reservoir ages from YD to the Early Holocene
The Norcoast25 curve is rather steep across the transition from the YD to the Early Holocene. This is opposite to the IntCal20 tree-ring curve and to marine varves at low latitudes that show the well-known 10,000 BP plateau between 11,300 and 11,600 cal BP (Figure 8) (e.g. Hughen et al. Reference Hughen, Southon, Bertrand, Frantz and Zermeño2004; Reimer et al. Reference Reimer, Austin, Bard, Bayliss, Blackwell, Bronk Ramsey, Butzin, Cheng, Edwards, Friedrich, Grootes, Guilderson, Hajdas, Heaton, Hogg, Hughen, Kromer, Manning, Muscheler, Palmer, Pearson, van der Plicht, Reimer, Richards, Scott, Southon, Turney, Wacker, Adolphi, Büntgen, Capano, Fahrni, Fogtmann-Schulz, Friedrich, Köhler, Kudsk, Miyake, Olsen, Reinig, Sakamoto, Sookdeo and Talamo2020). The decrease in the Norwegian ΔR- values from + 74 14C yr at 11,600 to – 100 14C yr at 11,505 cal BP (Table 3 and Figure 7) happens within the 10,000 BP tree-ring plateau (Figure 5). Both the decrease in 14C reservoir ages and the 10,000 BP tree-ring plateau could partly be explained by the outgassing of aged 14C from the North Atlantic Ocean because of increased circulation and the disappearance of sea-ice cover after the YD (Bard et al. Reference Bard, Arnold, Mangerud, Paterne, Labeyrie, Duprat, Mélières, Sønstegaard and Duplessy1994; Stocker and Wright Reference Stocker and Wright1996). Because of the steeper gradient of the Norcoast25 curve, the calibration of marine 14C dates at the YD/Holocene transition would give better precision than using the Marine20 curve.
The blue circles show ΔR values ± 1 σ as calculated from Table 3. The black curve is the difference between the Norcoast25 curve and the Marine20 curve. The red stippled curves show ± 1 σ. The 14C date of a jawbone from a large cod at 14,345 cal BP (Table 2) fit with increasing ΔR values toward the beginning of the Bølling chronozone at 14,600 cal BP.

Figure 7 Long description
A line graph with the horizontal axis labeled Age in calibrated years before present (cal yr BP) ranging from 14500 to 11000 and the vertical axis labeled delta R values in radiocarbon years (14C yr) ranging from -400 to 400. The graph includes three labeled periods: Bølling-Allerød, Younger Dryas, and Holocene. The black line represents the difference between the Norcoast25 curve and the Marine20 curve, while the magenta dashed lines represent plus or minus one sigma. Blue circles with error bars indicate R values calculated from data. The Vedde Ash is marked with a vertical dotted line. The black line shows fluctuations, starting high around 14500 cal yr BP, dipping below zero around 14000 cal yr BP, rising again around 12500 cal yr BP, and then decreasing towards 11000 cal yr BP. The blue circles generally follow the trend of the black line but with some variability.
Norcoast25 (blue) plotted together with Marine20 (green) and IntCal20 (red). The envelope of the curves shows the 2 σ-range (output from the OxCal calibration program).

However, I think the Norcoast25 curve should probably have been even steeper than it is at the YD/Holocene transition. According to the Norcoast25 curve, the decrease in 14C reservoir ages begins about 300 years before the end of the YD, from ca. 11,800 cal BP (Figure 9). Such an early decrease in 14C reservoir ages seems unlikely if the explanation with disappearance of sea ice and increased ocean circulation above is correct. The Norcoast25 curve is steered by relatively few data points in the last part of the YD to the relatively many in the Early Holocene (Figure 5), and is statistically correct, but the true curve should probably be even steeper across the YD/Early Holocene transition. However, both Austin et al. (Reference Austin, Telford, Ninnemann, Brown, Wilson, Small and Bryant2011) and (Skinner et al. Reference Skinner, Muschitiello and Scrivner2019) see a similar decline (stippled line in Figure 9), although their decline begins in mid-YD, at around 12,300 cal BP (Figure 9). More marine 14C dates in the late YD would resolve this uncertainty.
14C reservoir ages. The blue circles show 14C reservoir ages from this study plotted with 1 σ uncertainty (Table 3). The black line is the 14C reservoir age; the Norcoast25 curve minus the IntCal20 curve. The red stippled line is a digitized version of figure 4A from Skinner et al. (Reference Skinner, Muschitiello and Scrivner2019) that shows the reservoir ages in the open northeast Atlantic Ocean based on 14C dates of planktic foraminifera in sediment cores correlated to the NGRIP ice-core chronology.

Large drop in reservoir ages from Heinrich 1 to Bølling
We have no paired samples older than 14,200 cal BP, but other data suggest much higher reservoir ages in the first centuries after the deglaciation of the Norwegian coast at approx. 14,600 cal BP, i.e. during the Bølling warming (e.g. Stroeven et al. Reference Stroeven, Hättestrand, Kleman, Heyman, Fabel, Fredin, Goodfellow, Harbor, Jansen, Olsen, Caffee, Fink, Lundqvist, Rosqvist, Strömberg and Jansson2016). Off-shore 14C-dated sediment cores calibrated to the Greenland ice cores and/or to the speleothem records show reservoir ages of 1500 14C yr in Heinrich 1, dropping to 500–600 14C yr in the Bølling (Brendryen et al. Reference Brendryen, Haflidason, Yokoyama, Haaga and Hannisdal2020; Skinner et al. Reference Skinner, Muschitiello and Scrivner2019; Stanford et al. Reference Stanford, Rohling, Bacon, Roberts, Grousset and Bolshaw2011) (Figure 9). Our record of terrestrial 14C dates ends at 14,200 cal BP and in the lowest approx. 1 m of our sediment cores, we could not find suitable terrestrial plant fragments for 14C dating (Bondevik et al. Reference Bondevik, Mangerud, Birks, Gulliksen and Reimer2006). However, a jawbone from a large cod, at 738 cm depth in Kulturmyra (Figure 2) with an extrapolated age of 14,345 cal BP (Table 1), indicates a reservoir age of 720 ± 128 14C yr and a ΔR value of 303 ± 140 14C yr (Table 3, Figure 7).
I therefore consider that the abrupt decline in 14C reservoir ages in the Bølling (Brendryen et al. Reference Brendryen, Haflidason, Yokoyama, Haaga and Hannisdal2020; Skinner et al. Reference Skinner, Muschitiello and Scrivner2019; Stanford et al. Reference Stanford, Rohling, Bacon, Roberts, Grousset and Bolshaw2011) probably also applies to the coastal current flowing along the coast of Norway. Even though the coastal waters in Bølling was as warm as it is today in Northern Norway (e.g. Mangerud Reference Mangerud1977), the water in early Bølling must have been aged in radiocarbon. With the increase and strengthening of the circulation along the coast, the old CO2 would be outgassed into the atmosphere over some time and gradually lower the 14C reservoir age of the coastal waters. This abrupt decline can be seen in Figure 7. However, this drop in reservoir ages should be confirmed with 14C dates from new sites of Bølling age along the coast of Norway.
The Blomvåg Beds
To evaluate the Norcoast25 curve for this period, I tested it on radiocarbon dates from the Blomvåg Beds—a classical late glacial site in Western Norway. These beds of shallow marine deposits, containing mollusk shells, driftwood, whale-, seabird- and reindeer-bones are dated to the Bølling-Allerød period (Mangerud et al. Reference Mangerud, Briner, Goslar and Svendsen2017).
The calibration with the Norcoast25 curve explains the distribution of ages at Blomvåg better than the calibration with the Marine20 curve (Figure 10) and supports the assumption of a much higher reservoir age (and ΔR value) right after the deglaciation. I used both the Marine 20 calibration curve with a constant ΔR value of – 97 ± 28 14C yr (Table 3), comparable to the value used in the Marine13 calibration by Mangerud et al. (Reference Mangerud, Briner, Goslar and Svendsen2017), and the Norcoast25 curve. According to the Norcoast25 calibration, the Blomvåg Beds were deposited over a period of about 1000 years compared to about 1800 years with Marine20 (Figure 10). The oldest shell sample (Poz-65 854) was calibrated to 14,445 ± 130 cal BP (Norcoast25) which is more in line with the 10Be exposure age of the deglaciation (14,500 ± 500 yr BP1950) of the site. Marine20 calibration gave 14,905 ± 160 cal BP for the same shell sample (Figure 10).
Probability distribution of the calibrated dates of the 14C ages from the Blomvåg Beds in Western Norway (Mangerud et al. Reference Mangerud, Briner, Goslar and Svendsen2017) calibrated with the Marine20 curve and a constant ΔR value of – 97 ± 28 14C yr (in gray, below) comparable to the Marine13 calibration by Mangerud et al. (Reference Mangerud, Briner, Goslar and Svendsen2017) and with the Norcoast25 calibration curve (blue, above). Also shown is the exposure 10Be age of the deglaciation (pink). Terrestrial samples (top) were calibrated with the IntCal20 curve. Dates with information of depth are plotted in stratigraphical order.

Figure 10 Long description
Panel A: A line graph showing the probability distribution of calibrated dates from the Blomvåg Beds in Western Norway using the Marine20 curve and a constant R value of 97 28 14C yr. The horizontal axis represents age in calibrated years before present (cal yr BP), ranging from 12000 to 18000. The vertical axis represents the probability distribution. Multiple lines are plotted, each representing different samples such as wood, reindeer, seabird, whalebone, and shell. The lines show varying trends and peaks across the age range. Panel B: A line graph showing the probability distribution of calibrated dates using the Norcoast25 calibration curve. The horizontal axis represents age in calibrated years before present (cal yr BP), ranging from 12000 to 18000. The vertical axis represents the probability distribution. Multiple lines are plotted, each representing different samples such as seabird, whalebone, and shell. The lines show varying trends and peaks across the age range. Panel C: A line graph showing the probability distribution of calibrated dates using the IntCal20 curve for terrestrial samples. The horizontal axis represents age in calibrated years before present (cal yr BP), ranging from 12000 to 18000. The vertical axis represents the probability distribution. Multiple lines are plotted, each representing different samples such as wood and reindeer. The lines show varying trends and peaks across the age range.
Comparing the Norcoast25 calibration curve with the open North Sea and Norwegian Sea
Today the reservoir age along the Norwegian coast is much the same as the reservoir age of the surface waters of the North Sea and the Norwegian Sea, but several studies suggest higher reservoir ages offshore in the late glacial period than we found for the Norwegian coast. The present ΔR value for the open Norwegian Sea and the North Sea can be represented by the radiocarbon ages of 19th century whales (Mangerud et al. Reference Mangerud, Bondevik, Gulliksen, Karin Hufthammer and Høisæter2006) calculated to – 145 ± 35 14C yr (https://calib.org/marine/). This is similar to my calculations of – 136 ± 38 14C yr for the Early Holocene samples (Table 3) and to 19th century shallow water mollusks in southern Norway (− 164 ± 47 14C yr; https://calib.org/marine/). However, 14C dates of the Vedde Ash in offshore deposits show a ΔR value of + 150 14C yr at the Hebridean Shelf (depth 156 m, 14C date of mollusk) (Austin et al. Reference Austin, Bard, Hunt, Kroon and Peacock1995), + 245 ± 130 14C yr in the Norwegian trench (300 m depth, 14C date of benthic foraminifera) (Haflidason et al. Reference Haflidason, Petter Sejrup, Klitgaard Kristensen and Johnsen1995) and + 150 to 250 14C yr from several cores from the North Atlantic corrected for bioturbation (1000–2800 m depth, 14C dates of the planktic foraminifera Neogloboquadrina pachyderma) (Bard et al. Reference Bard, Arnold, Mangerud, Paterne, Labeyrie, Duprat, Mélières, Sønstegaard and Duplessy1994). All these estimates are 100–200 14C yr higher than my ΔR estimate for the Vedde Ash of + 64 ± 70 14C yr (Figure 7) (Bondevik et al. Reference Bondevik, Mangerud and Gulliksen2001). The same picture of higher reservoir ages in the open North Atlantic compared to the Norwegian coast is evident from Figure 9.
Several factors could explain the increasing ΔR values from the Norwegian coast toward the open ocean in the late glacial period. One factor is better ventilation between the sea and the atmosphere along the coast because of less sea-ice cover and longer times with open waters. Another factor is water depth. Deeper water has a higher 14C reservoir age. My samples are of suspension feeders that grew close to the sea surface. The basins are located 5–15 m below sea level throughout the late glacial period, whereas the offshore late glacial samples are benthic shells or benthic foraminifera, or the planktic foraminifera Neogloboquadrina pachyderma. N. pachyderma is usually found 50–100 m below a dense sea-ice cover (Greco et al. Reference Greco, Jonkers, Kretschmer, Bijma and Kucera2019) and so their shells would record the 14C reservoir age of these water masses rather than at the very sea surface. A possible source of bias for some offshore late glacial sediments is the precipitation of authigenic calcite on the foraminiferal tests (Wollenburg et al. Reference Wollenburg, Matthiessen, Vogt, Nehrke, Grotheer, Wilhelms-Dick, Geibert and Mollenhauer2023) that would result in too old 14C dates and too high ΔR values.
For users outside of Western Norway
The general picture of higher 14C reservoir ages in Bølling and YD and lower 14C reservoir ages in Allerød and Early Holocene is probably the case for much of the North Atlantic and the rest of the outer coast of Norway (Figure 9). However, the amplitudes of the fluctuations are different. For instance, the Normarine18 curve shows a ΔR value of + 250 14C yr around 13,500 cal BP whereas the Norcoast25 curve has a ΔR value of – 90 14C yr at the same time (Figure 5). Also, for the coast of Northern Norway we would expect higher reservoir ages because of less open water and weaker circulation in the late glacial period compared to the southern coast of Norway.
Until we are able to obtain better data for coastal areas outside of Western Norway, I think the best option would be to use the Norcoast25 curve for the entire Norwegian coast for the Early Holocene and late glacial. The latitude dependent ΔR model of Heaton et al. (Reference Heaton, Butzin, Bard, Bronk Ramsey, Hughen, Köhler and Reimer2023) used with Marine20 returns rough estimates of calibrated ages with low precision and cannot resolve the fine details in our data and is not a good option to use for the rest of the coastline. For northernmost Norway, the Norcoast25 curve could be shifted toward older 14C ages using a ΔR value. For instance, 19th century shallow water mollusks in Northern Norway (five samples of Mangerud et al. (Reference Mangerud, Bondevik, Gulliksen, Karin Hufthammer and Høisæter2006)) has a ΔR value relative to Marine 20 of − 90 ± 20 14C yr. This is 46 years older than my estimate of the Early Holocene in Western Norway (− 136 ± 38 14C yr). Thus, for 14C ages in Northern Norway, the Norcoast25 curve could be shifted 46 14C yr by using this as a ΔR value (ΔR = 46 ± 0). The Norcoast25 curve should not be used to calibrate offshore 14C dates.
Conclusion
I have constructed a calibration curve called Norcoast25 for the calibration of marine radiocarbon ages from the coast of Norway. The curve is based on paired samples of terrestrial and marine material from the same sediment cores in two shallow marine basins. I recommend using the curve for the calibration of marine samples along the entire Norwegian coast until we also have data from other areas outside of Western Norway.
The Norcoast25 curve extends from 11,010 to 14,370 cal BP, and is attached to the Normarine18 curve (Brendryen et al. Reference Brendryen, Haflidason, Yokoyama, Haaga and Hannisdal2020) beyond 14,370 and to Marine20−136 yr from 11,000 to 0 cal BP. Between 11,010 and 12,710 cal BP, the curve is fitted to the increasing ΔR values across the Early Holocene/YD boundary, reaching a maximum of + 80 14C yr in mid-YD. Between 12,720 and 13,900 cal BP, the curve is parallel to Marine20, but shifted by – 97 14C yr. From 13,910 to 14,370 cal BP, the curve is adjusted so it gradually connects to the Normarine18 curve.
The datapoints for the Norcoast25 curve are stored in the Norcoast25.14c file and can be downloaded from the attached link below and used with the OxCal calibration program downloaded to a PC. For users who do not want to use Norcoast25 for the calibration of marine 14C dates, Table 4 has ΔR values for the calibration of 14C ages between 9800 and 13,300 BP with Marine20.
Supplementary material
To view supplementary material for this article, please visit https://doi.org/10.1017/RDC.2026.10208
Data availability
The Norcoast25.14c data file to be used to calibrate 14C dates along the coast of Norway is available at https://doi.org/10.18710/DFQ48V.
Acknowledgments
Jan Mangerud encouraged me to construct the Norcoast25 calibration curve, read an early version of the paper, and suggested changes that made the paper easier to read. I would also like to thank Jo Brendryen for interesting discussions and Luke Skinner for sharing data. Some funding came from the QUANTSEA project ‘Quantifying past and future sea level changes in Norway’(Norwegian Research Council, grant number 303594).


 Open access