


The aims of lithic analysis can be legion: archaeologists routinely maintain that stone tools and associated lithic material can be informative about chronology, subsistence and economic activity, cultural tradition and group identity, and mobility and connectivity (see, for example, Andrefsky Reference Andrefsky2005; Inizan et al. Reference Inizan, Reduron-Ballinger, Roche, Tixier and Féblot-Augustins1999; Odell Reference Odell2000, Reference Odell2001; Texier and Meignen Reference Texier, Meignen, Delpech and Jaubert2012). These goals can best be reached with large samples of lithics for analysis, based on fundamental principles relating the samples that are the subjects of analysis to the populations about which analysts wish to generalize. At the same time, larger assemblages constitute challenges to analysts: they can be difficult to collect, process, and manage (Bradley and Edmonds Reference Bradley and Edmonds1993:61; Shott Reference Shott1994:89). The problems that large assemblages present include determining whether they are best considered one population or several, as well as how they should be sampled in order to both collect representative samples and capture the diversity of heterogenous populations. These are challenges to not only analytical practice but also basic data recording: even simple classification of lithics becomes challenging when the quantities involved are too large. Given that the populations of interest remain fundamentally unknown, an iterative approach is often warranted: there is significant potential value to recording a little bit of data about a lot of artifacts (extensive analysis) as well as substantial data about fewer artifacts (intensive analysis)—instead of having to choose one approach or the other.
These problems are particularly salient at quarry sites, where lithic material is hyperabundant (Ericson Reference Ericson, Ericson and Purdy1984). Hyperabundance of lithics foregrounds problems of data analysis and recording, highlighting an issue that is basic to archaeology more generally: finite labor, time, and funds may render detailed study of entire assemblages difficult, if not impossible. In addition to being a necessary recourse in the face of such limitations, however, sampling rather than studying entire assemblages can in fact enable improved inferences about the population being studied. Drennan (Reference Drennan2009:81) succinctly captures the case for sampling, especially pertinent in the face of large assemblages: “The gain in knowledge from . . . careful study of a sample may far outweigh the risk of error in making inferences about the population based on a sample.” Flannery's (Reference Flannery1976:Chapter 5) treatment of sampling remains the classic argument for this case (at site rather than assemblage scale).
This sanguine outlook masks a significant practical difficulty. It is necessary to efficiently record information about those parts of the assemblage that are being documented in detail and those that are not getting sampled for more thorough recording, while maintaining the possibility of subsequently recording material in further detail as needed (in accordance with new research questions, sampling strategies, available time/funding/personnel, etc.). This presents a significant challenge to data recording practice because the unit of analysis may routinely alternate between assemblage and artifact.
We address this here using the example of the Stelida Naxos Archaeological Project (SNAP; see Carter et al. Reference Carter, Contreras, Holcomb, Mihailović, Skarpelis, Campeau, Moutsiou, Athanasoulis, Rupp and Tomlinson2017, Reference Carter, Contreras, Holcomb, Mihailović, Karkanas, Guérin, Taffin, Athanasoulis and Lahaye2019), where such challenges prompted the development of a database interface that could address some of these issues, specifically by enabling simultaneous recording of both assemblage- and artifact-level data. This is accomplished through generation of what we term “Schrödinger's lithics”—elements of an assemblage that exist as individual artifacts only in aggregate until some further data about them is recorded, at which point they take on more concrete existence as individual artifacts associated with unique individual identification numbers. The existence of these potentially individual artifacts satisfies the database imperative of maintaining an ideal state in which the database retains isomorphism between assemblage-level and artifact-level records, while also allowing recording of information pertaining to both assemblage and artifact.
The tension between recording data at assemblage-level and artifact-level is an example of the underappreciated challenge of ensuring that archaeological information management is in sync with archaeological workflows, especially in fieldwork-based settings. With this in mind, we have developed a browser-based front-end lithic recording tool designed to facilitate the irregular, iterative, and nonlinear workflows that are commonly employed in archaeological fieldwork. Using R Shiny (Chang et al. Reference Chang, Cheng, Allaire, Xie and McPherson2018) to provide a dynamic interface to data manipulation abilities provided by R (R Core Team 2018), we have developed an app we call QuARI that addresses the challenge of recording at both the assemblage-level and the artifact-level, enabling both extensive and intensive approaches to archaeological analysis. QuARI is a database interface, not a schema, and it is meant to resolve the complexities of entering and updating data in tables that store assemblage-level data as well as tables that store artifact-level data—that is, the QuARI interface accommodates common archaeological praxis rather than focusing on best-practice database design. The openly accessible code can be modified or extended to suit alternative database schemas. We focus here on lithics because abundance of lithic artifacts prompted this effort, but the app could be adapted to recording data about other materials.
TENSIONS IN LITHIC RECORDING
When working with large collections of archaeological material, practical and efficient field (and field-lab) recording of data often involves aggregating artifacts rather than collecting data on them individually. For example, even the most dedicated analyst can more efficiently record “this locus contains 17 unmodified cortical flakes, whereas that one contains 38 burins made on blades, and a third contains 52 denticulates made on a Levallois flake” than produce individual records for each of those 17 flakes, 38 burins, and 52 denticulates—particularly with larger assemblages. Such recording may form part of an initial assessment of material during early stages of finds processing before further analysis takes place, or it may be an end unto itself if research questions—or the informational potentials of, for example, disturbed contexts—do not mandate further analysis. Basic inventories comprising counts and weights of assemblages are often needed in the earliest stages of post-excavation analyses, for preliminary assessments, management of storage facilities, and/or satisfaction of bureaucratic requirements.
Even though artifacts are assessed individually to arrive at such counts, and although data about individual artifacts may be an ultimate goal, the process of recording such information in an efficient manner leads to characterization in aggregate rather than by individual artifact. The initial unit of analysis, in other words, is the assemblage of like artifacts (“unmodified cortical flakes,” “burins on blades,” and “denticulates on Levallois flakes” in the example above), and conceptually, each of these represents a row in a data table that records the quantity of artifacts in each category for a given locus (Figure 1a). Artifacts are often similarly aggregated by provenience: as part of a bulk sample or bucket- or screen-load, as well as from a particular excavation context. The resulting records comprise unique sets of characteristics that describe groups of artifacts sharing those attributes.
The contrasts and relationships between assemblage-level (upper table) and artifact-level (lower table) data recording.

Recording data as in the table in Figure 1a results in a data architecture that is at odds with fundamental principles of relational database design, which would suggest that if data will ever be recorded on individual artifacts, then those artifacts should be considered the fundamental unit of analysis. In other words, the table's primary key, which differentiates each record and defines each record as an indivisible unit, should pertain to individual artifacts rather than loci, and the totals should be derived by summing the numbers of artifacts that belong to the same locus and share attributes, instead of being recorded as characteristics of the assemblage from each distinct locus (Banning Reference Banning2020:49). This is illustrated by the artifact-level records in Figure 1b; Figure 1 illustrates the distinct but related datasets produced by assemblage-level and artifact-level recording strategies. In a relational database, a distinct table of loci would typically store and relate any additional information about loci themselves (e.g., excavator, date of excavation, trench), which individual artifacts would in effect inherit.
This tension in data recording between assemblage and artifact mirrors collection and curation practices. Lithic material is typically collected by locus and can be efficiently curated that way (i.e., in bags or boxes organized by locus/context/level). Shifting to identifying, labeling, and curating individual artifacts is labor intensive, often inefficient, and in the cases of many collections or projects, not deemed to have sufficient payoff to merit the investment of time and resources (although at least some artifacts, such as “special finds,” are commonly recorded individually, and in projects where piece-plotting of artifacts is the norm, most are [see, e.g., Bernatchez and Marean Reference Bernatchez and Marean2011; Dibble et al. Reference Dibble, Marean and McPherron2007]).
Archaeologists are accustomed to navigating this tension when collecting and curating material, but it is rarely conceived of as an issue of data recording and management (though see McPherron and Dibble Reference McPherron and Dibble2002:133–135). In the same way that an individual described artifact must be labeled and bagged separately if it is ever to be retrieved from a bag of other material from the same locus, database architecture must accommodate individual artifact description (artifact-level data) if data about individual artifacts are ever to be recorded.
There are two primary advantages of recording at the artifact level, as in Figure 1b:
(1) Additional artifact-level data can be recorded as needed (e.g., if some artifacts are discovered to have other characteristics of interest).
(2) Artifact-level data can be easily summarized in various ways to characterize assemblages (whereas assemblage-level data can never be disaggregated to characterize artifacts).
These benefits, however, must be weighed against the investment of analyst time necessary to record artifacts individually and assessed in light of the specific research questions driving analysis.
To the database designer, it is self-evident that recording data at the artifact level from the beginning is best practice, whereas to the lithic analyst, recording artifact-level data simply in order to develop an initial characterization of the assemblage is not only counterintuitive but an unnecessary and maddening investment of effort and a micromanagement of laboratory practice. The lithic analyst's frustration is only exacerbated by practical realities: a likely scenario—driven by the imperatives of research interests, interpretative potentials, and limited time and funds—is that some artifacts from a given assemblage will be revisited for further analysis and description, whereas others may never be examined again.
There are two obvious solutions to this impasse: (1) record data differently from the beginning (i.e., at the artifact level rather than the assemblage level) or (2) develop a means of data recording that can accommodate iterative data entry, tacking back and forth between assemblage-level and artifact-level analysis. The first option prioritizes prescriptive data management, whereas the second acknowledges the pragmatic basis for working in particular ways and tailors data management strategies to complement those concerns. A third way, often pursued when confronting sites with very large quantities of lithics, sidesteps the problem by designing collection practices so that analyzed assemblages consist only of identifiable tools (e.g., Collet et al. Reference Collet, Hauzeur, Lech, Allard, Bostyn, Giligny and Lech2008; Kuhn et al. Reference Kuhn, Dinçer, Balkan-Atlı and Erturaç2015:5–6). The manageable quantities of artifacts that result can then be recorded individually. This approach is practical and efficiently generates presence/absence data about artifacts considered technologically or chronologically diagnostic but effectively precludes any characterization of entire assemblages.
We focus here on the second option, discussing a means of efficiently disaggregating assemblage-level data in order to (a) record additional data at the artifact level and (b) reorient the data so that individual artifacts serve as the primary key. The method may be applied to existing assemblage-level data as well as to real-time generation of artifact-level data from assemblage-level data.
ORIENTING DATA MANAGEMENT TO THE PRACTICE OF LITHIC ANALYSIS
In this article, we present a tool for addressing this problem through an R Shiny database interface that enables a lithic analyst to enter assemblage data (or access existing assemblage data) and disaggregate it into artifact records. Those artifact-level records become the primary records in the database, and they are (re)aggregated to constitute assemblage-level data as needed. They can either remain blank, save for an artifact ID and associated assemblage-level data, or they can have artifact-level data entered immediately. This tool makes the creation of sound database architecture possible without imposing an impractical workflow on analysts, it enables further elaboration upon existing datasets, and it contributes to open-science archaeology (Marwick et al. Reference Marwick, Guedes, Michael Barton, Bates, Baxter, Bevan, Bollwerk, Kyle Bocinsky, Brughmans, Carter, Conrad, Contreras, Costa, Crema, Daggett, Davies, Drake, Dye, France, Fullagar, Giusti, Graham, Harris, Hawks, Heath, Huffer, Kansa, Whitcher Kansa, Madsen, Melcher, Negre, Neiman, Opitz, Orton, Przystupa, Raviele, Riel-Salvatore, Riris, Romanowska, Smith, Strupler, Ullah, Van Vlack, VanValkenburgh, Watrall, Webster, Wells, Winters and Wren2017; Ross et al. Reference Ross, Ballsun-Stanton, Sobotkova, Crook, Wilson and Edwards2015). We intend it to be accessible to the community: in addition to a working demo with a sample dataset (https://socialsciences.mcmaster.ca/rshiny/users/batistz/QuARIDemo/ ), a stable version of the R source code is included in the Supplemental Material and archived on Zenodo, and we encourage others to contribute to the software's improvement by accessing the working version in the GitHub repository (see https://github.com/zackbatist/QuARI). More generally, we aim to contribute to a class of tools and approaches that enable flexible analysis and recording, which in turn encourages analysis that is question-driven rather than wholly constrained by initial research design or pragmatic recording concerns.
Practicalities of Lithic Analysis
Lithic analysis, for all its careful formalization by practitioners seeking analytical rigor, remains a continuously revised practice (e.g., Andrefsky Reference Andrefsky2005; Bordes Reference Bordes1961; Debénath and Dibble Reference Debénath and Dibble1994; Rezek et al. Reference Rezek, Holdaway, Olszewski, Lin, Douglass, McPherron, Iovita, Braun and Sandgathe2020; Tostevin Reference Tostevin2011). This is not a criticism; ossification of descriptive analytical practice risks limiting the kinds of questions that may be asked, failing to take full advantage of the observational powers of the trained analyst and precluding imaginative research. Nor is this to say that lithic analysis lacks rigor. Rather, it is prudent to acknowledge that the material being analyzed can resist predefined categories, while constraints of funding and time may limit the work that may be accomplished, leading analysts to develop research programs and recording strategies that respond pragmatically to these realities. Both practical limitations and strategic sampling decisions can lead analysts to balance broad and shallow recording of large samples with thorough analysis of small samples. In practice, this means that analytical/descriptive categories can be added, lumped, or split as projects progress; initial assessments can be revisited with updated or alternative perspectives; some assemblages can be left behind while work progresses on others; and different assemblages or portions of assemblages may have varying quantities of data recorded about them.
The Stelida Naxos Archaeological Project (SNAP), our case study, focuses on a combined survey and excavation study of long-term exploitation of a chert source on the Greek island of Naxos (Carter et al. Reference Carter, Contreras, Holcomb, Mihailović, Skarpelis, Campeau, Moutsiou, Athanasoulis, Rupp and Tomlinson2017, Reference Carter, Contreras, Holcomb, Mihailović, Karkanas, Guérin, Taffin, Athanasoulis and Lahaye2019; SNAP, 2021). The primary focus of analysis is the large quantity of lithic material, much of it minimally modified, characteristic of a quarry site. Such sites provide unique opportunities for archaeologists, but they also pose unusual challenges, chief among which is the profusion of material that must be recovered, assessed, and analyzed (see, for example, Brewer-LaPorta et al. Reference Brewer-LaPorta, Burke and Field2010; Ericson Reference Ericson, Ericson and Purdy1984; Torrence Reference Torrence, Renfrew and Wagstaff1982). SNAP has included both survey (based primarily on systematic 1 m2 dog-leash collections) and excavation (primarily 1 × 1 m and 2 × 2 m units in colluvial deposits, excavated employing single-context recording); methods have been detailed elsewhere (e.g., Carter, Contreras, et al. Reference Carter, Mihailović, Papadatos and Sofianou2016; Carter et al. Reference Carter, Contreras, Holcomb, Mihailović, Skarpelis, Campeau, Moutsiou, Athanasoulis, Rupp and Tomlinson2017, Reference Carter, Contreras, Holcomb, Mihailović, Karkanas, Guérin, Taffin, Athanasoulis and Lahaye2019). These have produced >291,000 artifacts, grouped for documentation and analysis into collection units (1 m2 survey collections or single excavation contexts) or larger assemblages (aggregates of those, most commonly by location or lithostratigraphic unit). The exigencies of recording such material, while also separating those pieces with the potential to reward further analysis, led to the adoption of an iterative three-level system of analysis and recording.
Level 1
This level comprises the quickest and least detailed form of analysis, recording only artifact counts and weights for collection units. These data obviously cannot address the character of lithic material, but they provide a general impression of the abundance and density of archaeological material.
The simple quantification provided by Level 1 analysis was an important component of survey strategy, helping us to define site boundaries (and consequently survey extent) based on artifact distribution and to target artifact-rich “hot spots” for further investigation. Although excavation strategy is less immediately responsive to results of preliminary analysis, Level 1 results inform excavator and supervisor decisions in the field. All artifacts from survey and excavation at Stelida are processed in the Level 1 scheme. It is rapid, and once artifacts have been scanned by lithic analysts to remove noncultural material, it is work that can be undertaken even by less skilled personnel.
Level 2
This level of analysis involves recording a greater range of information, and consequently requires greater time, more in-depth knowledge of lithic technology, and a more skilled analyst. That analyst details a range of attributes for the artifacts in each assemblage, recording that information at the assemblage level. The aim is to characterize the absolute and relative abundance of formal and/or temporally diagnostic tools in each assemblage, with a particular focus on typology and technology, since those are used to infer chronology. With this in mind, in Level 2, artifacts are divided into groups according to the type of blank and modification, as well as any inferred date; raw material and degree of weathering are also assessed as categorical variables. Blank classification (e.g., as nodule, core, flake, blade, rejuvenation piece, among others; each blank has subdivisions based on percentage of remnant dorsal cortex) employs primarily technological criteria that have been defined globally (e.g., Andrefsky Reference Andrefsky2005; Inizan et al. Reference Inizan, Reduron-Ballinger, Roche, Tixier and Féblot-Augustins1999). Categories of retouch/modification draw on a mixture of regional and global terminologies—for example, with “Mousterian point,” or “notch.” Chronological assignment (e.g., Lower, Middle, or Upper Palaeolithic, Mesolithic) draws on criteria established by local/regional lithic specialists (e.g., Debénath and Dibble Reference Debénath and Dibble1994; Perlès Reference Perlès1987, Reference Perlès1990; Sampson et al. Reference Sampson, Kaczanowska and Kozlowski2010).
Level 3
This level of analysis consists of more detailed documentation, where blank integrity (proximal, medial, etc.), platform type, dimensions, retouch type (e.g., marginal, covering) and location (e.g., dorsal, distal), and other techno-typological specifics are recorded at the artifact level. These include, for example, the presence/absence of a lip on a blade butt (index of knapping mode), projectile form (chrono-cultural index), or specific nature of rejuvenation flake (e.g., “core tablet”), with additional categories included as necessary. Specific terminologies employed once again draw from both global and regional traditions of lithic analysis (e.g., Debénath and Dibble Reference Debénath and Dibble1994; Inizan et al. Reference Inizan, Reduron-Ballinger, Roche, Tixier and Féblot-Augustins1999; Perlès Reference Perlès1987, Reference Perlès1990). Selected artifacts are drawn and/or photographed.
This three-level analytical system is in part a response to the quantity of lithic material recovered from Stelida: the time and cost of recording every artifact at the level of detail one associates with thorough lithic studies from non-quarry sites would be prohibitive. It is also important to emphasize that in-depth artifact-level recording of entire assemblages may not offer substantial return on such an enormous effort; large assemblages can be sufficiently characterized by detailed analysis of representative samples. Moreover, expedient and extensive analysis (Level 2 recording) at the assemblage level frees analysts from the necessity of substantial investments of time in each artifact, and therefore enables more detailed intensive analysis (Level 3 recording) that might not otherwise be possible (see Drennan Reference Drennan2009:81–82).
For the SNAP lithic analysts, this approach developed as a response to (a) the hyperabundance of artifacts, and (b) the need to provide rapid feedback to the survey team to guide ongoing fieldwork. Analysts working on survey and excavation assemblages from Aegean contexts typically face significantly smaller assemblages—rarely more than a few thousands of artifacts (e.g., Carter Reference Carter, Papadatos and Sofianou2015; Carter, Mihailović, et al. Reference Carter, Contreras, Doyle, Mihailović, Skarpelis and Ghilardi2016). In these cases, artifact-level analyses are the primary means of interrogating the archaeological materials, with assemblage-level considerations only being evoked when making inter/intrasite or regional comparisons—for example, with regard to average pressure blade widths as an index of distinct knapping traditions within the southern Aegean Early Bronze Age (Carter Reference Carter, Papadatos and Sofianou2015:124–126, Figure 55).
Although the use of sampling strategies when dealing with artifact-rich quarry sites is well established (e.g., Shafer and Hester Reference Shafer and Hester1983; Torrence Reference Torrence, Renfrew and Wagstaff1982), even in such contexts, sampling is not necessarily viewed as de rigueur. The compelling imperatives of characterizing chronology and/or technology may push researchers toward collecting exclusively diagnostic materials rather than employing formal sampling strategies (e.g., Collet et al. Reference Collet, Hauzeur, Lech, Allard, Bostyn, Giligny and Lech2008; Kuhn et al. Reference Kuhn, Dinçer, Balkan-Atlı and Erturaç2015). SNAP addressed this through a combination of spatial sampling and collection and rapid analysis of diagnostic material that could guide further sampling (e.g., in areas with material diagnostic of a particular period [Carter, Contreras, et al. Reference Carter, Contreras, Doyle, Mihailović, Skarpelis and Ghilardi2016:278]). Such use of assemblage-level data to guide ongoing fieldwork at a quarry site has also been employed elsewhere (at, for instance, the Mount Jasper source in New Hampshire [Gramly Reference Gramly, Ericson and Purdy1984:14–16] and chert outcrops in Tennessee [Franklin Reference Franklin2001]). Attempts to develop methods of aggregate analysis of debitage (e.g., Ahler Reference Ahler1989; Andrefsky Reference Andrefsky2005:131–141; see Shott Reference Shott1994) respond to the same dilemma that we outline above—extensive versus intensive analysis—and constitute even more expedient means of collecting assemblage-level data (by, for example, size-grading) than the Level 1 analysis outlined above. In contrast, focusing exclusively on identifiable tools and products, for which artifact-level data can be collected since quantities are limited, constitutes an implicit abandonment of any attempt to characterize entire assemblages.
Common Strategies for Recording and Analyzing Large Quantities of Lithics and Managing the Resulting Data
The hyperabundance of lithic material at a quarry site poses a challenge to not only fieldwork but also data recording, management, and analysis. Where quantities of material are unwieldy, research questions must contend with salient practical realities. Strategies for recording, analysis, and management depend on available financial resources, time, skill/training of available analysts, and technology. Addressing these challenges involves several common goals:
(1) Centralization of an up-to-date repository of data
(2) Creation and maintenance of consistent data structures, which express parity within and across datasets
(3) Maintenance of persistent metadata, particularly metadata pertaining to archaeological provenance
(4) Accurate manifestation of methodological standards or institutional priorities adopted by the project
(5) Organization, preparation, and synchronization with the flow of archaeological materials and records
(6) Curation of data with a focus on maintaining their value and enabling their future use
Archaeologists rely on various kinds of digital information systems—primarily spreadsheets and relational databases—to meet these goals and to ensure that data are collected and maintained effectively and efficiently. These tools are often used alongside paper recording sheets, which may be later transcribed to digital formats, as well as paper notebooks, photos, and illustrations that are used to capture representational information about, or qualitative descriptions of, lithics. There are no broadly accepted data standards either for recording archaeological data generally or lithic attributes particularly. Funding agencies often mandate data curation practices, but the data curated maintain idiosyncrasies, reflecting varying recording practices and the diversity of artifacts and assemblages. Moreover, although there is a broad consensus that relational databases are superior data management tools, use of simple spreadsheets persists because their familiarity and ease of use contrasts with the perceived difficulty of constructing relational databases.
Although spreadsheets are useful for creating independent datasets, each stored in a single file, they are not meant to be used to organize broader sets of information. They are a clumsy method of organizing related datasets because they lack the means of ensuring the integrity and consistency of data across disconnected spreadsheets. Partly as a result, they do not have the ability to retrieve data efficiently across multiple tables (whether these are separate files or sheets within a single file). For instance, there are limited means for ensuring that records are unique, for drawing formal relationships between indexes that might facilitate lookups across tables, or for preventing the accidental deletion or overwriting of values on which other records may depend (Archaeological Data Service 2013).
Nevertheless, due perhaps to their familiarity and ubiquity, archaeologists often use spreadsheets to organize multiple datasets (e.g., from different excavation units at a site), although this requires careful coordination and communication among all users to ensure that data remain consistently organized, and it renders subsequent querying of data complex. Even with clear communication and coordination, this can be extremely challenging when high volumes of material are being processed according to asynchronous or irregular workflows—typical of archaeological finds processing—in which various specialists complete distinct kinds of processing at varying times and tempos.
The amount of effort needed to coordinate analysts, maintain consistency among data tables, and query data can be mitigated through implementation of a relational database stored in a centralized computer system. Relational databases store different datasets across a series of tables, whose records may relate to each other through references among each table's indexes (Ramakrishnan and Gehrke Reference Ramakrishnan and Gehrke2003:59–60). This enables the automatic querying or updating of data across multiple tables, as long as relationships are properly defined between matching indexes. Although pivot table features in spreadsheets enable cross-tabulation of data, if these three types of data exist instead in independent spreadsheets, they can only be integrated manually (by separately filtering the records from each table), even when they share a common index.
Archaeological use of relational databases embraces both custom-built databases and commercial database management systems (see Banning Reference Banning2020:Chapter 4). Historically, storing data has moved from custom-built databases, to standalone instances of commercial databases (see Richards Reference Richards1998:333–335), to web-hosted relational databases, accessible from multiple computers and locations (Opitz Reference Opitz2018). Web-hosted relational databases are sometimes intended for public as well as research audiences (Tringham Reference Tringham2004). Integration of databases into archaeological practice has come far enough that Banning's recent methodological manual describes relational databases as “the mainstay of archaeological data management” (Reference Banning2020:50). A further goal is the anticipation of data analysis implications at every phase of excavation (Roosevelt et al. Reference Roosevelt, Cobb, Moss, Olson and Ünlüsoy2015).
Generally speaking, relational databases streamline querying and updating data, making data storage and retrieval not only more efficient but also more reliable. Schloen and Schloen (Reference Schloen and Schloen2014) provide an in-depth overview of advantages that databases have over document-based recording systems, particularly the ability to atomize and integrate records systematically along well-defined information structures. Information stored in such a manner is easier to retrieve, transform, and integrate with digital tools (Kintigh Reference Kintigh2006), as well as easier to update efficiently and accurately.
The ready availability of relatively user-friendly commercial options makes them widespread, and there are several free and open-source alternatives in addition to the multiple commercial platforms used to construct and maintain relational databases. Although quantitative data on software use in archaeology do not exist, the authors’ experiences in Anglo-American archaeology suggest that the most common platforms used by archaeologists are Microsoft Access, Apple FileMaker, and LibreOffice Base, which are distinguished by their supposed easy setup and ability to create built-in user interfaces for data entry purposes. These commercial databases enable relational data structures, form-based data entry, and data queries, but they tend to provide rigid, static, and non-interoperable interfaces that are difficult to modify to suit changing workflows. In effect, users are expected to largely adapt data-recording practices to meet software requirements.
These purportedly “simple” database products in fact pose barriers to developing information management systems that may more effectively adapt to suit archaeological workflows, which tend to evolve on a pragmatic basis in fieldwork settings. The desire for archaeologically tailored—or simply more customizable—databases continues to drive development of purpose-built software solutions, some of which have long traditions of use in the field (e.g., Entrer Trois and, subsequently, E4 and E5, iDig, FAIMS, and ARK). Averett and colleagues (Reference Averett, Gordon and Counts2016) discuss several of these.
Free and open-source software (FOSS) tools not only enable transparent and open science but also address equity of access by being more widely accessible (Ducke Reference Ducke, Wilson and Edwards2015; Ross et al. Reference Ross, Ballsun-Stanton, Sobotkova, Crook, Wilson and Edwards2015). They also tend to be extensible and modifiable to suit the evolving needs of users. Database management systems such as MySQL, MariaDB, SQLite, and PostgreSQL are meant to be integrated with web-based toolsets that enable greater versatility when developing and distributing user interfaces. By rendering a user interface using the ubiquitous HTML, CSS, PHP, and JavaScript front-end development languages, and hosting the code on either a local or internet-connected server, a developer need only update the code in one place to implement changes for all users. Code may also be written to directly interface the database with other computer systems (e.g., importing data in bulk from a series of processed spreadsheets, sending data to servers maintained by collaborating projects, exporting data or subsets for analysis, etc.). Moreover, software tools built on accessible code can be managed, documented, shared, and collaboratively written much more easily than those built using platforms that mask actual functionality behind interfaces that sacrifice functionality and customizability for (perceived) accessibility. Commercial interfaces are often superficially more user-friendly, but they actually serve to limit functionality to preconceived and prepackaged functions.
QUERYABLE ARTIFACT RECORD INTERFACE (QUARI): AN R SHINY DATABASE INTERFACE FOR ITERATIVE LITHIC ANALYSIS AT ARTIFACT AND ASSEMBLAGE LEVELS
The Queryable Artifact Record Interface (QuARI) is a front-end interface that enables data to be entered from multiple terminals into various tables in a database back end and simultaneously refreshed in the user interface to reflect any changes. It is designed using the R statistical programming language (R Core Team 2018), using the shiny package (Chang et al. Reference Chang, Cheng, Allaire, Xie and McPherson2018) for creating dynamic data visualizations that react to user input. QuARI is designed to facilitate the irregular, iterative, and nonlinear workflows commonly employed in lithic analysis both at SNAP and elsewhere. In other words, QuARI is intended to allow the kinds of workflows that SNAP lithic analysts prefer (whether because they have been determined to be the most efficient, conform to some logic of practice, have responded to changing research imperatives, or out of sheer bloody-mindedness). As noted above in the description of the three-level recording system employed by SNAP, these workflows tack back and forth between recording assemblage-level and artifact-level data—often beginning with the former and subsequently adding the latter—and they may involve the addition of particular kinds of data for subsets of artifacts. Addressing these goals has produced the particular interface that we discuss here, but the QuARI code can be modified to accommodate other goals, data structures, and recording strategies. It provides a flexible and customizable interface that enables intuitive use of a FOSS database platform.
The Front End
QuARI accommodates these workflows by mimicking the familiar spreadsheet approach, allowing entry of either assemblage-level or artifact-level data at the front end (Figure 2). If assemblage-level data are entered, QuARI checks to see if corresponding artifact-level data exist, and if they do not, it generates the artifact-level data that are implied by the existence of the assemblage-level data that have been entered (illustrated in Figures 3 and 4). Many artifacts (in SNAP's case, the vast majority) will never have individual identities, and the only data that will ever be recorded about them are the assemblage-level data that they inherit from their locus. For others, further data recording can involve assemblage-level data and/or artifact-level data, as the user prefers.
Screenshots of the app in use. Users can filter the dataset and/or enter data using the fields at the top, and view and modify records in the bottom panel. In the upper left panel, Trench 004, Context 0031 has been selected and filtered for Mesolithic flakes with cortex class 2 or 3, so all unique combinations of artifacts associated with that locus that meet those conditions are displayed in the Level 2 tab. Selecting one of those rows (Mesolithic Flake 2 and 3 with “combined” modification, in the example) allows the user to access (view and/or edit) the records for those seven artifacts in the Level 3 tab (shown in the middle panel). The Photos and Illustrations buttons for a particular artifact (AR008381, in the example) analogously give access to any records particular to that artifact in the associated tabs (Photos, in the bottom panel).

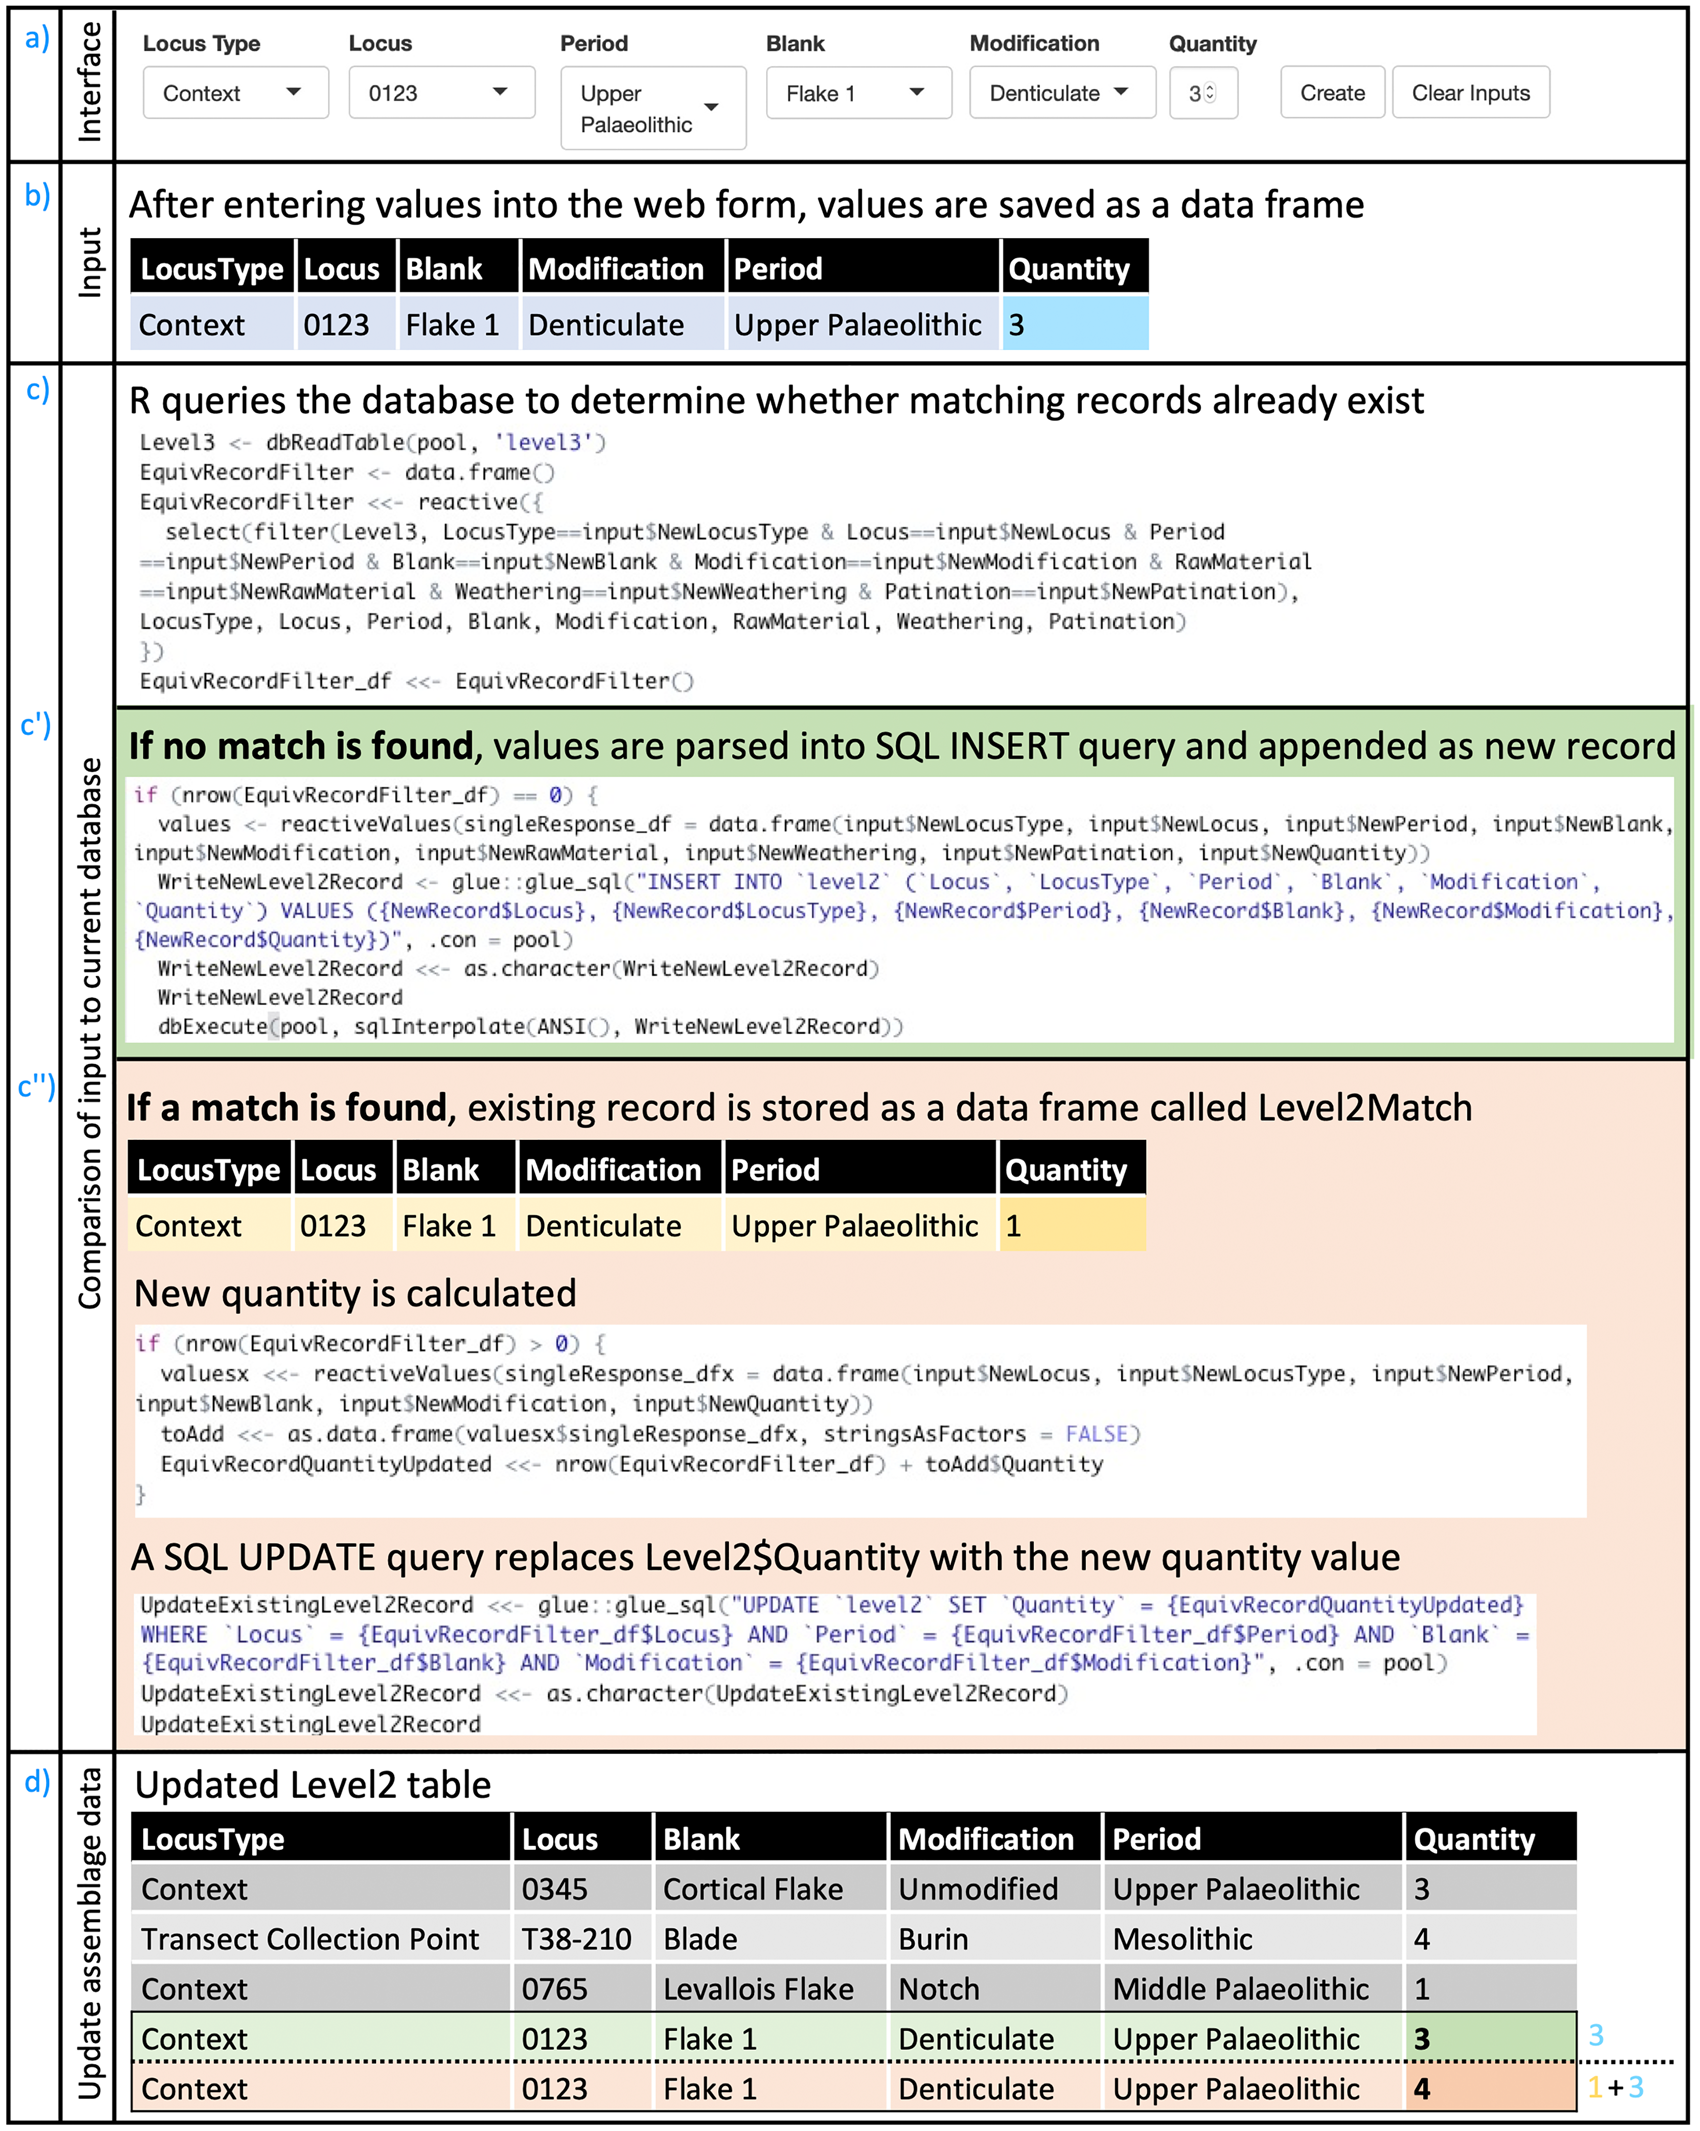
Users are presented with the R Shiny interface through their browser (a). Their input in these fields produces a data frame (b) that is compared to the existing data maintained in the database (c). In case no record matching the same parameters is found (c'), a new record is created. In case a Level 2 record with the same values already exists (c''), that record (shaded yellow in c'') is updated to reflect the additional data the user has just input (shaded teal in b). In either case, the Level 2 table is updated accordingly (d), whether by adding a new record (shaded green, corresponding with actions taken in c') or by changing the quantity for an existing record (shaded orange, corresponding with actions in c''). The last two rows in the table illustrated in (d) are consequently two alternative end-states: either three new denticulate flakes are created for Locus 0123 (green row), or three new denticulate flakes are added to the one already recorded for Locus 0123 (orange row). Creating a new record or updating the quantity of lithics for an existing record in the Level 2 table (assemblage-level data, illustrated in Figure 2) necessarily implies changes to the Level 3 table (artifact-level data, illustrated here). Finally, the R Shiny interface queries the database to obtain up-to-date versions of these tables, which are then re-rendered in the browser interface.
As Level 2 records are either created or modified (illustrated in Figure 2), the Level 3 table is queried to determine the highest existing ArtefactID, and a sequential list of new ArtefactIDs is generated, the length of which corresponds to the quantity of new records implied by the updated Level 2 table (a). A temporary data frame is generated (b) that includes as many rows as there are new ArtefactIDs. It is populated with the values entered by the user as assemblage-level data, matching corresponding values in the Level 2 table; additional data pertaining to the individual artifact (e.g., raw material type, metrics) may also optionally be added. This temporary table is then appended to the Level 3 table in the database (c). The R Shiny interface then queries the database to obtain up-to-date information, which is subsequently re-rendered in the data tables visible in the browser.

As with any user interface, QuARI is merely a layer situated between the analyst and the database. It is designed, however, as a dynamic liminal space, where the data entered by the user are transformed in useful ways before being deposited into tables in the database back end. This is accomplished by leveraging R's flexible and powerful data-wrangling capabilities. The shiny package is used to render the data in ways that invite users to engage with them, and, in particular, shiny's reactive programming model is applied to facilitate dynamic transformation and re-rendering of data. QuARI is designed to communicate directly with a MariaDB or MySQL relational databaseFootnote 1 (made possible by the R packages RMariaDB [Müller et al. Reference Müller, Ooms, James, DebRoy, Wickham and Horner2018] and DBI [R Special Interest Group on Databases (R-SIG-DB) et al. Reference Wickham and Müller2018]) hosted on a database server running on any device accessible on a local network or over the internet. Having the database on an independent server instance helps maintain consistency and integrity of data across tables, allows multiuser access that fosters collaboration, and produces data that are centralized and always up to date. Detailed instructions about how to set up and connect QuARI with a MariaDB or MySQL database can be found in QuARI documentation.
As an interface with a database, QuARI is not simply a convenient wrapper—it plays a particularly important role. It allows data entry to effect changes in more than one way, in more than one environment. This is because data of varying granularity are simultaneously recorded across related tables. Automating this task allows lithic analysts to focus on lithics rather than data structure, accommodating both the needs of database architecture and the workflows that analysists prefer. In other words, QuARI enables analysts to work with a database in which individual artifacts and assemblages relate to each other as both discrete and nested components.
It also casts data entry and data retrieval as somewhat symbiotic processes, providing up-to-date snapshots of existing data for lithic analysts to consider as they analyze finds and enter data. This allows analytical and sampling decisions to be made “at the cursor's edge” and enables real-time checking of data accuracy. For instance, after data are deposited in the database, the updated tables are then re-presented to the user to reflect changes that have been made. Those data may also be summarized on the fly, so that in addition to tabular data, users may see summaries of the results of their queries and/or edits. Preliminary work has been completed on an extension that provides numerical summaries and dynamic graphical outputs to facilitate further on-the-fly exploratory data visualizations (Zogheib Reference Zogheib2020). For example, users who are making decisions about whether to draw artifacts as they work through an assemblage can first examine how many artifacts have been drawn from various periods, contexts, or areas.
The Back End
The data entered in the Level 1, 2, and 3 analyses detailed above are stored in linked tables whose relationship is illustrated in Figure 5. The process by which data entered in one of those tables ramifies through the others is detailed in Figures 3 and 4. The continuously updated projection of the database seen in the user interface is a “total” or “ideal” state, whereby there is a balanced isomorphism between all assemblage-level and artifact-level records (comprising, in the SNAP case, the data from Level 2 and Level 3 analyses, respectively). In such a state, each assemblage-level record (e.g., of an excavation context) exists alongside a series of corresponding artifact-level records whose quantity equals the value stored in the assemblage record's “Quantity” field. The total number of records in the artifact table equals the sum of all quantities in the assemblage table, and the quantities in the assemblage table equal the number of rows for each locus in the artifact table (see Figure 4).
Schematic of levels of analysis, associated tables, and their relationships in QuARI as developed for SNAP.

R facilitates this by enabling data to be added, updated, deleted or otherwise transformed in more than one way, across multiple tables, simultaneously. As new records are added or existing records are updated in one table, changes are made in others. As Figures 3 and 4 illustrate, QuARI works by querying the existing database to check whether the requested task involves creating new data and/or editing existing data. The results of those queries are rendered as tables in the R Shiny interface using the DT package (Xie et al. Reference Xie, Cheng and Tan2018) and manipulated using the dplyr and reshape2 packages (Wickham Reference Wickham2007; Wickham et al. Reference Wickham, François, Henry and Müller2018).
In cases where only assemblage-level data exist or are input, QuARI uses “ghost” records in the artifact-level table, which are not associated with any specific lithic, but they exist nonetheless to satisfy the balance of the total state—that is, in keeping with database logic, no assemblage can exist without unique records for each of its constituent elements, even when that assemblage is entered into the database as an assemblage rather than as a series of elements. QuARI solves this problem by generating the individual artifact records implied by any assemblage record, but in the absence of individually identified artifacts in each assemblage, that assemblage is simply assigned a range of artifact IDs that correspond to the quantity of artifacts recorded. When it is deemed necessary to give a specific lithic a unique identity—in order to record its unique characteristics and make it readily identifiable so that it can be recalled individually from a largely undifferentiated collection—an undesignated ghost record is given substance through the assignment of a particular ArtefactID to a particular artifact with particular characteristics. Information about any characteristics assessed is recorded, and that ArtefactID is also written on the physical object to identify it. Like Schrödinger's cat, ghost records exist in a potential state until it is deemed necessary to “open the box,” thereby reifying the record as a representation of a particular object whose unique identity can be recognized with absolute certainty. These “Schrödinger's lithics” make it possible to efficiently record both lithics that will never be individually examined in detail and particular identified lithics that have recorded characteristics. QuARI also allows users to see and update records pertaining to photographs and illustrations of various lithics. Unique identifiers for each photo and drawing, as well as pertinent data (e.g., filename, attribution, notes), can be created and associated with any given ArtefactID. When artifact-level entries are created, either by direct input or from extrapolation from a new set of assemblage-level records, they are created in the artifact-level table. The table then gets reread, the app gets refreshed, and users can immediately access that data either for additional data entry or in response to a query.
By default, users are prompted to select from a preset list of values when designating attributes of an artifact or assemblage. This encourages the use of consistent spelling and terminology to describe specific features. However, some degree of flexibility is also called for by lithic analysts, who recognize that unexpected types appear from time to time. QuARI enables users to add new values to the preset lists, thereby updating options from which users may select in the future. Additional values and/or variables can be added as needed (in SNAP's case, for instance, new blank types and modification types have been added over time, and artifact metrics are added for particular subsets of artifacts).
A layer of data security is provided by a log. All actions that modify data stored in the database are documented to record these changes. These logs track changes in the database, and they are potentially useful for pinpointing exactly when problems in recording occurred, as well as in implementing necessary corrections.
Using QuARI
In sum, QuARI navigates the web of relations among records spread across a relational database's various tables in ways that facilitate lithics analysis. This allows lithic analysts to focus on the task at hand—recording variously assemblage-level and artifact-level data as desired—rather than worrying about systemic issues relating to the long-term maintenance of the database and the utility of data they record. All changes are made in a centralized repository, they are recorded in an easily understood activity log, and they are arranged to continuously reflect a state of complete isomorphism throughout the database. QuARI is therefore a working environment where users can see and act on the changes they make in real time, enabling users to work simultaneously, without risk of submitting overlapping or mismatched data.
We have taken care to ensure that QuARI can work as part of projects other than SNAP. It relies on open tools and standards, and it is itself open-source. This means that the code can be easily modified to suit the specific needs of users, as warranted by local circumstances. Technical specifications have been written to inform database administrators regarding how they might modify the code to suit their specific database schema and/or platforms. All code and documentation, under continued development, is hosted at https://github.com/zackbatist/QuARI, where users, maintainers, or anyone who is interested can raise issues, receive support, and/or suggest ways to improve the program. A stable snapshot of the code, as well as this documentation, is included in the Supplemental Material. The GitHub site hosts a minimal database template that can be extended or modified to suit the needs of specific projects or use cases (see https://github.com/zackbatist/QuARI/blob/master/QuARI-template.sql), as well as more detailed instructions regarding how to set up the app with one's own database instance (see https://github.com/zackbatist/QuARI/blob/master/README.md). We have also prepared a demo version. This demo consists of a small dataset modeled on the SNAP database that incorporates fictionalized data on lithic assemblages from both survey and excavation contexts.
As creators and maintainers of this open-source project, we welcome others to contribute to extending QuARI's functionality. Potential avenues for further development include integration with file servers to help manage and store photos and scanned illustrations, intake of data from USB-connected calipers and scales, integration with geospatial databases, and more tools for data exploration, summary, and visualization. Broader applications could include facilitation of more effective management of other heterogenous datasets, including other kinds of archaeological finds, features, and samples. We envision users adapting QuARI to their own needs, and we expect that it will be most useful in cases where there is a need to integrate existing tabular data into a database structure—either as projects evolve or in the use of legacy data and collections (St. Amand et al. Reference St. Amand, Terry Childs, Reitz, Heller, Newsom, Rick, Sandweiss and Wheeler2020).
CONCLUSION: QUARI IN ACTION
The three-level system employed by SNAP was driven by practical realities as well as research questions, but it should not be understood simply as a forced compromise. First, as we note above, it is often neither possible nor desirable to analyze every artifact of a given assemblage exhaustively. Second, in any project, effort has to be expended in a strategic manner in relation to practical and logistical constraints. Such strategic management concerns are characteristic of archaeological projects, not merely inconveniences to them.
Archaeological data infrastructure often has to adapt to existing recording practices and data organization: in cases, for instance, when data infrastructure is not purpose-built at the project's outset, when unforeseen changes in recording needs occur, and when legacy data are integrated. Using R Shiny to provide a browser-based interface makes it possible, through data wrangling that occurs in the interface between the user and the database, to reconcile existing recording practice with the imperatives of a sound data architecture. The result is, by design, not prescriptive with respect to recording assemblage-level or artifact-level data. Instead, it can accommodate both. QuARI is also intended to be modifiable in order to serve analogous needs of other users, whether or not their particular recording practices/needs and data structures match those of SNAP. Focusing on the database interface and taking an open science approach addresses the challenge that Dibble and McPherron (Reference Dibble and McPherron1988:439) noted in the early stages of integration of databases into archaeological recording: “There will never be one single system that works equally well for every archaeological project, no single, magical solution. . . . We need to develop flexible strategies for integrating this new technology into the discipline.”
QuARI helps navigate this challenge by using R's data manipulation capacity and an R Shiny browser interface to provide a means of turning suboptimal (but common and intuitive) recording solutions into viable database structures. In other words, it delegates the exacting work of database management to computers, freeing humans to characterize the material in front of them in the way that their needs and expertise dictate, with minimal confusion and redundancy.
Acknowledgments
SNAP has been made possible by funding from the Social Sciences and Humanities Research Council of Canada (#435-2015-1809), the Institute for the Study of Aegean Prehistory, and the Archaeological Institute of America (Cotsen Excavation Grant). Survey and excavation permission (survey permit protocol number [minister's decision] ΥΠΠΟΑ/ΓΔΑΠΚ/ΔΙΠΚΑ/ΤΕΞΕΙΟΔΘ/131378/39350/7627/1226/17.10.2013; synergasia protocol number for the excavation ΥΠΠΟΑ/ΓΔΑΠΚ/ΕΦΑΚΥΚ/242933/157547/7081/26-06-2017) were possible thanks to the Greek Ministry of Culture, Cycladic Ephorate of Antiquities (particularly Dimitris Athanasoulis and Irini Legaki), and the Canadian Institute in Greece (particularly David Rupp and Johnathan Tomlinson). Artifacts are housed in the official repository of the Naxos Archaeological Museum of the Ephorate of Cycladic Antiquities on Naxos. We would like to thank Dylan Hickson for his work on the initial stages of database design for the project, as well as the numerous students and colleagues who—by voicing their frustrations with using the database—helped to improve it. Four reviewers provided thoughtful and constructive comments.
Supplemental Material
To view supplemental material for this article, please visit https://doi.org/10.1017/aap.2021.11.
Data Availability Statement
A current working version of the R code for QuARI is, as noted in the text, available on GitHub at https://github.com/zackbatist/QuARI/. A current snapshot of the code is also included in the Supplemental Material, and it is permanently archived on Zenodo at http://doi.org/10.5281/zenodo.4720289. No original data were presented in this article.


 Open access