Human hair has been used in forensic investigations as a source for identification and toxicological testing since the 20th century. Characteristics of the hair, such as skin tags or follicles attached to the follicle end, and broken or damaged hair shaft may indicate force used in the removal of hair; and the color, thickness, and curvature of the hair may provide suggestions for an individual's ancestry and age (Scientific Working Group on Materials Analysis, 2005).
In general, lighter hair is thinner while darker hair is thicker; in Europeans, fair hair measures about 40–80 µm, compared to dark brown hair, which has an average diameter of 50–90 µm (Vogt et al., Reference Vogt, McElwee, Blume-Peytavi, Blume-Peytavi, Tosti, Whiting and Trüeb2008). Across ethnicities, the cross-sectional shape of the hair follicle determines the shape of the hair shaft in determining its curliness-round follicles produce straight hair while flat or oblong follicles produce wavy or curly hair. Previous studies have demonstrated that hair diameter is influenced by the size and secretory power of the dermal papilla, which influences the size of the anagen bulb and in turn determines diameter and rate of hair growth. The overall appearance of hair fibers (i.e., diameter, cross-sectional shape, number of twists, and windings per unit length of an individual hair) may vary with the position of the hair bulb in relation to the hair follicle, the size, and shape of dermal papilla, and the curvature of the follicle along its length.
The biological basis of hair diameter and curvature suggests these traits may be complex and heritable. Human follicle formation begins in the 8th to 12th weeks of gestation, with the development of the follicle and hair fiber cell differentiation followed by growth of the hair fiber (Paus & Cotsarelis, Reference Paus and Cotsarelis1999; Schmidt-Ullrich & Paus, Reference Schmidt-Ullrich and Paus2005). Previous research has shown that hair follicle morphogenesis is affected by a complex network of autocrine, paracrine, and endocrine signaling pathways, as well as regulatory pathways; however, the nature of their interactions and relative significance is not well understood (Vogt et al., Reference Vogt, McElwee, Blume-Peytavi, Blume-Peytavi, Tosti, Whiting and Trüeb2008).
Genes that have been hypothesized to regulate follicle morphogenesis include the WNT gene family, which produces glycoproteins regulating cell proliferation, cell migration, and cell fate in embryos and adults. Previous genetic association studies have found straight hair in Europeans to be influenced by the trichohyalin gene (TCHH; Medland, Nyholt, et al., 2009) and in East Asians by EDARV370A (Tan et al., Reference Tan, Yang, Tang, Sabeti, Jin and Wang2013).
An earlier study (to which a subset of the present sample contributed) showed that 85–95% of the variation in nurse- and self-rated hair curliness can be explained by genetic factors in a sample of twins of European ancestry (Medland, Zhu, et al., 2009). Similarly, a study of different hair types in an admixed Latin American sample also found a 64% of the variance in nurse-rated hair shape, and 74% for beard thickness was due to genetic factors (Adhikari et al., Reference Adhikari, Fontanil, Cal, Mendoza-Revilla, Fuentes-Guajardo, Chacon-Duque and Ruiz-Linares2016). However, to date, there have been no studies investigating the heritability of objectively measured hair curvature and diameter. This study aims to address this lacuna by describing individual variation and estimating the heritability of physically measured hair diameter and curvature in a sample of 3,057 adolescent twins of European ancestry.
Methods
Sample
Hair diameter and curvature data were measured as part of the Brisbane Longitudinal Twin Study (BLTS; Wright, Reference Wright and Martin2004). The BLTS is an ongoing longitudinal study in Australia since 1992, comprising adolescent twins and non-twin siblings and focusing on population-based studies of melanoma risk factors and cognition. Participants were recruited through school and media appeals as well as through word of mouth. Written informed consent was obtained from participants and their parents or guardians, and data were collected at three time points at age 12, 14, and 16. Ethical approval for the study was obtained from the QIMR Human Research Ethics Committee. The present article focuses on data from age 12 (visit 1) and 14 (visit 2). Hair samples were collected by research nurses who also provided subjective ratings of the hair texture in the same twin and sibling sample.
Measures
Diameter and curvature measurements were measured using an Optical Fibre Diameter Analyzer (OFDA 2000, BSC Electronics, Ardross, WA, Australia), based on light microscopy. This technique is well established for measuring wool-fiber diameter and quality, providing accurate measurements of approximately 2,000 fiber samples in the space of a few minutes (Wortmann & Schwan-Jonczyk, Reference Wortmann and Schwan-Jonczyk2006). The original mode of operation of OFDA instruments used fibers cut to a length of 2 mm by a guillotine; however, with straight elliptical fibers there is a high chance that they will roll onto their broad side and provide a significantly higher width reading.
To prevent bias from the cutting of the fibers, hair samples were teased apart by hand and laid between two glass slides and inserted into the machine. Diameter was measured in microns (µm) and sorted into bins between170–590 µm. The OFDA provides the raw diameter data as frequency (number of snippets) per micron bin. For curvature, non-adjoining 200 µm long segments were used to find the angle of the curvature of the fiber and multiplied by 5 to represent the angle of a 1 mm segment of the hair strand, so the resulting measurement is degrees per mm. The OFDA provides the raw curvature data as frequency (number of snippets) per bin (with bins ranging from 0–360°). In addition, the consistency of diameter and curvature within each sample were also provided as the standard deviation of each individual's distribution.
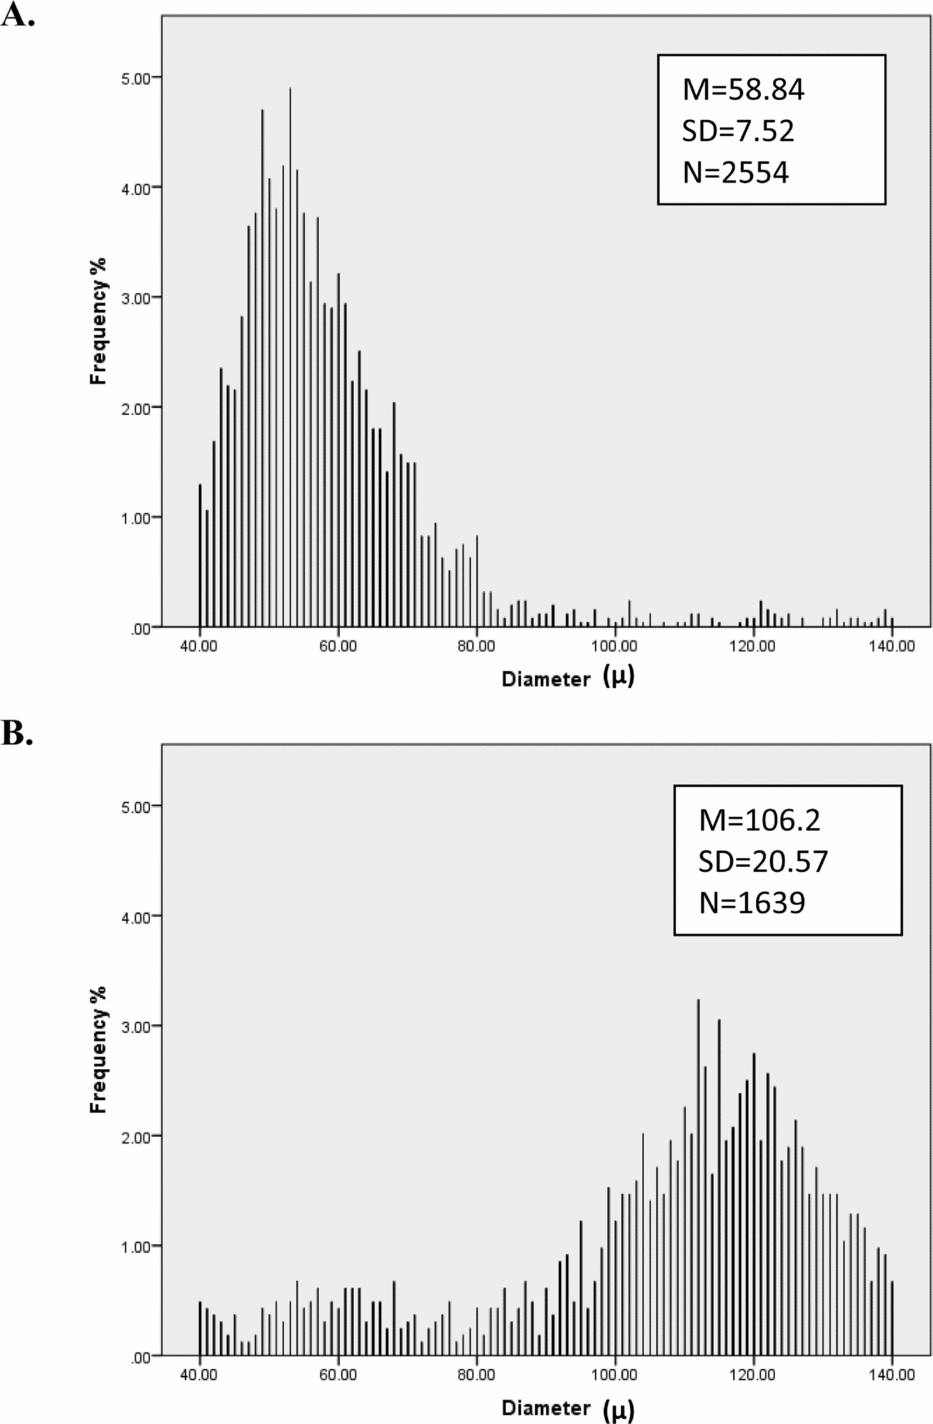
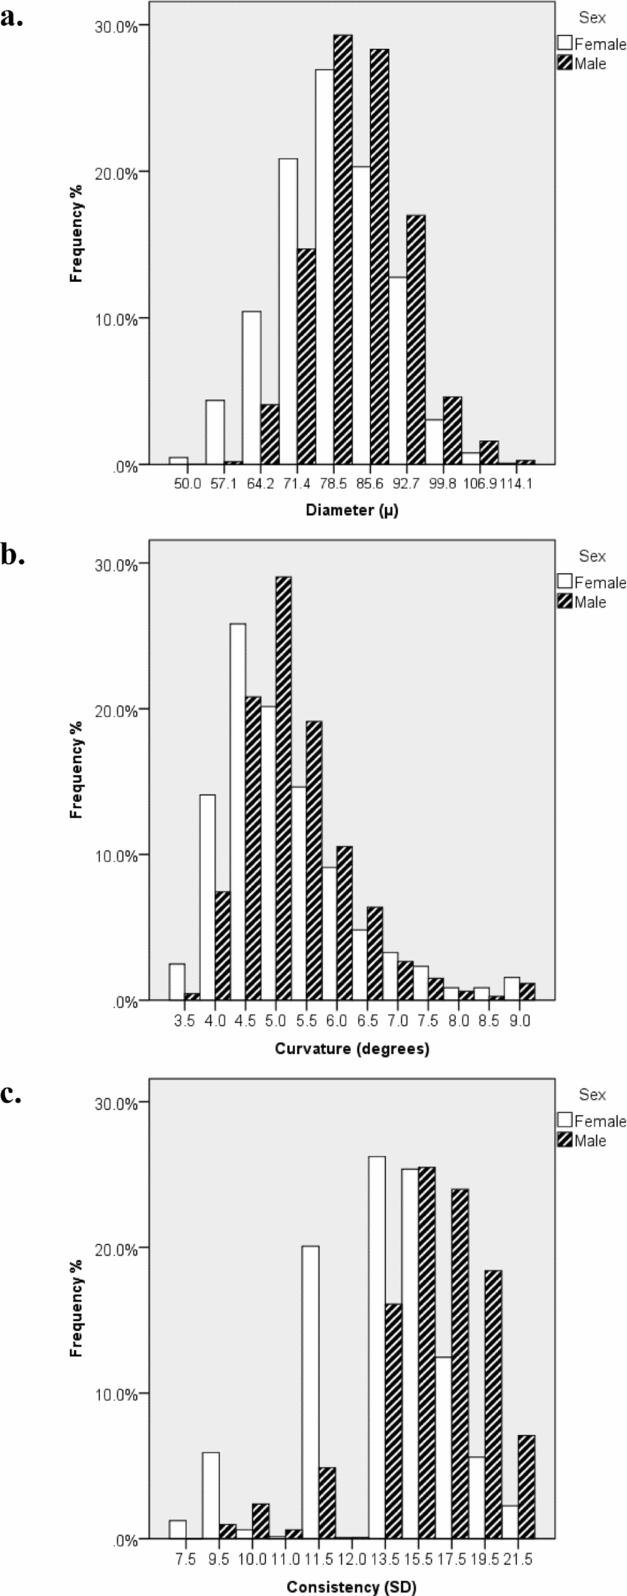
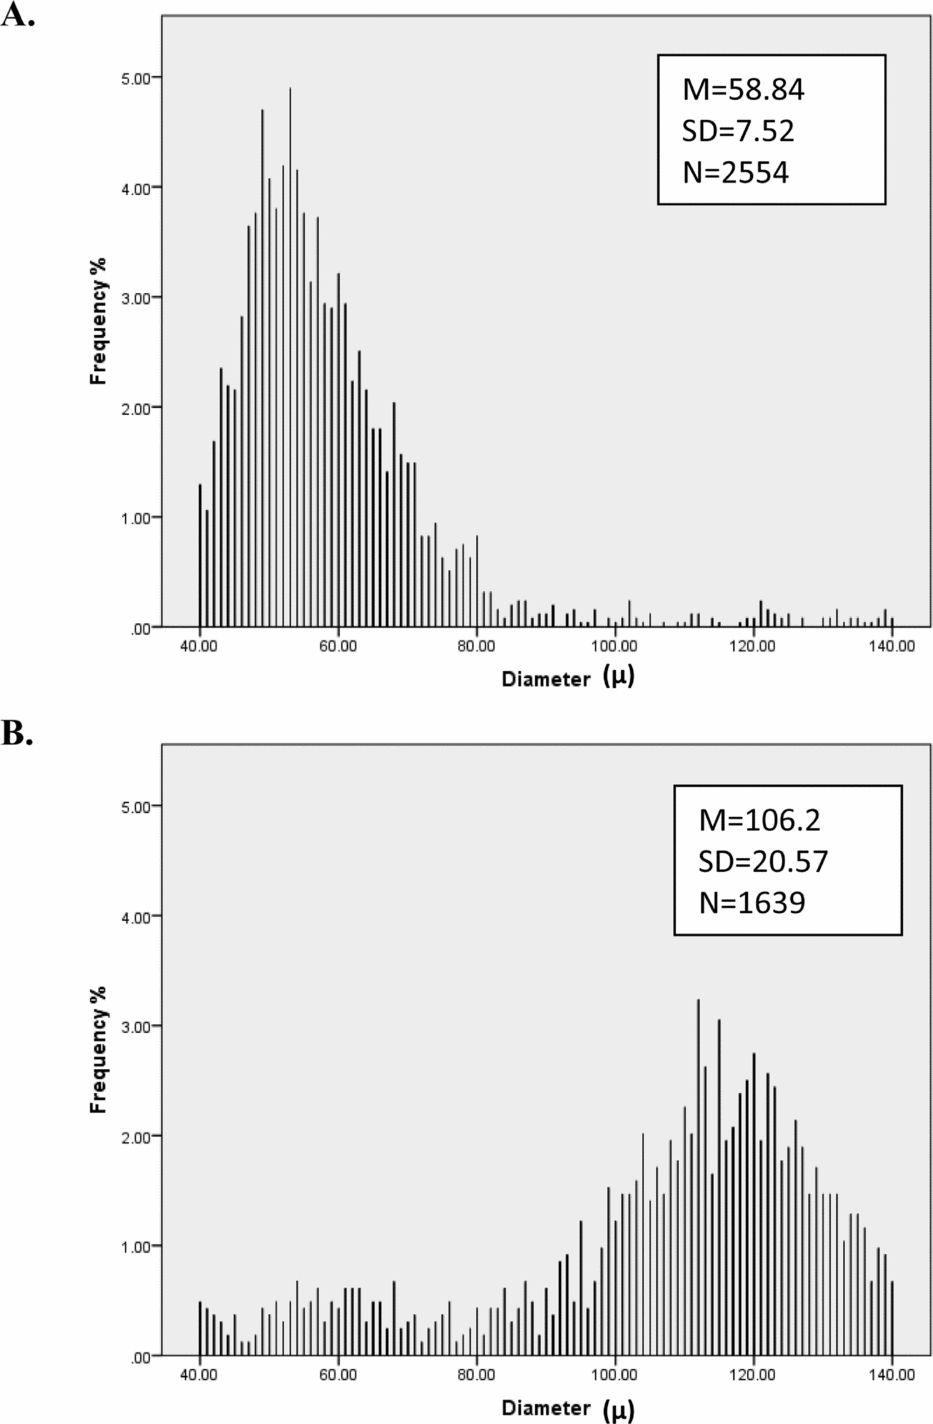
Preliminary analyses show that hair diameter means and consistency as well as curvature means vary greatly among individuals (Figure 1). Consistency of the hair curvature measure proved highly unreliable (as judged by low twin and test–retest correlations) so this measure was not considered further. As Figure 2 shows, the distribution of male and female hair diameter and curvature are approximately normal and exhibit sex differences, while curvature is approximately log-normal; we therefore analyzed log-transformed curvature. Table 1 shows the average number of diameter measurement points and length of hair fibers of each hair sample from males and females at visits 1 (aged 12) and 2 (aged 14).

FIGURE 1 Distribution of hair diameter for two people. Person A has thinner hair and more consistent (lower SD) hair diameter than Person B.

FIGURE 2 Histograms by sex (n female = 1,458, n male = 1,377) for frequency of (a) mean diameter, (b) mean curvature, and (c) diameter consistency. These graphs show that mean diameter and curvature are approximately normally distributed and that there are quantitative sex differences in diameter and curvature, with males having on average thicker and curlier hair. Moreover, males had higher diameter variance compared to females.
TABLE 1 Mean, Standard Deviations, and Range of Number of Hair Fibers Within Each Sample and Hair Length Per Sample

We checked for outliers between individuals and families. Observations beyond three standard deviations above or below the mean were removed for each individual. To check for outliers at the family level, we used the Mx %p function (Neale et al., Reference Neale, Boker, Xie and Maes2003). This resulted in the removal of 44 and 47 families from the hair diameter visit 1 and 2 data respectively, and 5 and 4 families from the curvature data for visit 1 and 2.
Statistical Methods
Prior to estimating heritability, maximum likelihood analyses were conducted to test assumptions regarding the homogeneity of means, variances, and covariances using OpenMx (Boker et al., Reference Boker, Neale, Maes, Wilde, Spiegel, Brick and Fox2011). As darker hair color is correlated with thicker diameter, hair color was included as a covariate in all analyses, as well as sex, age, and ancestry in terms of Northern European versus Southern European descent.
Subsequent simplified models equating means and variances tested for birth order effects, zygosity effects within same-sex twins, differences between same-sex and opposite-sex twin pairs, differences between siblings and twins, and finally, differences between sexes.
To estimate heritability, an ADE model was used in this study as the MZ correlations were more than twice the DZ correlations. Simplified AE and E models were tested for goodness of fit to determine whether parameters could be dropped from the full model. The change in model fit was tested using likelihood ratio chi-square tests. The distribution of twice the difference in log likelihood (-2LL) approximates Δχ2, with the degrees of freedom (df) for this test equal to the difference in df between the models.
Results
Data were available for two time points (age 12 and 14) for 1,431 participants (Table 2) and test–retest correlations (r diam = 0.58; r curve = 0.44, r consistency = 0.59; Table 2). These are compared with corresponding MZ correlations at age 12 (Table 3) of 0.84, 0.58, and 0.72. The fact that test–retest correlations (reliabilities) are lower for each variable points to developmental or transient environmental factors that differ from age 12 to age 14. To maximize sample size, we therefore used the data collected at age 12 to estimate heritability and for further analysis.
TABLE 2 Test–Retest Correlations (Upper Matrix) and Number of Individuals (Lower Matrix) for Mean Diameter, Curvature, and Consistency of Hair Diameter at Visit 1 (Aged 12) and Visit 2 (Aged 14)

Test–retest correlations (upper matrix) in bold type. Number of individuals (lower matrix, in grey). Cross-trait correlations are given in intersecting cells for different traits. 95% confidence intervals are given in square parentheses. Test–retest correlations (upper matrix) in bold type. Number of individuals (lower matrix, in grey).
TABLE 3 Means and Standard Deviations of Mean (Meandiam, Meancurve) of Hair Diameter and Curvature Visit 1 (Aged 12), Consistency (Varconsist) of Hair Diameter, Twin Correlations (r) for Zygosity Groups, and Overall Correlations for MZ and DZ Groups

Twin correlations (r, in bold type) for zygosity groups, and overall correlations for MZ and DZ Groups in bold italic type.
After quality control, hair diameter, and curvature data at age 12 were available for 2,332 twins and siblings from 1,263 families. Data were available for 226 MZ female pairs, 217 MZ male pairs, 237 DZ females, 215 DZ males, 358 opposite sex DZ twins (181 female first-born and 178 male first-born), 260 female siblings, and 76 male siblings. The means, standard deviations and twin correlations of hair diameter means and consistency and curvature means are provided in Table 3.
Hypotheses regarding the means of variables (mean hair diameter, consistency, and curvature at age 12) were tested and no significant differences were found in comparisons except curvature between males and females at age 12 (Table S2). The same series of comparisons were applied to test differences between variances, and these indicated that male and female variances were significantly different for all three variables. To allow for this, we fitted sex limitation models in our analyses.
As shown in Table 3, the MZ correlation (r MZdiam = 0.84, r MZcurve = 0.58, r MZconsistemcy = 0.72) is higher than the DZ correlation (r DZdiam = 0.34, r DZcurve = 0.30, r DZconsistemcy = 0.27), suggesting a genetic influence on mean diameter and curvature observed, as well as the consistency of hair diameter. There were significant differences between male and female correlations for diameter, suggesting the presence of non-scalar sex differences.
Sex-limitation models were used to investigate difference in sources of variance between males and females. Curvature data was best described by a scalar model (AICscalar = 11,923.31 vs. AICnonscalar = 11,928.44) while a non-scalar sex limitation model provided the best fit to the diameter data (AICscalar = 9,593.77 vs. AICnonscalar = 9,587.03). Estimates of A, D, and E variances are presented in Table 4. Although a dominant genetic effect (D) was found for male hair diameter (NSSLdiam vs. NSSL_AEdiam, p = 1.30x10⁻⁶), D was not significant for female hair diameter (NSSLdiam vs. NSSLMaleADE,FemaleAE, p =.18) or curvature (ADEcurve vs. AEcurve, p = .588; Table 3).
TABLE 4 Results of Sex Limitation Modeling for Diameter and Curvature and Consistency

Best-fitting model is indicated in bold, AICNSSLdiam = 9,587.03; AICSSLcurve = 11,921.31; AICADEdiamvar = 6,303.1. 95% confidence intervals (CIs) are provided for the full and best-fitting models.
Abbreviations: GSL = General Sex Limitation; NSSL = Non-Scalar Sex Limitation; SSL = Scalar Sex Limitation; GSL_AE = General Sex Limitation AE Model; NSSL_AE = Non-Scalar Sex Limitation AE model.
The heritability of diameter consistency within each individual was also tested using sex limitation modeling. As Table 4 shows, there were no significant sex differences and a univariate ADE model provided the best fit for the data. Additive genetic effects accounted for 29% of the variance and dominance genetic effects accounted for 38%.
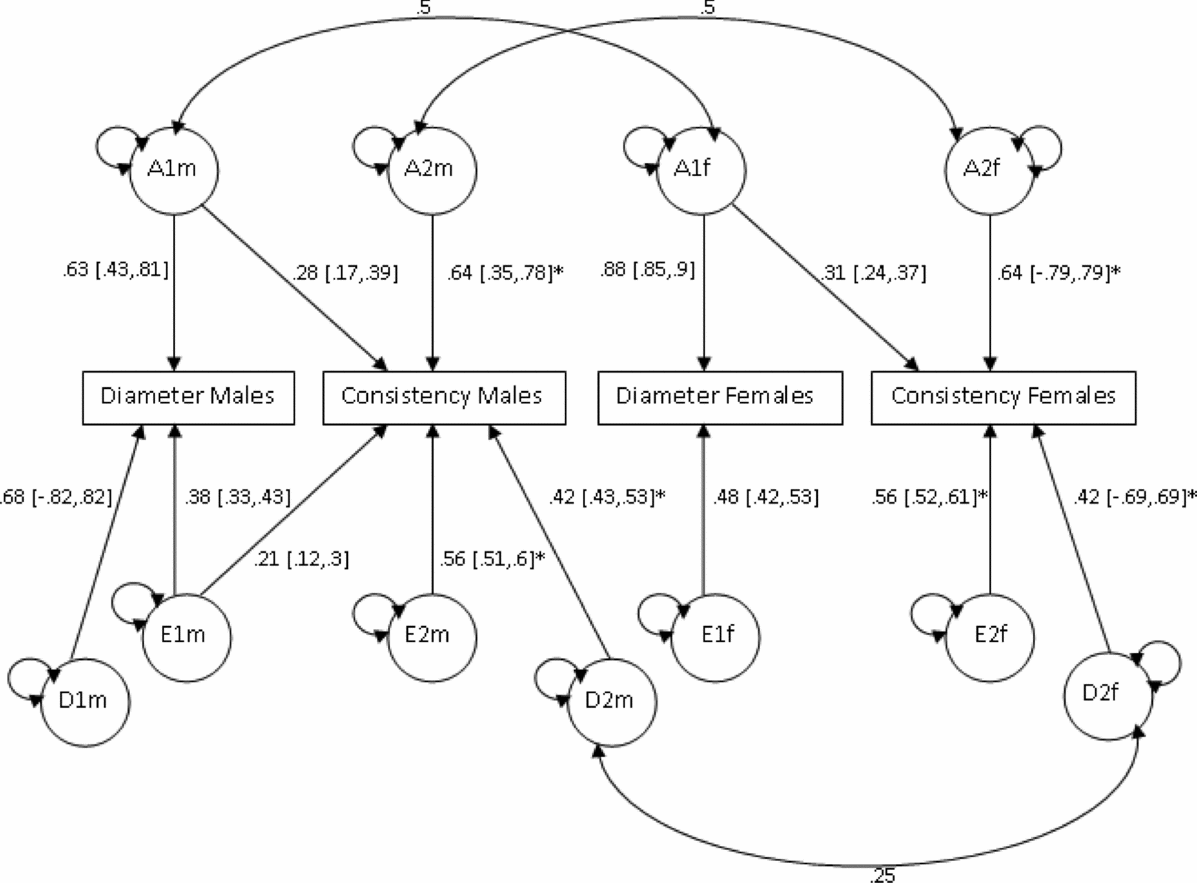
Based on the phenotypic correlations between variables (Table 2), a bivariate Cholesky model was used to examine the causes of covariation between mean hair diameter and consistency of diameter. In order to test whether the source of genetic variation was the same in males and females, additional parameters m11, m21, and m22 were used to model additive genetic variability specific to males (Figure 3). However, model fit was not significantly worse when these estimates were dropped (p =. 81; Table 5). Sex limitation was found for diameter (p = 2.39x10⁻¹⁶) but not consistency (p = .44). Further models dropping covariance due to D (d21) for both sexes, D for diameter for females (df11), as well as the covariance due to E (ef21) for females also did not result in a significant drop in goodness-of-fit (p = .46). As shown in Figure 3, consistent with the univariate modeling, genetic factors accounted for 68% of variance in consistency for both sexes, 86% of variance in diameter for males, and 77% for diameter for females. Cross-trait genetic correlations were for females (r gF = 0.27) and males (r gM = 0.25).

FIGURE 3 Bivariate analysis of mean diameter and consistency Cholesky model (ADE model).
Note: Path coefficients denoted with an asterisk (*) were equated across sexes.
TABLE 5 Bivariate Analysis of Mean Diameter and Consistency Cholesky (ADE Model)

Table shows fit for models equating standardized paths for consistency and covariation in D and E for males and females. Dropping D for males and females and E for females resulted in no significant change in fit. Best-fitting model denoted with an asterisk (*).
Discussion
Hair curvature and diameter are highly polymorphic traits. Using data from twins and siblings in a quantitative genetic analysis, this study has shown that in a large sample of 12-year-old twins and siblings of European ancestry, physical measurements of these traits are significantly heritable, with genetic factors accounting for up to 86% of total variance for diameter, 60% for curvature, and 68% for consistency of diameter.
Similar to previous studies of heritability of subjectively rated hair curvature in Europeans (Medland, Zhu, et al., 2009), which reported heritabilities of 85–95%, this study found that 60% of the variance could be explained by genetic factors. However, the previous study assessed macro-level curvature (categorical self-report) while the present study assessed micro-level curvature. Using the polycor package (Fox, Reference Fox2010) in R, polyserial correlations were calculated between nurse report and OFDA measurement data, yielding a correlation of 0.44, p = .02, n = 1,181, suggesting that while microscopic measurement of hair curvature may have different properties to macroscopic evaluation, there is substantial common variation. Furthermore, the test–retest correlation between ages 12 and 14 for measured curvature was only 0.44. While this low figure may partly represent developmental change, much of it may reflect measurement error, greater than that for subjective rating of curvature.
There was also evidence of sex limitation for female diameter and curvature, suggesting specific differences in genetic and environmental variances in hair diameter and curvature as well as an overall difference in variance for male and females in hair diameter. However, there was no significant sex limitation for consistency. There was evidence of dominant genetic influences on diameter for males and on curvature for both sexes.
Possible environmental factors that may influence hair diameter, consistency, and curvature include the use of shampoo and hair fixatives, deliberate straightening or curling of hair, and exposure to chemicals such as chlorine and calcium in water. Some other issues to consider when interpreting these results include the effect of differences in hair length and hair treatments between males and females. In addition, these data were collected from young adolescents and the generalization of these results to children or adults needs to be assessed.
In conclusion, this study shows that mean hair diameter, consistency of diameter, and measured hair curvature are significantly heritable. For mean diameter and curvature, this effect is moderated by sex. In the next stage of this investigation, genome-wide association analyses will be conducted to try and identify loci that influence hair diameter and curvature.
Acknowledgments
Funding for collection of hair samples from twins was provided by Australian NHMRC grants to NGM. Funding for measurement of hair samples (by Mark Brims, BSC Electronics, Perth) and for salary for Yvonne Ho was provided by an Australian Research Council Linkage Grant (LP 110100121: P.I. Dennis McNevin, Univ. Canberra) with contributing funding from Identitas Inc (principals Mike Fitzgerald, Monaco; Laurence Rubin, Toronto) via the Visigen Consortium convened by Tim Spector (Kings College London); further contributions were from the Victoria Police Forensic Services Department (Runa Daniels, Roland van Oorschot), the Australian Federal Police Forensics (Simon Walsh, Paul Kirkbride), and Unisys Australia (David Chadwick). We thank twins and their family members who participated in the BLTS and provided hair and blood samples, as well as nurses Natalie Garden, Reshika Chand, Ann Elridge, and Marlene Grace, who made categorical ratings of hair curliness; and we thank Kerrie McAloney for coordination. Visigen Consortium: Tim Spector (Convenor), Pirro Hysi (KCL, London); Manfred Kayser, Fan Liu (Erasmus Rotterdam); David Evans, Lavinia Paternoster (Bristol); Nick Martin, David Duffy (QIMR, Brisbane).


