

Both very low and very high rates of turnover of political elites are problematic: the former for its oligarchic tendencies, the latter for a deficit in accountability, professionalism and policy stability. How has legislative turnover in Latin America evolved over time and how do countries compare to each other and with other democracies in this respect? Does the basic setup of the region’s legislative institutions help explain variation in turnover rates? Surprisingly, although turnover has become a pressing concern of legislative studies as well as policy debates in many Latin American countries, comparative data on turnover rates in the region has been missing so far and no comparative analyses of turnover and its determinants have been performed within the region.
This research note contributes (1) by introducing a large original dataset of turnover rates in 204 elections between 1985 and 2023, (2) by describing the cross-national and temporal patterns of turnover in Latin America, and (3) by empirically examining the relationship between turnover rates and temporal institutional arrangements designed to regulate the time horizons of legislators. This follows an understanding of turnover as an essentially temporal process that entails a comparison whether legislators were elected in two consecutive elections or were not. Democracies are governments pro tempore and the time limit stemming from regular elections is one of the main arguments for democracy (Linz Reference Linz1998). Understanding how institutional features shape this temporality is therefore paramount.
We follow the dominant definition of turnover as the share (in %) of membership of a legislature that changes from one election to the next, considering only deputies who entered office through elections (Matland and Studlar Reference Matland and Studlar2004; Heinsohn and Freitag Reference Heinsohn and Freitag2012; Golosov Reference Golosov2017; Gouglas et al. Reference Gouglas, Maddens and Brans2018; Krupnikov and Shipan Reference Krupnikov and Shipan2020). In explaining the Latin American turnover rates, we follow the bulk of comparative analyses in other regions which have principally focused on institutional causes (Rosenthal Reference Rosenthal1974; Moncrief et al. Reference Moncrief, Niemi and Powell2004; Manow Reference Manow2007; Heinsohn Reference Heinsohn2014; Gouglas et al. Reference Gouglas, Maddens and Brans2018). Drawing on these studies, we theorize—and examine empirically—the consequences of temporal institutional arrangements for turnover in Latin America. The research note also contributes by describing and making available an original comparative dataset of turnover rates across the region which is now available for all countries where consecutive reelection of legislators is possible. Turnover rates were calculated from manually coded lists of all individual legislators elected in Latin American elections since 1980, thereby comparing lists from each pair of consecutive elections and identifying reelected legislators.
The frequency, intensity, and character of elite renewal is a crucial question of political theory, placing debates about turnover at the center of the conceptual distinction between democratic and republican forms of government. Favoring maximal turnover, the Athenian democracy was both in theory and in practice, fundamentally organized around the principle of rotation in office (Manin Reference Manin1997, 31). This stemmed from a deep distrust of professionalism in government which constitutes a source of unjust power of the governing class over those without professional skills and knowledge. “The cardinal principle of democracy was not that the people must both govern and be governed, but that every citizen must be able to occupy the two positions alternately” (Manin Reference Manin1997, 28). The republican position on turnover is, on the other hand, best exemplified in the Federalist Papers, a defense of the US constitution. James Madison warned against the “mischievous effects” of a “rapid succession of new members” in legislatures because this entails a permanent change of opinions and therefore of policy measures. Advocating institutional measures to enhance personnel stability, Madison argued that such a continual change of policies is “inconsistent with every rule of prudence and every prospect of success” (Madison 2008 [Reference Madison, Hamilton, Madison and Jay1788)], 307).
Contemporary research reflects these tensions, casting legislator professionalism, long-term perspective in policy making, and legislative experience as positive values associated with low turnover, yet suggesting that higher turnover embodies a positive democratic renewal and mitigates oligarchical tendencies stemming from what has been termed a “fossilization” of parliament (see Shabad and Slomczynski Reference Shabad and Slomczynski2002). Policymaking outcomes are affected, as high turnover rates have been linked to lower legislative production (Rogers Reference Rogers2002) and increased spending on capital projects by legislators, whose fear of losing office aims to constrain future policy, but also undercuts long-term economic growth (Uppal and Glazer Reference Uppal and Glazer2015). In turn, high professionalization in US state legislatures has been linked to a lower likelihood of bills being vetoed by governors (Ricknell Reference Ricknell2023), a lower involvement of bureaucrats in the process of crafting bills (Kroeger Reference Kroeger2022), and a higher likelihood of legislators to run for and win a higher office (McCrain and O’Connell Reference McCrain and O’Connell2023).
Very low turnover rates, on the other hand, might also indicate another type of democratic deficiency. Insulating incumbents from electoral defeats comes at the cost of democratic accountability, as very low turnover rates generate oligarchical structures (Best et al. Reference Best, Hausmann and Schmitt2000, 185). In this respect, evidence suggests that legislative turnover disrupts lobby networks as it erodes the value of relationships with incumbents and thereby reduces multi-client lobbying (Strickland and Crosson Reference Strickland and Crosson2023). Furthermore, low turnover rates decrease the descriptive representation of women because incumbency consolidates the male advantage in elections (Schwindt-Bayer Reference Schwindt-Bayer2005).
Despite the above-mentioned important consequences, little is known about turnover patterns in Latin America in comparative terms. Many of the findings and theoretical models regarding legislative turnover and the wider debate on legislative careers and institutionalization center on the case of the United States, which in the design of its institutions greatly differs from other regions (Morgenstern Reference Morgenstern2004; Chasquetti Reference Chasquetti2015). Legislative turnover rates in Latin American legislatures, however, have been often overlooked not only in international research, but also in discussions of regional politics (Morgenstern Reference Morgenstern2004). Considering the US and Europe-centric literature, we aim to analyze how Latin American countries compare to each other and with other democracies in terms of legislative turnover. The article fills this research gap, being the first comparative treatment of the determinants of turnover in Latin America. This contrasts heavily with several comparative analyses of turnover in European countries (Matland and Studlar Reference Matland and Studlar2004; Kuklys Reference Kuklys2013; Gouglas et al. Reference Gouglas, Maddens and Brans2018; Muyters and Maddens Reference Muyters and Maddens2023). Latin American turnover has received substantial attention in case studies of some countries, notably Bolivia (Centellas Reference Centellas2013), Brazil (Samuels Reference Samuels2000; Castro and Nunes Reference Castro and Nunes2014), Chile (Siavelis Reference Siavelis2005; Bunker and Navia Reference Bunker and Navia2015; González-Bustamante and Cisternas Reference González-Bustamante and Cisternas2016), Colombia (Duque Daza Reference Duque Daza2011), Mexico (Valencia Escamilla Reference Valencia Escamilla2022), and Uruguay (Chasquetti Reference Chasquetti2000; Altman and Chasquetti Reference Altman and Chasquetti2005), but has not been approached systematically in others. The few existing comparative analyses do not include a quantitative assessment of the determinants of legislative turnover and focus only on select countries (Santos Reference Santos2006; Botero and Rennó Reference Botero and Rennó2007).
The structure of the article is the following. The first section introduces the original dataset of turnover in Latin America. The second section provides its descriptive overview by comparing turnover across upper and lower chambers as well as across countries, by interpreting notable temporal developments within countries. The third section hypothesizes the consequences of temporal institutional arrangements on turnover rate. The next section assesses these hypotheses empirically using a quantitative test. The article concludes by discussing theoretical and policy implications of the main findings.
Latin American Turnover Dataset
The Latin American turnover dataset is an original dataset containing available turnover data for 204 elections to lower and upper chambers of legislatures in 17 Latin American countries. The dataset spans from 1985 to 2023 and is made publicly available. The data was collected from publicly available primary electoral sources whenever possible, resorting to secondary sources only when these were not available. All sources for the turnover data are listed in the Online Appendix. The Online Appendix also lists the time coverage of available turnover data in our dataset for each country, as well as the data sources for all other variables included in the dataset.
The elections for which we were unable to collect legislative turnover data are listed in the Online Appendix. We include both legislative chambers in bicameral legislatures, as well as chambers in unicameral legislatures. Naturally, all Costa Rican elections are excluded because its legislators are banned from consecutive reelection. The same holds for Mexican deputies prior to the 2014 reform and for Ecuadorean legislators prior to the 1994 reform which reversed a constitutional ban on consecutive reelection. We also exclude elections for which data on turnover is not available from official or secondary sources. The final dataset includes all legislative periods in Latin American countries since 1985 (or the respective year for which legislative turnover data is available).
Legislative turnover is calculated for each chamber as the share of MPs elected to a legislature, who were elected in the preceding election to the same chamber. The resulting measure of turnover (in %) divides the number of legislators who were not consecutively reelected by the total number of elected seats in the chamber. Owing to this coding decision, we do not count legislators who switched chambers as incumbents. Similarly, only legislators whose legislative terms are about to run out in the given election are counted as incumbents in our dataset. Additionally, while we do acknowledge the importance of further differentiating between first-term MPs and returning MPs as outlined by François and Grossman (Reference François and Grossman2015, 459), the lack of such longitudinal data for earlier periods in most countries in the region makes it difficult to apply in the Latin American region. We therefore follow much of the literature on legislative turnover that does not distinguish between first-term MPs and returning ones.
Although there are also other measures related to legislative turnover, such as renovation rate (González-Bustamante and Cisternas Reference González-Bustamante and Cisternas2016) and chamber professionalization (Levita and Márquez Romo Reference Levita and Márquez Romo2023), legislative turnover is the most commonly used one (e.g., Samuels Reference Samuels2000; Matland and Studlar Reference Matland and Studlar2004; Gouglas et al. Reference Gouglas, Maddens and Brans2018). Besides legislative turnover, the dataset also includes information on bicameralism, term length, term limits, and early elections (see Table 1 for a full overview of variables included in the dataset and their descriptive statistics).
Descriptive Statistics of Variables Included in the Dataset

Source: Authors.
The data suggests that the average turnover rate in Latin America between 1985 and 2023 is extremely high: 69.8%. Listing the average turnover rate by country—including both chambers in bicameral legislatures—in Figure 1, Bolivia has the highest turnover of 84.9%, closely followed by other Andean countries, Venezuela, Ecuador and Peru. Together with Argentina, these five countries exhibit a turnover of over 80%. On the other side of the continuum, El Salvador and Chile have turnover rates around the 50% mark, but most countries fall in the middle. The turnover rates in Latin America are far higher relative to Europe where a comparison revealed an average of 41.3% turnover between 1990 and 2015 (Verzichelli Reference Verzichelli, Vogel, Gebauer and Salheiser2019). As turnover rates over 50% are considered “excessive” (Shin and Jackson Reference Shin and Jackson1979), existing literature points to the 20% to 40% interval as the optimal range suitable for “normal politics” (Best et al. Reference Best, Hausmann and Schmitt2000, 184–85; Crowther and Matonyte Reference Crowther and Matonyte2007, 291; Kuklys Reference Kuklys2013, 30). This rate represents “a middle way of elite adaptation, ensuring a constant but limited influx of fresh elite members and creating some flexibility with regard to adapting the whole polity to new needs and changing circumstances” (Best et al. Reference Best, Hausmann and Schmitt2000, 184). Our data suggests that Latin American turnover is staggeringly off these marks, which is true even when compared with democracies in Central and Eastern Europe (Kuklys Reference Kuklys2013; Verzichelli Reference Verzichelli, Vogel, Gebauer and Salheiser2019), Ghana (Agomor et al. Reference Agomor, Kofi Banini and Langnel2023), and South Korea (Kim and Park Reference Kim and Park2017), where legislative turnover rates are on average below 50%. The only countries for which we were able to identify turnover rates (based on published research) comparable to the Latin American ones are Indonesia (Buehler and Nataatmadja Reference Buehler and Nataatmadja2019) and Nigeria (Fashagba and Nwankwor Reference Fashagba and Nwankwor2020) with turnover rates of 66.7% and 72%, respectively.
Average Turnover Rates by Country, 1985–2023.
Source: Authors’ own calculations.

Turnover Dynamics in Latin American Countries
While part of the cross-national and temporal variation in turnover rates is likely to be explained by slow-moving institutional and structural determinants, examining the graphs in Figures 2 and 3 also reveals several noteworthy trends and abrupt inter-election changes. This section describes and interprets them, focusing on shifting electoral preferences, discrete political events, and democratic trajectories. Latin American turnover rates are not only extremely high on average, but they are also on the rise especially in countries where they were kept comparatively low until recently (see Figures 2 and 3). The lowest average values in the two countries with the lowest average turnover—Chile and El Salvador—are a product of very low turnover rates in earlier elections (from the 1990s to the 2010s) but the most recent trend has been a significant surge in both countries. The abandonment of the binominal electoral system in 2015 (Gamboa and Morales Reference Gamboa and Morales2016) and the accompanying collapse of the traditional party system in Chile, as well as the collapse of the two-party system and the rise of a political outsider, Nayib Bukele, in El Salvador, have produced steep increases in turnover. Turnover climbed from 35.8% in 2013 to 59.4% in 2017 in Chile and from 36.9% in 2018 to 75% in 2021 in Salvador.
Turnover in Upper and Lower Chambers in Bicameral Legislatures, 1985–2023.
Source: Authors’ own calculations.

Turnover in Unicameral Legislatures, 1985–2023.
Source: Authors’ own calculations.

Informal rules also help explain some of the notable patterns. The extreme turnover in Bolivia is puzzling at first. It gradually increased, from already high levels in the 1990s and reached 100% by 2019, the highest value in our dataset for all Latin American elections. The increase coincided with the electoral strengthening of the Movement Toward Socialism (MAS) which has dominated Bolivian politics since 2005. While the low rates of legislative reelection by the opposition are attributable to its fragmentation and low levels of organizational continuity, the MAS has instead maintained a strong organizational identity. However, as part of its internal mechanisms, a prevailing rule of non-reelection of its legislators is maintained within MAS, which prevents the consolidation of oligarchies within its parliamentary bloc (Anria Reference Anria2018, 141). Although eligible for a single consecutive reelection, MAS legislators rarely seek reelection and rely instead on the relationships with party leadership for their future careers in other functions. The decrease of legislative turnover in 2020 can be attributed to the Bolivian 2020 elections being a rerun of the 2019 elections, with many legislators elected in the 2019 elections running for office and being elected once again in 2020, thus decreasing turnover without technically infringing on internal mechanisms within MAS.
Another dominant leftist party, the Nicaraguan FSLN, has followed the opposite pattern, allowing and encouraging the reelection of its legislators. In stark contrast to MAS, FSLN has developed a top-down organizational structure. Unlike Evo Morales in MAS, FSLN’s leader Daniel Ortega (and his wife Rosario Murillo) managed to dominate the party in a process that brought FSLN under his total control after being reelected as president in 2006 (Martí i Puig Reference Martí i Puig2016). The loyalty of party legislators is rewarded by continuous renomination which in the context of Nicaragua’s authoritarian regime guarantees their reelection. As a result, legislative turnover has witnessed gradual and significant declines in almost all elections since 1990, reaching the second lowest figure (after Brazil) of all Latin American chambers in the latest elections. The downward trend in turnover results from and closely follows the ongoing process of the country’s autocratization which accelerated after Ortega’s violent suppression of opposition protests in 2018 (Buben and Kouba Reference Buben and Kouba2020). This is contrary to theoretical predictions that authoritarian elections stimulate parliamentary turnover because potential candidates often believe they have a realistic chance of winning elections in weak parliaments (Gandhi and Lust-Okar Reference Gandhi and Lust-Okar2009). However, the second Latin American case of autocratization in our dataset, Venezuela, is more consistent with this logic. As high legislative turnover strengthens authoritarian leaders’ hold on power (Gandhi and Lust-Okar Reference Gandhi and Lust-Okar2009, 410), Venezuela’s very high—and rising—turnover under both Chávez and Maduro is likely associated with this mechanism.
The trends in Latin American countries reveal several abrupt inter-election changes in turnover that are difficult to explain by systematic determinants with slow-moving effects on turnover rates or by changes in institutional configurations. Instead, circumstantial events may give rise to such developmental leaps. This concerns, for example, the steep increase in turnover rates in Panama between 2014 and 2019 from 50.7% to 80.3% when only 14 of the 51 legislators who ran for reelection were elected in 2019. A substantial part of this increase is attributable to a successful campaign against the reelection of legislators which originated in a social movement which mobilized against corruption scandals implicating various legislators (Uriegas Reference Uriegas2019). Spreading successfully on social networks and targeting dominantly younger voters the campaign’s slogan #NoALaReelección became the country’s most utilized hashtag with 215,500 tweets in the run up to the election between 2017 and 2019 (Brown and Acosta Reference Brown and Acosta2022).
The interaction between electoral rules and sudden political change is likely also responsible for some other notable patterns in turnover trends. The steepest between-election increase in turnover in our dataset was registered in the Senate of the Dominican Republic between 2016 from an all time low of 21.9% to 90.6% in 2020. Interestingly, this is the only Latin American chamber in our dataset that is elected exclusively with a plurality rule in uninominal districts. Plurality systems tend to preserve duopolistic competition of entrenched parties in Latin America, thereby reducing the access of potential challengers to elected positions (McClintock Reference McClintock2018). However, if the forceful advent of new oppositional parties and a shift in the electorate’s preferences do appear, this can lead to the absolute defeat of entrenched ruling parties under majoritarian systems. Ruling parties’ interests are better protected under proportional representation, which has historically been their strategic electoral choice across Latin America (Wills-Otero Reference Wills-Otero2009). The 2020 Dominican election was marked by such an electoral tsunami, with the victory of the Partido Revolucionario Moderno (PRM) breaking the earlier two-party system and electing its first president, Luis Abinader. While the party doubled its electoral performance in the lower chamber elected by proportional representation, surging from 42 deputies in 2016 to 90 in 2020 (out of 190), the accompanying increase in the plurality-elected Senate was even more impressive—from 2 to 18 senators (out of 32) (Solano de Martínez Reference Solano de Martínez2021). The disproportionality of the plurality rule kept the PRM underrepresented in 2016, but permitted its breakthrough in 2020, causing the electoral collapse of the traditional parties and the election of many newcomers to the Senate.
Legislators’ Time Horizons and Turnover
Despite featuring a very high turnover rate on average, some Latin American elections have seen moderate elite renewal. What explains this diversity across Latin American countries and time periods? Does the basic setup of Latin American legislative institutions account for the intra-regional variation? While a full examination of all possible causes of turnover suggested by existing literature is not possible within the limited scope of this research note, we focus on variables that are likely to directly shape the temporality of turnover. Theoretically, we understand turnover as an essentially temporal process because the time dimension is built into its conceptualization comparing whether any single legislator in election t held the same office also in election t-1. One of the defining features of democracy is that it is a government pro tempore; the time limit stemming from regular elections is one of the main arguments for democracy (Linz Reference Linz1998). Democracies employ a variety of institutional mechanisms that set the time horizons for its politicians. This variation is in turn likely to shape personnel stability and turnover because different rules shorten or prolong the time horizons of politicians, voters, and political parties. We focus on three such temporal rules: the possibility of reelection, the length of legislative terms, and the staggered nature of legislative elections. In all three cases, Latin America provides sufficient variation in the institutional setup.
First, Latin American countries are almost unique among democracies in imposing term limits on national-level legislators. Seven of the 18 countries maintain, or used to maintain, some type of term limits. As of 2024, legislators are not allowed to be reelected consecutively in Costa Rica, and this ban was applied in Mexico until 2014 and Ecuador until 1994. Chile, Bolivia, Peru, and Venezuela adopted less restrictive term limits that allow only a single or double consecutive reelection. Naturally, the dataset excludes cases in which a ban on consecutive reelection of legislators was in place (because, by definition, these feature a 100% turnover rate). This excluded all Costa Rican elections, Mexican elections held until the 2014 term limit reform, and Ecuadorean elections until 1994. But the less restrictive term limits, which allow for one or more consecutive reelections of an incumbent, are retained in the dataset and are expected to exercise principally a “mechanical” effect on turnover by restricting access to reelection to some but not all legislators. For example, the Chilean 2020 adoption of term limits applied already for the 2021 election implying that 33 deputies, after having served two or more consecutive terms, could not stand for reelection. But strategic considerations are also likely to affect the decision to run in an election because the possibility of retaining office in the future is affected, thereby shortening the legislators’ time horizons (see Moncrief et al. Reference Moncrief, Niemi and Powell2004). To measure term limits, we created a dummy variable LegislativeTermLimits indicating whether bans on non-consecutive reelection were in place (1), or whether legislators faced no restrictions on reelection (0).
Second, longer term lengths have been consistently linked to higher turnover rates by existing research (Matland and Studlar Reference Matland and Studlar2004; Manow Reference Manow2007). They are expected to drive turnover for “mechanical” reasons, as additional time makes it more likely for legislators to drop out for varying reasons, such as exposure to political scandals or natural causes (Heinsohn Reference Heinsohn2014). However, incentives stemming from institutional pressures are also likely to contribute to a higher turnover (Gouglas et al. Reference Gouglas, Maddens and Brans2018). With less frequent elections, legislators find it more difficult to balance the parliamentary tasks with extra-parliamentary ones, making them more likely to exit voluntarily (Heinsohn Reference Heinsohn2014), often resigning prematurely due to other career opportunities (Gouglas et al. Reference Gouglas, Maddens and Brans2018). Term length is measured as days since the last election.
Third, staggered renewal of legislative bodies, characteristic of—but not limited to—upper chambers, is often considered conducive to greater personnel stability (Llanos and Nolte Reference Llanos and Nolte2003, 61). Additionally, it is seen as a means to improve policy outcomes while diminishing the chance for an overturn in the near future (Willumsen and Goetz Reference Willumsen and Goetz2015, 1042). The historical evidence from the United States, however, suggests that staggered terms were adopted to promote turnover and foster the rotation of legislators (Wirls Reference Wirls2015). They were viewed as a necessary compromise to offset the high stability of long individual tenures in long-duration legislatures. Despite very little work on the topic in Latin America, the Argentine experience (where both chambers have staggered terms) suggests that staggering elections strongly influences legislators’ behavior and their calculations regarding renomination and reelection (Lucardi and Micozzi Reference Lucardi and Pablo Micozzi2021). In particular, when combined with variation in concurrency with presidential elections, staggering produces different types of legislators. While more politicians with previous executive experience tend to compete in the concurrent elections, lesser-known and inexperienced politicians are overrepresented in staggered non-concurrent elections (Lucardi and Micozzi Reference Lucardi and Pablo Micozzi2021). While some views ascribe personnel and policy stability to bodies elected in a staggered fashion, this received wisdom has been questioned, suggesting instead that staggered terms lead to multiplication of cycles (Willumsen and Goetz Reference Willumsen and Goetz2015). Largely because of putting legislators to an almost permanent election mode, staggered terms increase the number of disruptions associated with legislative cycles (Willumsen and Goetz Reference Willumsen and Goetz2015, 1044). We hypothesize that this short-termism also impacts the renomination and reelection strategies of voters, legislators, and their parties in ways that foster legislative turnover.
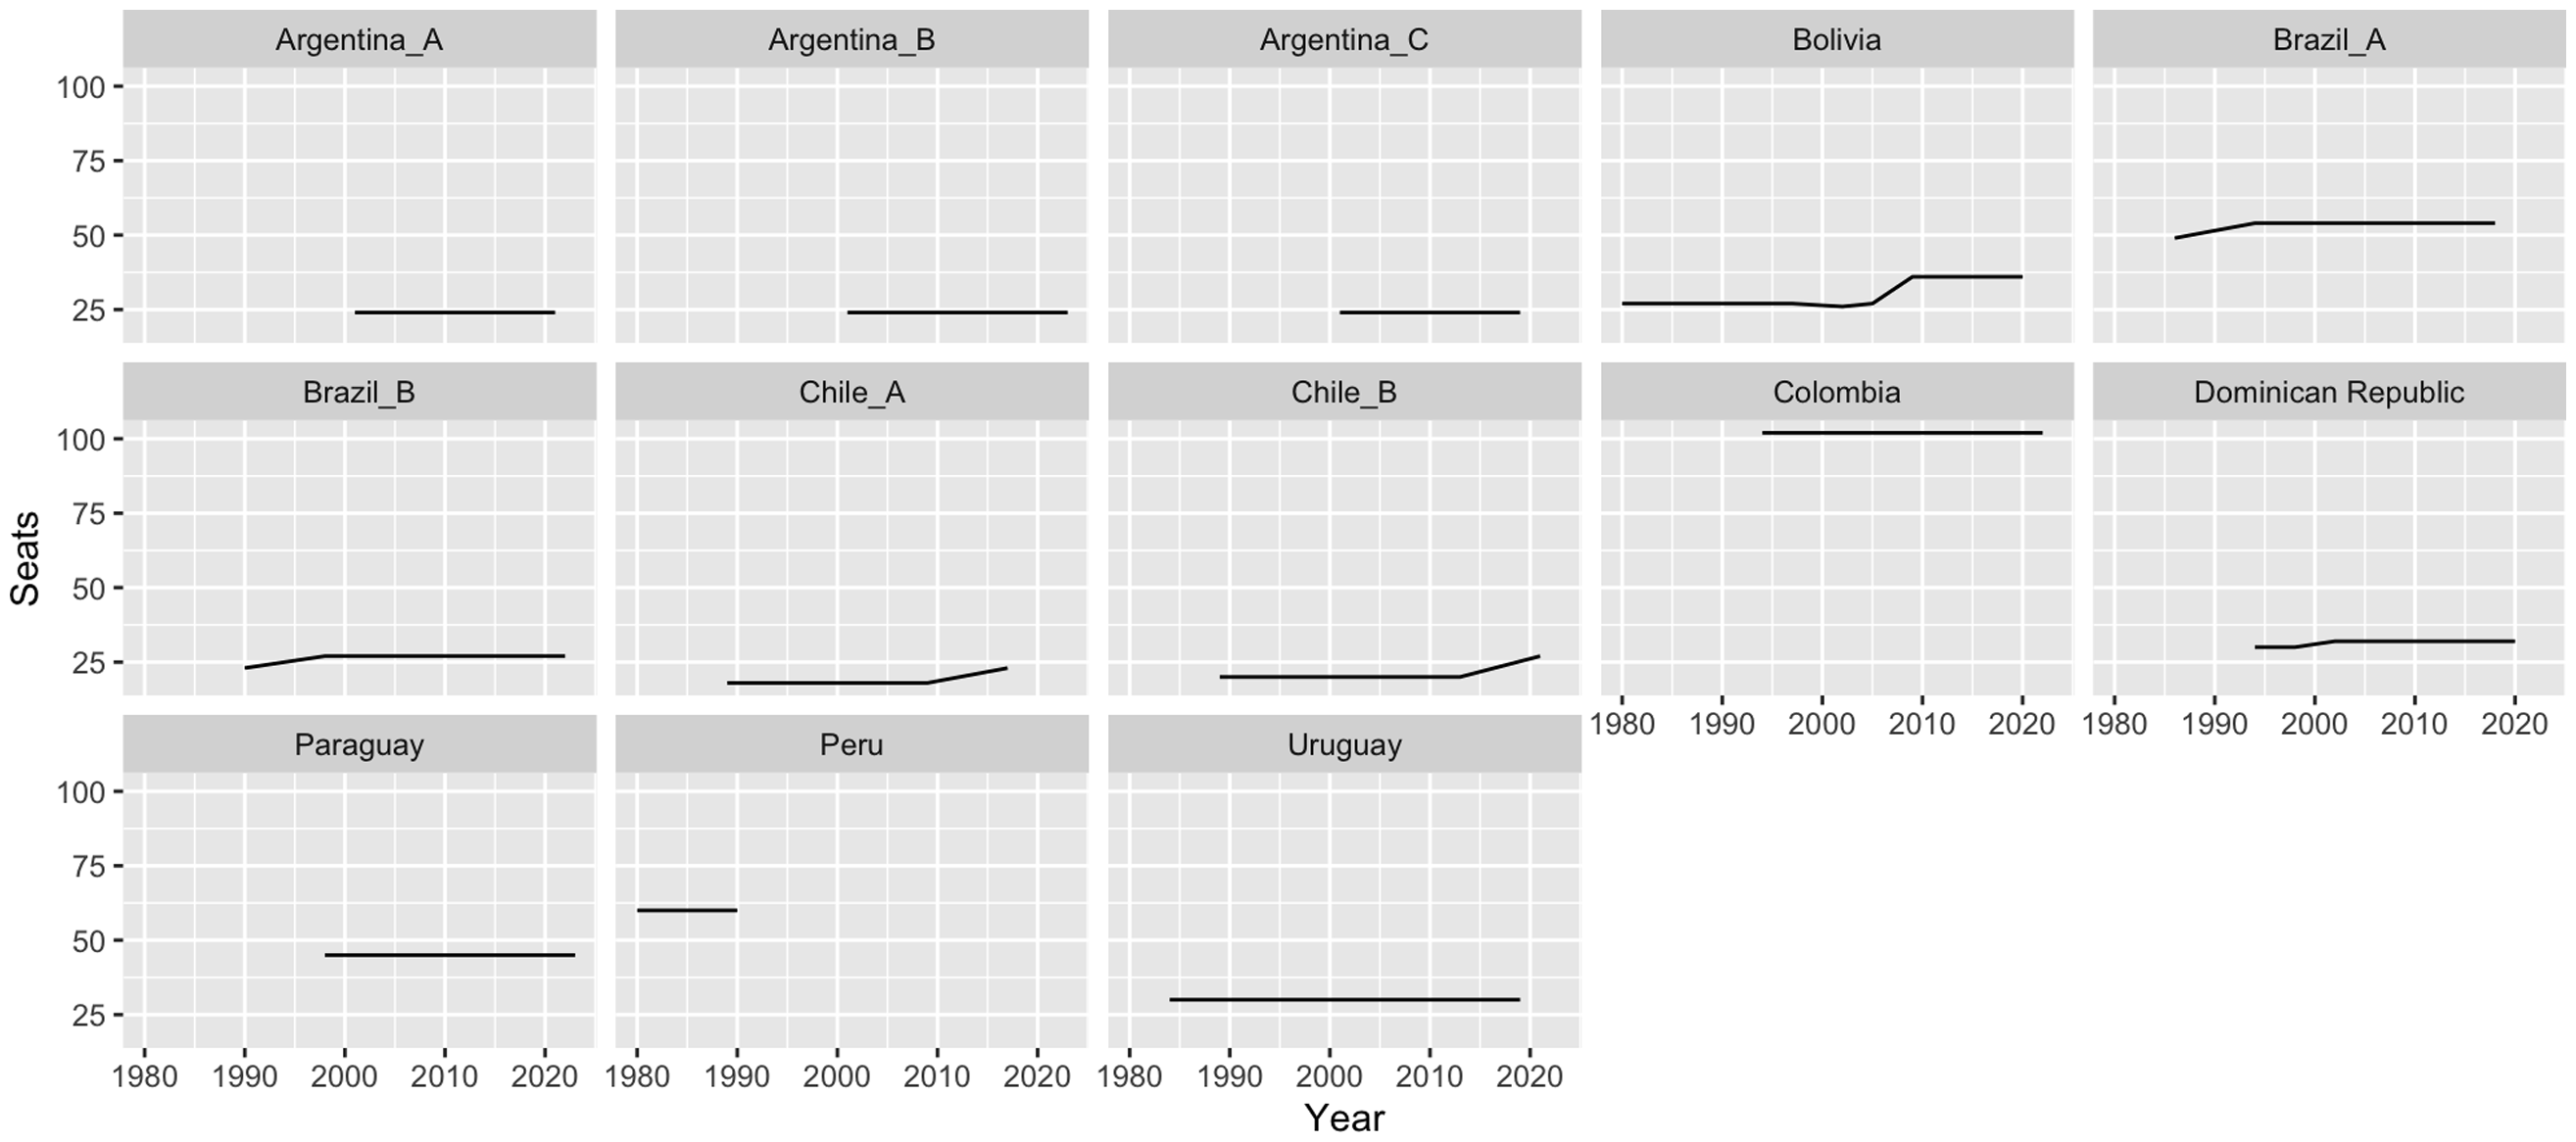
The models control for three sources of contextual differences that are likely to shape turnover: the size of each chamber, the change in its size, and whether the legislative body is part of a bicameral structure. Chamber size is a key variable when it comes to political representativeness. Latin American legislative chambers vary greatly in size, as shown in Figures 4 and 5 (due to some of the legislative chambers being staggered, we count the chamber size and its size changes separately for individual parts of staggered legislatures). In the debate on representativeness, there is no clear consensus on ideal chamber size, having to balance representation and legislative functionality (Frederick Reference Frederick2010, 6). Similar to mechanisms that find that chamber size increases proportionality and helps secure the representation of smaller parties, women and other underrepresented groups (Kjaer and Elklit Reference Kjaer and Elklit2014; Allen and Stoll Reference Allen and Stoll2023), larger chamber size is also expected to increase legislative turnover, as all political parties will be able to nominate more candidates who compete for office.
Chamber Size in Lower Chambers of Latin American Countries.
Source: Authors’ own calculations.

Chamber Size in Upper Chambers of Latin American Countries.
Source: Authors’ own calculations.

Latin American countries have frequently changed the size of their legislatures in the observed period, but this is not an uncommon feature in legislative chambers. Similar changes have been linked to turnover rates in a comparison of German state parliaments (Heinsohn Reference Heinsohn2014) and Swiss cantonal legislatures (Heinsohn and Freitag Reference Heinsohn and Freitag2012). Because the addition of new seats guarantees the entry of new members who are not merely replacements for the incumbents (Matthews Reference Matthews1984) and because the reduction of seats means that “easy seats” for aspiring candidates become rarer which benefits the incumbents (Heinsohn and Freitag Reference Heinsohn and Freitag2012), we expect that the increase in chamber size leads to higher turnover rates whereas its reduction lowers turnover. We operationalize this variable as the change in chamber size (number of legislators) from one term to another in percentage points.
Finally, legislators’ willingness to pursue long-term legislative careers is influenced both by their political ambition and the supply of other available offices. Where legislators exhibit “extra-legislative” ambition, as in Brazil, the political heavyweights leave the lower chamber for offices with greater political payoff, leaving only the weaker incumbents to compete there (Samuels Reference Samuels2000). These voluntary exits fuel turnover. In Latin America, the obvious search for alternative offices focuses on the second chambers in bicameral systems. Contrarily, unicameral legislatures provide fewer access points to alternative political positions, so pursuing a legislative career there is more attractive on average. A cross-national comparison in Europe has provided support for this relationship, as bicameralism expands the opportunities for political career advancement (Gouglas et al. Reference Gouglas, Maddens and Brans2018). The distinction between unicameral and bicameral legislatures is captured by a dummy variable.
Analysis
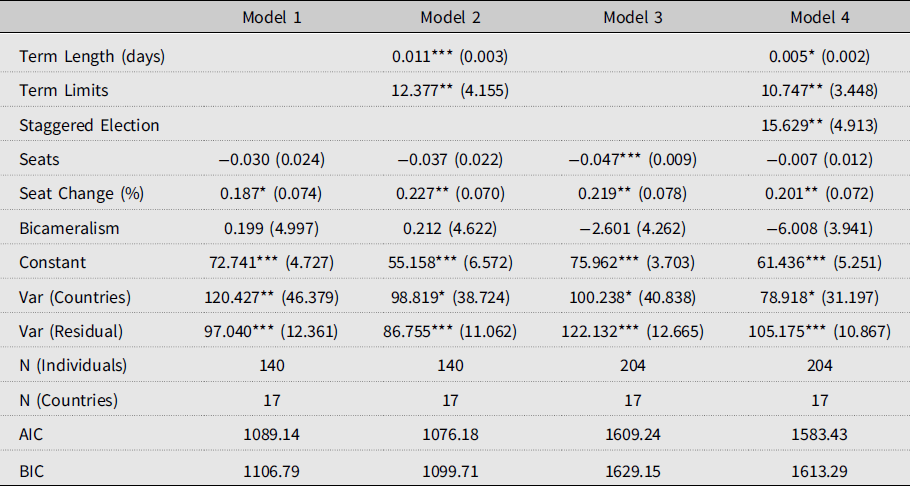
Leveraging the Latin American turnover dataset, we use hierarchical linear regression models to test the main hypotheses, given that the observed elections are nested within countries. Because existing research on legislative turnover has so far focused only on lower chambers, we separately present both models using data only for lower chambers as well as models combining lower and upper chamber data. Table 2 presents two pairs of regression models, with the first of each pair including only control variables, and the second pair including all studied variables. The models for lower parliamentary chambers exclude the variable for staggered elections, as staggered lower chamber elections exist only in Argentina. Its inclusion would lead to possible multicollinearity issues with the grouping variable, which accounts for the variation between countries. The explanatory power of the models is much worse when including upper chambers, suggesting the need to consider the specificities of both chambers. The Akaike information criterion and the Bayesian information criterion values are much higher in the models for both chambers, suggesting that the Models 1 and 2 provide a better fit for the data than Models 3 and 4.
Results of Multilevel Regression Analysis

Note: *p < 0.05; **p < 0.01; ***p < 0.001.
The results reveal several important findings. First, the strong and positive relationship between term length and turnover in the models provides evidence in favor of the hypothesis that longer legislative terms foster turnover. Every year of term length increases turnover by about 4 percentage points in the lower chamber model and 1.8 points in the general model. This finding is mostly in line with previous research on lower chambers in Western Europe (Matland and Studlar Reference Matland and Studlar2004; Heinsohn Reference Heinsohn2014; Gouglas et al. Reference Gouglas, Maddens and Brans2018). Second, the presence of “soft” term limits that permit a certain number of consecutive reelections increases legislative turnover substantially, by about 11 percentage points in the main model. Bolivia and Ecuador are among the countries with the highest turnover rates in the region, and are also the only two countries with some long-term experience with soft term limits for legislative reelection. Chile, on the other hand, experienced soft term limits only for the 2021 elections, which were the elections with the highest and second-highest turnover rates to the Senate and Chamber of Deputies during all of the post-Pinochet era, respectively. Third, staggered elections are associated with elevated turnover by about 16 percentage points when controlling for all other institutional variables.
As for the control variables, we do not find support for the contentions that bicameralism and the size of legislatures matter for turnover. On the other hand, the results suggest that changes in the size are important. An increase in chamber size by 1 percentage point is associated with higher turnover rates by about .2 points, thus solidifying conclusions from previous research (Heinsohn and Freitag Reference Heinsohn and Freitag2012). Furthermore, we conclude that other institutional variables like chamber size and bicameralism are not significantly associated with turnover.
Discussion and Conclusion
Legislative turnover as a measure of elite circulation is an important indicator of the quality of democracy (Gouglas and Maddens Reference Gouglas, Maddens and Brans2018, 638–39), with some authors even calling it a “democratic thermometer” (Crowther and Matonyte Reference Crowther and Matonyte2007). As such, it is an important factor that has not been well studied in Latin America, especially at an aggregate level. The newly available comparative dataset reveals that turnover rates in Latin America are extremely high compared to democracies in other regions. On average, every legislature has included only about 30% of reelected members from the previous legislature after each election since 1985. The figure reaches a full turnover in some countries. While similar extreme turnover rates pose a challenge to the stability of any democracy, they might be especially nefarious in the unstable and weak party systems that have come to characterize many Latin American countries. This instability and lack of party institutionalization has in turn been linked to worsened democratic outcomes, including but not limited to party system collapse, the removal of a sitting president from office and the rise of inexperienced politicians not well-versed in the workings of democratic institutions (Dietz and Myers Reference Dietz and Myers2007; Jones Reference Jones2011; Levitsky Reference Levitsky and Mainwaring2018; Martínez Reference Martínez2021). The relationship of turnover to party system institutionalization requires further research. While legislative turnover is not commonly seen as an indicator of party system institutionalization (Mainwaring Scully Reference Mainwaring and Scully1995; Mainwaring Reference Mainwaring2018), turnover could be conceived of as a proxy measure for party system institutionalization. When voters vote political newcomers into office, rather than established career politicians, political parties are discouraged from party-building behavior, possibly leading to unpredictable behavior by parties and their legislators.
From a policy perspective, the findings highlight a paradox with respect to an overall Latin American trend to adopt legislative term limits. Compared to other democracies which feature a much lower turnover, a large part of Latin American exceptionalism is attributable to deliberate policies to artificially increase turnover. Despite featuring an extremely high rate of turnover, Latin America is globally also the (almost) exclusive home of legislative term limits whose functioning naturally further promotes turnover. While no European democracy restricts the reelection of its legislators, six Latin American ones currently do (Costa Rica, Mexico, Ecuador, Bolivia, Peru, and Chile). Only Costa Rica bans any consecutive reelection, though, featuring the strictest term limit rule. Legislative term limits have become a hotly debated topic in several countries, most recently in Peru during the 2023 and 2024 debate on constitutional reforms. However, nowhere is this paradox more evident than in Chile where legislative turnover rates have become a central argument in recent debates regarding the adoption of term limits. In 2019 and 2020, its legislators debated and subsequently approved term limits. In the senatorial debate preceding the approval of term limit reform, “renovación” of the political elites was mentioned 46 times by senators (Senado 2020). Paradoxically, Chilean legislative turnover increased markedly following the change from the binominal system in 2015 (Gamboa and Morales Reference Gamboa and Morales2016), a fact that was acknowledged by many Chilean senators during the debate on term limits (Senado 2020). Term limits were subsequently approved despite the apparent significant rise in turnover under the new electoral system (from around 40% up until 2013 to almost 60% right after the reform). Turnover rates therefore provide an important guide to the decision to institute legislative term limits. While many other criteria need to be considered in such a debate, the Latin American experience suggests some adversarial effects of this policy. In the case of Ecuador, for example, the adoption of term limits (between 1978 and 1994) negatively affected its party system because the necessity to constantly search for new candidates in frequent elections pressed parties to search for suitable candidates outside of their formal structures, many of whom were local caudillos with little party loyalty and discipline (Pachano Reference Pachano2008, 187). The absolute turnover contributed to party decay, party system instability, and political improvisation.
The article also finds important variation in Latin America with some elections featuring moderate turnover levels. Institutional forces explain a large part of this variation, with term limits, term length, the presence of staggered elections and changes in legislature size being positively associated with elevated turnover rates. Other institutional sources of turnover that have been theorized and found to operate in European comparisons provide less explanatory leverage in Latin America. This is the case of chamber size and bicameralism, which highlights the region’s particularities. This Latin American experience therefore adds substantially to theories of turnover.
Future research should explore additional determinants of Latin American legislative turnover that could not have been examined within the limited scope of this research note. Not only institutional determinants (such as the features of electoral systems) but also determinants stemming from the political process (especially the influence of political party variables) might provide leverage in understanding the sources of Latin America’s extremely high turnover. While engaging in dialog with literature that has theorized turnover in European countries is one way of developing this research agenda further, causes specific to the Latin American context are likely to play a role as well given the region’s comparatively high overall turnover. Theorizing and testing further conditions is an important challenge for comparative research. Additionally, the dataset of Latin American turnover could use turnover as an independent variable, potentially explaining outcomes of the political process. This is another fruitful avenue for future research.
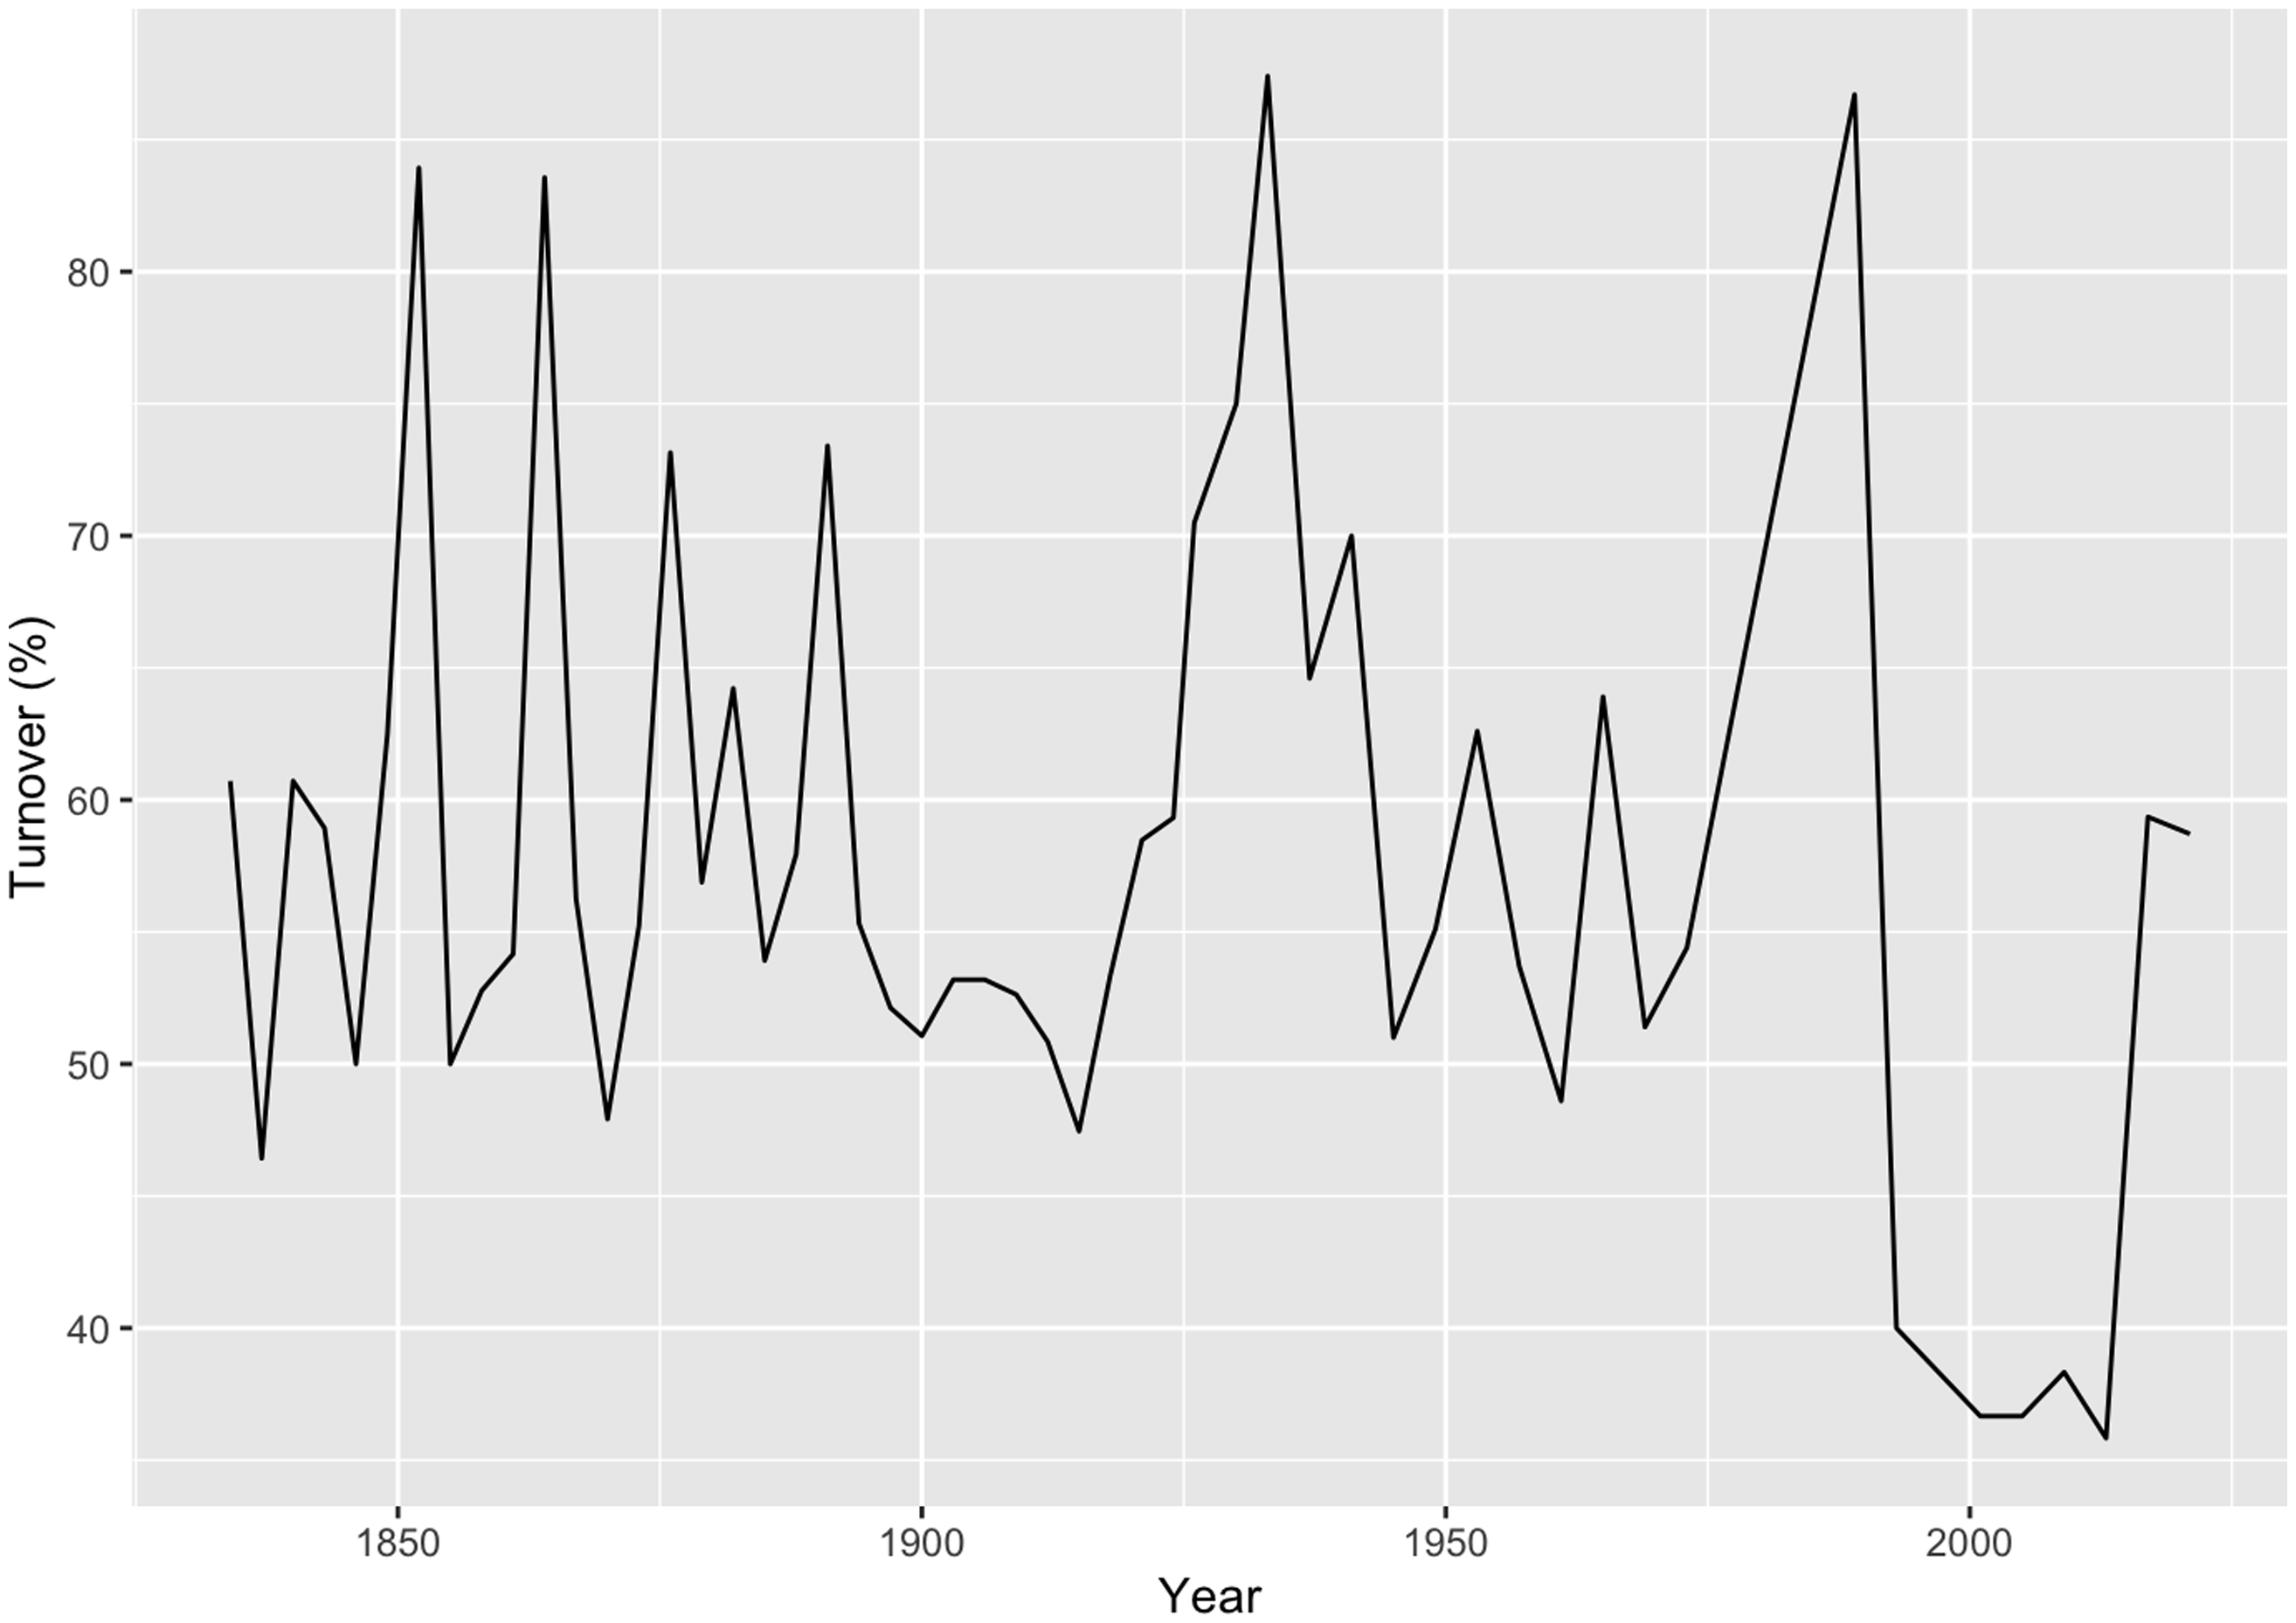
While institutional causes identified in this analysis go far in explaining differences within and between Latin American countries, they do not fully account for the reasons why Latin American turnover is so extreme compared to other emerging democracies, not to mention the established ones. If Latin American turnover is set apart due to the region’s specific political setup, high turnover rates should also be manifested in earlier periods. Unfortunately, historical data on Latin American turnover is scarce to corroborate this suggestion (suggesting another fruitful research avenue). Thanks to earlier data collection efforts, we were able to identify only a single country, Chile, with turnover calculated for all of its legislative elections. Reconstructing the historical evolution of turnover between 1834 and 1924 (Obando Camino and Mauricio Reference Camino and Mauricio2017) and between 1924 and 1973 (Navia Reference Navia2000) and tracing turnover from the longue durée perspective (see Figure 6), the average turnover rate between 1834 and the last democratic election in 1973 was 59.1%. The six elections held under the binominal system between 1989 and 2013 had a rate of merely 37.5%, making Chile (together with El Salvador) a country with the lowest turnover in Latin America among the third wave democracies. The functioning of the post-Pinochet binominal electoral system, in particular, was responsible for cementing the position of incumbents who could maintain their seats even in the face of substantial declines of electoral support (Siavelis Reference Siavelis2005). After abandoning the binominal elections, turnover rates shot up to 59.4% in 2017 and 58.7% in 2021. Viewed from this perspective, the 1989 to 2013 period is best viewed as an abnormal deviation from historical trends and regional patterns, and the post-binominal dramatic increase in turnover rates in Chile seems more like a return to an old normal.
Turnover in the Chilean Congress, 1834–2021.
Source: Turnover rates 1834–1924 (Obando Camino 2017), 1924–73 (Navia Reference Navia2000), post-1989 (authors).

Fully unpacking Latin America’s specificity in legislative elite renewal is a task we leave for future research, but a case can be made that the region’s extreme turnover is part of a strong anti-incumbent sentiment felt across the continent—that is perhaps more intensive than in other regions. Expressions of the anti-incumbent whirlwind include social mobilizations of the ¡Que se vayan todos! variety (Dinerstein Reference Dinerstein2003), campaigns such as #NoALaReelección to cast a vote for non-incumbents (Brown and Acosta Reference Brown and Acosta2022), internal party rules to limit legislative reelection (Anria Reference Anria2018), the unusual popularity of term limits and their establishing at all levels of government—from mayors (Kouba and Došek Reference Kouba and Došek2023), to governors (Lucardi and Almaraz Reference Lucardi and Gabriela Almaraz2017) and presidents (Corrales Reference Corrales2016)—frequent election of political outsiders (Carreras Reference Carreras2012), as well as the rise of extra-system volatility driven by the continuous emergence of new parties and the breakdown of established ones (Lupu Reference Lupu2014). While the anti-incumbent sentiment is also a part and parcel of “populist” movements across Europe, radiating from their anti-establishment ideational core and the discursive critique of corrupt elites (Mudde Reference Mudde2019, 32; Taggart Reference Taggart2019, 254–55), its Latin American variant is even more deeply ingrained in the region’s societies and cultural imaginaries, and has a longer history. After all, Madero’s call to end presidential reelection, sparking the Mexican revolution, came long before most Europeans were even allowed to elect their own heads of state. The institutional and political expressions of anti-incumbency attitudes, including extreme legislative turnover, result from a longer accumulated experience with the republican form of government, and its dialectical relationship between the real and perceived ills of a long permanence in power—expressed in Latin American continuismo and caudillismo—and the democratic responses to it. They might foreshadow developments elsewhere.
Data availability statement
Kouba, Karel; Weiss, Michael, 2025, “Replication Data for: Legislative turnover in Latin America: introducing a new dataset and analyzing its temporal dynamics”, https://doi.org/10.7910/DVN/N2GX9W, Harvard Dataverse, V1.
Funding statement
This work was supported by the European Regional Development Fund project “Beyond Security: Role of Conflict in Resilience-Building” (reg. no.: CZ.02.01.01/00/22_008/0004595), and by the Grant Agency of the Charles University (GA UK) within the project Legislative turnover in Latin America: analysis of causes and implications for political stability (No. 32924).
Competing interests
Karel Kouba and Michael Weiss declare none.


 Open access