





Introduction
Spruce budworm, Choristoneura fumiferana Clemens (Lepidoptera: Tortricidae), outbreaks have played a major role in shaping the spruce–fir forests of Maine, United States of America, with the 1970s event causing widespread defoliation, growth reduction, and substantial timber losses across the state (Irland et al. Reference Irland, Dimond, Stone, Falk and Baum1988). Although outbreaks in eastern North America have often been described as a recurring oscillation (Royama Reference Royama1984), population dynamics at the southern edge of the range remain poorly documented. Tree-ring reconstructions of historical outbreaks suggest that the average return interval in Maine is 67 years (Fraver et al. Reference Fraver, White and Seymour2007), which is significantly less frequent than the 35-year interval reported for Quebec, Canada (Jardon et al. Reference Jardon, Morin and Dutilleul2003), the neighbouring province to the north. Maine maintains the longest operational light-trap monitoring programme for spruce budworm in North America, providing a rare opportunity to directly examine population behaviour in a region where outbreaks have historically been irregular and spatially variable.
Here, we use these long-term monitoring data to describe the temporal structure of spruce budworm activity during the last outbreak and to provide an empirical foundation for assessing future outbreak risk in this part of the budworm’s range. We focused on whether fluctuations in moth numbers were more consistent with the near-periodic behaviour outlined by Royama (Reference Royama1984) or with the eruptive dynamics described by Solow et al. (Reference Solow, Cook and Smith2003). Cooke and Régnière (Reference Cooke and Régnière2025) found that similar population data from New Brunswick, Quebec, and Ontario, Canada, were more eruptive than periodic, and we therefore expected a comparable pattern in Maine.
Methods
Light traps were operated across the state of Maine from 1961 to 2024 and were maintained by a network of partners organised by the Maine Forest Service (Augusta, Maine). At each location, a single Rothamsted trap (Williams Reference Williams1948) elevated on a 1-m (3-foot) PVC platform was fitted with an incandescent lightbulb and placed as far as feasibly possible from other structures and light sources. Traps were operated from dusk to dawn, with specimens collected nightly. Trap operation began around 1 July at sites in the northern part of the state, and traps at more southerly latitudes began operating around 15 June. The staggered start reflected regional differences in climate and moth flight phenology. In earlier years, all traps were typically deployed around 1 July. Trapping generally ceased statewide at the end of July. Trap locations varied somewhat between years depending on cooperator availability, and geographic coordinates were available for an increasing proportion of traps from 1968 onwards (Fig. 1). Spatial summaries were therefore restricted to traps with latitude–longitude data, whereas temporal analyses used the full time series.
Spruce budworm moth light trap locations across Maine, United States of America, from 1968 to 2024.
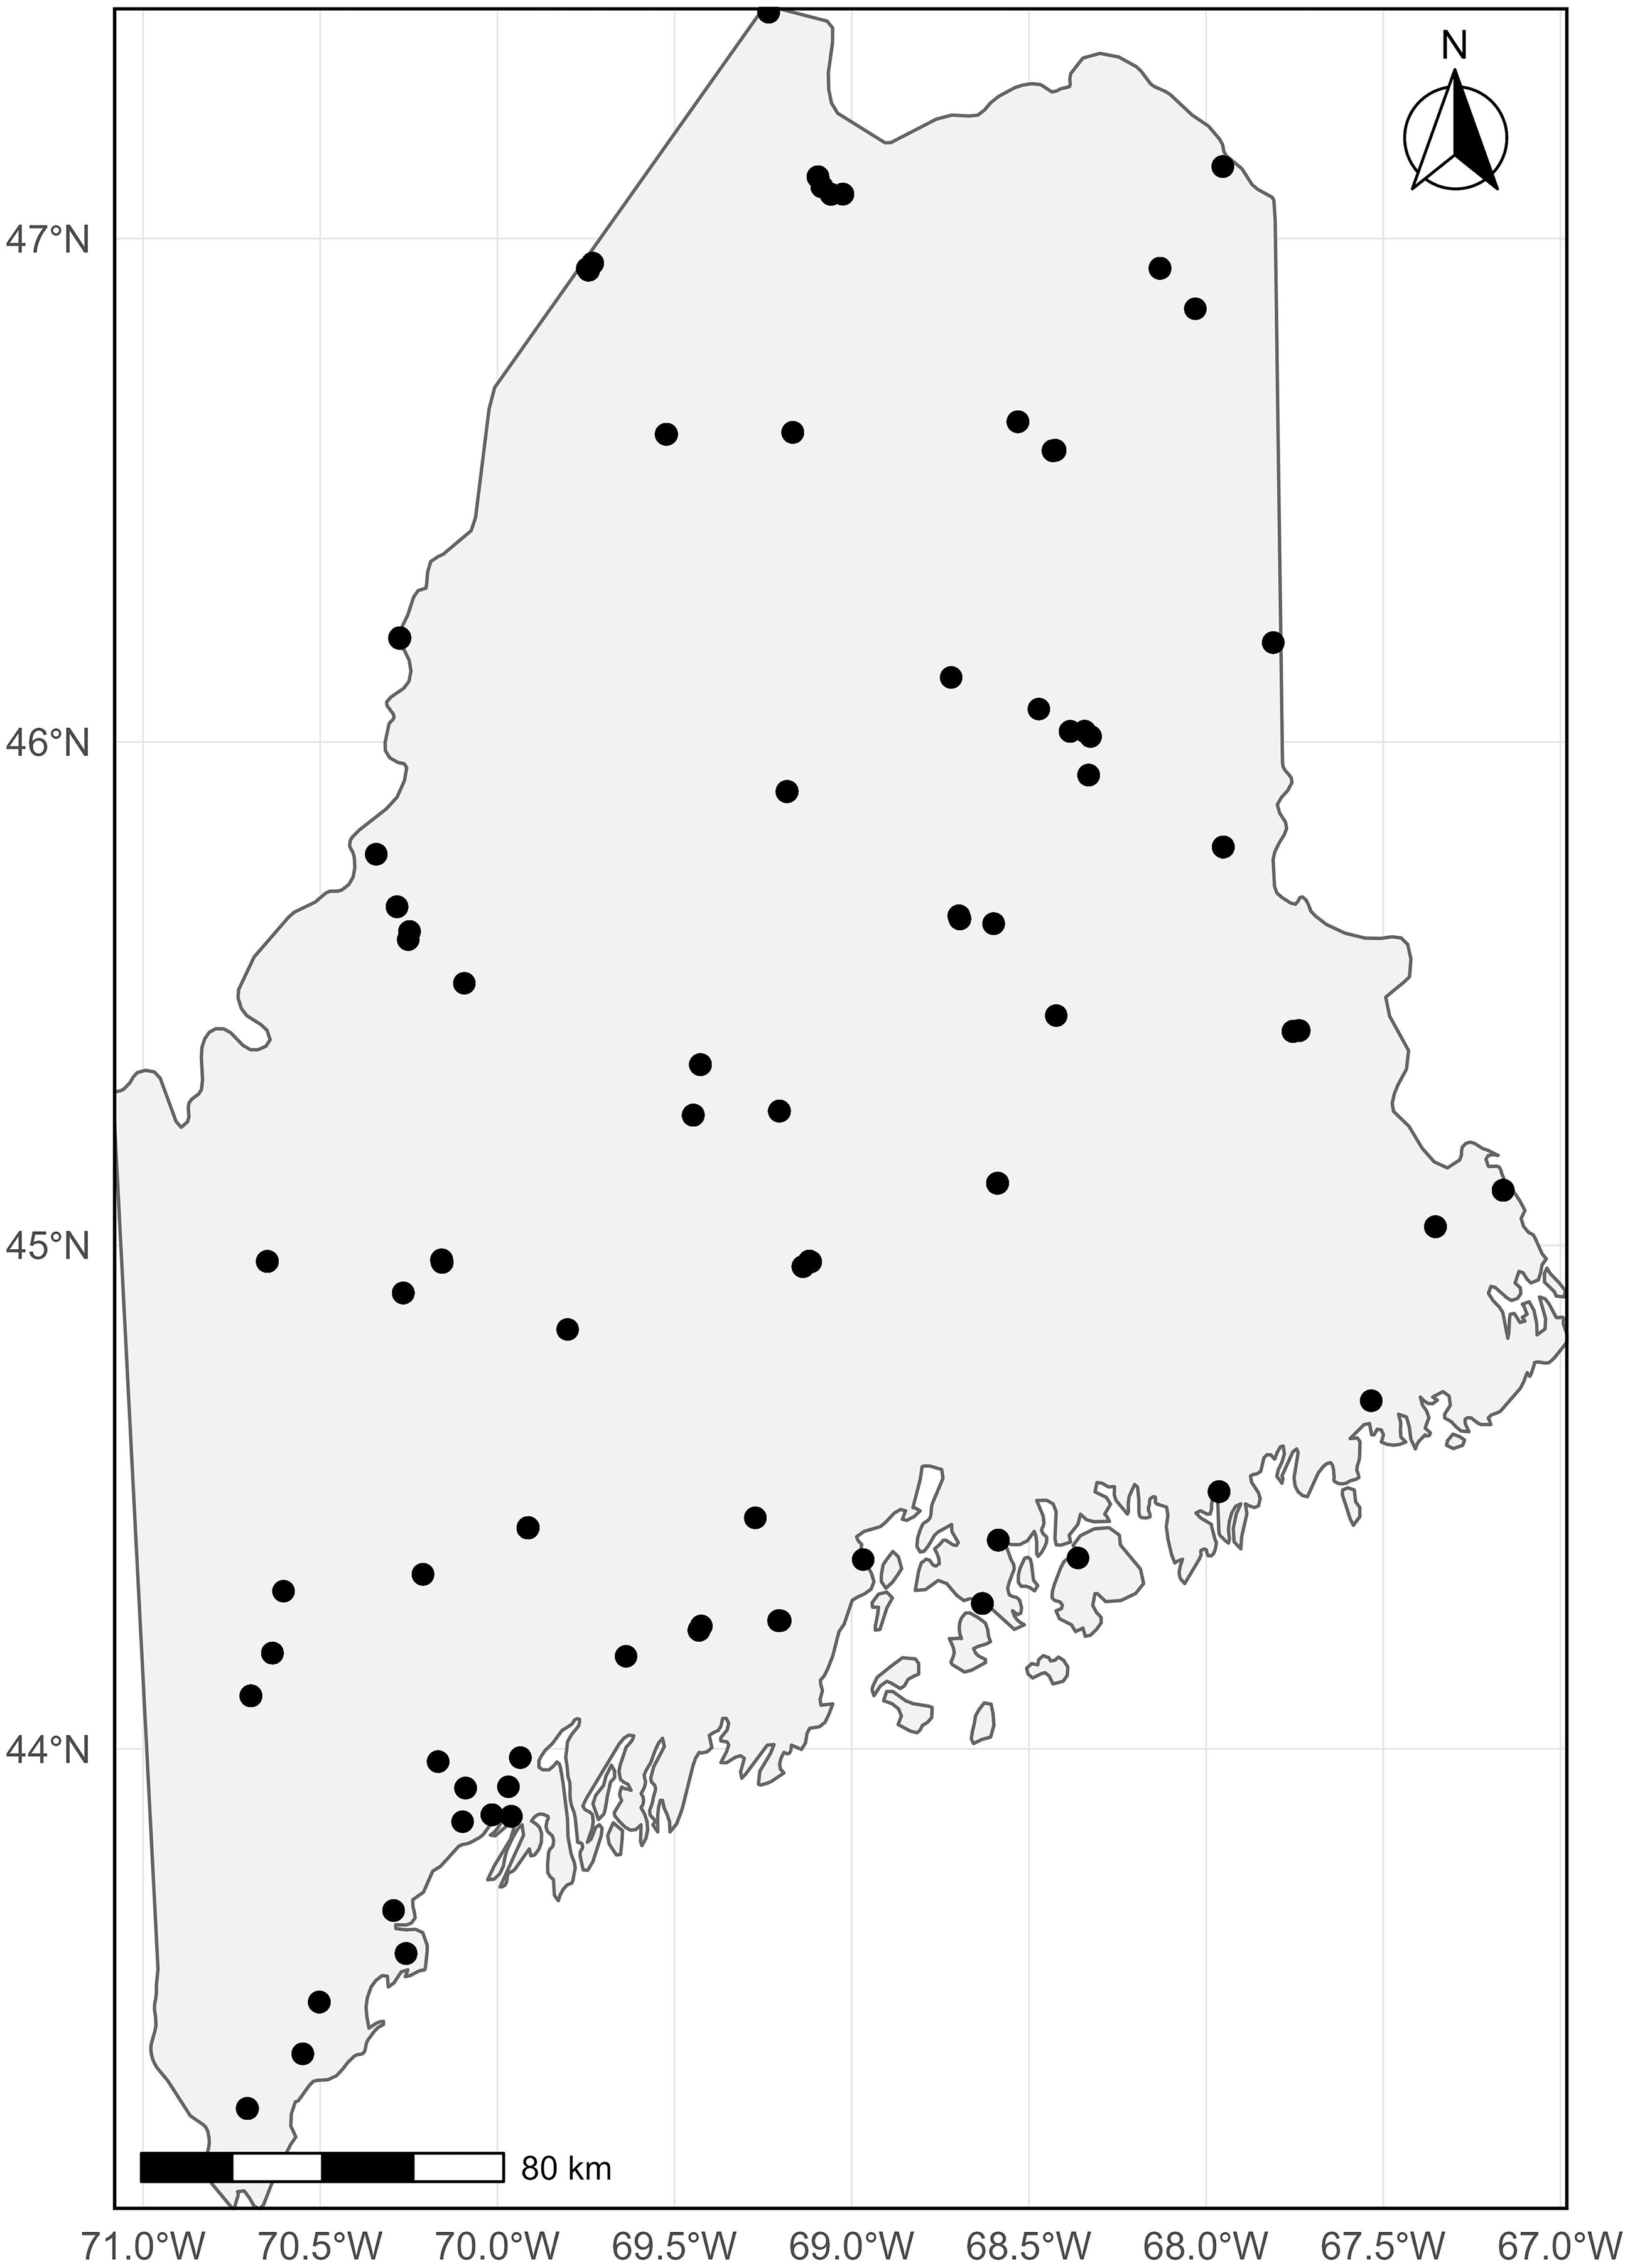
Figure 1. Long description
The map displays the geographic distribution of spruce budworm moth light trap locations across the state of Maine, United States of America, from 1968 to 2024. The map includes numerous black dots representing the specific locations of these light traps. The geographic area covered by the map spans from approximately 44 degrees North to 47 degrees North latitude and from 67 degrees West to 71 degrees West longitude. The map also includes a scale bar indicating a distance of 80 kilometres and a compass rose pointing north.
Collected spruce budworm moths were identified and counted by staff of the Maine Forest Service Insect and Disease Laboratory (Augusta, Maine). Although personnel rotated over the course of the project, all staff had experience in entomological identification, and certain members had formal training in microlepidoptera taxonomy. Reference specimens from the Maine Department of Agriculture, Conservation, and Forestry insect collection (Augusta, Maine) were used to ensure consistency in identification. Male and female moths were not separated; both sexes are reflected in the specimen counts.
Moth counts per trap are denoted N8, reflecting the adult (eighth) life stage of spruce budworm. Counts were aggregated across all traps to produce a single statewide time series. Interannual differences in N8, denoted R8, were analysed following the approach of Cooke and Régnière (Reference Cooke and Régnière2025) to assess whether fluctuations were more consistent with a near-linear periodic oscillation or a nonlinear eruptive pattern. Cubic smoothing splines were fit to plots of R8 over time to evaluate periodic structure and to plots of R8 versus N8 to assess evidence for multiple-equilibrium dynamics. The cubic smoothing splines were accomplished using the ss() function in the npreg package (Helwig Reference Helwig2024), with the ‘degrees of freedom’ parameter set to 6. All calculations were performed with R, version 4.5.1 (R Core Team 2025).
Results and discussion
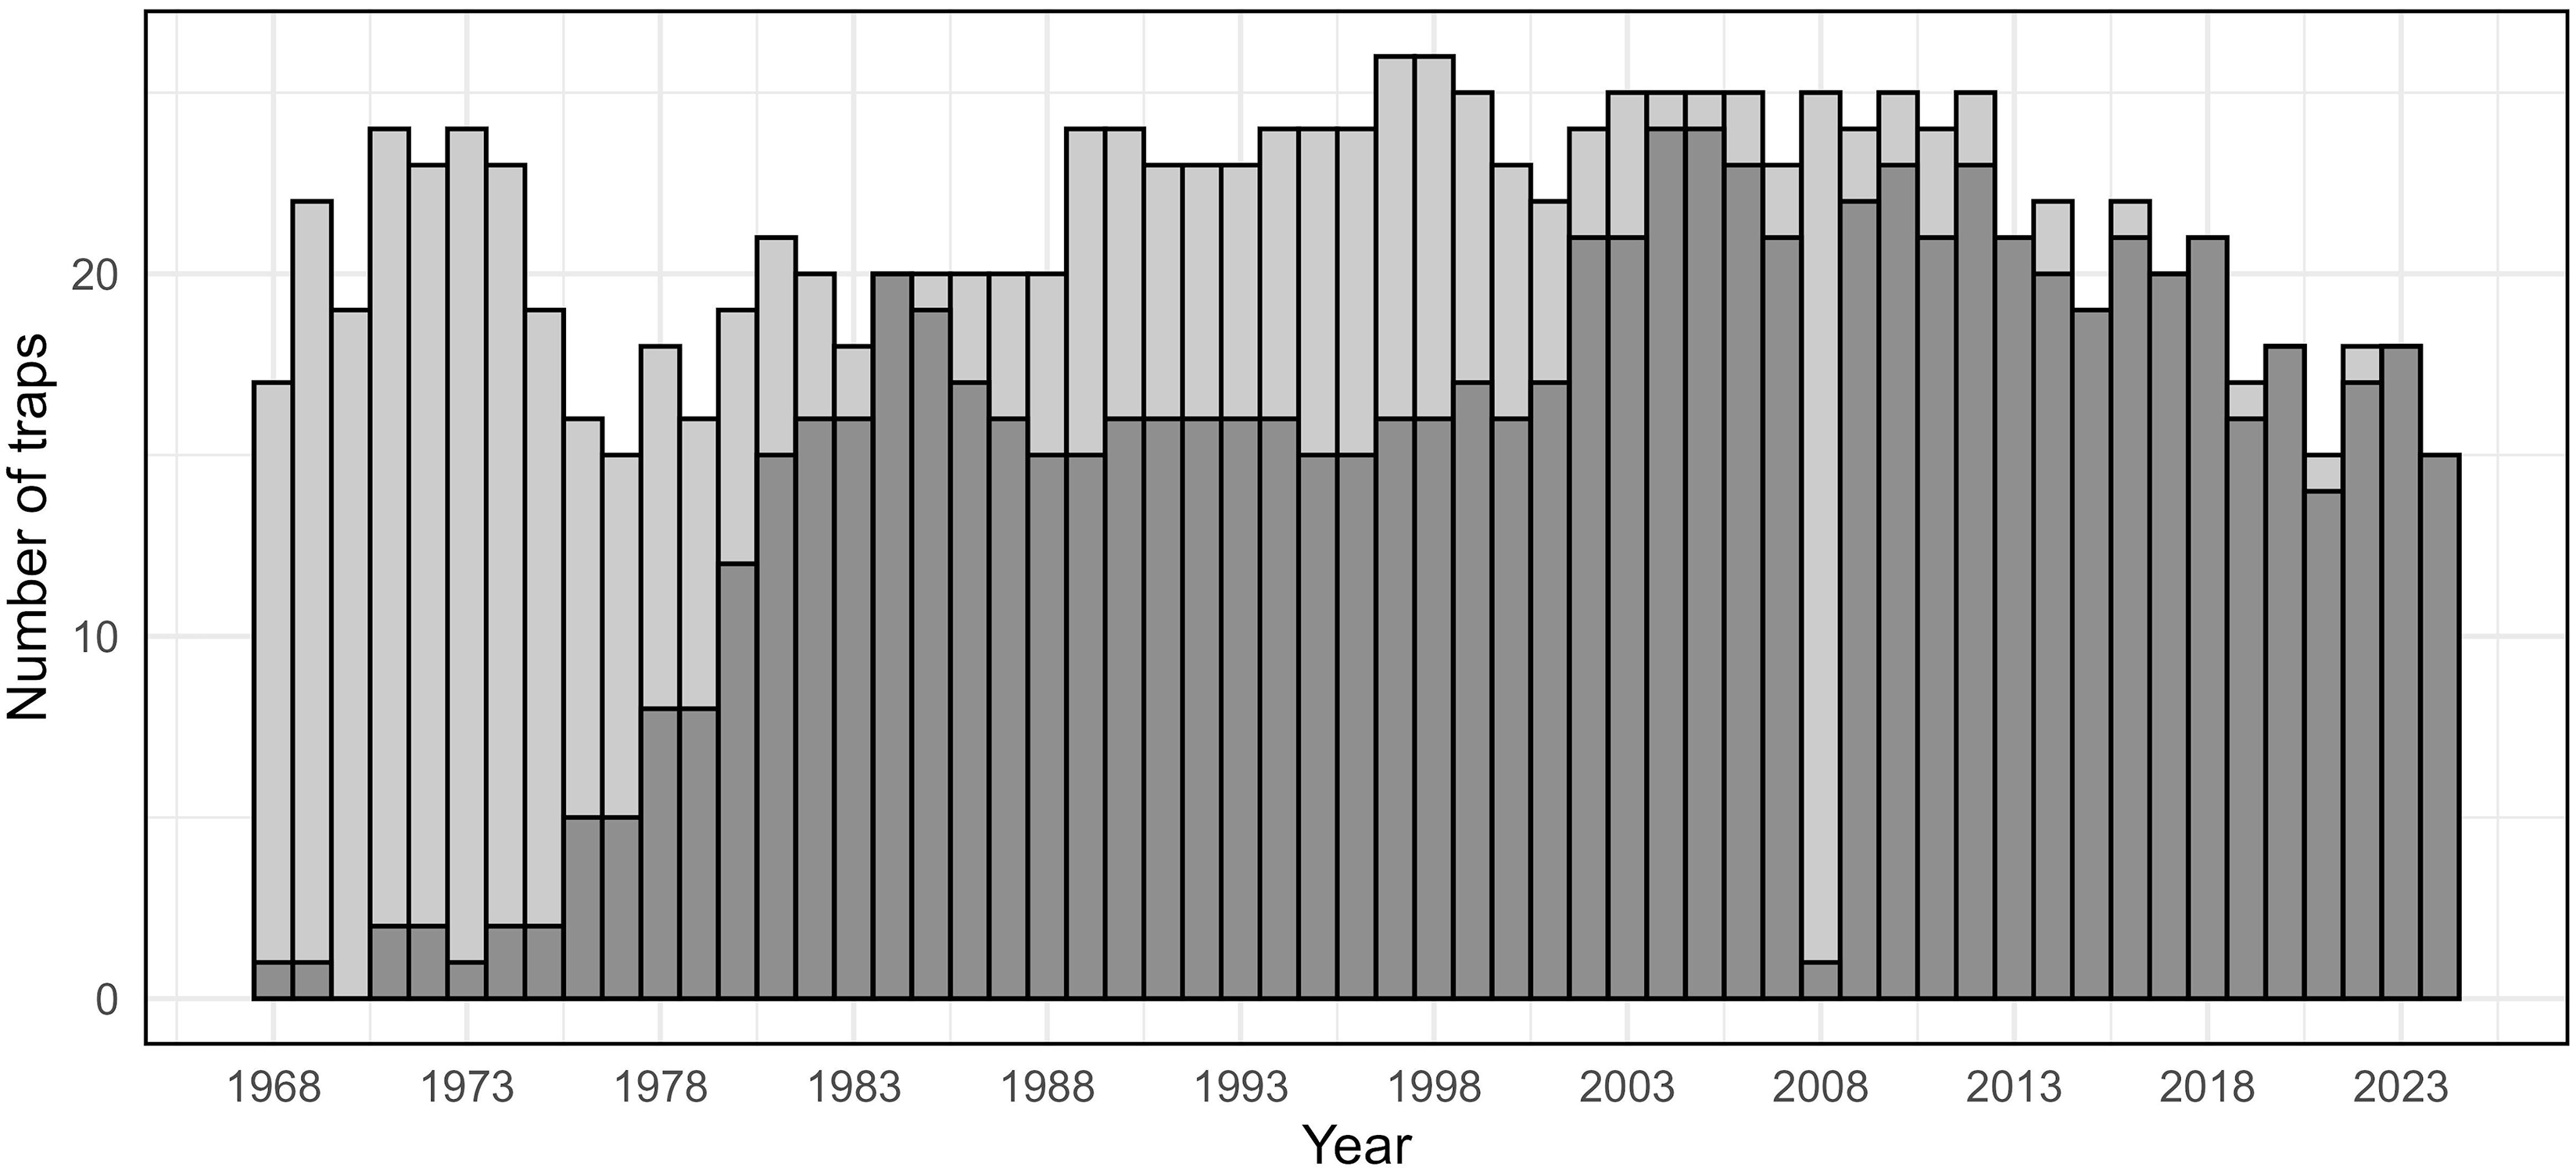
Between 15 and 25 light traps were operated each year from 1968 to 2024, with an increasing proportion of these traps bearing geographic coordinates over time (Fig. 2). For 1961–1967, statewide moth catch was recorded, but individual trap-level data were not available.
Number of spruce budworm light traps operated each year from 1968 to 2024 in Maine, United States of America. Light grey bars represent all traps for which individual counts were available; dark grey bars indicate traps with recorded geographic coordinates.
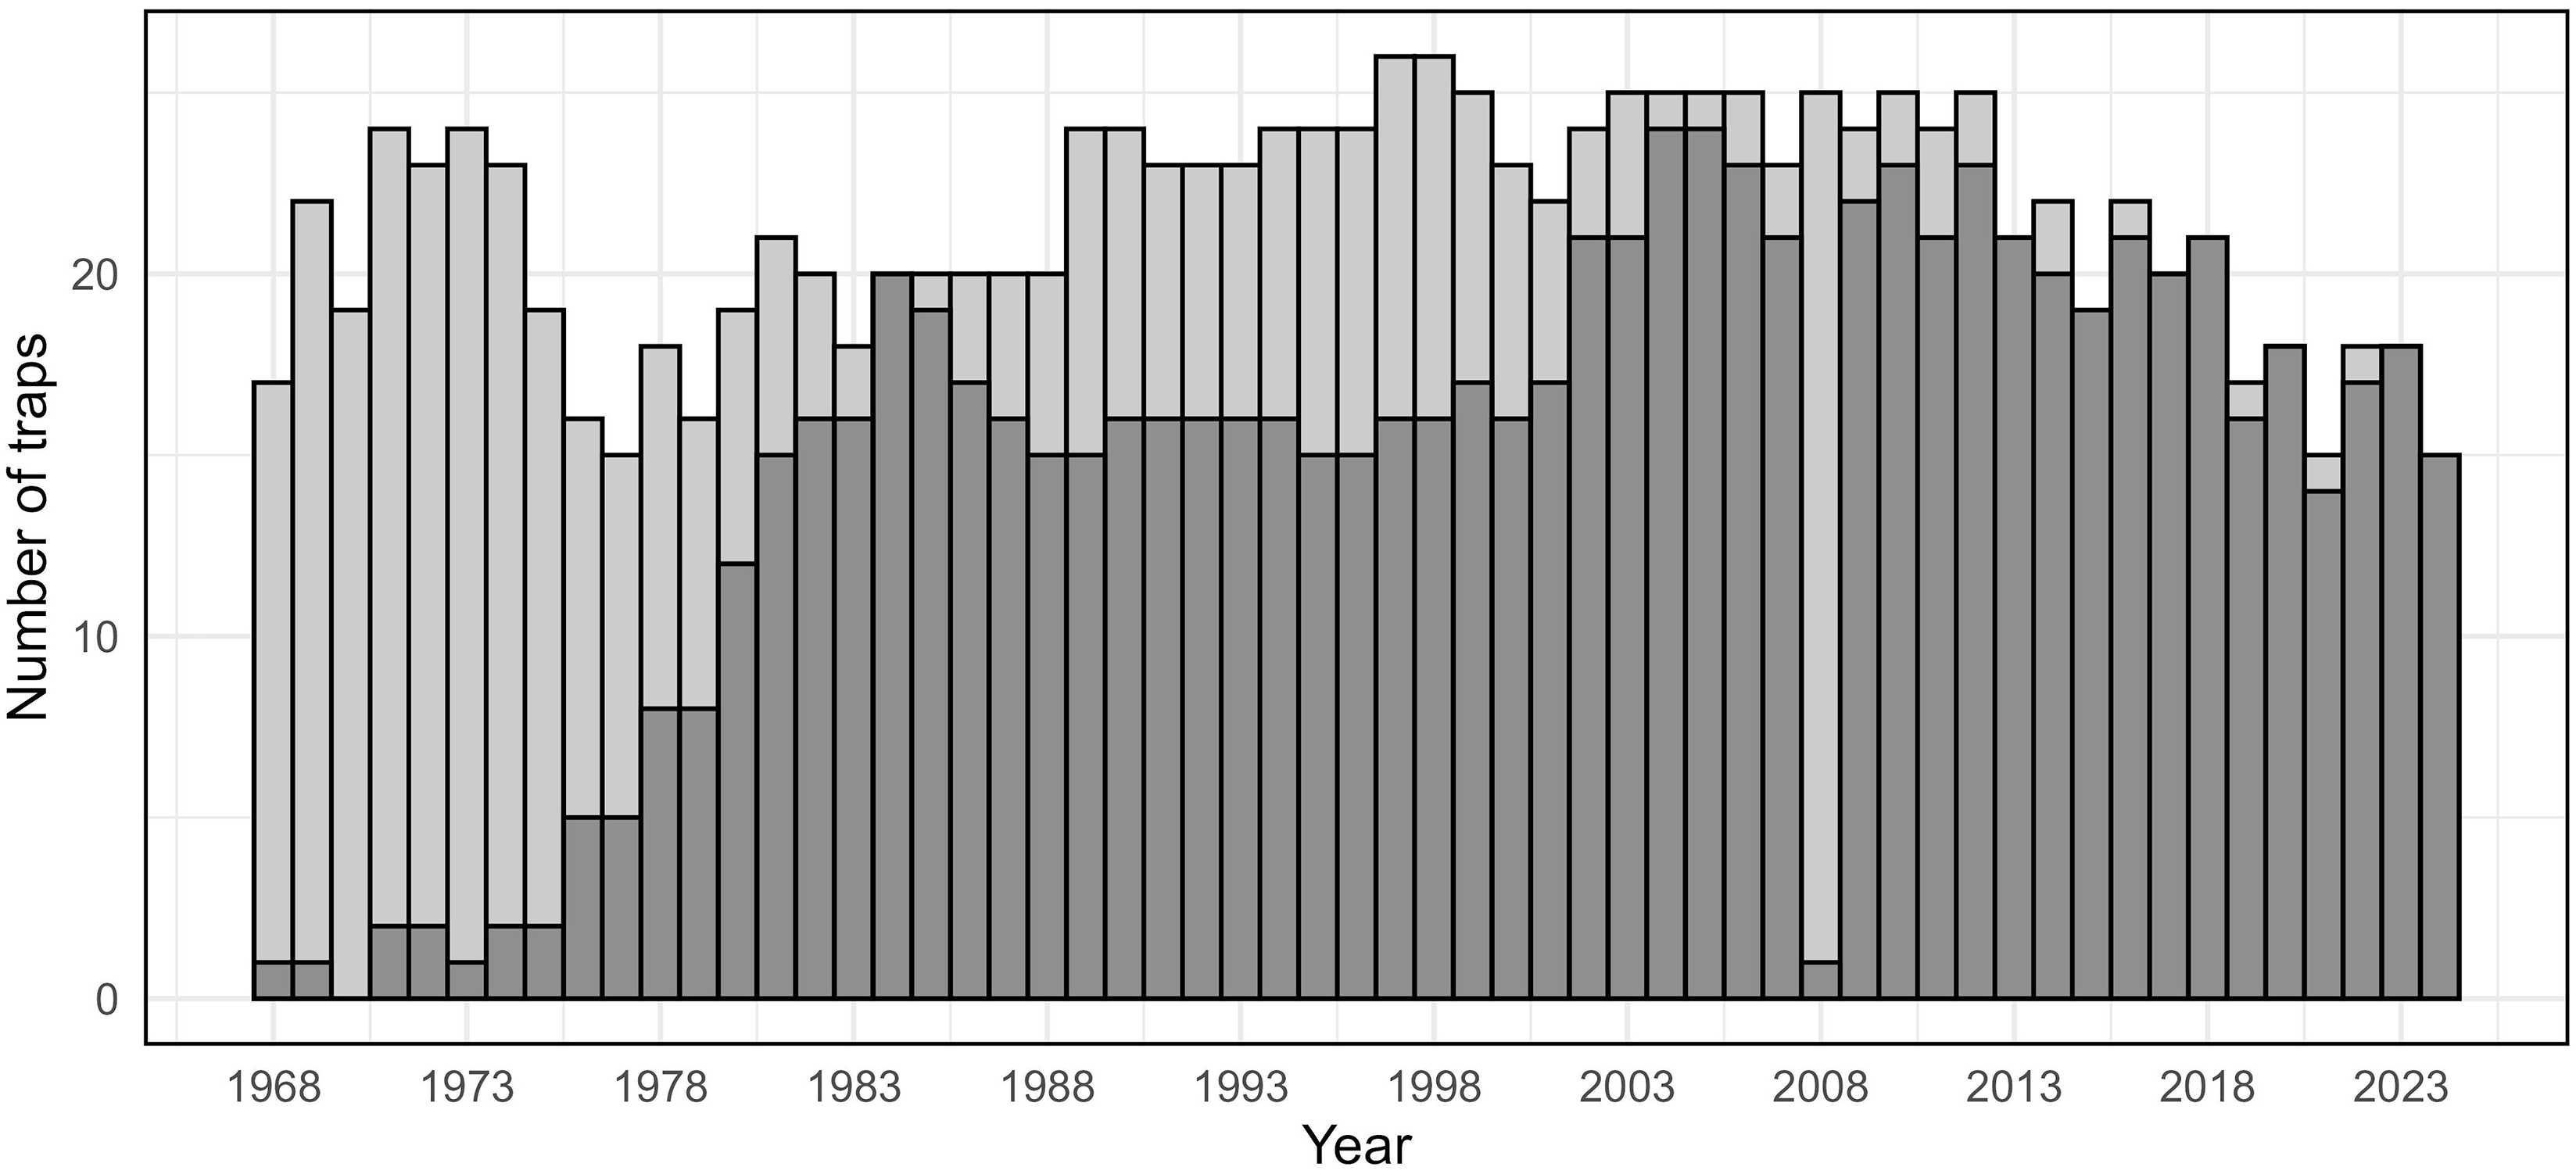
Figure 2. Long description
The bar graph compares the number of spruce budworm light traps operated each year from 1968 to 2024 in Maine, United States of America. The x-axis represents the years, ranging from 1968 to 2024, while the y-axis represents the number of traps, ranging from 0 to 25. The graph features vertical bars, with light grey bars indicating all traps for which individual counts were available and dark grey bars indicating traps with recorded geographic coordinates. The number of traps fluctuates over the years, with notable peaks around 1973, 1993, and 2003, and a general decline after 2008. All values are approximated.
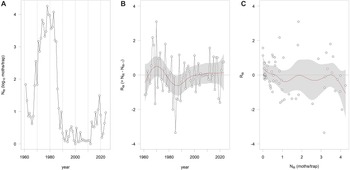
The statewide time series of moth counts (N8) showed a complex pattern of fluctuation rather than a regular oscillation (Fig. 3A). Interannual changes in abundance (R8) did not exhibit a sinusoidal pattern over time (Fig. 3B). The relationship between R8 and N8 was highly nonlinear, with evidence of multiple equilibrium points in the recruitment curve (Fig. 3C). These patterns closely resemble those reported by Cooke and Régnière (Reference Cooke and Régnière2025) for larval and adult population data from New Brunswick, Quebec, and Ontario.
A, Spruce budworm moth counts (N8) from 1961 to 2024 from Maine, United States of America; B, the interannual rate of change in moth counts (R8) versus time; and C, the recruitment curve R8 versus N8.
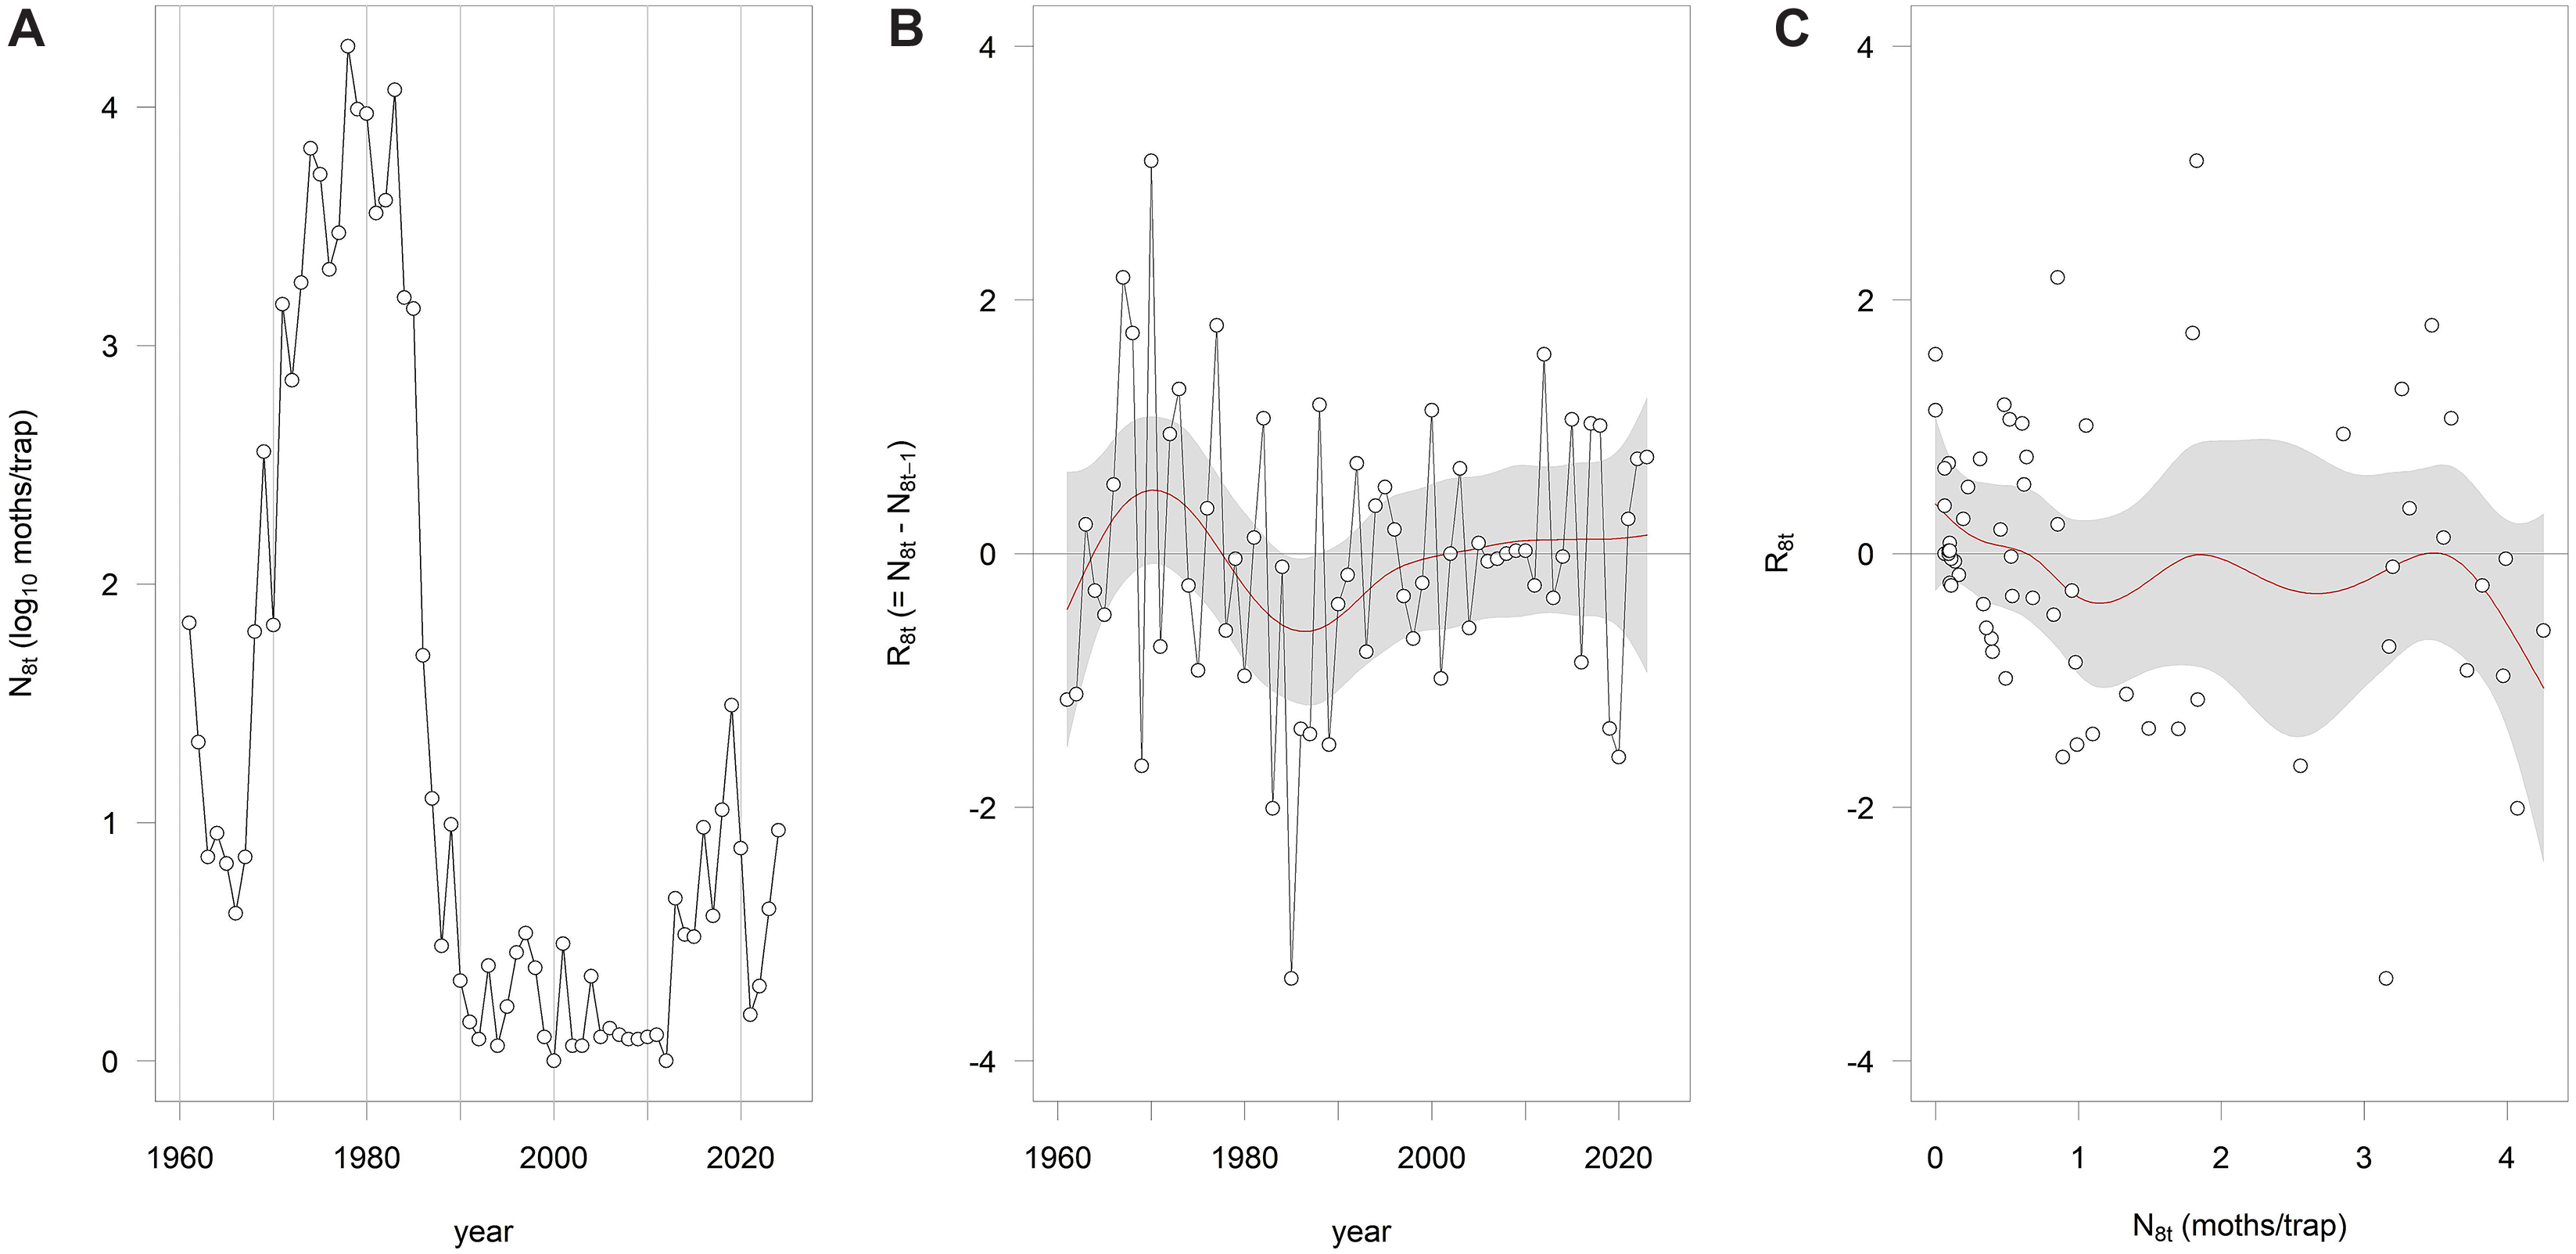
Figure 3. Long description
The image contains three separate graphs labelled A, B, and C. Graph A is a line graph showing spruce budworm moth counts (N8) from 1961 to 2024 in Maine, United States of America. The x-axis represents the year, and the y-axis represents the log of moths per trap. The data points are connected by lines, showing fluctuations in moth counts over time. Graph B is a line graph depicting the interannual rate of change in moth counts (R8) versus time. The x-axis represents the year, and the y-axis represents the rate of change. The data points are connected by a line, with a shaded area indicating variability or confidence intervals. Graph C is a scatter plot showing the recruitment curve R8 versus N8. The x-axis represents the number of moths per trap, and the y-axis represents the recruitment rate. Data points are scattered across the plot, with a red line indicating a trend or fitted curve and a shaded area representing variability or confidence intervals. All values are approximated.
The statewide light-trap record from Maine shows the same nonlinear eruption structure that Cooke and Régnière (Reference Cooke and Régnière2025) reported for three Canadian provinces. Rather than following a near-periodic oscillation, the system alternates between long quiescent phases and abrupt increases in adult abundance, a pattern characteristic of a metastable process, as originally hypothesised by Morris (Reference Morris1963) and Watt (Reference Watt1963). In such systems, population trajectories cannot be forecast reliably from the time series alone, even when extended quiet phases create the appearance of regularity. This limits the usefulness of classical outbreak-forecasting approaches that assume periodicity or near-linear density dependence (Cooke Reference Cooke2024).
A problem common to all these studies is that they constitute little more than a single low-frequency outbreak episode. Even with 64 years of data, the Maine series remains a single observation of a high-amplitude event. However, although the temporal frequency is low, the consistency between the Maine moth trap data and the Canadian larval data provides an alternative form of validation. If multiple independent systems show the same pattern of unpredictable stops and starts, we are likely observing a robust biological structure. These episodic, thresholded dynamics have direct implications for risk assessment in Maine. The recent pulse in moth numbers follows nearly two decades of low activity, making it necessary – but difficult – to anticipate what will occur next. Historical tree-ring reconstructions show that ‘skips’ have occurred in past cycles (Fraver et al. Reference Fraver, White and Seymour2007), and the present data provide no basis for determining whether the current pulse will lead to a full outbreak or simply dissipate. In this context, risk assessment depends less on predicting the exact trajectory and more on evaluating the structural conditions under which eruptions or skips are likely (Cooke and Sturtevant Reference Cooke and Sturtevant2026). Forest composition, climate context, and simulation modelling therefore become essential tools for evaluating outbreak risk (Brandt et al. Reference Brandt, Porter, Cooke and Scarr2026), complementing, rather than replacing, the long-term monitoring record.
The eruption structure documented here highlights the need to interpret spruce budworm dynamics through a structural-stability lens rather than relying solely on time-series behaviour. Metastable systems can remain quiet for extended periods and then shift abruptly, with the possibility of outbreak skips complicating expectations about outbreak development (Ludwig et al. Reference Ludwig, Jones and Holling1978). The recent increase in moth numbers in Maine therefore raises questions that cannot be answered from the monitoring record alone but require consideration of the broader conditions that govern transitions between quiescent and eruptive states. These issues are explored more fully in ongoing work that is examining how forest composition, climate context, nonlinear population processes, and dispersal interact to shape outbreak likelihood across the spruce–fir region.
Conclusion
The long-term light-trap record from Maine reveals a metastable eruption structure in spruce budworm populations, characterised by an extended quiescent period among many traps, punctuated by abrupt increases in adult abundance beginning in 2012. This pattern limits the utility of classical forecasting approaches and underscores the importance of evaluating the structural conditions that govern transitions between quiet and eruptive states. The recent pulse in moth numbers highlights this challenge: after nearly two decades of low activity, the monitoring record alone cannot indicate whether a full outbreak will develop or whether a skip is likely, as has occurred historically. Interpreting outbreak risk in Maine, therefore, requires a more detailed structural analysis of risk factors.
Data availability statement
Data analysed during this study are available in the ResearchGate data repository (ResearchGate, Berlin, Germany): https://doi.org/10.13140/RG.2.2.29489.85605/1.
Acknowledgements
B.J.C. thanks the Spray Efficacy Research Group International (Fredericton, New Brunswick, Canada) for brokering financial contributions from the provinces of Alberta, Saskatchewan, and Manitoba through grant #2024/12. Conversations with Dr. Brian Sturtevant (United States Department of Agriculture, Forest Service, Rhinelander, Wisconsin, United States of America) were invaluable in shaping the discussion.
Competing interests
The authors declare they have no competing interests.

 Open access

