


1. Introduction
The structure of an organization can be described by a network of relational ties among its individual members. This network is often portrayed as a simple chart representing hierarchy, but in reality, it is a complex web of interactions that enable the sharing of information, work-related advice, and personal advice among members of the organization and across levels of hierarchy (Krackhardt and Hanson, Reference Krackhardt and Hanson1993). These socio-organizational relationships manifest themselves both digitally and physically, though research continues to show that physical interactions are the cornerstone of collaboration and meaningful ties (Waber et al., Reference Waber, Magnolfi and Lindsay2014). Because of the importance of these physical exchanges, the design of the physical workspace—the commercial building—can have an impact on the nature and frequency of interactions among members of organizations (Sailer and McCulloh, Reference Sailer and McCulloh2012), which can be critical to the success of the organization (Kabo et al., Reference Kabo, Hwang, Levenstein and Owen-Smith2015). However, learning the true social and organizational ties among workers, which would be helpful in designing and managing these spaces, remains a challenge. Fortunately, recent advances in physical sensing strategies provide a pathway for inferring such relational ties by enabling analysis of interactions that happen in physical space. The core investigation in this paper, therefore, is the inference of socio-organizational relationships of office workers using ambient sensing data—in this case, plug load energy sensors installed at the desk level—that capture patterns of human use of space within the building.
The problem of learning organizational network structure has been well studied due to its importance to the fields of management science and organizational theory (Tichy and Fombrun, Reference Tichy and Fombrun1979; Krackhardt and Hanson, Reference Krackhardt and Hanson1993). Traditional, well-established methods born out of social science that make use of surveys, interviews, and observations have been widely used for this problem (Tichy and Fombrun, Reference Tichy and Fombrun1979; Krackhardt and Hanson, Reference Krackhardt and Hanson1993; Marin and Wellman, Reference Marin, Wellman, Scott and Carrington2016); however, we identify two shortcomings from these approaches. First, simply measuring the structure of an organization through its internal structure of leadership and teams can miss other important characteristics of an office network, such as social relationships and relationships formed through spatial configuration, whereby increased proximity and shared use of space can drive interactions (Sailer and McCulloh, Reference Sailer and McCulloh2012). Second, survey approaches require considerable time and effort to administer. This cost can become intractable when measuring extremely large networks, such as those for large organizations that inhabit sizeable buildings or campuses. In order to capture the subtleties of workplace ties more fully, data-driven methods are increasingly being used to conduct complex analysis of workplace behavior. Data-driven methods can offer accurate and subtle insights into the nature of occupants’ activities and utilization of spaces over time, thereby enabling the automated inference of socio-organizational relationship structure of office workers.
Recent developments in time series analysis have enabled inference of correlations and causal relationships among entities, including network structure of complex systems (Runge et al., Reference Runge, Nowack, Kretschmer, Flaxman and Sejdinovic2019). Statistical and data mining tools that have been proposed for network inference are typically designed for nonsocial systems, such as biological, physical, or abstract networks (Friedman et al., Reference Friedman, Hastie and Tibshirani2008). However, some recent work has adapted these more general methods for inferring social networks from time series data on human activity (Pan et al., Reference Dong, Cebrian, Kim, Fowler and Pentland2012). Separately, recent research has shown that game-theoretic approaches can successfully construct social networks based on features ascribed to individuals (Yuan et al., Reference Yuan, Alabdulkareem and Pentland2018). In reviewing the literature, we identified two models that may be appropriate for the problem of learning socio-organizational networks from sensor data: the Graphical Lasso (Friedman et al., Reference Friedman, Hastie and Tibshirani2008) and the Influence Model (Pan et al., Reference Dong, Cebrian, Kim, Fowler and Pentland2012). The Graphical Lasso, a model for estimating the inverse covariance matrix among entities producing time series data, was originally introduced in the context of learning protein interactions in biological systems (Friedman et al., Reference Friedman, Hastie and Tibshirani2008). However, more recent extensions have argued that the model may be applicable to social systems (Hallac et al., Reference Hallac, Park, Boyd and Leskovec2017). Conversely, the Influence Model leverages a generally coupled Hidden Markov Model, which produces an “influence matrix” that can be used to define a network. The Influence Model was originally introduced in the context of the electrical grid (Asavathiratham, Reference Asavathiratham2001) but has since been adapted to other problem settings, including the context of modeling influence among people in social settings (Pan et al., Reference Pan, Cebrian, Dong, Kim and Pentland2010). Because the literature has suggested that these data-driven models may be appropriate for modeling social networks, we adapted them to our unique problem setting involving ambient sensing data of building utilization. However, the use of ambient sensing in physical office spaces remains a key gap in social network inference. By leveraging this new paradigm of sensor deployment and data availability, we will be able to understand the operation of organizations and the spaces they inhabit through this lens of human activity in real time.
Our work here adopts network inference methods to infer the human network structure of office workers from distributed plug load energy sensors. These sensors are becoming ubiquitous and, as discussed in our previous work, can be used to model individual activity states at the desk level (Sonta et al., Reference Sonta, Simmons and Jain2018). As we discuss in detail below, analysis of these activity states reveals times when office workers have the opportunity to interact with one another, a key component that drives collaboration and innovation for organizations and companies.
1.1. Organizational success, spatial layout, and network structure
The success of an organization can be described in part by the quality of the work performed within it. This notion of improved quality of work is difficult to measure and necessarily different for different workplaces. A company that prides itself on creativity and innovation is likely to care more about, for example, new ideas generated per day than number of words typed per minute. Despite the nebulous nature of organizational performance, research has pointed to key metrics that are important in many of today’s workplaces. Particularly in what researchers have dubbed the “knowledge industry”—organizations that trade in technology and human capital (Powell and Snellman, Reference Powell and Snellman2004)—one key component of organizational success has crystallized as vitally important: collaboration (Soriano and Huarng, Reference Soriano and Huarng2013). The fields of economics and organizational theory have argued that complementarities among individuals are key to organizational success, which enables the view that collaboration and interaction among members are strong components of overall productivity (Ethiraj and Garg, Reference Ethiraj and Garg2012). When considering the measure of collaboration among employees, understanding the structure of their relationships can give a manager or designer a sharper sense of opportunities for collaboration as well as the ability to design interventions to improve it (Olguin-Olguin and Pentland, Reference Olguin-Olguin and Pentland2010).
The physical spaces of most organizations are office buildings. These buildings are created to meet the needs of their occupants, including needs relating to the subjective experience of the building as well as the indoor environmental quality (D’Oca et al., Reference D’Oca, Chen, Hong and Belafi2017). Architectural researchers have claimed that the organization of space is driven by the ordering of relationships among people (Hillier and Hanson, Reference Hillier and Hanson1984). This view creates the opportunity to leverage knowledge of the organizational structure in spatial design for collaboration. Moreover, researchers focusing on energy efficiency in buildings have noted that the structure of the occupants’ social network has an impact on the way in which energy-efficient behaviors take root and spread in a building (Anderson et al., Reference Anderson, Lee and Menassa2014). Connecting research on office building design and operation with research on organizational performance demands the need for a way to infer the complex relationships of office workers—the central question we investigate in this paper.
In the domain of workspace and organizational theory, researchers have noted a strong relationship between office design/layout and occupant satisfaction and performance (Sailer, Reference Sailer2011; Sailer and McCulloh, Reference Sailer and McCulloh2012; Kabo et al., Reference Kabo, Hwang, Levenstein and Owen-Smith2015). Recently, researchers have noted that the physical designs of buildings can have large impacts on different metrics related to productivity, such as communication, collaboration, creativity, and innovation (Sailer, Reference Sailer2011; Kabo et al., Reference Kabo, Hwang, Levenstein and Owen-Smith2015). Using the language of space syntax (Bafna, Reference Bafna2003), researchers have defined metrics defined by physical layout and correlated them with occupant outcomes. For example, Peponis et al. (Reference Peponis, Bafna, Bajaj, Bromberg, Congdon, Rashid, Warmels, Yan and Zimring2007) found that higher levels of a single workspace’s spatial integration correlated with more central positions in the organizational network for the individual occupying that workstation. Kabo et al. (Reference Kabo, Hwang, Levenstein and Owen-Smith2015) found that higher path overlap among occupants correlated with more successful collaborations. Generally, research has found that higher spatial relationships (e.g., proximity) improves the way individuals communicate and collaborate with one another in a building (Wineman et al., Reference Wineman, Kabo and Davis2009; Housman and Minor, Reference Housman and Minor2016; Claudel et al., Reference Claudel, Massaro, Santi, Murray and Ratti2017; Kabo, Reference Kabo2018). An accurate understanding of true relationships among occupants can be a critical tool in understanding the nature of work in buildings and ultimately for suggesting spatial shifts that improve office worker performance and collaboration (Olguin-Olguin and Pentland, Reference Olguin-Olguin and Pentland2010; Sailer et al., Reference Sailer, Pomeroy and Haslem2015).
The network of relational ties among individuals in an organization also has implications for the physical performance of the building they occupy. Recently, researchers have found that understanding the network structure of building occupants can be useful in suggesting building layout changes that could reduce energy consumption of heating, cooling, and lighting systems (Sonta et al., Reference Sonta, Jain, Gulbinas, Moura and Taylor2017), as well as impact the efficacy of information campaigns aimed at targeting energy-efficient behavior, as discussed above (Anderson et al., Reference Anderson, Lee and Menassa2014). While building energy performance has important environmental and societal implications, managers of organizations and buildings are typically driven to maximize the performance of the workforce. For the University of California system—whose operating budget is public data—total employee salaries, wages, and benefits constitute the vast majority of total expenditure. Compared to utility costs, employee costs were roughly 72 times more expensive in 2017–18, underscoring the notion that organizations are rational if they prioritize the productivity of their workforce over building energy efficiency (Revenue and expense data, University of California, n.d.). With this economics driving decision-making, managers may be unlikely to make changes to the design of a building if they worry that adopting changes could disrupt productivity. Understanding the structure of the socio-organizational occupant network offers an opportunity to suggest design and space management perturbations that can save energy without disrupting the natural flow of information, advice, and other components of work. Gaining insight into this network can enable new methods for co-optimizing these tightly coupled human and building systems that are fundamentally intertwined.
In this paper, we develop a method for automatically inferring the human network structure of office workers using ambient sensing data. Our method defines “opportunities for social interaction” as times when occupants have stopped interacting with their individual workstations and have a higher opportunity for social and/or collaborative interaction in the physical space of a building. In a case study, we benchmark the performance of our proposed method against socio-organizational network data obtained through traditional surveys. Through statistical tests, we find that our method can uncover network structure that is substantially similar to the survey network. We also find that methods proposed in the literature for network inference through time-series analysis perform less well in this regard. We discuss the subtle characteristics of network inference, pointing to areas in which our method performs well and to areas in which further research will shed more light on organizational structure. We also discuss how building design could be improved to facilitate and promote collaboration among office workers.
2. Methodology
We represent a social network as a graph G = (V, A) where V is a set of nodes and A its adjacency matrix. Our objective in this study is to learn the entries of the matrix A for a given set of nodes (i.e., office workers) within a building. The entry Ai,j is real-valued and represents the strength of the relationship from node Vi to node Vj. The graph can be undirected, such that any entry Ai,j = Aj,i, or directed, such that each value is distinct. The construction of physical networks is typically defined through natural data on the structure of the physical system (e.g., power-line connections between substations in a power grid). In social systems, network data are typically measured through surveys that ask study participants to identify the presence or strength of relationships with the others in the study. Data-driven network inference has relied on analysis of correlations in time series data ascribed to each node (Hallac et al., Reference Hallac, Park, Boyd and Leskovec2017). This is the perspective we adopt in this study: we aim to learn the adjacency matrix A of the occupant socio-organizational network by leveraging node-level data streams collected in a building.
Our specific objective for learning A is to measure behavioral correlations among individuals through time series data. Our methods make use of plug load energy data collected at each workstation—which has been shown to accurately describe occupants’ use of space in buildings, thereby offering insight into patterns of behavior that could reveal ties (Zhao et al., Reference Zhao, Lasternas, Lam, Yun and Loftness2014; Sonta et al., Reference Sonta, Simmons and Jain2018). We define the time series energy data for occupant i as Xi (with I as the total number of occupants) and the total number of time steps as D·T, where D is the number of days and T is the number of time steps during the day (i.e., if we collect data at 15-min intervals, T = 96). As a preprocessing step, we leverage the method introduced in Sonta et al. (Reference Sonta, Simmons and Jain2018) to map the raw data to abstracted states of occupant activities: Xi ,d ➔ Si ,d (details in Appendix A). The mapping uses variational Bayesian inference with a Gaussian Mixture Model to cluster the time series plug load data into states, which can be interpreted as abstractions of occupant activities. In past work, we have typically found three states as the most common number of activity states: low energy, medium energy, and high energy. For example, higher energy use values map to high-energy activity states, which correspond to occupants actively using their workstations.
Through a survey of the literature, we identify two existing network learning methods as applicable to this problem statement—the Graphical Lasso and the Influence Model—but we note that specific knowledge of building occupant space use creates the opportunity for the design of our own algorithm. Below, we describe these existing methods (Section 2.1) as well as our own method, which we call the Interaction Model (Section 2.2). Knowing that human relationships in workspaces are built on interactions, we hypothesize that a new algorithm that directly makes use of occupants’ use of space can uncover network structure more accurately than the other methods we implement. To test this approach, we conducted a case study in an 18-person office environment in Berkeley, CA (described in Section 2.3). Finally, we conduct an analysis leveraging the space syntax methodology to enable comparison of the socio-organizational and spatial structures of the building (Section 2.4).
2.1. Existing data-driven network construction methods
2.1.1. Graphical Lasso
The Graphical Lasso was developed as an algorithm for inferring sparse undirected graphical models—also known as Markov random fields—through L1 (lasso) regularization. In the literature (Friedman et al., Reference Friedman, Hastie and Tibshirani2008), the data are defined as N multivariate observations in a Gaussian distribution with dimension p, mean μ, and covariance Σ. In our case, N = D·T (the total number of timesteps) and p = I (the number of workstations/individuals). The Graphical Lasso makes use of coordinate descent to estimate the inverse covariance matrix (Σ −1). The covariance matrix can then be considered as the adjacency matrix in a Markov random field. Because the model assumes that the data are normally distributed, we apply this algorithm to the raw time series energy data, rather than the mapped activity states. We used the R package “glasso” for implementation. Previous work has suggested that this approach can be useful for inferring social network structure from observing the activities of the actors rather than the network itself (Hallac et al., Reference Hallac, Park, Boyd and Leskovec2017).
2.1.2. Influence Model
The Influence Model, discussed in Pan et al. (Reference Dong, Cebrian, Kim, Fowler and Pentland2012), models the interaction among entities as a generally coupled Hidden Markov Model, in which the state of each entity at any given time point is determined by the state of all entities at the previous time point. The model is defined such that the entities—in our case, the building occupants—are in one of a set number of states at any given time point, which ultimately leads them to produce a signal. This has a direct corollary in our problem setting: these abstracted states can be viewed as our occupant activity states and the signals as the plug load energy signatures. A graphical representation of the Influence Model is shown in Figure 1. The authors use Expectation Maximization to estimate the parameters of the model by directly using the states, making our mapping from energy to states necessary for this model. One of the key parameters that is learned is the matrix R—the “influence matrix”—which can be interpreted as an adjacency matrix in a network. Past work has shown that the Influence Model can be used for both physical systems (e.g., a power grid network) as well as social systems (e.g., influence among people conversing) (Pan et al., Reference Dong, Cebrian, Kim, Fowler and Pentland2012). We implemented the Influence Model using the MATLAB package available through Pan et al. (Reference Dong, Cebrian, Kim, Fowler and Pentland2012).
Graphical representation of the Influence Model. The model estimates the strength of the arrows between any two time steps using Expectation Maximization, and these strengths form the basis for the inferred network.

2.1.3. Gaps in existing methods
The Graphical Lasso and Influence Model were designed to measure structural relationships among entities, a strategy we argue is best suited for relationships that are distinctly nonsocial (e.g., protein interactions, power grids). The Graphical Lasso can be seen as purely data-driven, directly estimating the network through raw data. The Influence Model makes use of abstracted states to which we map the energy values, but there exists still an opportunity to leverage further information embedded in these activity states. Specifically, we note that different energy use states suggest different uses of the building. We argue that human relationships in organizations are built on opportunities for social interaction in the context of the spatial arrangement of a building, warranting a new method that leverages localized use of space.
2.2. The Interaction Model
The Interaction Model (depicted on example data from a single day in Figure 2) begins by abstracting the time series plug load data (Figure 2a) into states of activities (Figure 2b), as discussed in Appendix A (originally introduced in Sonta et al. (Reference Sonta, Simmons and Jain2018)). We note that different activity states suggest different uses of the building, and we interpret these states as localized use of the building’s space. A benefit of this localized approach is that the spatial and temporal granularity of the data allows one to ascribe patterns of activities and space use to each individual. Leveraging the information embedded in this use of space, the model identifies times when office workers have opportunities for social interaction with other office workers in the building (Figure 2c). These opportunities are aggregated using the Jaccard index to form the inferred socio-organizational network (Figure 2d).
Demonstration of Interaction Model steps applied to data from a single day. (a) Raw plug load energy values collected through sensors. (b) Activity states (low, medium, and high energy) resulting from the clustering of the energy data using a variational Bayesian Gaussian Mixture Model. (c) Opportunities for social interaction, where a black value of 1 indicates interaction opportunity. (d) Resulting network (after 365 days of analysis), shown both as an adjacency matrix heatmap and as a graph visualization.
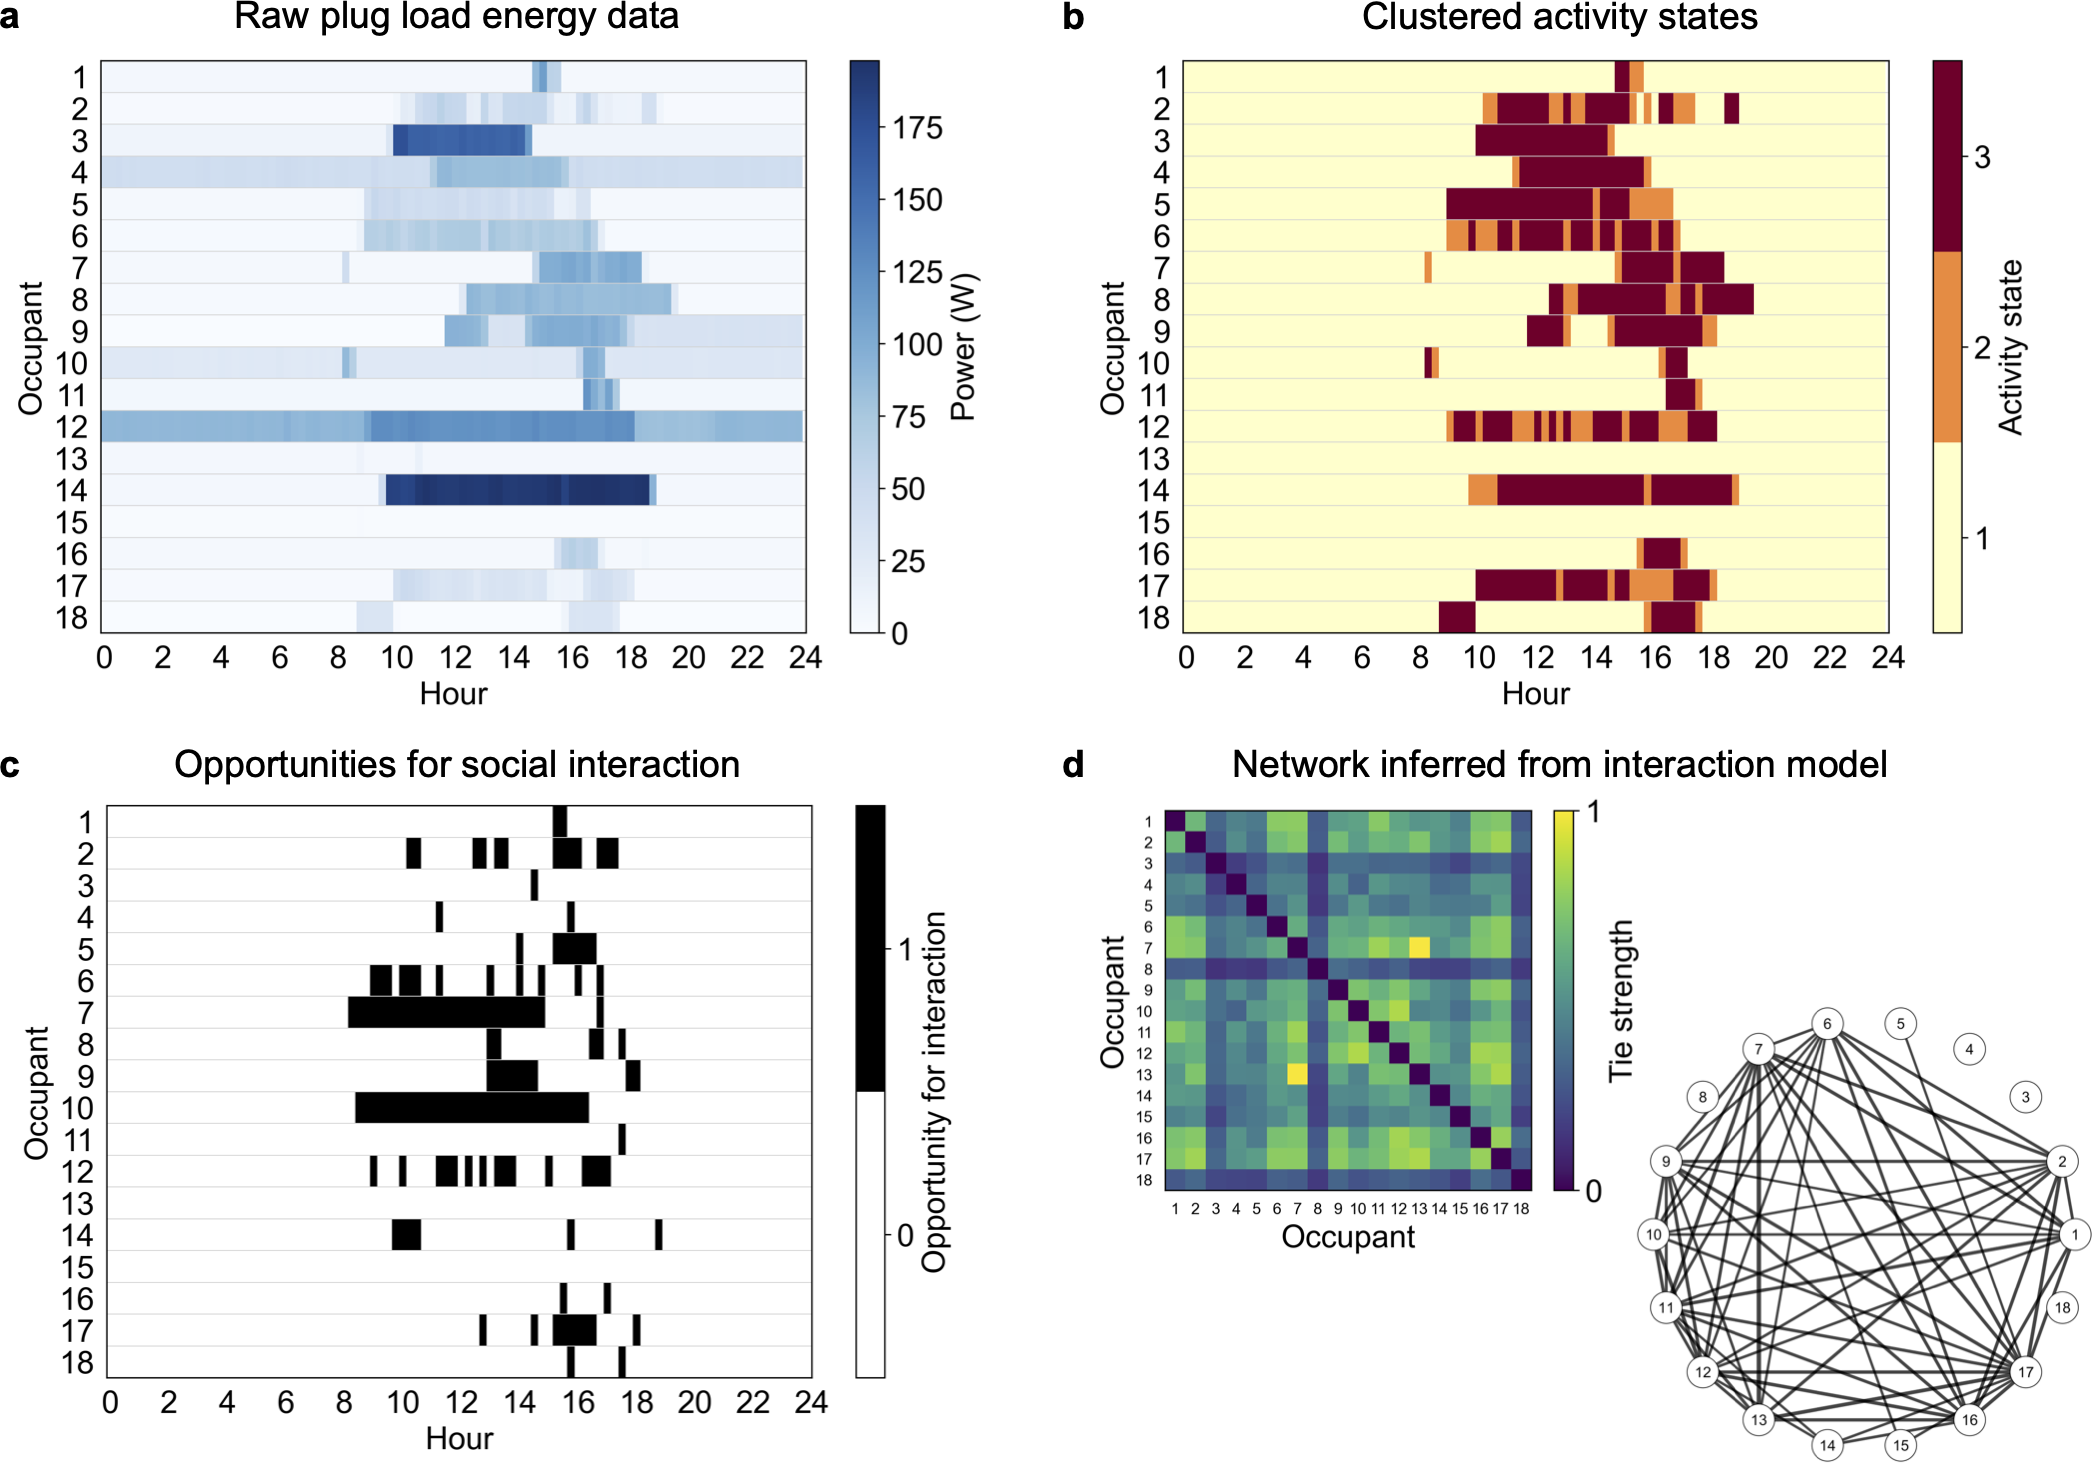
We assume that in a high-energy activity state, occupants are likely to be fully utilizing their equipment at their workstations and are less likely to be moving around the building. At a medium- or low-energy activity state, the equipment has entered a power-saving mode or turned off altogether, which in a modern workspace we assume indicates that occupants are more likely to be away from their workstations with higher opportunity for interacting with the people around them. These assumptions are based on our previous validation work, which shows that the activity states can be used as reliable occupancy sensors (Sonta et al., Reference Sonta, Simmons and Jain2018). We leverage this detail in the data by defining an opportunity for social interaction between two occupants to occur when those two occupants have both transitioned from the high-energy activity state to either a medium- or low-energy activity state. We limit these opportunities for interaction such that they only occur after the first transition to the high-energy state (i.e., the occupant first arriving at their workstation for the day) and before the last transition to the low-energy state (i.e., the occupant leaving for the day). Between these two temporal bounds that bookend the workday, we count the number of times throughout the day that any two occupants have the opportunity to interact. This counting of overlaps in opportunities for interactions forms the weightings of ties among occupants. Formally, we weight the entries Ai,j and Aj,i (the tie strength between occupant i and occupant j) as the Jaccard similarity coefficient of the overlap in opportunities for interaction between occupants i and j. This network inference definition creates an undirected network. We note that previous work on estimating social networks on the urban scale has also made use of the general notion of “interaction opportunity” as defined by physical co-presence in an urban setting (Shen et al., Reference Shen, Karimi, Law and Zhong2019).
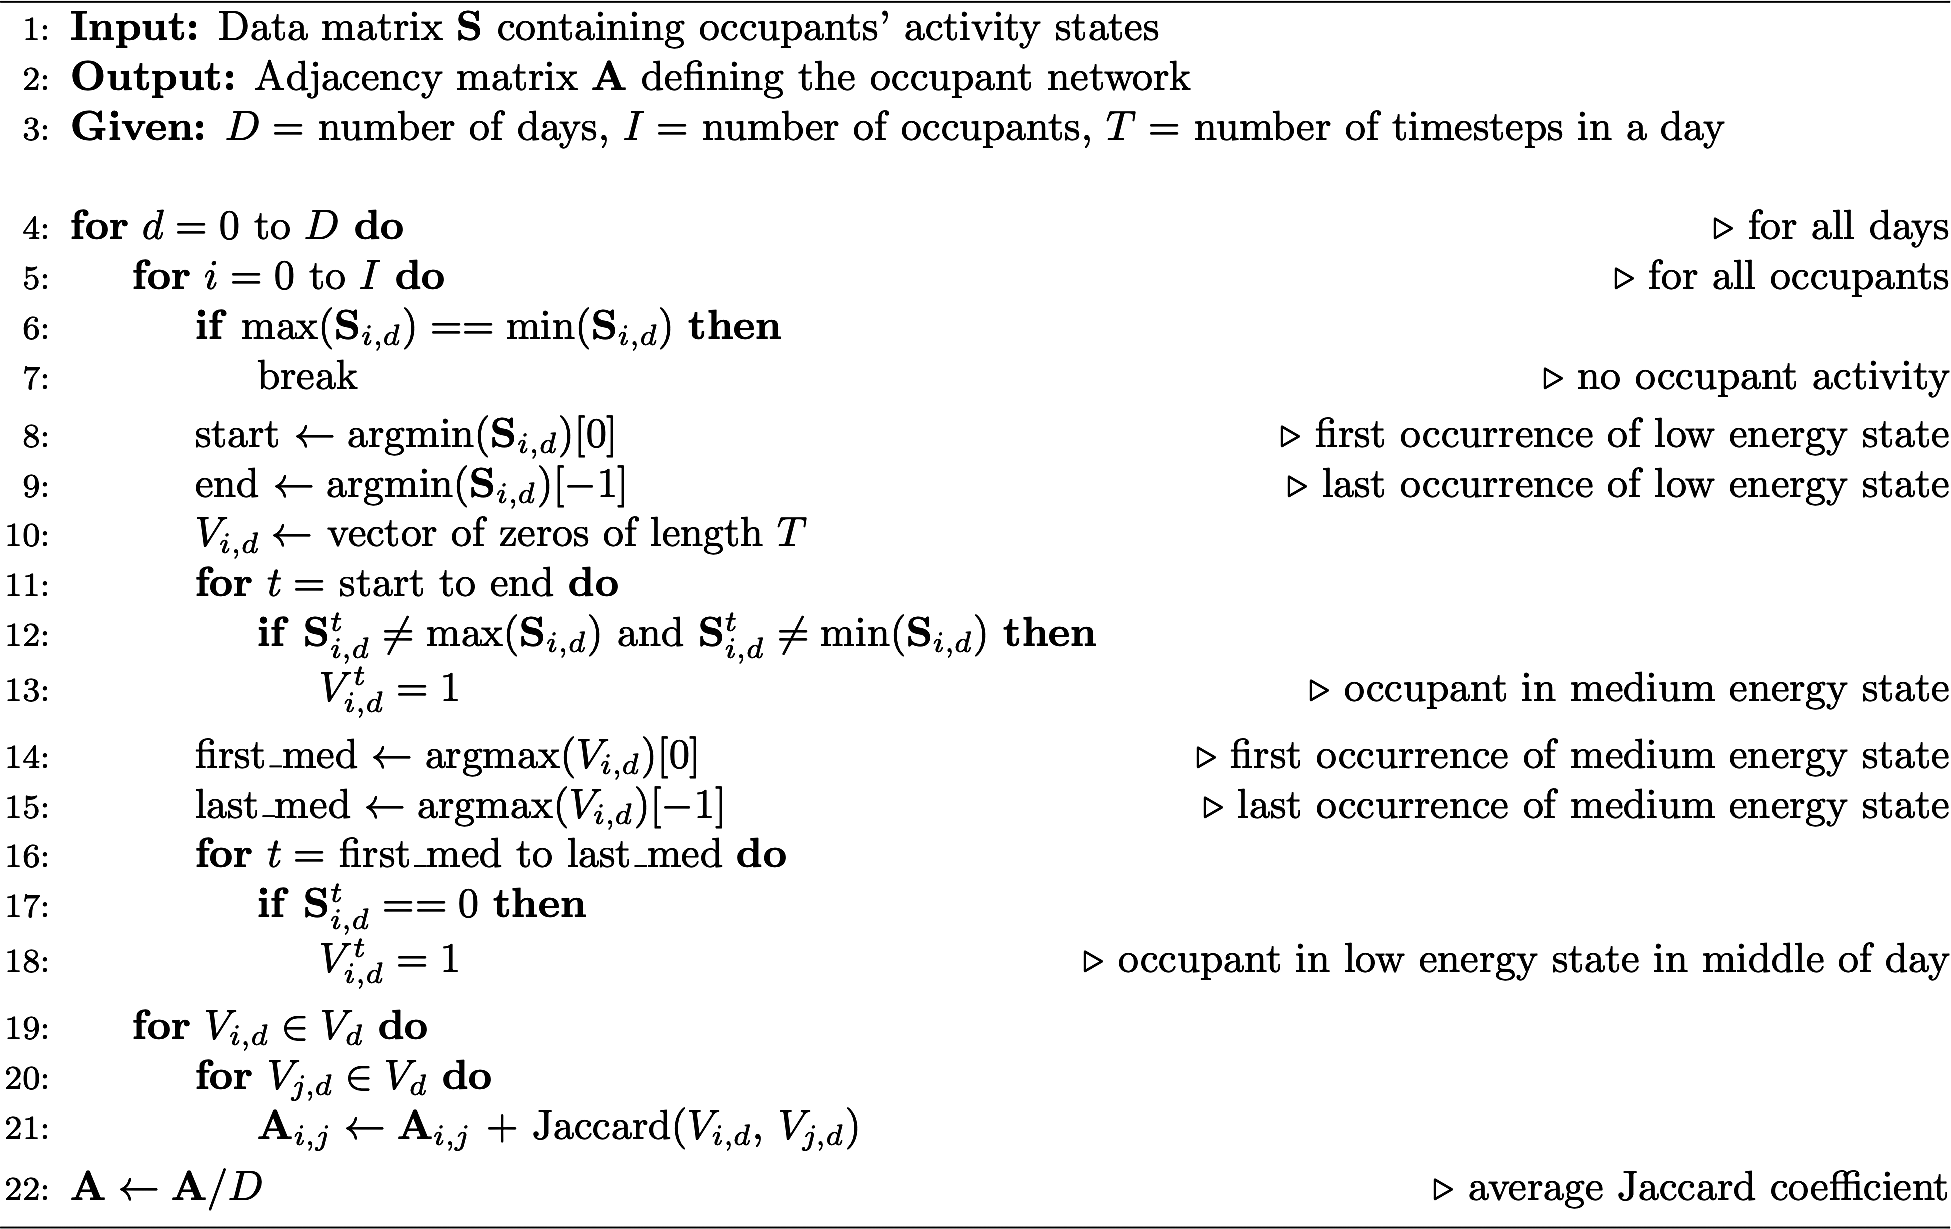
Given a time series of activity states Si,d (as described above), the objective of the Interaction Model is to construct the adjacency matrix A such that the entry Ai,j defines the relationship from occupant i to occupant j. We define the opportunity for interaction as undirected rather than directed and therefore Ai,j = Aj,i. Our algorithm for the Interaction Model is described here (see Algorithm 1 for pseudocode). The algorithm first computes vectors for each occupant for each day describing when that occupant has an opportunity for social interaction. This opportunity is defined as being when the occupant is in a medium-energy state or when the occupant is in a low-energy state between high- or medium-energy states (i.e., not before the start of the workday or after the end of the workday). We therefore define the vector Vi,d (for occupant i on day d) as a series of integers of length T, the number of time steps in a day. Each integer is either a zero or a one, with ones indicating the occupant has the opportunity for social interaction; zeros indicating no opportunity. For each day and each pair of occupants, we compute the Jaccard index between the two vectors Vi,d and Vj,d. This computation is repeated for each pair of occupants within a day, creating an adjacency matrix Ad associated with each day. This process is repeated for all days in the study, and the overall adjacency matrix is the average of all A1,…,AD. The Jaccard similarity between any two vectors V1 and V2 is computed as follows:
 $$ \mathrm{Jaccard}\left({\mathbf{V}}_1,,,{\mathbf{V}}_2\right)=\frac{\left|{\mathbf{V}}_1\cap {\mathbf{V}}_2\right|}{\left|{\mathbf{V}}_1\cup {\mathbf{V}}_2\right|}=\frac{\left|{\mathbf{V}}_1\cap {\mathbf{V}}_2\right|}{\left|{\mathbf{V}}_1\right|+\left|{\mathbf{V}}_2\right|-\left|{\mathbf{V}}_1\cap {\mathbf{V}}_{2.}\right|}. $$
Interaction Model.
We define the size of a vector and the intersection between our vectors of social opportunity as follows, based on the index of occupant x:
 $$ \left|\mathbf{V}\right|={\sum}_i{\mathbf{V}}^i, $$
 $$ \left|{\mathbf{V}}_1\cap {\mathbf{V}}_2\right|={\sum}_i{\mathbf{V}}_1^i\cdot {\mathbf{V}}_2^i. $$
The benefit of using the Jaccard index instead of simply counting the number of overlaps in opportunities for social interaction is that it discounts the situation when a single occupant is in a low- or medium-energy state throughout much of a workday. In essence, it normalizes these overlaps in opportunities for interaction based on the total number of opportunities that each occupant has in each day. An illustrative example is shown in Figure 3.
Jaccard similarity example. Illustrative example showing the normalizing effect of the Jaccard index computed on pairs of vectors describing opportunities for interaction.

2.3. Data collection and statistical analysis
We installed plug load energy sensors at 18 workstations in an office in Berkeley, CA. The office houses a small environmental consulting and engineering firm. Each occupant is assigned to his or her own workstation, allowing us to adopt the perspective that data ascribed to a workstation are ascribed to an individual. The sensors are Zooz smart plugs, which communicate with Z-Wave technology to a Samsung SmartThings Hub. Data were collected over 1 year (365 days) between August 2018 and August 2019. Plug load energy data were reported at 1-min intervals. We aggregate the 1-min data to 15 min, as this time scale has been shown to appropriately describe activities that impact building energy consumption as well as offer insight into social interaction (Sonta et al., Reference Sonta, Jain, Gulbinas, Moura and Taylor2017, Reference Sonta, Simmons and Jain2018). Manual inspection of the data revealed that plug load energy collection at a very rapid time scale (e.g., less than 5 min) can increase noise in the data to detrimental levels, while previous research has shown that a sparse time scale (e.g., greater than 30 min) can reduce the amount of valuable information in the data (Melfi et al., Reference Melfi, Rosenblum, Nordman and Christensen2011). Workstations typically included desktop computers and monitors, as well as some miscellaneous equipment (e.g., phone chargers, lamps, etc.). We made no alterations to the settings of the computers, such as when computers are set to sleep. This decision to minimize interventions was made to maximize extensibility of the overarching methodology to new settings.
The sensors occasionally report erroneous values or fail to report values. As a data cleansing step, we remove data points greater than three standard deviations away from each occupant’s mean (0.002% of data points), those less than 0 W (0.0001% of data points) and those greater than 200 W (0.4% of data points). Manual inspection of the data showed that values outside this range are most likely instances of data point corruption during the data collection process. The standard reason for missing data is that the power consumption has not varied—this is a characteristic of the Zooz sensors. This is most common when the power consumption is exactly 0, as any amount of power consumption above 0 typically has natural variation. Because data are reported at 1-min intervals and we aggregate to 15-min time steps, we fill forward missing values up to a limit of 15 min. This strategy is based on the assumption that these missing values really indicate a power consumption value of 0, but it also allows for the rare case that the power consumption is a steady positive value. If further data points are missing, it is most likely because of connectivity issues or a long period without power consumption. We fill these data points with values of 0.
We collected social and organizational data through a survey. The occupants of the building were first asked to report with whom in the building they have either a social or organizational relationship. The survey then moves on to two sections, a social weighting and an organizational weighting. The social section asks occupants to rate on a Likert scale (1–7) how closely they view their social relationship in terms of the “inclusion of the other in the self” scale (Gächter et al., Reference Gächter, Starmer and Tufano2015) (see Appendix B). The organizational component asks occupants to mark with whom they (a) share information with, (b) seek technical advice from, and (c) seek personal work-related advice from. These questions measure communication, advice, and trust, as discussed in seminal work by Krackhardt and Hanson (Reference Krackhardt and Hanson1993). The survey response rate was 83%. The survey forms a directed network—unlike the Interaction Model—but we note that the graph comparison tools we discuss below are valid for comparisons between directed and undirected networks. While interactions are best described without direction, individual views of relationships are inherently directed, and we note that this may be a limitation of the Interaction Model. Details of the survey are discussed in Appendix B.
An important component of the study is to determine the extent to which inferred socio-organizational network structures correlate with the survey socio-organizational structure. Because we define the networks in terms of an adjacency matrix, metrics that measure the correlation between two square matrices can be employed. It is well known in network analysis theory that standard ordinary least squares models are unreliable when autocorrelation is present in the data, as we expect in social network analysis (e.g., within-row and within-column data can be expected to be autocorrelated, since they refer to the same individuals’ survey responses) (Krackhardt, Reference Krackhardt1987). Therefore, we adopt the Quadratic Assignment Procedure (QAP) as a permutation test to determine the significance of correlations between two adjacency matrices. We use the Pearson product–moment correlation coefficient to measure the correlation between two matrices, with explicit disregard for the diagonals of the matrices, which we expect to all be zero, since self-loops are disregarded. This combination of the QAP permutation test and the Pearson product–moment correlation has been demonstrated in previous social network research (Henry, Reference Henry2011). The correlation for two graphs G and H is measured as follows:
 $$ \mathrm{cor}\left(\mathrm{G},\mathrm{H}\right)=\frac{\operatorname{cov}\left(\mathrm{G},\mathrm{H}\right)}{\sqrt{\operatorname{cov}\left(\mathrm{G},\mathrm{G}\right)\cdot \operatorname{cov}\left(\mathrm{H},\mathrm{H}\right)}}, $$
where
 $$ \mathrm{cov}\left(\mathrm{G},\mathrm{H}\right)=\frac{1}{{\left|\mathrm{V}\right|}^2-\left|\mathrm{V}\right|}\sum_{i\ne j}\left({\mathbf{A}}_{i,j}^{\mathrm{G}}-{\mu}_{\mathrm{G}}\right)\left({\mathbf{A}}_{i,j}^{\mathrm{H}}-{\mu}_{\mathrm{H}}\right), $$
such that i is not equal to j, where V is the set of nodes in the graph, A is the adjacency matrix, and μ is the mean edge value in the graph. The QAP permutes both the rows and columns of one of the adjacency matrices—a total of  $ \left|\mathrm{V}\right|! $ possible mappings of vertices to the edges in the network. The correlation metric can be calculated between the base matrix and all possible permutations of the second matrix, creating a distribution of correlation metrics. By determining where the original correlation falls on the permuted correlation distribution, one can estimate the significance of the correlation (i.e., what fraction of correlations fall below the calculated correlation). In our results discussed above, $ \left|\mathrm{V}\right| $ is 18, causing the number of samples for the correlation statistic to be 306 (i.e., the number of possible ties among individuals, excluding self-loops).
Over the course of the year, three changes happened to the organization occupying the office building, which we were made aware of through direct communication with the organization. After 61 days of data collection, one of the occupants left the organization temporarily. After 258 days, another occupant left the organization indefinitely. After 312 days, the occupant that first left the organization returned, and another third occupant left the organization indefinitely. We adapted the models we employ for network inference to account for these changes. For the Influence Model, we adjusted its mechanics to normalize for the amount of time that an occupant is part of the organization. For the occupants that were part of the organization for a fraction of the year, opportunities for interaction between that occupant and all other occupants were only considered during the times that these occupants were present. In effect, we compute a weighted average of all Jaccard similarities based on the amount of time two occupants were both a part of the organization. This reshuffling created four distinct periods of data collection and analysis that are all very similar but have slightly different organizational makeup.
For example, if all occupants are considered members during the days contained in a vector d1 and all but one (occupant x) are considered members during the days in d2, we compute two different adjacency matrices, following the procedure in Algorithm 1:
 $$ {\mathbf{A}}_1=\mathrm{Interaction}\left({\mathbf{S}}_{d\in {\mathbf{d}}_1}\right), $$
 $$ {\mathbf{A}}_2=\mathrm{Interaction}\left({\mathbf{S}}_{d\in {\mathbf{d}}_2}\right). $$
Next, instead of simply averaging all A matrices, we compute the overall adjacency matrix as follows:
 $$ \mathbf{A}=\frac{{\mathbf{A}}_1+{\mathbf{A}}_2}{\mid {\mathbf{d}}_1\mid +\mid {\mathbf{d}}_2\mid}\forall i\ne x,\forall j\ne x $$
 $$ \mathbf{A}=\frac{{\mathbf{A}}_1}{\mid {\mathbf{d}}_1\mid}\forall i=x,\forall j=x $$
2.4. Space syntax
The theory of space syntax (Bafna, Reference Bafna2003) suggests that the ordering of space impacts how people use space and interact with one another. Recently, researchers have suggested that spatial relationships are correlated with social behavior, such as collaborations in academic settings and “contacts” in workplaces (Sailer and McCulloh, Reference Sailer and McCulloh2012; Potter et al., Reference Potter, Smieszek and Sailer2015). Using a space syntax technique known as axial line decomposition, we constructed networks of the office space in Berkeley, CA, describing both topological distance and angular distance. The topological distance can be interpreted as the number of individual spaces that need to be traversed between workstations, and the angular distance can be interpreted as the amount of physical rotation required to reach a workstation. The space syntax procedure begins with graphically representing the physical barriers within a building in a floor plan. We adopted the axial line decomposition procedure for the spaces that include a workstation in our study. This axial line decomposition procedure begins with the drawing of straight lines that connect all relevant spaces within a building’s floor plan. We note that in certain floor plans with limited barriers, such as long open plan offices, the axial line decomposition technique may have limited ability to explain connections between spaces, though previous research has applied this technique to open plan offices (Sailer and McCulloh, Reference Sailer and McCulloh2012). The topological distance between two workstations is defined as the number of line segments that are traversed by traveling from one workstation to another, where a line segment is created whenever two of these lines intersect. The angular distance is defined as the amount of changing of direction that must take place to travel from one desk to another along these lines, where a 90° turn is counted as a value of 1. The specific axial line decomposition for the office building in Berkeley, CA, used in this study is shown in Figure 4. Leveraging the QAP test described above, we can compare these spatial networks to the inferred and survey-based socio-organizational networks.
Axial line decomposition using space syntax methodology. The floor plan shows the physical spatial barriers, red lines show the line segments connecting individual spaces. The detailed example for workstations 1 and 2 shows the calculation of topological and angular depths.

3. Results
3.1. Performance of Interaction Model
Figure 5 shows the calculated correlations between the combined survey network (Asurvey) and each of the three networks inferred with the Graphical Lasso (Aglasso) (Friedman et al., Reference Friedman, Hastie and Tibshirani2008), the Influence Model (Ainfluence), and our proposed Interaction Model (Ainteraction), where the correlation is shown on the reconstructed distribution as calculated through the QAP permutation test. For even a moderately sized graph with 18 vertices, computing the full distribution of graph correlations through permutation is computationally prohibitive; we therefore employ Monte Carlo simulation with 10,000 repetitions to estimate the distribution. We can see from Figure 5 that only the Interaction Model produces a significant correlation at 0.46 with an estimated p value from the permutation test of 0.002. Figure 6 shows the overall correlation matrix (upper half) between each of the three learned networks and each component of the survey network, including the combined organizational survey network and the overall survey network. Each entry in the matrix shows the correlation between the graphs denoted along the diagonal. We note that the Interaction Model has similar correlations with each component of the survey network, with no specific component having much larger or much smaller correlations with the Interaction Model than the overall survey network.
Inferred network visualization and statistical results. Network visualization for each of the three network inference methods, along with Pearson product–moment correlation with the survey network over the distribution from the QAP test. Vertical lines on the distributions indicate the measured correlations. Comparing these measured correlations to the distribution enables the estimation of the p values for these correlations (Graphical Lasso: p = 0.68; Influence Model: p = 0.12; Interaction Model: p = 0.002). Note: A threshold is applied to tie strengths in each graph for visualization purposes.

Correlations among inferred and survey networks. Correlogram showing Pearson product–moment correlations between the three inferred networks, each component of the organizational survey network, and the social and organizational survey networks.

The correlations and estimated significance levels (Figures 5 and 6) offer strong supporting evidence for the relative success of the Interaction Model in capturing office worker relationships as compared to the Graphical Lasso and the Influence Model. The overall survey network is based on social and organizational weights, where the social weighting is based on one survey question, and the organizational weighted is based on three. There are therefore four individual components of the overall survey network. While the Interaction Model has relatively similar correlations with all of these individual components, the correlations are highest for the trust component of the organizational survey network and for the social survey network. Among the organizational components of the survey network, the communication and advice networks have lower correlations, perhaps due to the fact that these networks have higher graph densities (0.70 and 0.54, respectively) compared with the trust graph (0.42). In other words, each occupant communicates with and seeks advice from most of his or her colleagues, while seeking trust is more selective. The more fully connected communication and advice networks would not be expected to correlate as well with the inferred networks because there is less differentiation and social choice among their ties.
3.2. Temporal analysis of Interaction Model
One strength of the Interaction Model is that its key building blocks—opportunities for social interaction—are assigned to individual time steps, allowing our analysis to capture the temporal dimension of office worker interactions. The model estimates times at which any two occupants have stepped away from their workstations and defines these instances as opportunities for social interaction. Figure 7a shows the distribution of total overlaps in social opportunity aggregated across all days for the average occupant, plus or minus one standard deviation calculated across occupants. We can see from this figure that there is a large spike between 12 pm and 2 pm, which is likely to be the standard time for lunch in this particular office. Figure 7b shows these opportunities for interaction by day, where we see a similar lunchtime spike for each day. However, there is also a large peak on Monday near 10 am. Based on knowledge of the operations of this organization, we note that there is a large meeting involving all members of the organization at this time. This serves as observational validation that the Interaction Model is in fact capturing opportunities for interaction.
Frequency of opportunities for social interaction over 24 hr, aggregated over data collection period. Lines represent the average across individuals and shading shows one standard deviation across individuals. (a) All opportunities for interaction for all ties. (b) Comparison of interaction opportunities by day of the week. (c) Comparison of interaction opportunities for each occupant’s strongest social ties and strongest organizational ties, as defined by the survey network.

Because the survey network is comprised of both social and organizational ties, a natural question is to ask whether one can differentiate between these ties through more detailed analysis. We therefore sought to characterize, leveraging the survey results, whether social ties or organizational ties are more likely to manifest themselves at different times of the day (e.g., Do people eat lunch with their friends? Do they meet with their work ties in the morning?). Figure 7c shows the temporal distribution of opportunities for social interaction of two different kinds of true ties defined by the survey network—the strongest social tie for each occupant and the strong organizational tie for each occupant. This breakdown between ties shows that overall trends are very similar for these two relationships, but we note two points of interest. First, the standard deviation of interaction opportunities is higher for social ties than for organizational ties around lunch time, suggesting that there are some pairs of occupants with social ties that have many interactions around lunch time. Second, there seems to be a larger count of interaction opportunities outside of lunch time for organizational ties, though the increase over the social ties is within the standard deviations.
3.3. How much data are needed for the Interaction Model?
One question that any inference built on time series raises is the length of time required to build a successful model. In order to test this, we created 52 batches of the data based on timestamps (i.e., batch 1 contained the first week of the data, batch 2 the second week, etc.). We first applied the Interaction Model to growing amounts of the data (i.e., the first week, then the first 2 weeks, and so on) and calculated the correlation between that network and the survey network. Figure 8 shows how the graph correlation varies over time as the data grow (black line). As a result of three minor organizational changes (i.e., occupants temporarily or permanently leaving the organization), there are four distinct data segments (see Section 2). After roughly 10 weeks (20% of the year), the increase in correlation experiences significant diminishing returns.
Graph correlation over time. Each shift in data segments refers to a small change in the organizational structure (i.e., an occupant leaving the organization or returning to the organization).

Each of the points on the black line in Figure 8 use a starting point of week 1. To investigate the impact of when data collection begins, we also applied the Interaction Model to 10 weeks of data (the threshold determined above) using different starting times (gray lines). These lines also show the evolution of the correlation as the data grow (e.g., for the furthest left gray line, week 10, then weeks 10 and 11, etc.). None of the three starting times produced a graph correlation as high as the original starting time, indicating that true social ties may have changed as a result of organizational changes or other time effects.
3.4. Relating spatial and organizational networks
Figure 9 shows the Pearson product–moment correlations among the topological spatial network, the angular spatial network, the network inferred through the Interaction Model, and the overall survey network. The correlations between the space syntax networks and both the Interaction Model and the survey network are negative. We would expect this negative correlation, since a larger distance between occupants’ workstations has been shown to inhibit communication and interaction (Sailer and McCulloh, Reference Sailer and McCulloh2012). However, these correlations are all insignificant. The lack of a strong correlation between the spatial layout of the building and the interactions among occupants as well as the true socio-organizational relationships is surprising but suggests that there is an opportunity to design the layout of the building in such a way that actually promotes collaboration. For example, if a new layout were chosen such that the distances between desks were perfectly negatively correlated with the true organizational structure, the new layout might promote more meaningful interactions in space. This result demonstrates the ability for the Interaction Model to play a role in the design of buildings for organizational objectives.
Correlations between spatial, inferred, and survey networks. The topological and angular networks, inferred through two space syntax methods, describe the spatial relationships between each pair of workstations. The Interaction Model and survey networks describe socio-organizational relationships for the individuals associated with each workstation.

4. Discussion
Our results suggest that it is possible to capture a significant component of the true socio-organizational structure of organizations in buildings by analyzing sensors signaling occupant behavior. Methods adapted from the literature—the Graphical Lasso and the Influence Model—were limited in their abilities to reconstruct the true socio-organizational structure of office workers. Each of these methods may suffer from limitations in the model construction. The Graphical Lasso was designed to measure correlations in raw time series. However, the noise in the raw plug load energy data warranted the need to abstract the data into states of activities in order to enable analysis of true patterns of space use, and therefore the noise may have impacted the Graphical Lasso’s efficacy. The Influence Model does explicitly incorporate latent states in its modeling approach (in our case, activity states), but it was originally designed for nonsocial systems (e.g., power grids) where interactions can be defined by physical laws. In our case, manifestations of relationships among people can be characterized as impromptu and unstructured, which are details we sought to address in our modeling approach. Our proposed method—the Interaction Model—performed significantly well. We theorize the model is successful because it is built on the knowledge gained by analyzing occupants’ uses of their individual spaces. The underlying data from plug load sensors installed at the desk level, when abstracted to states of occupants’ activities, offer rich insight into use of space. These insights enable the analysis of opportunities for social interactions that are the foundation of our network inference strategy. We note that the specific strategies implemented in our research could be extended to use other sources of raw data that can be used to model occupancy, such as infrared or lidar sensors.
We demonstrate in a case study that about 10 weeks of data collection was sufficient to create a network that is significantly similar to the network obtained through traditional survey instruments. After 10 weeks, the model experienced substantial diminishing returns. This behavior could arise from a few different reasons. One set of possibilities concerns the fact that we distributed the survey very near the time that we started collecting data. It is possible that the true network changed after the first organizational change (shift from data segment 1 to data segment 2 in Figure 8), and therefore the survey network no longer represented the true network. In this case, any additional information collected through the data would be biased toward the original network structure as represented in the survey network. It is also possible that the network changed continuously over the course of the year, and as a result, occupants’ behavior changed as well. In this case, the network inferred with enough data closest to the time that people reported ties would be most accurate. On the other hand, it is possible that the act of distributing the survey caused occupants to become more conscious of their social behavior and therefore interact more with the people they reported ties with. This kind of behavior change as a result of an external trigger—the “mere-measurement effect”—has been documented in previous social network studies (Sprott et al., Reference Sprott, Spangenberg, Block, Fitzsimons, Morwitz and Williams2006). Our additional analysis of running the Interaction Model using different start dates shows that using later start dates reduces the correlation between the survey network and the Interaction Model network. This finding aligns with the notion that the inferred network correlates best with the survey network when the data are analyzed closest to the time that the survey is distributed.
While the Interaction Model did experience diminishing returns, it was able to reconstruct a significant component of the survey network. This success points to substantial opportunities to leverage low-cost, ubiquitous ambient sensing technologies for the study of organizational networks present in office spaces. Researchers studying social networks and organizational design have noted the importance of understanding network structures due to their impact on organizational outcomes related to the broad notion of productivity, such as creativity and collaboration (Uzzi and Spiro, Reference Uzzi and Spiro2005; Perry-Smith and Mannucci, Reference Perry-Smith and Mannucci2017). Our findings demonstrate that socio-organizational networks can effectively be mined from data. As a result, the potential for network analysis in organizations can be extended to situations previously not possible due to the cost and time of survey-based network construction, such as large organizations occupying large buildings or building campuses. Abstractions of the ambient sensing data will also enable further analysis of network effects using inherently anonymous data that do not contain personally identifiable information beyond the desk location. While the desk location could be traced to an individual if seat assignments are known, the underlying power consumption data are an inherent level of abstraction away from individual actions. This ambient approach to modeling of human systems, as opposed to direct observation of actions, is an important aspect given new laws and protocols surrounding data privacy (e.g., GPDR; Regulation (EU) 2016/679 of the European Parliament and of the Council of 27 April 2016 on the Protection of Natural Persons with Regard to the Processing of Personal Data and on the Free Movement of Such Data, and Repealing Directive 95/46/EC (GDPR), 2016).
We additionally show that in the context of the space analyzed in our case study, the spatial layout was not significantly correlated with the true structure of the organization, suggesting that a redesign of the layout could enhance interaction and improve collaboration among the members of the organization. Researchers studying the relationship between space and organizations have linked space to the nexus between networks and organizational outcomes, typically showing that spatial proximity increases the likelihood for relational tie formation and the positive outcomes associated with these ties (Sailer and McCulloh, Reference Sailer and McCulloh2012). The tools presented in this paper offer an opportunity to test these previously formulated hypotheses at further scale. Additionally, when it comes to redesigning the spatial layout of organizations, the ability to quickly and continuously measure the social network—as our research enables—will allow network structure to become an attainable and important input into this design process. Future work can incorporate network structure into the design of space itself, as engineers and designers continue researching methods for optimizing spatial layouts through generative design (Nagy et al., Reference Nagy, Lau, Locke, Stoddart, Villaggi, Wang, Zhao and Benjamin2017). Moreover, as spaces become more flexible, the ability to capture a social network through analysis of data collected over a period of 10 weeks will create the opportunity to dynamically design building layouts in an effort to enhance collaboration. This dynamic model of building and space design will become increasingly important given the rise of new office space procurement models such as co-working spaces and shared common areas.
One important limitation of the Interaction Model concerns the notion of opportunities for social interaction. There are many occasions that might result in two occupants being in a state of possible social interaction as defined above, such as two occupants taking separate trips to different break rooms. While some of these occasions could be unrelated to meaningful interactions, we assume that repeated instances of mutual opportunity for interaction would outweigh spurious instances of similar activity patterns. In our analysis of the amount of data required for our model to be successful, we see that the performance of the Interaction Model steadily improves over the first 10 weeks, which supports the notion of the importance of repeated interactions. In a larger building, this limitation could also be addressed by including a spatial weighting that discounts possible interactions that would be physically infeasible. Another limitation concerns the notion of distributing a survey as a means of measuring the “ground truth” as closely as possible. We note that while research has demonstrated the shortcomings of surveys particularly with regard to the problems of self-reporting information (Marsden, Reference Marsden, Carrington, Scott and Wasserman2012), surveys remain the standard method for measuring social network structure. Finally, we note that the Interaction Model produces an undirected network, while the individual responses from the survey are directed because they represent each occupant’s individual perceptions of the relationship. While physical interactions can best be described in an undirected manner, certain aspects of social relationships (e.g., individual perceptions of friendships, amount of advice given vs. received) can be viewed as directed. We note, however, that many tools common in social network analysis, such as community detection or graph clustering, are traditionally applied to undirected networks (Malliaros and Vazirgiannis, Reference Malliaros and Vazirgiannis2013). Therefore, the information embedded in the undirected network retains much of the needed information for decision-making based on socio-organizational relationships. Future work could extend our proposed Interaction Model to provide more detailed insights into social relationships within an office space and enable more targeted interventions related to the directionality of communication and/or information flows.
Overall, our results show that the Interaction Model is successful in reconstructing a significant component of the true socio-organizational network. Inferring this network can be useful for analyzing the design of the space (e.g., using space syntax) in the context of the socio-organizational system. Information on the structure of the organizations in commercial buildings will enable the design and management of spaces that promote organizational success. In particular, managers of organizations will be able to better understand which occupants and/or relationships are vital to organizational operations. At the same time, managers of building spaces can use the information to make ad hoc changes to building designs, such as removal of barriers or changes to occupant layouts—changes that can be used to better align the social and spatial networks. While it may not be feasible to continuously rearrange office spaces based on insights garnered from our proposed methods, our work could be the basis for more strategic (e.g., quarterly) reviews of how spaces are being used and how occupant layouts are encouraging or limiting social interactions. Overall, our methods aim to enable a new dynamic perspective of organizational decision-making at the socio-organizational-spatial nexus, whereby offices can be critically analyzed and changed to improve performance.
5. Conclusion
The Interaction Model introduced in this paper enables passive measurement of network structure using ambient sensors that are growing in popularity in commercial buildings. Through statistical tests, we show that this network inference strategy learns a network with significant correlation to the ties reported through distribution of a survey. In our case study, we find that roughly 10 weeks of data are required to learn the network with the ambient sensing data. This relatively short data collection period can enable dynamic measurement of occupant networks as organizations evolve and spaces change. We also demonstrate that learning this network enables the analysis of the spatial design of buildings in the context of their human systems. In particular, comparing the learned social network to spatial networks as defined by the space syntax literature creates insight into whether the spatial layout matches socio-organizational behavior. In the case study presented in this paper, we found no significant correlation with the spatial networks, demonstrating the opportunity to design the space in a way that better reflects the socio-organizational network. The Interaction Model can therefore become a significant component of a design strategy that promotes human-centered organizational objectives such as collaboration. The model and analyses introduced here will promote the design, engineering, and management of buildings in a way that allows human and built systems to work together.
Acknowledgments
We would like to thank Amir Goldberg for his invaluable comments during analysis and manuscript preparation.
Funding Statement
The research presented in this paper was supported by a Stanford Graduate Fellowship, the Center for Integrated Facility Engineering, a Terman Faculty Fellowship, and the National Science Foundation (NSF) under Grant Nos. 1836995 and 1941695. Any opinions, findings, and conclusions or recommendations expressed in this material are those of the author(s) and do not necessarily reflect the views of NSF.
Competing Interests
The authors declare no competing interests exist.
Data Availability Statement
The data collected and analyzed for this study and the code used for analysis are available in the “learning-occupant-network” repository at doi: 10.5281/zenodo.4033406.
Author Contributions
Conceptualization, A.J.S and R.K.J.; Methodology, A.J.S. and R.K.J.; Data curation, A.J.S.; Software, A.J.S.; Data visualisation, A.J.S.; Writing-original draft, A.J.S.; Writing-review & editing, R.K.J.; Supervision, R.K.J. All authors approved the final submitted draft.
Appendix A: Mapping raw sensor data to activity states
We define the raw data as Xi,d = {x 1,…, xT} where i is the occupant index (for all occupants 1,…, I), d is the day index (for all days 1,…, D), and T is the number of time steps in a day. For each observation xt ∈ Xi,d, we introduce a latent variable zi comprising a 1-of-K binary vector with elements zt,k for k = 1,…, K. Given the set of weights for each component k, which we refer to as ϕ, we write the conditional distribution of Z as follows:
 $$ p\left(\mathbf{Z}|\boldsymbol{\phi} \right)=\prod_{t=1}^T\prod_{k=1}^K{\phi}_k^{z_{t,k}}, $$
The conditional distribution of the observed plug load data can therefore be written as follows, given the latent variables and component weights:
 $$ p\left(\mathbf{X}|\mathbf{Z},\boldsymbol{\mu}, \boldsymbol{\Lambda} \right)=\prod_{t=1}^T\prod_{k=1}^K\mathcal{N}{\left({x}_t|{\mu}_k,{\Lambda}_k^{-1}\right)}^{z_{tk}}, $$
where μ is the set of component means and Λ is the set of component precisions (defined as the inverse of the standard deviations). Following standard Bayesian statistical practices, we use a Dirichlet distribution prior over the mixing coefficients, and a Gaussian-Wishart prior over the mean and precision of each component. One of the key outputs of fitting this model is the number of components in ϕ that are nonzero. The resulting nonzero distributions are then used to cluster the data.
As discussed in (Sonta et al., Reference Sonta, Simmons and Jain2018), we use a two-step process for finding the number of components. If the initial clustering of the data results in two components, we separate out the higher-energy data and rerun the clustering algorithm. Our rationale for doing this is based on our domain knowledge of occupant behavior and plug load data—the higher energy data have high variability and are likely to represent multiple states of activity. Consistent with previous results, the model output is most commonly two components for the initial clustering and two components for the secondary clustering. We therefore apply this two-step two-component clustering to the data in this study. The result is a mapping X ➔ S, where  $ {s}_{i,d}^t\in \left\{1,2,3\right\} $—the three possible energy states.
We refer to these three activity states as low energy, medium energy, and high energy. For example, higher energy use values map to high-energy activity states, which correspond to occupants actively using their workstations. Similarly, a medium-energy activity state is likely to signify that some equipment has entered a power-saving mode without fully turning off. Past work has shown that this mapping of the ambient plug load data to occupant activity states constitutes an occupancy sensing strategy at least as accurate as other state-of-the-art sensing strategies, such as infrared sensors. An added advantage of the activity state strategy is that it offers additional information beyond presence/absence in that it describes the state of interaction with the workstation (e.g., a high-energy activity state suggests full interaction with the workstation equipment). This additional information becomes useful for analyzing possibilities of social behavior in buildings, as discussed in the main text.
Appendix B: Survey for collecting social and organizational data
To benchmark all three inferred networks, we conducted a survey using questions from the social science literature that have been shown to measure social and organizational ties well. While no survey question is perfect, the questions used here were chosen due to their success demonstrated in other studies (Krackhardt and Hanson, Reference Krackhardt and Hanson1993; Gächter et al., Reference Gächter, Starmer and Tufano2015). At the beginning of the survey, respondents were asked to note with whom they had a personal relationship, a working relationship, or both from a list of all other occupants in the building. For each person identified, the respondents then were asked about both these personal (social) and working (organizational) relationships, as discussed below. The overall survey network is computed as an equally weighted sum of the normalized social and organizational networks:
 $$ {\mathbf{A}}^{\ast }={\mathbf{A}}^{\ast \mathrm{social}\_\operatorname{norm}}+{\mathbf{A}}^{\ast \mathrm{org}}. $$
 We measured social ties using the “inclusion of the other in the self” scale as discussed in (Gächter et al., Reference Gächter, Starmer and Tufano2015). This survey question makes use of the image shown in Figure B1, which creates a Likert scale between 1 and 7, where larger values indicate closer personal relationships. A key benefit of this particular survey question is that it was designed to be easily understood very quickly and specifically to measure personal (social) relationships. Occupant i’s response about occupant j becomes the entry  $ {\mathbf{A}}_{i,j}^{\ast \mathrm{social}} $ in the social survey network. Because each occupant might interpret each value in the scale differently, we normalize the social survey network by row, where the normalized entry is calculated as follows:
 $$ {\mathbf{A}}_{i,j}^{\ast \mathrm{social}\_\operatorname{norm}}=\frac{{\mathbf{A}}_{i,j}^{\ast \mathrm{social}}}{\max \left({\mathbf{A}}_i\right)}. $$
Inclusion of the other in the self-scale (adapted from Gächter et al. (Reference Gächter, Starmer and Tufano2015)). This figure was included in a survey sent to study participants as a measure of social relationships, with “7” being the closest social relationship.

We measured organizational ties as first suggested in Krackhardt and Hanson’s seminal paper about the complexity of organizations (Krackhardt and Hanson, Reference Krackhardt and Hanson1993). Specifically, for each occupant the respondent identified at the beginning of the survey, we asked the respondent the following three questions:
1. Communication: Have you received information at least twice in the last month from this person?
2. Advice: Have you received technical advice at least twice in the last month from this person?
3. Trust: Have you received personal work–related advice at least twice last year from this person?
To construct each component of the organizational network, occupant i’s response about occupant j becomes the following entries:  $ {\mathbf{A}}_{i,j}^{\ast \mathrm{communication}} $, $ {\mathbf{A}}_{i,j}^{\ast \mathrm{advice}} $, and $ {\mathbf{A}}_{i,j}^{\ast \mathrm{trust}} $. The overall survey network is then created as an equally weighted average of these three components:
 $$ {\mathbf{A}}^{\ast \mathrm{org}}=\frac{{\mathbf{A}}^{\ast \mathrm{communication}}+{\mathbf{A}}^{\ast \mathrm{advice}}+{\mathbf{A}}^{\ast \mathrm{trust}}}{3}. $$


 Open access
Comments
No Comments have been published for this article.