


Management Implications
Knowing the vernalization requirement for Alliaria petiolata (garlic mustard) rosettes can help us predict the potential range of A. petiolata in North America. We can also better predict the potential range limits of novel biological control insects of garlic mustard before their introduction into North America. If A. petiolata rosettes in a region do not accumulate the required minimum chilling degree days, they will not flower the following spring. As a biennial, A. petiolata only reproduces via seed, so if rosettes do not flower, they will fail to create or sustain invading populations. Biological control insects under consideration for release require A. petiolata plants to feed and develop. If winters are too mild for A. petiolata to flower and set seed, then populations of biocontrol insects will fail to establish. As a result, any spillover feeding onto non-target native Brassicaceae would not be possible.
Introduction
Garlic mustard [Alliaria petiolata (M. Bieb.) Cavara & Grande], an invasive species in the family Brassicaceae, is native to Europe. It is one of the few introduced biennial species to invade and dominate the understory of temperate forested areas in North America. Sites dominated by A. petiolata frequently have lower native herbaceous richness and cover (Anderson et al. Reference Anderson, Dhillion and Kelley1996; McCarthy Reference McCarthy1997; White et al. Reference White, Haber and Keddy1993). In North America, A. petiolata has been reported in 38 U.S. states and 6 Canadian provinces (USDA-NRCS 2022) and has the potential for wider distribution (Merow et al. Reference Merow, Bois, Allen, Xie and Silander2017; Peterson et al. Reference Peterson, Papes and Kluza2003; Reinhardt et al. Reference Reinhardt, Russell, Senay and Lazarus2020; Welk et al. Reference Welk, Schurbert and Hoffmann2002). Alliaria petiolata is listed as a noxious weed in eight U.S. states (USDA-NRCS 2022).
Alliaria petiolata Life History
Alliaria petiolata is an obligate biennial (Anderson et al. Reference Anderson, Dhillion and Kelley1996; Byers and Quinn Reference Byers and Quinn1998; Meekins and McCarthy Reference Meekins and McCarthy2002). Dormant A. petiolata seeds require a stratification period of 60 to 150 chilling degree days (CDD) to germinate (Footitt et al. Reference Footitt, Huang, Olcer-Footitt, Clay and Finch-Savage2018). Seedlings germinate early in spring of the first year and can form a dense carpet of seedlings before tree canopy closure (Cavers et al. Reference Cavers, Heagy and Kokron1979; Meekins and McCarthy Reference Meekins and McCarthy2002). In early summer, seedlings develop into rosettes characteristic of first-year plants. Each generation lives approximately 15 mo, and the juvenile and adult cohorts co-occur for approximately 3 mo (April to June).
Rosettes continue to produce new leaves throughout fall and into winter during snow-free periods when temperatures are above freezing (Anderson et al. Reference Anderson, Dhillion and Kelley1996; Cavers et al. Reference Cavers, Heagy and Kokron1979; Heberling et al. Reference Heberling, Cassidy, Fridley and Kalisz2019). During winter months, rosettes are exposed to cold temperatures to satisfy the vernalization requirement necessary for flowering in obligate biennials (Amasino Reference Amasino2010). Overwintered, second-year rosettes bolt and flower early in the growing season, usually from April through June, depending upon the location (Cavers et al. Reference Cavers, Heagy and Kokron1979), which allows A. petiolata rosettes to maximize soil nutrients and light while native species are still dormant, before tree canopy closure (Engelhardt and Anderson Reference Engelhardt and Anderson2011; Heberling Reference Heberling, Cassidy, Fridley and Kalisz2019; Meekins and McCarthy Reference Meekins and McCarthy2002). This phenological pattern enables A. petiolata rosettes to displace spring ephemerals, tree seedlings, and other native plants (Bialic-Murphy et al. Reference Bialic-Murphy, Brouwer and Kalisz2020; Stinson et al. Reference Stinson, Kaufman, Durbin and Lowenstein2007). Alliaria petiolata rosettes maximize photosynthate accumulation in both spring and fall, which makes them unique among herbaceous invasive plants in forest ecosystems (Heberling et al. Reference Heberling, Cassidy, Fridley and Kalisz2019).
As obligate biennials, A. petiolata rosettes must also receive a cold period of sufficient duration during the winter to develop the capacity to bolt and flower the following spring (Chouard Reference Chouard1960; Michaels and Amasino Reference Michaels and Amasino2000; Sung and Amasino Reference Sung and Amasino2005). As such, mild winter temperatures could limit the southern and western distribution of A. petiolata in North America. In tree species such as sugar maple (Acer saccharum Marshall), poplar (Populus deltoides W. Bartram ex Marshall), and Russian olive (Elaeagnus angustifolia L.), low winter temperatures limit vegetative bud break and seed germination and, subsequently, their southern range in North America (Guilbault et al. Reference Guilbault, Brown, Friedman and Shafroth2012; Morin et al. Reference Morin, Augspurger and Chuine2007). Similarly, knowing the CDD required for vernalization of A. petiolata would better predict its potential southern range of adaptation in North America.
Vernalization Requirement in Biennials
In some short-season perennials or biennials, there is a north-to-south decline (in the Northern Hemisphere) in the duration of chilling required to satisfy the vernalization requirement (Heide and Snøsteby. Reference Heide and Snøsteby2007; Van Dijk et al. Reference Van Dijk, Boudry, McCombre and Vernet1997; Wesselingh et al. Reference Wesselingh, Klinkhamer, De Jong and Schlatmann1994). Northern populations of the biennials wild beet [Beta vulgaris L. ssp. maritima (L.) Arcang.] (Van Dijk et al. Reference Van Dijk, Boudry, McCombre and Vernet1997) and bull thistle [Cirsium vulgare (Savi) Ten.] (Wesselingh et al. Reference Wesselingh, Klinkhamer, De Jong and Schlatmann1994) require a longer vernalization period to flower, compared with populations from more southerly latitudes. However, the degree to which latitude may affect the vernalization requirement for A. petiolata is not known.
The base temperature for vernalization is the temperature below which plant physiological processes do not occur (Yang et al. Reference Yang, Logan and Coffey1995). Base temperatures can vary among different plant growth stages of a species and vary among species (Sung and Amasino Reference Sung and Amasino2005; Yang et al. Reference Yang, Logan and Coffey1995). Maximum temperatures are the highest temperatures that induce vernalization in a species (Wiebe Reference Wiebe1990). Temperatures that can promote flowering generally range from 1 to 7 C, with a cold period of 1- to 3-mo duration (Michaels and Amasino Reference Michaels and Amasino2000). For A. petiolata, Footitt et al. (Reference Footitt, Huang, Olcer-Footitt, Clay and Finch-Savage2018) report base and maximum temperatures of 0 and 5 C, respectively, to break seed dormancy for germination. The base and maximum temperatures required to induce flowering in A. petiolata are not known.
The objectives of this research were: (1) confirm whether A. petiolata rosettes require a chilling period to induce flowering; (2) define the base and upper temperatures that create the temperature range necessary to induce flowering in A. petiolata rosettes under field conditions; (3) if a chilling period is required for flowering, determine the CDD accumulated during the necessary cold period; and (4) in a common garden experiment, determine the CDD required to induce flowering in A. petiolata collected from the southern and northern ranges of its distribution in North America and Europe. This will be a first step toward defining whether latitude influences the vernalization requirement in A. petiolata. Characterizing the chilling requirement of A. petiolata rosettes will help define the species’ southern and western ranges in North America. Additionally, this information can be used to predict the potential for overlap of A. petiolata with endangered and threatened plant species and help to define the ecological host range of potential biocontrol insects.
Materials and Methods
Collection of Alliaria petiolata Seeds
Alliaria petiolata seeds were collected from three U.S. sites, ranging from the northern United States, near St Paul, MN (Minnesota seed source), to its southerly range, near Fayetteville, AR (Arkansas seed source). Alliaria petiolata seeds were also collected from a third site in Ohio (Ohio seed source) (Table 1). Seeds were also collected from a site in northern Scotland and Croatia. All seeds were collected in the summer of 2017. The latitudes of the collection sites range from 58°N (Scotland site) to 36°N (Arkansas site). Seeds were collected from A. petiolata populations growing in wooded sites or at the edges of wooded areas. All seeds were collected from a minimum of 15 to 20 plants within a population, hand harvested from plants when mature, and consolidated into a composite sample for each site. Seeds were stored at 4 C.
Alliaria petiolata seed source locations used in vernalization study conducted at the University of Minnesota, St Paul, MN, 2019–2021.

Propagation of Alliaria petiolata Rosettes
Alliaria petiolata seeds require cold stratification to break dormancy (Baskin and Baskin Reference Baskin and Baskin1992). We used two methods to stratify seeds in the fall of 2018 and 2019. The first method, field stratification, consisted of planting seeds in plug trays filled with a standard commercial potting mix (LC8; 70% to 80% Canadian sphagnum peat moss, 20% to 25% perlite, 5% to 10% vermiculite; Sun Gro Horticulture, 770 Silver Street, Agawam, MA 01001). Trays were placed outside in November in Saint Paul, MN, and lightly mulched with straw to overwinter. Mulch was removed in early spring (April in Minnesota) when seedlings emerged. In case field stratification failed, A. petiolata seeds were also stratified in the lab by adding moistened sand to a 90-mm diameter by 15-mm deep plastic petri dish, adding a layer of seeds, and then covering the seeds with additional moist sand. Petri dishes were sealed and placed in a refrigerator at 4 C. After 4 mo, seeds were removed and planted in a plug tray filled with the standard potting mix as described previously. In the 2020 experiment, seeds were only stratified with the petri dish method, because seeds did not germinate well with the field stratification method used for the 2019 trial.
In the spring of 2019 and 2020, all A. petiolata seedlings were transplanted outdoors into 3.8-L pots using a greenhouse soil (silt loam:sand:manure:peat at a 1:1:1:1 v/v/v/v ratio). Plants were fertilized with a slow-release fertilizer containing macro- and micronutrients (Osmocote® Plus, 15-9-12 plus micronutrients; Scotts, 14111 Scottslawn Road, Marysville, OH 43040) at the recommended rate. Plants were propagated and experiments were conducted at the University of Minnesota, St Paul Field Station (44.9902°N, 93.1824°W; elevation: 296 m).
Vernalization Trials
In previous studies, A. petiolata plants grown outside at the University of Minnesota Field Station were infected with two viruses transmitted by aphids, and one by nematodes, as identified by University of Minnesota virologist B. E. Lockhart (personal communication). For this reason, potted A. petiolata plants were moved to an isolated area and grown on greenhouse benches placed outside under natural shade (approximately 50% shade). Plants were treated with a systemic insecticide at the recommended rate. In 2020, rosettes were also reared inside large screen cages placed outside on the greenhouse benches as an additional step to prevent aphid-vectored virus transmission (Katovich et al. Reference Katovich, Becker, Gerber, Hinz and Cortat2019).
To conduct chilling trials, in late August of 2019 and 2020, A. petiolata plants were moved to raised beds lined with landscape cloth and filled with peat moss. Pots were placed in the raised beds so that potted rosettes could survive fall and winter conditions necessary for vernalization. In 2020, screen cages were also placed over the plants until the end of September to prevent any aphid-vectored virus transmission.
We measured air temperatures for CDD calculations, because soil temperatures are not as readily available on climate data portals and this approach will allow for easier comparisons of CDD from other locations. A temperature probe (Tidbit V2 Temperature Logger, Onset Computer, 470 MacArthur Boulevard, Bourne, MA 02532) was hung in a radiation shield (Davis Instrument, 3465 Diablo Avenue, Hayward, CA 94545). The radiation shield was mounted on a pole and placed over sod approximately 1.2 m from the ground. The shield was placed near the raised beds in an area with no tree canopy cover. Temperatures were recorded every hour, beginning on August 31 in 2019 and 2020. Because a screened cage was added to the chilling-treatment raised beds in 2020, an additional temperature logger was suspended from the inside top of the cage to monitor the temperatures over the raised beds. The in-cage temperatures were used for temperature monitoring until the screen cages were removed on September 28, 2020, when the potential for aphid exposure had passed.
To expose A. petiolata rosettes to different amounts of cold, potted rosettes were removed from the raised beds at weekly intervals for 10 wk, then placed into a heated greenhouse at spring/summer temperature of 18 C and a long-day photoperiod of 16 h of daylight to induce flowering (Wellensiek Reference Wellensiek1973). Beginning on September 30 in 2019 and 2020, five randomly selected plants (five replications) grown from seed from the Minnesota, Ohio, and Croatia locations were removed from the raised beds and placed in the greenhouse. Time from removal from raised beds until placement into the greenhouse was approximately 30 min. Because the germination rate of seeds sourced from Scotland was low, we had fewer plants available to test, and as such, began moving those rosettes into the greenhouse later in the season, beginning on October 15, 2019, and October 28, 2020. In 2019 and 2020, there were four and five replications of the Scotland seed source, respectively. We suspected CDD was not sufficient to induce flowering in the first 2 wk of October but were less certain about later removal dates. In 2019, we also had fewer plants grown from seed from the Arkansas location, so plants were first removed from the chilling treatment on October 14 (five plants from Arkansas-sourced seeds). Once plants were in the greenhouse, the date when the first reproductive buds appeared was recorded for each plant. We defined flowering as when reproductive buds first appeared. Each plant was a replication. All flowering plants were rated 1, and non-flowering plants were rated 0.
Determination of Base and Upper Temperature Limits for Vernalization and Data Analysis
Our objective was to define the base and upper temperatures that create the temperature range to satisfy the vernalization requirement for A. petiolata under field conditions. We estimated the amount of chilling by calculating CDD using the formula derived from Footitt et al. (Reference Footitt, Huang, Olcer-Footitt, Clay and Finch-Savage2018) (Supplementary Material, Equation 1).
To determine the optimum base and upper temperatures for vernalization of A. petiolata rosettes, CDD were determined for all whole-number temperature combinations from −6 to 11 C. This upper and lower temperature range was based on findings in the literature for other plants (Michaels and Amasino Reference Michaels and Amasino2000), for A. petiolata seeds (Footitt et al. Reference Footitt, Huang, Olcer-Footitt, Clay and Finch-Savage2018), and our field observations. All CDD upper and lower temperature bands were analyzed with a logistic regression (Stata v. 16.1, StatCorp, 4905 Lakeway Drive, College Station, TX 77845). The binary flowering outcome, expressed in log-odds form (logit, or log of the odds ratio of flowering) (Supplementary Material, Equation 2), was regressed separately on CDD (the independent variable) for each upper and lower temperature band (Supplementary Material, Equation 3).
A comprehensive battery of goodness-of-fit tests (Supplementary Table 1 in the Supplementary Materials) was conducted on the output from each logistic regression of the flowering outcome by CDD for each temperature band. We visually examined the goodness-of-fit test outcomes and selected the whole-number temperature band that had the highest degree of concurrence among the tests for flowering when all locations and years were combined (Snyder et al. Reference Snyder, Spano, Cesaraccio and Duce1999). The probability of flowering at different CDD was then calculated (Supplementary Material, Equation 4), using the Predict command in Stata.
Probability of Flowering at Different CDD
Once the optimum base and upper temperature ranges were selected from temperature iterations, the calculated CDD were then used in binary logistic regressions for A. petiolata from each location (Supplementary Material, Equation 3). We used P-values of the chi-square statistic (at 0.05 level) to determine whether the null hypothesis, that there was no effect of CDD (the independent variable) on flowering (dependent variable), could be rejected. If the results were significant, the resulting equations generated for each location were then used to predict probability of flowering for accumulated CDD (Supplementary Material, Equation 4).
Locations were compared by conducting a logistic regression, using the optimal −4 to 3 C temperature range as determined in this study, controlling for location of A. petiolata seed source separately, and adding the other four populations as independent factor variables. We were then able to determine whether the effects of factor variables (locations) were significantly different. Finally, we calculated the odds ratios by exponentiating the coefficient estimates generated from the logistic regressions.
Results and Discussion
Meteorological Data
Minnesota has a temperate continental/humid continental climate with severe winters, hot summers, and strong seasonality, according to the Köppen-Geiger Climate Classification System (Peel et al. Reference Peel, Finlayson and McMahon2007). Mean maximum and minimum fall temperatures (September through November) are 14 and 4 C, respectively. Maximum and minimum winter temperatures (December through February) are −3 and −12 C, respectively. The median date for first fall freezing temperature ranges from October 9 to 12 (www.dnr.state.mn.us/climate/index.html). In general, 2020 had a cooler fall than 2019, with lower temperatures recorded earlier (Figure 1). In our field plots at the University of Minnesota Field Station, the first recorded ≤0 C temperature was on October 24 and 4 for 2019 and 2020, respectively.
Hourly air temperatures during the chilling degree day (CDD) trial in 2019 and 2020. St Paul, MN.

Base and Upper Temperatures
The base and maximum temperatures for A. petiolata vernalization were determined to be −3 and 4 C respectively, when both years and all seed source locations were combined. These results were different from the base and maximum temperatures of 0 to 5 C reported by Footitt et al. (Reference Footitt, Huang, Olcer-Footitt, Clay and Finch-Savage2018) for A. petiolata seed germination. However, base and maximum temperatures can vary among different stages of plant development within a species (Yang et al. Reference Yang, Logan and Coffey1995). Wiebe (Reference Wiebe1990) reported that crops in the Brassicaceae family have base temperatures around 0 C.
Probability of Flowering after Exposure of Alliaria petiolata Rosettes to Different Amounts of Chilling
The probability of flowering increased as A. petiolata rosettes accumulated CDD. This relationship is estimated from the binary flowering outcomes over time for years 2019 and 2020 combined, with base and maximum temperatures of −3 and 4 C, respectively (Figure 2). Flowering was dependent on CDD, with P-values (<0.05) of the chi-square statistic for the independent variable (CDD) in the regression model significant for all seed source locations and years combined (Figure 2).
Probability of flowering in Alliaria petiolata rosettes after exposure to different chilling degree days (CDD). CDD were calculated using base and maximum temperatures of −3 and 4 C, respectively. Rosettes were grown from seed sourced from three locations in the United States and two locations in Europe and were grown in a common garden in St Paul, MN, in 2019 and 2020. All locations across 2 yr of study were combined for analysis.

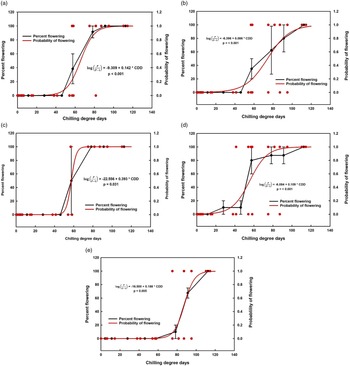
The regression equation model predicted that 68 and 120 CDD would result in a 50% and 99% probability of flowering, respectively, across all locations (Table 2). Probability of flowering varied among seed source populations (Table 2; Figure 3A–E) and P-values (<0.05) of the chi-square statistic for the independent variable (CDD) in the regression model were significant for all seed source locations (Figure 3A–E). Rosettes from the Scotland seed source required a greater number of CDD (88) to achieve 50% probability of flowering than rosettes from the other locations. Conversely, rosettes from the Croatia and Arkansas seed sources required fewer CDD (56 and 55, respectively) to achieve a 50% probability of flowering.
Probability of Alliaria petiolata rosettes flowering at different chilling degree days (CDD) for all seed source locations combined and for individual locations, St Paul, MN, 2020 and 2021.

a CDD calculated with base and maximum temperatures of −3 and 4 C, respectively.
b The Ohio-sourced Alliaria petiolata was slightly below ≥99%, a 97% probability of flowering at 120 CDD.
Black: Percent flowering of Alliaria petiolata rosettes grown from different seed sources in a common garden. Rosettes were exposed to different chilling degree days (CDD), then placed into spring conditions. Values represent mean percent flowering from 2019 and 2020 with mean standard errors. Red: Probability of flowering in A. petiolata rosettes after exposure to different CDD. For both plots, CDD were calculated using base and maximum temperatures of −3 and 4 C, respectively. Rosettes were grown from seed sourced from three locations in the United States and two locations in Europe, and were grown in a common garden at St Paul, MN, in 2019 and 2020. All locations across two years of study were combined for analysis. Seed source: (A) Minnesota; (B) Ohio; (C) Arkansas; (D) Croatia; (E) Scotland.

CDD Characterized the Onset of Flowering of Alliaria petiolata
A minimum number of CDD were required to induce flowering once rosettes were placed into spring temperatures and long-day photoperiods. If rosettes did not accumulate the minimum number of CDD, they failed to bolt and flower, remaining in the vegetative stage (Figure 3A–E). Similarly, other biennial species in the Brassicaceae family, such as cultivars of field mustard (Brassica campestris L.) and rapeseed (Brassica napus L.), remained in the vegetative stage if rosettes were not vernalized for a sufficient length of time (Hodgson Reference Hodgson1978).
We also documented the date when the first rosette from each location flowered, and this varied by seed source location (Table 3). The minimum CDD to induce flowering is of interest, because a single plant can self-pollinate, produce seed, and establish a new population (Anderson et al. Reference Anderson, Dhillion and Kelley1996; Cavers et al. Reference Cavers, Heagy and Kokron1979; Cruden et al. Reference Cruden, McClain and Shrivastava1996). Among all seed sources and across both years, the first rosette to flower was from the Croatia seed source, after exposure to 41.3 CDD in 2020 (Table 3). Rosettes from the Scotland seed source flowered after exposure to 95.1 CDD in 2020, requiring the most CDD to flower (Table 3).
Minimum chilling degree days (CDD) required for first rosette to flower among Alliaria petiolata rosettes from seeds sourced from different locations. a

a All rosettes were grown in a common garden in St Paul, MN, 2019 and 2020.
b When compared with Tukey’s honest significant difference (P = 0.05), mean CDD did not differ by location.
c CDD base and maximum temperatures of −3 and 4 C, respectively.
Number of CDD for Flowering among Locations
Logit regression models were estimated for each seed source location (Figure 3A–E). Independent factor variables for all seed source locations, omitting the location of interest, were added to the regression models to assess the effects of CDD on rosettes from that location relative to other locations. A matrix of each of the five locations was created (Table 4). Each cell of the matrix contains the odds ratio calculated by exponentiating the coefficient (parameter) estimate from the logit regression controlling for CDD, using the base and maximum temperatures of −3 and 4 C, respectively. If the odds ratio is greater than 1.0, then rosettes will require fewer CDD to flower compared with rosettes from the paired location. If the odds ratio is less than 1.0, then rosettes from the location of interest will require more CDD to flower than rosettes from the paired location. The higher or lower the odds ratio, then the higher or lower the odds of flowering as a function of accumulated CDD, respectively.
Alliaria petiolata rosettes were induced to flower in response to accumulating chilling degree days (CDD) and a matrix of each Alliaria petiolata seed source location compared with another location was created, with each cell of the matrix being the odds ratio from the logit regression created for each seed source location compared with an indicator variable created for each of the remaining seed source locations. a

a All Alliaria petiolata rosettes were grown in a common garden in St Paul, MN, 2019 and 2020. Columns should be read relative to rows. Odds ratios greater than 1.0 indicate that rosettes from a seed location in a column heading require fewer CDD to flower than rosettes from the paired location. Odds ratios less than 1.0 indicate that rosettes from seed locations in a column heading require more accumulated CDD to flower than the paired location. Odds ratios from logit regression of flowering with a chilling degree day base and maximum temperatures of −3 and 4 C, respectively. Asterisks indicate locations differ: *P < 0.05; **P < 0.01.
Each row and column display the odds ratio for each location compared with another location (columns relative to rows) and should be interpreted across rows or down columns. As an example, when comparing the Croatia location (in column 3), and the Minnesota location (in row 1), the odds ratio of 3.5 indicates that A. petiolata rosettes from Croatia required significantly fewer CDD to induce flowering compared with A. petiolata rosettes from Minnesota (P ≤ 0.05) (or Croatia rosettes had 3.5 times the odds of flowering than Minnesota rosettes).
Comparing odds ratios between and among locations, rosettes from Scotland required significantly more CDD to induce flowering than rosettes from the other seed sources (Table 4). This population required a longer chilling period to flower and originated from the site with the highest northern latitude, 57.649896°N (Table 1). Conversely, rosettes from the Croatia seed source flowered with significantly fewer CDD compared with all locations, except for A. petiolata sourced from Arkansas, near the southern range of A. petiolata in North America. Of note, the Croatia seeds were collected from Harkanovci, Croatia, with a latitude of 45.59287°N. This latitude is similar to that of the Minnesota population (Table 1), although winter temperatures in Harkanovi are milder than in Minnesota (https://en.climate-data.org/europe/croatia/osijek/osijek-3084).
Among North American populations of A. petiolata, rosettes from the Minnesota population required more CDD to flower than rosettes from the Arkansas location. Though not significant (P < 0.05), A. petiolata from the Minnesota seed source required fewer CDD to flower compared with the Ohio population, and the Ohio population required more CDD (p < 0.05) to flower than the Arkansas-sourced population. Thus, the fewest to most CDD required to induce flowering were: Croatia < Arkansas < Minnesota < Ohio < Scotland (Table 4). This ranking aligns with the graph of predicted flowering among locations at different amounts of CDD, which show that rosettes from Scotland required more CDD to flower than the other seed sources (Figure 4). Rosettes from different seed locations varied in the CDD required for flowering. Of the two European seed sources, rosettes from the Croatia seed source bolted and flowered after accumulating significantly fewer CDD than rosettes from Scotland.
Probability of flowering in Alliaria petiolata rosettes after exposure to different chilling degree days (CDD). CDD were calculated using base and maximum temperatures of −3 and 4 C, respectively. Rosettes were grown from seed sourced from three locations in the United States and two locations in Europe, and were grown in a common garden in St Paul, MN, in 2019 and 2020. Equations for regression lines are presented in Supplementary Table 2 in the Supplementary Material.

Alliaria petiolata rosettes are obligate biennials and require a vernalization period to flower, otherwise they remain vegetative. A base and upper temperature range between −3 to 4 C provided the best fit of the CDD data for vernalization of A. petiolata rosettes. Rosettes must accumulate sufficient CDD to be able to flower once placed into spring temperatures and a long-day photoperiod. Averaged over all locations, the accumulation of 68 and 120 CDD resulted in a 50% and 99% probability of flowering, respectively.
In the Northern Hemisphere, populations of some biennials from more southernly areas do not require vernalization to flower (Lacey Reference Lacey1988; Reinartz Reference Reinartz1984) and act as annual species by flowering the first year. Based on our results, this is not true of A. petiolata, as rosettes from all locations remained vegetative after accumulating too few CDD. In some biennial species, rosettes must reach a minimum size to be capable of flowering after vernalization (Baskin and Baskin Reference Baskin and Baskin1979; de Jong et al. Reference Jong, Klinkhamer and Prins1986). However, this is not true of species such as C. vulgare (Klinkhamer et al. Reference Klinkhamer, de Jong and Meelis1987). The A. petiolata rosettes grown in this study were well established, more than 4-mo old, and similar in size at the first sampling date, September 30 in 2019 and 2020.
When grown in a common garden, rosettes from different seed locations varied in the CDD required for flowering. Rosettes from the Scotland seed location flowered only after accumulating more CDD than the other locations. These seed were collected from northern Scotland, at a latitude of 57.64989°N. Rosettes from east-central Croatia (45.57610°N), bolted and flowered after accumulating fewer CDD than those from Scotland. Variation in flowering times based on latitudinal gradients has been documented in other species; B. vulgaris ssp. maritima (Van Dijk et al. Reference Van Dijk, Boudry, McCombre and Vernet1997) and C. vulgare (Wesselingh et al. Reference Wesselingh, Klinkhamer, De Jong and Schlatmann1994). In these species, rosettes from more northerly latitudes in the Northern Hemisphere required longer vernalization periods to flower. Rosettes of the biennial common mullein (Verbascum thapsus L.) grown in a common garden from seed harvested in southern Georgia and Texas, flowered earlier than populations from Canada (Reinartz Reference Reinartz1984). Van Dijk et al. (Reference Van Dijk, Boudry, McCombre and Vernet1997) and Wesselingh et al. (Reference Wesselingh, Klinkhamer, De Jong and Schlatmann1994) hypothesized that rosettes growing in more southerly latitudes in the Northern Hemisphere are more responsive to higher temperatures and shorter daylength. It would be of interest to include additional populations of A. petiolata from northern and southern edges of its native range to determine whether other populations follow the same trend.
There is significant genetic variation among populations of A. petiolata within North America, and it is likely that the species was introduced multiple times (Durka et al. Reference Durka, Bossdorf, Prati and Auge2005; Meekins et al.Reference Meekins, Ballard and McCarthy2001). In North American populations, the highest number of alleles were shared with populations from the United Kingdom, followed by central and eastern Europe (Durka et al. (Reference Durka, Bossdorf, Prati and Auge2005). Meekins et al. (Reference Meekins, Ballard and McCarthy2001) noted a cluster of plants from Ohio, Kentucky, New York, and West Virginia that shared a “close affinity” with plants from Scotland. They hypothesized that plants from these regions originated from Scotland or elsewhere in the United Kingdom. When grown in a common garden, rosettes from the Ohio seed source were likely to flower later than the Arkansas seed source, requiring significantly more CDD (P < 0.05). Perhaps the Ohio populations descended from a U.K. seed source (Table 4). However, we only tested the response of chilling on flowering for three populations of A. petiolata from the United States. Although there was a trend for rosettes from the Arkansas seed source to flower with fewer CDD, this was not significant compared with the Minnesota population (Table 4). As such, it is difficult to make conclusions about trends in flowering as a function of CDD across North America. It would be of interest to examine the CDD required for flowering in A petiolata rosettes collected from additional populations across the northern and southern edges of its native range in Europe and introduced range in North America.
Exploring the response to chilling in A. petiolata rosettes collected from populations of different genetic backgrounds, as well as the contribution of maternal influence from the source habitat would also be of interest (Blossey et al. Reference Blossey, Nuzzo and Dávalos2017; Stinson Reference Stinson and Seidler2014). We defined the base and maximum temperatures for accumulating CDD and characterized the amount of chilling required for A. petiolata rosettes to flower, which can be used to improve the accuracy of predictions of the potential distribution of A. petiolata in North America as well as distributional shifts as a result of climate change (Footitt et al. Reference Footitt, Huang, Olcer-Footitt, Clay and Finch-Savage2018). The biological control insects, Ceutorhynchus spp., require their host, A. petiolata, to complete their life cycles (Gerber et al. Reference Gerber, Cortat, Hinz, Blossey, Katovich and Skinner2009). As such, the vernalization period required for flowering in A. petiolata rosettes can also be used to predict the maximum potential distribution of A. petiolata biological control insects before their introduction into the United States.
Supplementary material
To view supplementary material for this article, please visit https://doi.org/10.1017/inp.2022.17
Acknowledgments
A special thanks to Edita Štefanić and J. J. Strossmayer, University of Osijek, who facilitated seed collection and phytosanitation permits in Croatia. We extend our thanks to Carey Minteer, University of Florida, and Jennifer Ogle, University of Arkansas, for facilitating and collecting A. petiolata seeds from Arkansas. We also thank John Stamm for collecting seeds in Ohio. Thanks to Ryan Mentz, Kenzie Barth, Aryane Batista, Nathan Garr, Kylie Rich, and Lewis Sheaffer for plant propagation help. Funding for this project was provided by the Minnesota Invasive Terrestrial Plants and Pests Center through the Environment and Natural Resources Trust Fund as recommended by the Legislative-Citizen Commission on Minnesota Resources (LCCMR). No potential conflict of interest is reported by the authors.


 Open access