

1. INTRODUCTION
Ice cores retrieved from East Antarctica provide the longest record of direct greenhouse gas concentrations and are key to understanding late Quaternary climate forcings. The European Project for Ice Coring in Antarctica (EPICA) Dome C (EDC) (75°06′S, 123°21′E; Augustin and others, Reference Augustin2004) and Vostok (78°28′S, 106°52′E; Petit and others, Reference Petit1999) ice cores provide dated records down to the depths of 3193 and 3272 m, respectively, corresponding to ages of 808 and 407 ka, respectively (Bazin and others, Reference Bazin2013; Veres and others, Reference Veres2013). However, age uncertainties at such depths become significant using traditional ice core dating methods: single core chronologies vary between confidence intervals of 2 ka at Vostok (O2/N2 dating method; Suwa and Bender, Reference Suwa and Bender2008) and 6 ka at Dome C (EDC3 chronology; Parrenin and others, Reference Parrenin2007) for ice older than 100 ka. Given these age uncertainties, there are limits on the temporal and spatial synchronicity and duration of climate change interpretations available from ice core chronologies. To improve the chronologies, efforts have been focussed on developing multi-core statistical approaches such as the Antarctic Ice Core Chronology 2012 (AICC2012) timescale (Lemieux-Dudon and others, Reference Lemieux-Dudon2010; Bazin and others, Reference Bazin2013; Veres and others, Reference Veres2013), which synchronizes five deep polar ice cores. Both cores also lack a well established absolute depth certainty (Parrenin and others, Reference Parrenin2012). For any deep ice core, factors such as borehole inclination, post-coring relaxation, broken-core length errors, logging gauge uncertainties and temperature of logging with respect to in-situ temperature can induce several meters of accumulated error (Parrenin and others, Reference Parrenin2012). With the introduction of radio-echo sounding (RES) recording isochronous layering over hundreds of kilometers, the age/depth record represented by ice cores can benefit substantially from extensive site selection activity, giving additional local knowledge about bed, surface and internal reflections before the core is drilled and to inform flow modeling for developing ice core chronologies. We adopt the AICC2012 chronology to date the radar reflections in this study as that chronology should provide the best comparison of ages between the EDC and Vostok ice core.
In Antarctica, internal RES reflections are pervasive and can be related to (1) density changes, (2) ice chemistry variation and/or (3) ice fabrics (Clough, Reference Clough1977; Fujita and Mae, Reference Fujita and Mae1994; Fujita and others, Reference Fujita1999). For the depths considered in this study, ice chemistry variation is thought to be the dominant source of internal radar reflections. Chemistry variations result from the deposition of discrete acidic aerosols as laterally extensive sheets on the ice surface, preserved by later accumulation (Millar, Reference Millar1981, Reference Millar1982; Fujita and Mae, Reference Fujita and Mae1994; Siegert and others, Reference Siegert, Hodgins and Dowdeswell1998a). The radar stratigraphy represents an additional method for ice core chronology extrapolation as it is related to discrete volcanic events and not solely climatic events. The isochronous nature of internal reflections has been discussed and exploited over the past ~40 years; Whillans (Reference Whillans1976) first showed their usefulness as isochrones in ice sheet models, Fujita and others (Reference Fujita1999) pointed out the lateral continuity of the internal reflections and therefore the validity of their use as isochronal markers, Jacobel and others (Reference Jacobel, Gades, Gottschling, Hodge and Wright1993) then demonstrated their use as markers of internal flow properties.
Modern RES surveys of the ice sheet provide the potential for extending ice core age/depth relationships over large areas where no cores exist (e.g. Siegert and others, Reference Siegert, Hodgkins and Dowdeswell1998b; Huybrechts and others, Reference Huybrechts, Rybak, Steinhage and Pattyn2009; Leysinger Vieli and others, Reference Leysinger Vieli, Hindmarsh, Siegert and Bo2011; MacGregor and others, Reference MacGregor2015), and given good survey coverage, for the connection of ice core chronologies (Steinhage and others, Reference Steinhage, Kipfstuhl, Nixdorf and Miller2013; MacGregor and others, Reference MacGregor2015). Internal reflectors have been increasingly used in the reconstruction of temporal and spatial climate parameters (e.g. Leysinger Vieli and others, Reference Leysinger Vieli, Hindmarsh, Siegert and Bo2011; MacGregor and others, Reference MacGregor2015). Use of continuous radar stratigraphy as an alternative method for ice core extrapolation has the advantage of (1) imaging spatially large areas to map englacial flow and (2) extending the stratigraphies measured in ice cores to other places (Parrenin and others, Reference Parrenin2012). Extensive RES stratigraphy can provide the level of depth and age accuracy needed for modeling studies and is proving extremely useful in the community's search for million-year-old ice (Fischer and others, Reference Fischer2013). Furthermore, through the collection of surveys that use coherent radar combined with a gridded survey design, RES stratigraphy could help constrain depth errors and inform ice core synchronization methods (e.g. Lemieux-Dudon and others, Reference Lemieux-Dudon2010; Bazin and others, Reference Bazin2013; Veres and others, Reference Veres2013). In this study, we attempt to connect the Dome C and Vostok ice core sites and evaluate the challenges associated with such extensions of ice core stratigraphy.
2. DATA AND METHODS
2.1. Radar surveys
We use RES lines acquired over several seasons by the University of Texas Institute for Geophysics (UTIG) aerogeophysical program (Fig. 1). The radar system operates with a center frequency of 60 MHz (Blankenship and others, Reference Blankenship, Morse, Finn, Bell, Peters, Kempf, Hodge, Studinger, Behrendt, Brozena, Alley and Bindschadle2001). Pre-2008 radar data (University of Texas/Technical University of Denmark (UT/TUD); Vostok site coverage) were acquired using a pulse width of 290 ns (~24.4 m in ice) and a pulse repetition frequency (PRF) of 12.5 kHz; log detected signals were digitised at 16 ns intervals for 65.5 s and incoherently stacked 2048 times to generate a trace every ~20 m along-track (Carter and others, Reference Carter, Blankenship, Young and Holt2009). Post-2008 data (High Capacity Airborne Radar Sounder (HiCARS) 1&2, Dome C site coverage) were acquired using a 1 µs chirp width with a 15 MHz bandwidth corresponding to a 100 ns pulse after compression (~8.4 m in ice) and a 6.4 kHz PRF; signals were digitised at 20 ns intervals and coherently stacked ten times, log detected and incoherently stacked five times to yield records every ~22 m along-track (Young and others, Reference Young2011). Unfocussed coherent stacking improves the signal-to-noise ratio (SNR) of flat internal reflections and reduces surface scattering but can eliminate dipping reflectors, while incoherent stacking retains steeply dipping reflections with some loss of geometric fidelity (Peters and others, Reference Peters2007). In parallel, we use an RES line acquired by the Center for Remote Sensing of Ice Sheets, University of Kansas (CReSIS) Multi-Channel Coherent Radar Depth Sounder (MCoRDS) in 2013 (MCoRDS, v2; Rodríguez-Morales and others, Reference Rodríguez-Morales2014). The radar system operates with a 180–210 MHz frequency range with multiple receivers and an adjustable bandwidth up to 30 MHz, corresponding to a post-processing 4.5 m vertical resolution in ice and a data product with an along-track sampling of 30 m (Leuschen and others, Reference Leuschen, Gogineni and Tammana2000).
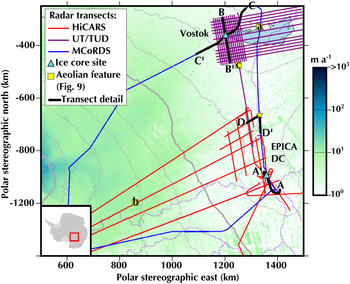
Map of the East Antarctic plateau focussed on the study area. A red box locates the study area in East Antarctica in the inset. All the radar transects used are shown in red (High-Capacity Radar Sounder (HiCARS) coherent radar data), magenta (University of Texas/Technical University of Denmark (UT/TUD) incoherent radar data) and a blue (Multichannel Coherent Radar Depth Sounder (MCoRDS) coherent radar data) overlaid on ice surface velocities (Rignot and others, Reference Rignot, Mouginot and Scheuchl2011). Dark gray contours are RADARSAT-1 Antarctic Mapping Project (RAMP) ice surface elevation (m) (Liu and others, Reference Liu, Jezek, Li and Zhao2001) and purple outlines ice divides (Bamber and others, Reference Bamber, Gomez-Dans and Griggs2009). Black highlights the extent of the transects displayed in Figures 2, 4 and 5 and Figure S1 and letters A-A’, B-B’, C-C’ and D-D’ provide orientation; yellow squares locate the aeolian features in Figure 7; blue triangles mark the locations of the two deep ice core sites connected in this study; a yellow star locates where radar reflections are initiated; Lake Vostok is outlined in blue. The basemap uses the Scientific Committee on Antarctic Research (SCAR) projection. (UT/TUD/Lake Vostok Survey (LVS) from Carter and others (Reference Carter2007); International Collaborative Exploration of the Cryosphere through Airborne Profiling/International Polar Year (ICECAP/IPY) in Young and others (Reference Young2011); (Blankenship and others, Reference Blankenship, Young and Kempf2012a, Reference Blankenship, Young and Kempfb)).
2.2. Internal reflection tracing strategy
Data interpretation is performed by tracking continuous radar reflections in ice following peaks in processed amplitude using Landmark's Decision Space Desktop 5000.8.3.0. Reflections are traced using a semi-automated tracking algorithm that uses an adjustable travel-time window to track peaks in echo amplitude. This tracing was completed in three phases:
-
(1) Dome C stratigraphy – First, we tested the accuracy of the HiCARS radar system for radar stratigraphy by tracing radar reflections beginning at the furthest point from the Dome C ice core site (Fig. 1) and tracked them continuously to the Dome C ice core site – a distance of ~230 km – where their travel-times were recorded. All HiCARS radar transects were used in this exercise to ensure a large number of crossovers (30), supporting the reliability of reflection tracing. Our reflection selection criteria are based on echo strength and continuity: reflections chosen have to be distinguishably brighter than adjacent layers and continuous, based on visual identification in Decision Space Desktop. If one of these properties failed, the reflection being traced was terminated. Reflections were sampled throughout the entire ice column at regular depth intervals, where possible.
-
(2) MCoRDS repeat – Second, we repeated the same steps using a MCoRDS radar transect, starting at the same location (at the intersection of the MCoRDS and the HiCARS radar transects; Fig. 1). Reflections at similar depths to those observed in HiCARS were traced to the Dome C ice core site. The MCoRDS transect stopped short of the Dome C ice core site, we therefore extended the MCoRDS-traced reflections onto two short HiCARS segments to measure their respective travel-times at the same site for comparison.
-
(3) Bridge to Vostok – In the third and final phase, we extended the HiCARS radar reflections described in the first phase, but this time we extended them in the direction of the Vostok ice core site along the UT/TUD survey (Fig. 1), to connect the Dome C and the Vostok ice cores. We independently repeated the same exercise, using only the MCoRDS transect. The lack of crossovers in both UT/TUD and MCoRDS data precluded circumventing areas of disturbed internal stratigraphy.
Complex internal reflection geometries attributed to the aeolian terranes and lake-induced strain-rate contrasts required extensive manual interpretation of the reflections (later section). Radar crossover errors (Supplement 1, Tables S1 and S2) give a qualitative measure of the reliability of the internal stratigraphy and of the depth uncertainties stated (described next).
2.3. Reflection depth estimation
A total of thirteen reflections are traced between the Dome C and Vostok ice core sites. Some reflections can be traced throughout the entire region, while others are restricted to the Dome C area, which has a relatively conformable sub-horizontal internal stratigraphy (Fig. 2). The deepest reflection traced at Dome C reaches 2318 m, which represents 73% of the full EDC core length retrieved. Reflection depths relative to the surface are computed for each reflection assuming a constant electromagnetic velocity of 168.5 and 300 m µs−1 in ice and air, respectively, obtained using an ice dielectric constant ε′ of 3.17 (Gudmandsen, Reference Gudmandsen and Wait1971; Peters and others, Reference Peters, Blankenship and Morse2005) and $C_{ice} = C_{air} /\sqrt {\varepsilon^{\prime}}$
. Variations in C
ice
are taken into account in calculating reflection depth uncertainties (Fujita and others, Reference Fujita, Matsuoka, Ishida, Matsuoka and Mae2000) (a detailed error analysis is given below).
$C_{ice} = C_{air} /\sqrt {\varepsilon^{\prime}}$
. Variations in C
ice
are taken into account in calculating reflection depth uncertainties (Fujita and others, Reference Fujita, Matsuoka, Ishida, Matsuoka and Mae2000) (a detailed error analysis is given below).
Radargram of the EPICA Dome C ice core site, using the HiCARS radar system. Top panel shows the raw radargram, bottom panel shows the radar reflections traced in blue. A vertical magenta line highlights the location of the ice core site; reflections are numbered according to Table 1. Note the gentle uniform undulation of the radar reflections, ‘draping’ over the rougher bed topography. Horizontal flow velocity is very low or negligible near the ice core site, and increases with radial distance from the dome.
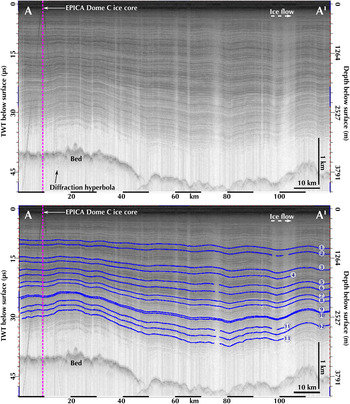
All thirteen reflections meet our reflection selection criteria of brightness and continuity. Where a radar transect intersects an ice core site, we measure reflection depths, using diffraction hyperbolae in the radar data arising from station structures as reference locations (e.g. Figs 2 and 5). Depths are measured from the surface, to which we apply firn corrections (z f) of 13.60 m and 14.60 m at Vostok and Dome C, respectively. These corrections are computed using Eqn (1) below, following Dowdeswell and Evans (Reference Dowdeswell and Evans2004) and published vertical density profiles for each site (Lipenkov and others, Reference Lipenkov, Salamatin and Duval1997; Barnes and others, Reference Barnes2002).
 $$z_{\rm f} = \displaystyle{K \over {n^{\prime}_{\rm i}}} \int (\rho _{\rm i} - \rho (z))\;dz$$
where K is the coefficient adopted by Robin and others (Reference Robin, Evans and Bailey1969) (0.85 m3 Mg–1), n i′ is the refractive index of solid ice (1.78), ρ i is the density of solid ice (0.917 Mg m–3) and ρ(z) is the density at a depth z (Mg m–3).
These firn corrections are confirmed within uncertainty bounds by a seismic refraction study at Dome C (12.52 ± 1.21 m; Gassett, Reference Gassett1982) and from literature at Vostok (15 ± 2 m; Dowdeswell and Evans, Reference Dowdeswell and Evans2004).
2.4. Radar depth error sources
To assess the uncertainties in the dating of the radar reflections, we first account for all known sources of error in determining reflection depths. Errors arise from three sources: (1) range estimate precision in determining reflection depth, (2) firn correction and (3) variations in electromagnetic wave (EM) propagation in ice. These are computed for each radar system independently (UT/TUD, HiCARS and MCoRDS) as their vertical resolution varies. Horizontal continuity was assumed over the minor data gaps between the ice core sites and the radar lines of closest approach, corresponding to 1.2 and 0.4 km at Vostok and Dome C, respectively. We describe treatment of each error in order:
-
(1) Vertical resolution of the radar system is given by the measured field radar pulse width (Millar, Reference Millar1982); it represents 24.4 m for the UT/TUD radar, 8.4 m for HiCARS and 4.5 m for MCoRDS. However, the precision of reflection depth estimates is a function of the radar system's pulse width and the SNR for each reflection at each ice core site. This is given by the range precision σ(r*), the standard deviation of the range estimate (Appendix). Additional errors could arise from sub-resolution reflector fluctuations, but the continuity of reflection amplitudes and subsequent traceability of the reflections suggests that this is not significant outside terranes of disturbed radar reflections (aeolian terranes and lake-induced strain rate contrasts).
-
(2) Firn correction uncertainty is given by published errors in depth-density curves at each ice core site (see Section 2.3). This represents a 2% standard error in density values at EDC (Barnes and others, Reference Barnes2002) and we use the same standard error at Vostok. This is propagated into the reflection depth error and represents a variation of ±1.37 m and ±1.35 m at Vostok and Dome C, respectively.
-
(3) The uncertainty arising from EM velocity in ice takes into account variations of the dielectric constant due to varying impurity concentrations, anisotropy and temperature (Fujita and others, Reference Fujita, Matsuoka, Ishida, Matsuoka and Mae2000; Dowdeswell and Evans, Reference Dowdeswell and Evans2004; Peters and others, Reference Peters, Blankenship and Morse2005). EM velocities in ice vary between 168 and 169.5 m µs−1 (Fujita and others, Reference Fujita, Matsuoka, Ishida, Matsuoka and Mae2000), which increases the uncertainty of our depth measurements as we go further down the ice column. This represents a maximum depth variation of ±11.69 and ±10.32 m at Vostok (UT/TUD) and Dome C (HiCARS) for the deepest reflection traced, respectively, and ±6.14 m at Vostok (MCoRDS, the deepest reflection traced in this case is shallower than for the other radar systems).
-
(4) All three sources of error are calculated at each ice core site and for each radar system (Tables 1, 2 and 3).
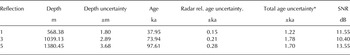
HiCARS radar reflections at Dome C

rel, relative.
Our top six reflections span the last glacial cycle; our bottom seven reflections span the penultimate glacial cycle.
* Note that here, total age uncertainty of an individual radar reflection represents the RMS of the Dome C relative radar age uncertainty of each radar reflection and the ice core age uncertainty (AICC2012, (Bazin and others, Reference Bazin2013; Veres and others, Reference Veres2013)).
In addition, a crossover error analysis is performed on all cross-lines and reflections as an independent validation of our reflection depth error estimates (Supplement 1). The measured crossover errors are less than the depth error estimates, further suggesting that our error estimates are conservative. This is done for the Dome C district (Table S1), where reflections are not perturbed by dune terranes (see Section 4), and in the Vostok district (Table S2).
2.5. Reflection age attribution
Next, we date radar reflections at the Dome C and Vostok sites using the published AICC2012 age/depth chronology (Bazin and others, Reference Bazin2013; Veres and others, Reference Veres2013) with the caveat that ice core absolute depth errors have not been estimated for the cores recovered at either site, but are thought to ‘sum up to several meters’ (Parrenin and others, Reference Parrenin2012). We linearly interpolate bagged ice core age/depth data to fit our picked radar depths, and assign ages to the reflections.
Thirteen radar reflections spanning a ~200 ka period, from the last glacial to the MIS 8 glacial, are traced around the EDC ice core site. Age coverage is shown in Figure 3. Only three reflections out of thirteen could be connected to the Vostok ice core site using MCoRDS (Fig. 4) due to the complicating effects of aeolian terranes and Lake Vostok on the radar reflections. More reflections are traced using the UT/TUD data as a result of its coarser vertical resolution (Fig. 5): reflections observed in the UT/TUD radar integrate more physical reflectors than the higher bandwidth systems, so while more local discrete reflections are identifiable in the more advanced data, reflections are more laterally continuous in the older data. However, a few reflections traced are unreliable (Fig. 6), also as a result of the presence of aeolian terranes and Lake Vostok (later discussion).
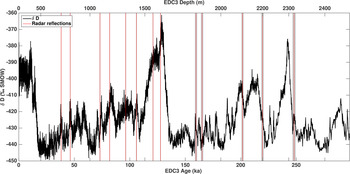
Temporal coverage of the radar reflections used in this study. Red lines represent the AICC2012 ages for the thirteen radar reflections traced. They are superimposed on the EDC δD record (Jouzel and others, Reference Jouzel2007), which is based on the Parrenin and others (Reference Parrenin2007) EDC3 timescale. Gray vertical bars represent the reflection age uncertainty obtained. The radar reflections cover a period of time from Marine Isotope Stage (MIS) 8 glacial up to the last glacial maximum.
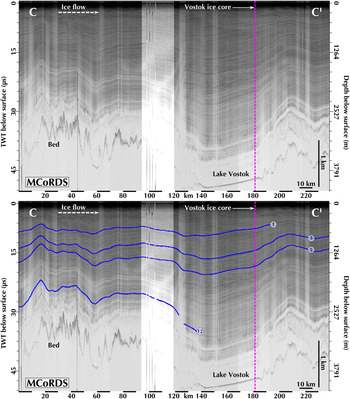
Radargram of the Vostok ice core site, using the MCoRDS radar system. Note the orientation of this transect is at an angle to that of Figure 5. Top panel shows the raw radargram, bottom panel shows the radar reflections traced in blue. A vertical magenta line highlights the location of the ice core site; reflections are numbered according to Table 3. Again, reflection geometries over Lake Vostok are complex and strongly warped over the bed topography. The radar transect is mainly along-flow here, with ice flow going from C to C’ as indicated by the dashed arrow.
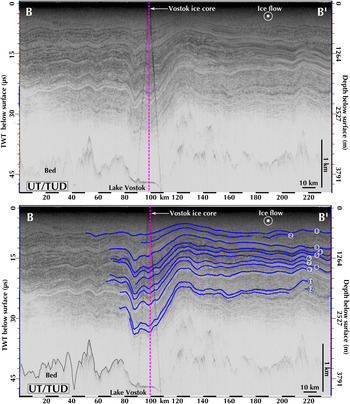
Radargram of the Vostok ice core site, using the UT/TUD radar system. Note the orientation of this transect is at an angle to that of Figure 4. Top panel shows the raw radargram, bottom panel shows the radar reflections traced in blue. A vertical magenta line highlights the location of the ice core site; reflections are numbered according to Table 1. Note this time the complex reflection geometries, as a result of the steep bed topography and the presence of Lake Vostok. The radar transect is oblique to flow, as indicated by the arrow head.
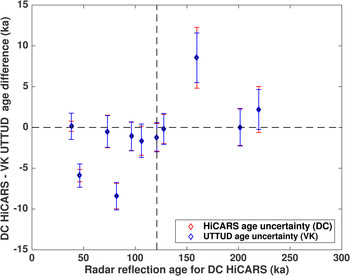
Radar reflection age differences between Vostok and Dome C ice cores using the combined HiCARS and UT/TUD radar systems, as a function of their age at the Dome C ice core site using HiCARS-determined reflection ages. Each data point represents each of the thirteen radar reflections traced. The vertical black dashed line separates reflections belonging to the last glacial from the penultimate glacial. Error bars are displayed for each reflection representing the total age uncertainty for each system. Both age uncertainties are displayed, red and blue corresponding to HiCARS and UT/TUD, respectively. Three reflections fall well outside their respective total age uncertainty bounds: we attribute this to the presence of aeolian terranes in the vicinity of Lake Vostok.
Once dated, we then calculate age uncertainties for each radar reflection. The total age uncertainty of an individual reflection is a combination of the published ice core age uncertainty (Bazin and others, Reference Bazin2013; Veres and others, Reference Veres2013) and the specific radar reflection's depth error (described above). Each radar reflection corresponds to a specific age gradient in the age/depth ice core curve, due to variations in strain thinning and accumulation rates through glacial/interglacial cycles. This age gradient can be used to translate the reflection depth error to a relative radar age error for each radar reflection. The total age uncertainty for an individual radar reflection is the RMS combination of the ice core published age error and the relative radar age error for the individual radar reflection (different for each radar system) (also used by MacGregor and others, Reference MacGregor2015). All uncertainties are summarized in Tables 1–3.
3. RESULTS
A distinction must be made between the internal stratigraphy within a ~200 km radius of the Dome C ice core site, which shows relatively uniform, sub-parallel and continuous reflections, with that of areas further upflow towards Lake Vostok, characterized by more complex or truncated reflections due to the presence of the tectonically-controlled deep subglacial Lake Vostok basin (Studinger and others, Reference Studinger2003), and aeolian reworking of the ice surface. Figures 2, 4 and 5 show the contrast in internal reflections between these two districts: the Vostok transect shows strongly up- and down-warped reflections, as they flow over the jagged bed topography, as opposed to the ‘smooth’ Dome C stratigraphy. These various transects have different orientations with respect to ice flow and care must be taken when comparing them: Figure 2 is mainly along the ridge, along-flow, with very low ice flow speeds, while Figure 4 is mainly along-flow and Figure 5 is oblique to flow, both with significantly higher flow speeds.
3.1. The Dome C district
The internal radar stratigraphy around Dome C is fairly straightforward and conformable: all thirteen radar reflections can be traced through the entire district, using all radar lines available (Fig. 2). The surveys were designed as grids, providing multiple intersecting lines and, therefore, crossover points to ensure that the same radar reflection is being tracked throughout (Supplement 1, Table S1). The gridded parts of the survey provide a qualitative check on the isochroneity of the radar reflections traced; spatially, reflections intersect with themselves on radar cross-lines. Table 1 shows the depth, age and uncertainty associated with each reflection. The MCoRDS transect, as a separate radar system, serves as an additional test of the accuracy of reflection dating and assignment of errors. As it was collected at a different bandwidth, center frequency and with different processing steps, it is an ideal independent test of the accuracy of our HiCARS internal reflections. Starting from the same site (labeled in Fig. 1), we are able to match each HiCARS reflection to a MCoRDS reflection. Table 2 shows reflection depths, ages and uncertainties associated with the MCoRDS data.
MCoRDS radar reflections at Dome C

rel, relative.
Our top six reflections span the last glacial cycle; our bottom seven reflections span the penultimate glacial.
* Note that here, total age uncertainty of an individual radar reflection represents the RMS of the Dome C relative radar age uncertainty of each radar reflection and the ice core age uncertainty (AICC2012, (Bazin and others, Reference Bazin2013; Veres and others, Reference Veres2013)).
3.2. Linking Dome C and Vostok
Radar internal stratigraphy becomes more complex as we move upflow towards Lake Vostok (Figs 4 and 5). We attempt to trace all thirteen reflections to the Vostok ice core site. Again, this is done twice: once using mostly UT/TUD incoherent radar data, and a second time with the independent MCoRDS radar transect. Note the difference in character of the reflections between the two radar systems (Figs 4 and 5), in part due to the difference in vertical exaggeration, but also the orientation of the transect with respect to ice flow. Using the MCoRDS data, only three reflections can be traced continuously between Dome C and Vostok (Fig. 4). The majority traced from Dome C stop short of the Vostok region. Table 3 shows the depth, age and uncertainty associated with the three connected reflections.
MCoRDS radar reflections at Vostok
rel, relative.
Only three reflections made it across to the Vostok ice core site, and we only report those three.
* Total age uncertainty of an individual radar reflection represents the RMS of the Vostok relative radar age uncertainty of each radar reflection and the ice core age uncertainty (Bazin and others, Reference Bazin2013; Veres and others, Reference Veres2013).
We are able to trace more reflections from Dome C all the way to the Vostok site using the UT/TUD survey. Figure 5 displays all eleven ‘successful’ radar reflections, where they intersect the Vostok ice core site.
3.3. The Vostok district
We hypothesize that the lack of radar line crossovers precludes the successful stratigraphic tie between the two ice cores for all reflections. To test this, we attempt a short experiment by tracing thirteen reflections inside the UT/TUD Vostok grid, initiating them at the Vostok ice core site location in the radargrams and expanding them as far out as possible through the grid. Reflections are not chosen at random: the ages obtained at Dome C for the thirteen reflections are converted to an equivalent depth at Vostok using the AICC2012 chronology. From the Dome C total age uncertainties for each reflection, we calculate the depth uncertainty range expected at Vostok, which gives us a depth interval within which the brightest reflection is chosen, or as close to it as possible. This is done to satisfy our reflection selection criteria described earlier and choose reflections that are of approximately the same age as at Dome C.
Although buried dune terranes are pervasive in the Vostok grid (Fig. 7), the tight grid design enables circumvention of highly disturbed areas. The multiple crossovers ensure that the reflections traced are internally consistent and have the isochronal character required. We then calculate crossover errors for this set of reflections (Supplement 1, Table S2): we show that they are below the radar depth uncertainty of the UT/TUD system.
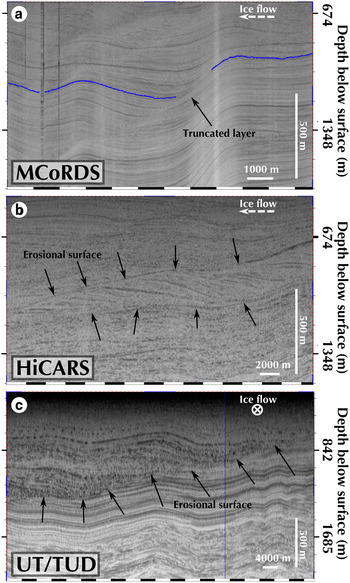
Radar transects showing aeolian terranes and features, for the (a) MCoRDS, (b) HiCARS and (c) UT/TUD radar systems. Their locations are highlighted on Figure 1. (a) Radar reflection (in blue) truncated by an erosional surface on the MCoRDS transect. The transect is oriented along-flow and ice thickness varies greatly between ~3050 and ~4440 m. (b) A complete buried dune structure displaying well distinguishable cross-strata separated from the rest of the ice column by a highly visible upper and lower erosional surface, highlighted by black arrows. The transect is oriented along-flow and ice thickness is ~3020 m. (c) Although lower resolution, this incoherent transect shows a strong transition, highlighted by arrows, between isochronal ‘well-behaved’ internal reflections to more re-worked stratigraphy in the shallower portion. The transect is oriented oblique to flow and ice thickness is ~3120 m.
4. DISCUSSION
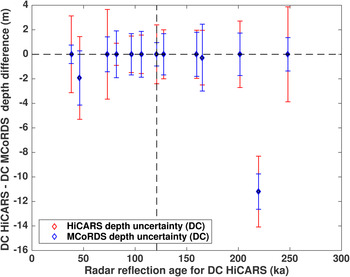
The straightforward internal reflections in the Dome C district allow the retrieval of a reliable radar stratigraphy, where the total age uncertainty for each reflection is dominated by ice core age uncertainties and is only weakly impacted by the additional relative uncertainties of the HiCARS system. Due to the finer vertical resolution of MCoRDS, HiCARS reflections can sometimes correspond to a set of several (thinner) MCoRDS reflections (Supplement 2), in which case only one of the sets is traced. However, as seen from Figure 8, this does not affect the reflection matching. Figure 8 shows the depth difference for a reflection traced with only HiCARS versus only MCoRDS data, and the depth errors displayed are the range precision errrors σ(r*), which are a function of the radar vertical resolution and the SNR obtained for each reflection. The repeatability of the radar stratigraphy obtained from two independent radars supports our assumption that our error estimates are conservative. This comparison increases our confidence that the radar reflections traced are isochronal, as the two radar systems not only use different frequencies and processing steps, but are flown over different parts of the ice surface. We note that our third reflection selected at Dome C for its brightness is dated at 73.10 ± 2.00 ka, and may originate from the acidity peaks associated with the Toba event(s) (Svensson and others, Reference Svensson2012).
Radar reflection depth differences between HiCARS and MCoRDS at Dome C using only σ(r*) depth errors, as a function of their age at the Dome C ice core site using HiCARS-determined reflection ages. Each data point represents one of the thirteen radar reflections traced. The vertical black dashed line separates reflections belonging to the last glacial from the penultimate glacial. Error bars are displayed for each reflection representing the depth uncertainty related to the SNR of the reflections only (i.e. σ(r*) only), for each system. Both depth uncertainties are displayed, red and blue corresponding to HiCARS and MCoRDS, respectively. Reflection depths obtained are almost identical for each independent radar system, except for one, and shows that the depth uncertainty bounds are conservative.
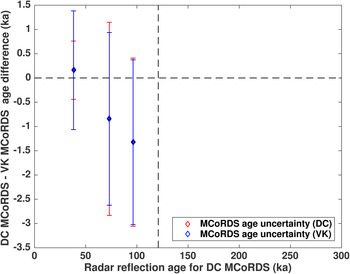
Although the MCoRDS data have a finer vertical resolution and use coherent processing, they are only a single line, and, therefore, stratigraphically complex areas cannot be avoided. The UT/TUD Vostok survey avoids this issue, through its gridded survey design. The presence of buried aeolian terranes can perturb reflection isochroneity, which can be difficult to recognize in the absence of crossovers. Figure 7a shows an example of such effects in the MCoRDS data. This explains the difficulty in connecting reflections between the Dome C and Vostok region. However, for all three reflections continuously traced, the age differences between the Dome C and Vostok sites fall inside the total age uncertainty ranges (Fig. 9).
Radar reflection age differences between Vostok and Dome C ice cores using the MCoRDS radar system, as a function of their age at the Dome C ice core site using MCoRDS-determined reflection ages. Each data point represents one of the thirteen radar reflections traced. The vertical black dashed line separates reflections belonging to the last glacial from the penultimate glacial. Error bars are displayed for each reflection representing the total age uncertainty for each system. Both age uncertainties are displayed, red and blue corresponding to HiCARS and MCoRDS, respectively. The age differences between the two cores all fall within their total age uncertainty bounds. Only three reflections could be traced between the two cores: we attribute this to the pervasive presence of buried aeolian terranes, which affect all depths of the ice column and preclude a successful connection of the two cores.
A majority of the thirteen reflections can be connected from Dome C to the Vostok site as a result of the gridded design of the UT/TUD survey. The difference in age for a reflection between the two ice core sites varies within the total age uncertainty ranges for most reflections, as seen from Figure 6. However, this difference also varies beyond the age uncertainties stated previously for a few reflections. We suspect this is mostly due to the pervasive presence of buried aeolian terranes, which affect all depths of the ice column. These terranes are more difficult to recognize, due to the incoherent processing and low bandwidth of the UT/TUD data (Fig. 7c). In addition, the UT/TUD grid used to trace the reflections around Vostok is connected to the HiCARS lines via a single ~200 km UT/TUD line (Fig. 1). This means no crossovers can be used as checkpoints on the integrity of the reflections used for 200 km, which we conclude is the key to a successful radar connection of the cores. We therefore infer that the total age uncertainty bounds calculated for all radar reflections represent the ‘expected’ age uncertainty in the case of straightforward and conformable stratigraphy. Our radar connection of the two cores also agrees well in depth with that obtained using volcanic tie-points in the cores (Parrenin and others, Reference Parrenin2012) (see further details in Supplement 3).
Active dune terranes cover significant parts of the East Antarctic plateau (Arcone and others, Reference Arcone, Jacobel and Hamilton2012a, Reference Arcone, Jacobel and Hamiltonb; Das and others, Reference Das2013). Aeolian terranes are readily visible in the HiCARS, UT/TUD and MCoRDS radar transects, as shown in Figure 7; further internal details are identifiable in the coherent radar profiles (HiCARS and MCoRDS). For UT/TUD data, the type of processing applied and the coarser vertical resolution of the radar system make identification of these dunes more difficult. Aeolian terranes are therefore generally identified by the presence of erosional surfaces in the UT/TUD data. These terranes affect all depths of the ice column sampled by the reflections traced, and their locations vary with depth. Note also that significant reflection disruptions have been reported along-flow lines over Lake Vostok: they are likely to be associated with anomalously high accumulation over the lake edge (Leonard and others, Reference Leonard, Bell, Studinger and Tremblay2004). These can further compromise the isochroneity of the internal reflections.
The crossover analysis performed for the Vostok district-reflections gives us confidence that the incoherent UT/TUD system is adequate for reflection tracing, despite its coarser resolution. We therefore suggest that the link between the Vostok and Dome C sites is limited by the suboptimal survey design rather than perturbed reflections as a result of buried aeolian terranes and lake-induced strain rate contrasts. The lack of crossovers along the single ~200 km long UT/TUD line, and along the MCoRDS transect makes it difficult to reliably extend radar reflections.
5. CONCLUSIONS
In this study, thirteen bright and continuous radar reflections were identified in UTIG airborne surveys from 2000 to 2011 and traced around the EDC and Vostok ice core sites. These tracings were repeated with the MCoRDS radar transect flown between the two cores in 2013, and the respective reflections show a good stratigraphic match. The reflection ages span the last two glacial cycles, an important constraint on ongoing modeling efforts in the area to identify million-year-old ice target sites (Fischer and others, Reference Fischer2013). We show that in the vicinity of Dome C, radar reflections represent very reliable isochronal surfaces, which will be key to modeling efforts to select a new deep ice core site. As we move away from Dome C and closer to Vostok, we enter an area of buried aeolian terranes that rework and truncate some radar reflections beyond isochroneity. Lake Vostok also affects layer geometries as the ice flows over it, due to anomalous accumulation effects and flow over steep bedrock topography (Studinger and others, Reference Studinger2003; Leonard and others, Reference Leonard, Bell, Studinger and Tremblay2004), and can contribute to the complex stratigraphy observed in the area. Despite these natural hurdles, most reflections could be successfully traced along the Byrd-Totten Glacier divide, connecting the two ice core sites.
It is still well within our reach to obtain a more complete and direct chrono-stratigraphic link between the ice cores. It simply requires the collection of further radar data with gridded survey designs to get better alternative routes to link the Dome C and Vostok areas. Our investigation informs us that the only impediment to connecting the two cores more completely was the design of these particular surveys, which was ultimately not well suited to the particular challenges of the East Antarctic plateau. However, we acknowledge that the primary purpose of these surveys was not the connection of the two cores. After tracing multiple reflections with a variety of radar systems, processing techniques and survey geometries, we advise survey designs that include numerous crossovers for reliability and reproducibility of the reflection tracings, including stratigraphically complex areas. Indeed, when it comes to the latter, even the most recent radar systems and processing techniques cannot recover a reflection that has been extensively truncated or thickened/thinned. In those cases, we found that the most reliable method was to circumvent the area, using crossing transects. We therefore emphasize the importance of collecting (pseudo-)grids over wide areas of Antarctica, as well as carefully connecting interpreted radar surveys (and new surveys) to existing ice cores. We encourage new linkages with grid spacings appropriate for the regional distribution of erosion-related unconformities. This spacing should be estimated from the distribution of aeolian and strain rate anomalies extracted from the existing surveys at the ice core districts, needed for accurate ice core extrapolation objectives. On the condition that further data can be collected, we are confident that the two deep ice cores can be more fully connected, thus providing additional information, and perhaps most usefully depth uncertainties, in existing synchronizations.
SUPPLEMENTARY MATERIAL
To view supplementary material for this article, please visit http://dx.doi.org/10.1017/jog.2016.11
ACKNOWLEDGEMENTS
This work was supported by NSF grants ANT-0733025 and ARC-0941678, NASA grants NNX08AN68G, NNX09AR52G, and NNX11AD33G (Operation Ice Bridge) to Texas, the Jackson School of Geosciences, the G. Unger Vetlesen Foundation, NERC grant NE/D003733/1 and the Global Innovation Initiative award from the British Council. We acknowledge the use of data products from CReSIS generated with support from NSF grant ANT-0424589 and NASA Operation IceBridge grant NNX13AD53A. A portion of this work was carried out by the Jet Propulsion Laboratory, California Institute of Technology under a contract with the NASA. Operational support was provided by the U. S. Antarctic Program and by the Institut Polaire Français Paul-Emile Victor (IPEV) and the Italian Antarctic Program (PNRA and ENEA). We thank the staff of Concordia Station and the Kenn Borek Air flight crew. Additional support was provided by the French ANR Dome A project (ANR-07-BLAN-0125). Finally, we thank the Scientific Editor and anonymous referees for constructive reviews. We thank Justin Hiester for his editorial help. This is UTIG contribution 2915.
APPENDIX
Radar horizon range precision
Radio echo tracking of reflecting horizons
In this work, we use airborne RES data to trace continuous reflectors between the Vostok and EDC ice cores. We follow a well established approach in the glaciological interpretation of ice penetrating radar stratigraphy by assuming that continuous reflectors represent isochronous englacial horizons (Siegert and others, Reference Siegert, Hodgins and Dowdeswell1998a; Dowdeswell and Evans, Reference Dowdeswell and Evans2004). By exploiting its capability to both track and estimate the range to englacial reflecting horizons, RES data offers the potential to compare and calibrate the time scale records of distinct ice cores. The two primary factors that govern the applicability and precision of this method of ice core inter-comparison are (1) the continuous interpretability of englacial reflectors (discussed in the text of this paper) and (2) the precision of range estimates to those interpreted reflectors (the subject of this Appendix).
Precision of range estimates to englacial reflectors
The precision of range estimates for point non-fluctuating targets like the shallowly sloping englacial reflecting horizons examined in this work are a function of the waveform bandwidth, β, the horizon signal power, P L, the noise power, N 0, and the speed of light in ice, C ice , (Evans and Hagfors, Reference Evans and Hagfors1968). For this type of target, the variance of the delay estimate, τ*, is given by
 $$Var({\tau}^{\ast} ) = \displaystyle{{N_0} \over P_{\rm L}} \displaystyle{1 \over {\beta^2}}$$
and the variance of the corresponding range estimate is therefore
 $$Var(r^{\ast} ) = \displaystyle{\left({{C_{ice}\over2}}\right)^2 {}}\displaystyle{{N_0} \over {P_{\rm L}}} \displaystyle{1 \over {\beta^2}}$$
where r* is the range estimate (Wehner, Reference Wehner1995). The SNR, of the radar return from a reflecting horizon is
 $$SNR = \displaystyle{{P_{\rm L}} \over {N_0}} $$
and the range resolution of an ice penetrating radar system is
 $$\Delta r = \displaystyle{{C_{ice}} \over {2\beta}}$$
where Δr is the range resolution (Evans and Hagfors, Reference Evans and Hagfors1968; Wehner, Reference Wehner1995). By combining Eqns (A2)–(A4), the variance in the range estimate for a horizon can be written in terms of only the range resolution of the radar system and the SNR of the radar reflection from that horizon:
 $$Var(r^{\ast} ) = \displaystyle{{\Delta r^2} \over {SNR}}.$$
Therefore, the precision of a range estimate for a reflecting englacial horizon at the 68% confidence level will be given by
 $$\sigma (r^{\ast} ) = \displaystyle{{\Delta r} \over {\sqrt {SNR}}}$$
where σ(r*) is the standard deviation of the range estimate. It is worth noting (and apparent in Eqn (A6)) that the precision of the range estimate to englacial reflector is better than the range resolution of the ice penetrating radar for SNRs greater than two. Indeed, as mentioned in Evans and Hagfors (Reference Evans and Hagfors1968), “were it not for the noise, the finite signal duration or bandwidth would not prevent the location of the peak [of the reflecting horizon in range] to arbitrarily high precision”.
Precision of range estimates for englacial reflectors in this work
In this work, we use three ice penetrating radar systems: the UT/TUD incoherent radar system with a 290 ns pulse and corresponding in-ice range resolution of Δr = 24.4 m for pre-2008 surveys (Carter and others, Reference Carter2007), the HiCARS coherent 15 MHz bandwidth system with a pulse-compressed in-ice range resolution of Δr = 8.4 m (Young and others, Reference Young2011) and the MCoRDS coherent 30 MHz bandwidth system with a post-processing range resolution of Δr = 4.5 m (Gogineni, Reference Gogineni2012) for C ice = 168.5 m µs−1. In our study areas, the SNR of horizon echoes ranged from SNR = 1.12–11.82 dB for the UT/TUD system, from SNR = 6.75–19.40 dB for the HiCARS system and from SNR = 4.35–15.52 dB for the MCoRDS system. Using Eqn (A6), we find that the precision of the range estimates in this study range from σ(r*) = 6.27–21.48 m for the UT/TUD data used at the Vostok core, from σ(r*) = 0.90–3.87 m for the HiCARS data used at the EDC core and from σ(r*) = 0.75–2.73 m and σ(r*) = 0.95–1.36 m for the MCoRDS data used for EDC and Vostok ice core sites, respectively.


 Open access