


During the years 2020-2023 of the COVID-19 pandemic, when tests for the SARS-CoV-2 virus became available, the United States (US) government promoted free on-demand testing. The government sent billions of dollars to states and local governments for tests and personnel to administer them. When home tests became available, free test kits were mailed directly to people who requested them. This policy was based on the knowledge that SARS-CoV-2 was spread easily in breathed aerosols and particles from the asymptomatic and presymptomatic in addition to the symptomatic. At first, people were urged to be tested and self-quarantine if they tested positive. Later testing was promoted as a path to normal activities. Testing advocates assumed that tracing the contacts of those who test positive, testing the contacts, and urging all who test positive to isolate themselves for 14 days would reduce the spread of the virus. Many jurisdictions also used the proportion positive of those tested to adjust recommendations or requirements for face coverings, and the size of gatherings. To the extent that people sought tests to decide whether to visit others rather than because of symptoms or suspected exposure, the tests were more likely to be negative, inflate the total tested, and therefore reduce the proportion positive.
In early 2021, a research report indicated that increases in negative tests predicted surges in hospitalizations 14 days after the tests when on-demand testing was promoted in 23 countries and among US states in 2020. Negative tests were not associated with increased hospitalizations when tests were limited to the symptomatic and people with conditions making them more vulnerable to severe outcomes.Reference Robertson 1 When on-demand testing was available, it appeared that people who received negative test results were traveling and coming in contact with the infected, resulting in increased infections. After an abrupt decline in road traffic when the health emergency was declared, during March-July 2020, about 335 kilometers of road travel on average was accumulated in the week following each negative test.Reference Robertson 2 In the US during 2020-2022, cases and deaths surged periodically, especially during the summer vacation periods and the late fall and winter holidays. 3 People move about on foot and conveyances such as bicycles, mass transit, and airplanes, in addition to road vehicles, increasing the risk of exposure to the virus. This communication reports a study that tests the hypothesis that negative COVID-19 tests are associated with subsequent trips outside the home and increased COVID-19 infections.
The 14-day lag time between changes in test results and cases used in previous research1,Reference Robertson 2 is open to question. The average time from infection to symptom onset has been estimated at 5-7 days, but in 1 study, symptoms did not appear for more than 12 days in 5% of cases.Reference Zhai, Ding and Wu 4 A literature search found no study of time from symptom onset to seeking a diagnosis, but it is likely that many people with mild symptoms delayed or avoided diagnosis. The count of deaths from the disease is indicative of severe cases but the delay between infection and death is likely more varied than the delay between infection and diagnosis. One study found an average lag of 18 days from diagnosis to death, with 10% of cases dying 33 or more days after diagnosis.Reference Marschner 5 To examine the sensitivity of variation in the results due to lag times, this study compares several in a plausible range.
Methods
Data on daily trips outside households in each US state, measured by cell phone movement, were downloaded from the US Bureau of Transportation Statistics. A cell phone movement was considered away from home if the phone moved 300 or more meters at a speed of 1.4 meters per second within 5 minutes. The data have been subjected to procedures indicative of validity. 6 Daily COVID-19 cases and deaths and daily reported positive and negative tests in the states were downloaded from covidactnow.org. 7 The data were gleaned from a variety of sources. The included daily counts were from late March 2020-June 5, 2021, after which the trip data were unavailable. Data on testing were missing from Washington state, which was excluded. Data were available for 20 256 state days, an average of 413 days per state.
Merged by state and date, the data were fitted to 3 least-square regression models, 1 for trips and 1 each for cases and deaths. Where t = time in days from the first tests in a given state and t-7 = data 7 days before, the form of the model for predictors of trips during the week after is:
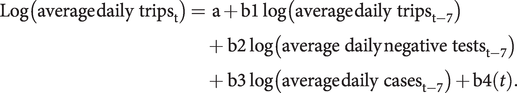 $$ \mathrm{Log}\left(\mathrm{average}\;{\mathrm{daily}\ \mathrm{trips}}_{\mathrm{t}}\right)={\displaystyle \begin{array}{l}\mathrm{a}+\mathrm{b}1\;\log \left(\mathrm{average}\;{\mathrm{daily}\ \mathrm{trips}}_{\mathrm{t}-7}\right)\\ {}\hskip-0.3em +\hskip2px \mathrm{b}2\;\log \left(\mathrm{average}\ \mathrm{daily}\;{\mathrm{negative}\ \mathrm{tests}}_{\mathrm{t}-7}\right)\\ {}\hskip-0.3em +\hskip2px \mathrm{b}3\;\log \left(\mathrm{average}\;{\mathrm{daily}\ \mathrm{cases}}_{\mathrm{t}-7}\right)+\mathrm{b}4(t).\end{array}} $$
The model for cases is:
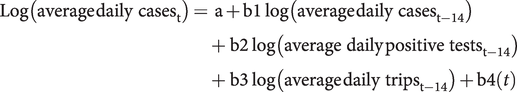 $$ \mathrm{Log}\left(\mathrm{average}\;{\mathrm{daily}\ \mathrm{cases}}_{\mathrm{t}}\right)={\displaystyle \begin{array}{l}\mathrm{a}+\mathrm{b}1\;\log \left(\mathrm{average}\;{\mathrm{daily}\ \mathrm{cases}}_{\mathrm{t}-14}\right)\\ {}\hskip-0.3em +\hskip2px \mathrm{b}2\;\log \left(\mathrm{average}\ \mathrm{daily}\;{\mathrm{positive}\ \mathrm{tests}}_{\mathrm{t}-14}\right)\\ {}\hskip-0.3em +\hskip2px \mathrm{b}3\;\log \left(\mathrm{average}\;{\mathrm{daily}\ \mathrm{trips}}_{\mathrm{t}-14}\right)+\mathrm{b}4(t)\end{array}} $$
The lag time in the second equation was incremented from 10-14 days in separate examinations of fit to the model for cases. The equation for deaths was the same as for cases except the time lag was incremented from t-20 to t-25 days. Trips, cases, and deaths in previous weeks as predictors of their frequency in the subsequent period were included to control statistically for the phase of the pandemic at a given time in each state. Logarithms of the data were employed to reduce skew in the frequency distributions. The daily fluctuation of test and case reporting, as well as weekday variation in trips, was reduced by computing 7-day moving averages.
To assess the possibility of on-demand testing producing bias in positivity, a graph of percent positive by negative tests per population is presented.
Results
The regression coefficients and confidence intervals for predictors of average daily trips are in Table 1. Trips increased during the week following an increase in SARS-CoV-2 negative tests and declined as cases increased but there was no overall trend in time. The negative coefficient for cases suggests that higher case counts reduced the tendency to travel. The lack of prediction by time trend indicates that the predictions are specific to the other variables and not an artifact of parallel time trends. The R 2 indicates a good fit of the data to the model (Table 1).
Negative tests and COVID-19 cases as predictors of average daily trips in the following week, US states March 2020-May 2021

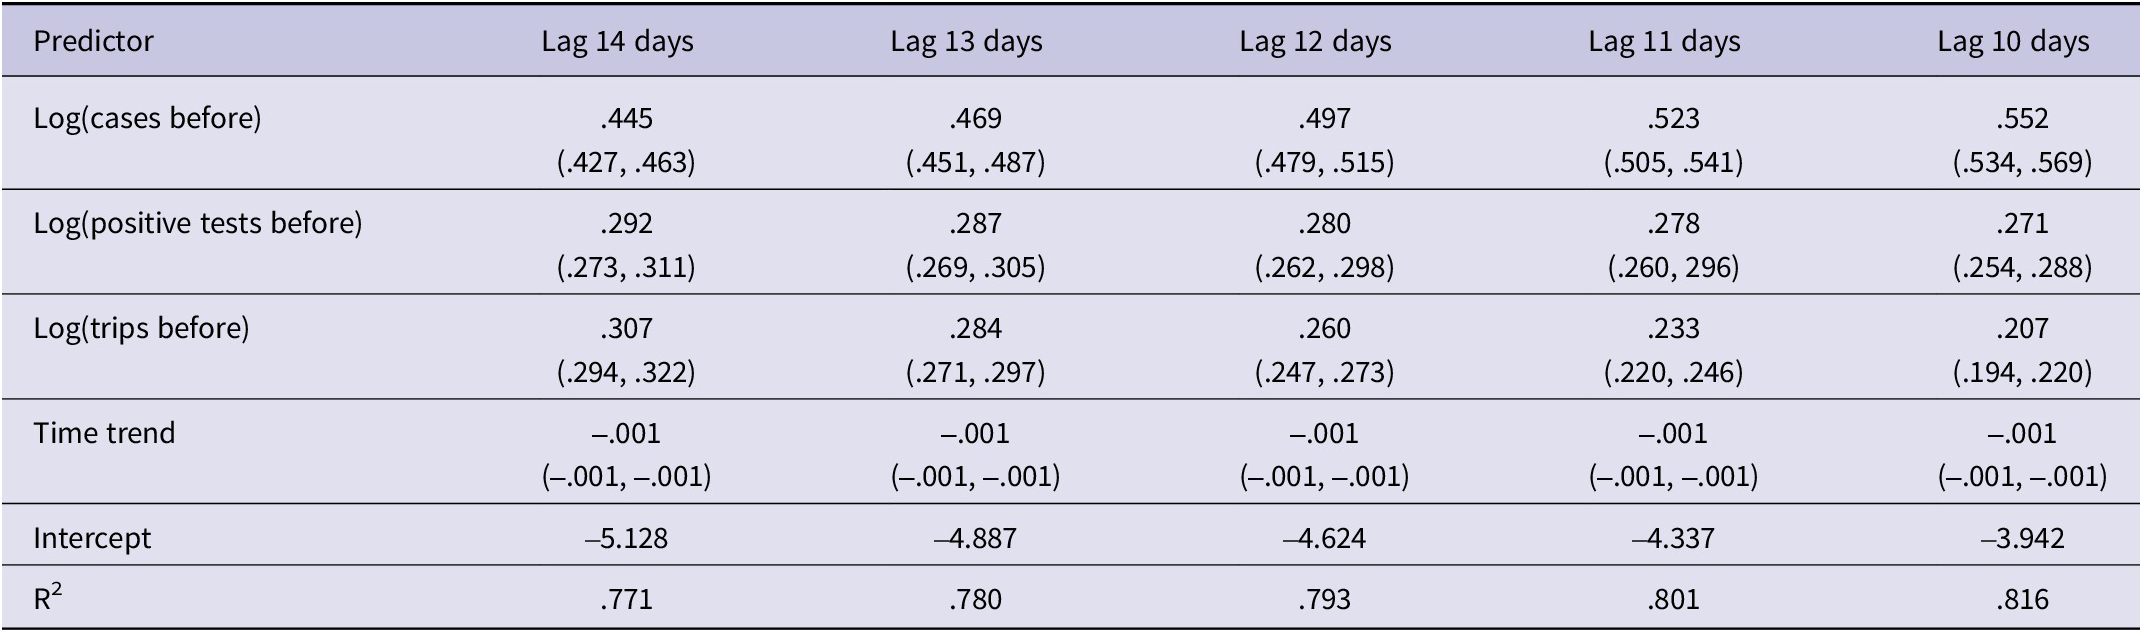
The results for COVID-19 cases at different lag times are in Table 2. Cases surged after trips increased in prior weeks. The trip coefficient increased as lag time increased, suggesting a greater lag for those who contracted the virus on trips. The coefficients on positive tests were also higher with a longer lag time. The cases predicted from prior cases declined as lag time increased. The association of cases to time was minimal, indicative of no trend unrelated to the predictive variables (Table 2).
Regression coefficients and 95% confidence intervals of predictors of log(COVID-19 daily cases) in specified lag times, US states March 2020‒May 2021
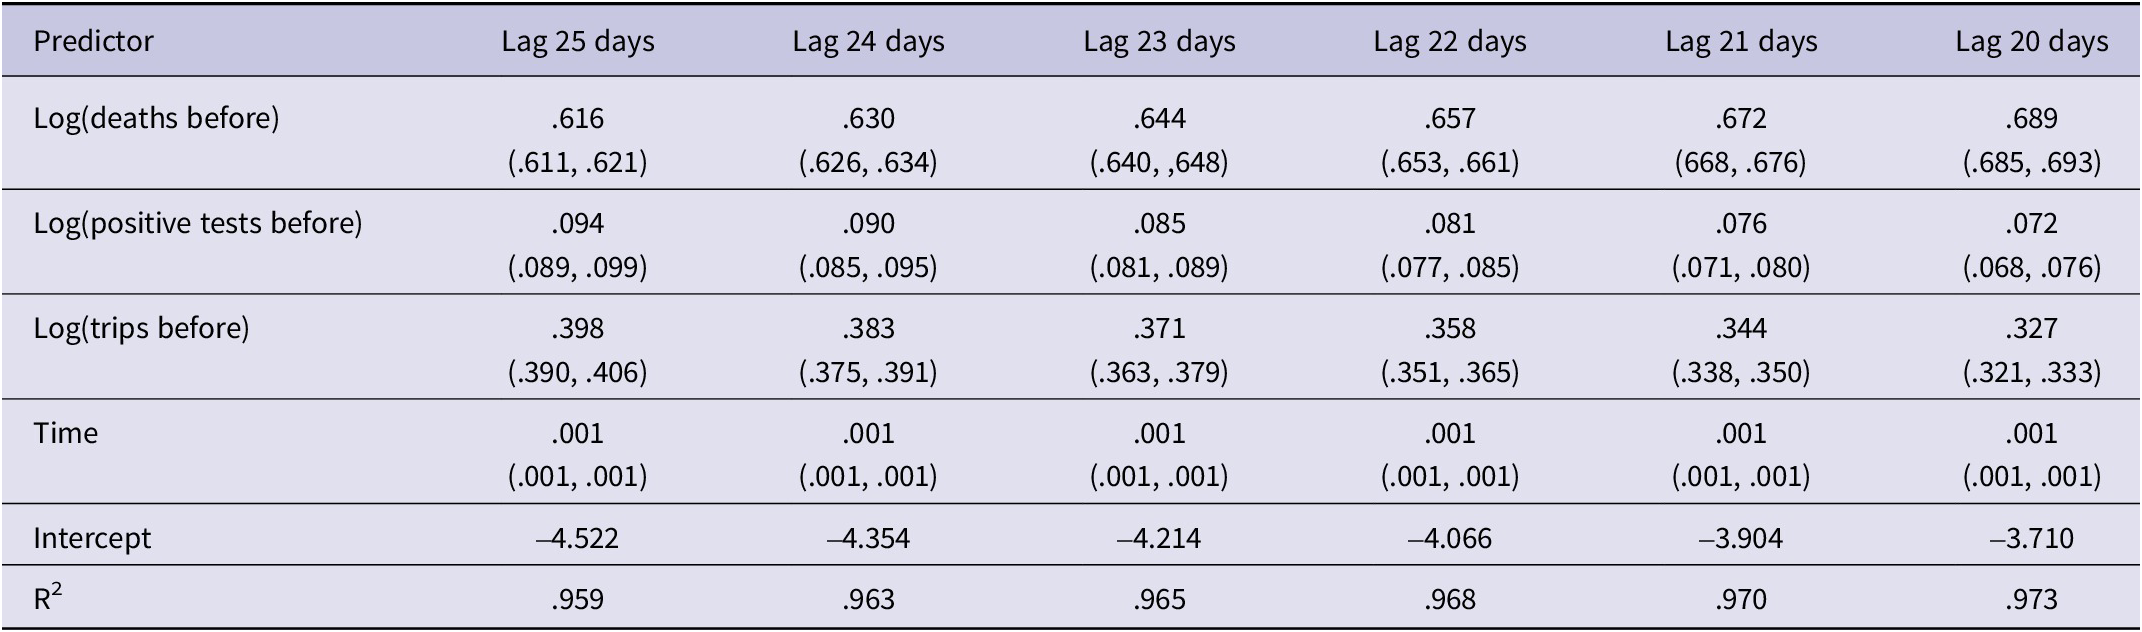
The association of the predictor variables and deaths (Table 3) is similar to those noted for cases, but with longer lag times. The regression coefficients on log(trips) and log(positive tests) increased as lag time increased and the coefficient on prior deaths decreased. The near-perfect goodness of fit (R Reference Robertson 2 > .95) is substantially higher in the analysis of deaths compared to cases, perhaps because the diagnoses are more definitive (Table 3).
Regression coefficients and 95% confidence intervals of predictors of log(COVID-19 daily deaths) in specified lag times, US states March 2020–May 2021
To assess the potential for distortion of the regression coefficients due to collinearity among predictor variables, the correlations in Table 4 were examined. Although the counts of positive and negative tests were strongly correlated, they were not used in the same equations. The other correlations were low enough that distortion is unlikely (Table 4).
Correlation coefficients among predictor variables

The association of percent positive and negative tests per population is displayed in Figure 1. Although low positivity occurred on many days when negative tests were low, positivity was generally lower when negative tests per population were relatively high (Figure 1).
Percent positive of daily tests by negative tests per 1000 population, US States March 2020-May 2021.

Limitations
Although definitive conclusions about individual decisions and behavior cannot be reached from correlations in aggregated data, the time sequences and plausibility support the noted inferences. If testing were a response to an increase in cases and deaths, it would increase after surges in cases and deaths, not precede them, and would not become increasingly correlated as more time passed. The type of tests used at public, on-demand testing sites varied in place and time. The Food and Drug Administration did not approve rapid antigen tests until December 2020, before which the tests were mainly PCR. Although the reliability of tests varies by type, it is the result that the recipient receives that likely influenced travel. A false negative that promoted travel could spread the virus by the recipient while a true negative could promote travel that increased the risk of exposure.
Discussion
These results support the hypothesis that on-demand testing contributed to the spread of the pandemic coronavirus. Increases in negative tests were associated with increased subsequent trips away from home and the trips were associated with subsequent increased cases and deaths. The results are plausible given that news outlets were quoting testing advocates urging people to get free tests provided by the government at pharmacies and drive-thru sites, 8 - 10 saying that a negative test would allow people to return to normal activities.Reference Mina and Phillips 11 Mutually agreed-upon testing before gatherings of small groups may be beneficial, but a negative test does nothing to protect the tested person who is subsequently exposed to infected strangers while shopping or attending larger gatherings.
The cases and deaths in this study preceded the delta and omicron mutations that were more easily transmitted. The surge in cases in the fall of 2020 was higher than when the delta variant was prevalent in the following year. The more intense fall-winter surge in 2022 when the omicron variant was prevalent was likely the result of increased transmissibility, but one cannot be infected without being exposed and the data in this study suggest that exposure was partly a function of travel by people who tested negative.
This study adds to the evidence that without sufficient tracing and quarantine, on-demand testing exacerbated the spread of SARS-CoV-2 and explains part of the large variation among and within countries.Reference Robertson 2 To the author’s knowledge, the correlation of negative tests with subsequent trips outside dwellings has not been documented. Although aggregate data do not allow specification of individual contacts during trips and subsequent infections, that finding is a reasonable explanation for the correlation of increases in negative tests with subsequent surges in cases, hospitalizations, and deaths. Also, while positive tests predicted increases in cases and deaths, the reduced positivity when negative tests per population were relatively high suggests that low positivity could have resulted in the reduction of countermeasures when needed most.
Testing can be effective when contact tracing and quarantine are vigorously enforced.Reference Ayouni, Maatoug and Dhouib 12 However, on most days in US states, there were too few tracers and a lack of cooperation in identifying the contacts by many of the infected. Of the 20 256 state days in this study, the contact tracing effort was indicated as “comprehensive” on only 16%.Reference Wade, Petherick and Kira 13 The degree to which the testing and tracing system was overwhelmed is suggested by the number of cases relative to the number of tracing personnel on a given day in each US state. Based on the estimated time needed by tracers per case in a US Centers for Disease Control and Prevention (CDC) manual, on about 7 of every 10 days, there were more cases than personnel had enough time to interview the infected and their contacts.Reference Robertson 2
A CDC study of contact tracing in 13 health departments in 11 US states and an Indian Health Service unit found that less than 60 percent of people who tested positive were interviewed and only a third of those named contacts. Of the contacts traced, less than half agreed to follow up.Reference Lash, Moonan and Byers 14 That means that only a small minority of the contacts of people with positive tests were traced and tested, much less advised to quarantine. Without special quarantine facilities, people of limited means living with others had no place to isolate themselves.
Another team of researchers at the CDC studied data on contact tracing in 23 jurisdictions for 60 days in the winter of 2020-2021. Based on the results, they estimated that the procedure resulted in 1.11-1.36 million fewer cases and 27 231-33 527 fewer hospitalizations.Reference Rainisch, Jeon and Pappas 15 However, persons who tested negative were not included. There were about 7 negative tests for each positive test that winter. While the study supports the conclusion that some people complied with public health recommendations, to obtain the overall net effect of testing and tracing, the consequences of travel and subsequent infections after negative tests would have to be subtracted from the estimate.
In the US, resistance to mandatory and voluntary public health measures was politicized and exacerbated by disinformation disproportionately among Trump voters.Reference Shen and Kejriwal 16 -Reference Hariharan, Dhanuka and Kim 17 COVID-19 deaths were more frequent per population in counties with higher percentages of the vote for Trump in 2016, but that correlation was independent of the correlation to negative tests.Reference Robertson 2 Various publications and a Senate committee report on the US government and health care system’s shortcomings in preparedness for and response to the pandemic have uniformly ignored the role of on-demand testing other than to infer that there was not enough testing.Reference Birx 18 - 23 Failure to recognize the unintended consequences of interventions to improve health or other desirable outcomes is likely to lead to their repetition.Reference Turcotte-Tremblay, Gali and Ridde 24 -Reference Suckling, Hoolohan and Soutar 25
Testing is an essential tool for differential diagnosis and is useful for screening in some settings. For example, testing caregivers in nursing homes was associated with reduced mortality,Reference McGarry, Gandhi and Barnett 26 and reduced cases in “test-to-stay” programs allowed school attendance to increase.Reference Campbell, Benjamin and Mann 27
On-demand testing for a highly infectious virus overwhelmed the tracing system and likely misled those with negative tests to believe that moving about was safe. Self-selection to be tested likely contributed to misleading low positivity and loosening of countermeasures. Individual testing is not necessary to inform public health policy. Wastewater testing can be used to monitor prevalence in aircraftReference Shingleton, Lilly and Wade 28 and communities. 29 The omicron variant was detected in wastewater more than a week before being found in a case.Reference Kirby, Welsh and Marsh 30
Unanticipated public reactions to testing and other COVID-19 policies are not unique. Nor are failures of scientists to monitor for and acknowledge unanticipated consequences in public health and other attempts to change behavior.Reference Robertson 31 Close monitoring of whether people adhere to recommendations and mandates, or behave in unanticipated ways that increase risks, is essential to ensure that policies are effective.
Data availability statement
Links to the data used in this study are provided in the methods section and the merged dataset is available upon reasonable request.
Funding statement
Neither the author nor the University received funding for this study.
Competing interests
The author has no financial or other interests that would be influenced by the publication of this paper.


 Open access