The purpose of this article is to make the case that (a) despite an increasing focus on humanistic and humanitarian issues, industrial-organizational (I-O) psychologyFootnote 1 has a fundamental and pervasive bias toward people who are relatively free from the worst ravages of poverty; (b) such a bias presents scientific, practice-related, and moral problems for I-O psychology; and (c) the capability approach championed by the Nobel Prize–winning political philosopher and economist Amartya Sen (Reference Sen1999) provides both moral justification to overrepresent people living in poverty and a useful conceptual guide for I-O psychology as it engages with humanitarian concerns.
We make the above case in four main sections. First, we discuss the nature of I-O psychology's transition away from predominately corporate and managerial interests toward an increasing adoption of the scientist–practitioner–humanist model (Lefkowitz, Reference Lefkowitz1990) and the discipline's increasing engagement with humanitarian concerns. We view humanitarian concerns as a subset of humanist concerns, with “humanist” referring to the consideration of all aspects of human well-being, whereas “humanitarian” relates more specifically to basic or fundamental aspects of well-being (e.g., alleviating extreme poverty, assisting populations in war-torn areas, and responding to natural disasters). Second, we synthesize existing commentaries to argue that I-O psychology's perspective can be broadly described as POSH,Footnote 2 that is, biased toward Professionals (Bergman & Jean, Reference Bergman and Jean2016), Official work in the formal economy (Saxena et al., Reference Saxena, Sall, Scott, Rupp, Saari, Foster and Mallory2015), groups that are relatively Safe from discrimination (Ruggs et al., Reference Ruggs, Law, Cox, Roehling, Wiener, Hebl and Barron2013), and citizens of High-income countries (Gelfand, Leslie, & Fehr, Reference Gelfand, Leslie and Fehr2008). Together these commentaries help to reflect a pervasive neglect of people living in poverty. We define poverty not just as a dearth of financial resources but as a multidimensional phenomenon characterized by a lack of personal freedoms to participate effectively in society (Sen, Reference Sen1999).Footnote 3 We also argue why a neglect of people living in poverty is a problem for I-O psychology's science and practice. Third, we introduce the concept of human capabilities and demonstrate its usefulness in helping to balance concerns for universal human justice and problems of cultural relativity, especially in humanitarian situations. We relate the concept of capabilities to concepts in I-O psychology and make a case for its utility to the discipline. Fourth, we provide examples of how lines of research in I-O psychology could usefully include the concept of capabilities via three hypothetical scenarios. Finally, we discuss key limitations to our methodology and assumption and conclude with an expression of our hope that this article assists in I-O psychology's conversation about the discipline's role in promoting social justice.
From Handmaidens to Humanitarians?
In 1960 Loren Baritz reviewed the history of industrial psychology in the United States in the book The Servants of Power and wrote the following memorable critique:
Many industrial social scientists have put themselves on auction. The power elites of America, especially the industrial elite, have bought their services—which, when applied to areas of relative power, have restricted the freedom of millions of workers. Time was when a man knew that his freedoms were being curtailed. Social scientists, however, are too sophisticated for that. The fires of pressure and control on a man are now kindled in his own thinking. Control need no longer be imposed. It can be encouraged to come from within. (pp. 209–210)
Over 50 years later, Milt Hakel, in the book Using Industrial-Organizational Psychology for the Greater Good: Helping Those Who Help Others, asked:
What should we make of the “servants of power” critique . . .? The things we study no longer seem as simple as they appeared back then. Our domain has expanded, and our conceptualizations have expanded as well. It is our calling to be organizational scientists, engineers, and technologists, contributing and refining knowledge that can be applied for the greater good. (2013, p. 565)
We agree with Hakel (Reference Hakel, Olson-Buchanan, Koppes Bryan and Foster Thompson2013) and believe that I-O psychology has, in the spirit of Kornhauser (Reference Kornhauser1930), begun to leave the “absurd situation” of serving as handmaidens to corporate/managerial interests (p. 433). This has been accomplished, in part, by researchers and practitioners who more readily adopt a broader array of priorities and values, and in another part, by managers who adopt a more diverse set of priorities and values (Porter & Kramer, Reference Porter and Kramer2011). In terms of the broadening of I-O priorities and values, we need look no further than the pages of this journal where we have seen calls for, and meaningful discussions of, moving beyond just talking about justice (Greenberg, Reference Greenberg2009; cf. Lefkowitz, Reference Lefkowitz2009), adopting a person-centric view of work (Weiss & Rupp, Reference Weiss and Rupp2011; cf. Lefkowitz, Reference Lefkowitz2011), considering how social responsibility can be integrated into core aspects of for-profit endeavors (Aguinis & Glavas, Reference Aguinis and Glavas2013; cf. Rupp, Skarlicki, & Shao, Reference Rupp, Skarlicki and Shao2013), and how to go about addressing pressing social injustices (Ruggs et al., Reference Ruggs, Hebl, Rabelo, Weaver, Kovacs and Kemp2016; cf. Chatterjee, Reference Chatterjee2016).
Despite our broad characterization of the field of I-O psychology as POSH, we recognize both the long and diverse history of countless I-O psychologists who have devoted themselves and their careers to humanist concerns (e.g., Follett, Reference Follett1919; Kanfer, Reference Kanfer1999; Kanter, Reference Kanter1977; Kornhauser, Reference Kornhauser1965; Likert, Reference Likert1967; Myers, Reference Myers1929). We also recognize an array of voices in psychology from lower-income countries and regions that represent important exceptions to our characterization (e.g., Cooper, Reference Cooper2014; Hechanova, Reference Hechanova, Foster, Gloss and Ward2012; Marai, Reference Marai, Foster, Gloss and Ward2013; Martín-Baró, Reference Martín-Baró1994; Mpofu, Reference Mpofu2002; Oppong, Reference Oppong, Foster, Gloss and Ward2013; Pandey, Reference Pandey2004). Furthermore, in our characterization of I-O psychology as POSH, we do not mean to imply that individual I-O psychologists come, necessarily, from POSH backgrounds or hold POSH sympathies but instead that the dominant narrative in the discipline holds a decidedly POSH bias.
Despite our optimism regarding the increasingly humanistic direction of I-O psychology, we are concerned that as the discipline addresses humanitarian concerns, its POSH bias might predispose it to unwitting harm. Our sense of concern arises due to the harm that can result from ostensibly well-meaning efforts to help or understand marginalized populations (Easterly, Reference Easterly2006; Freire, Reference Freire1970; Shouksmith, Reference Shouksmith, Carr and Schumaker1996; Trimble, Scharrón-del Río, & Casillas, Reference Trimble, Scharrón-del Río, Casillas, Leong, Comas-Dias, Hall, McLloyd and Trimble2014). In psychology, serious mistakes have already been made by “blaming the victim”—specifically, attributing the situational causes of poverty to the characteristics and character of individuals (Carr & MacLachlan, Reference Carr and Maclachlan1998; Misra & Tripathi, Reference Misra, Tripathi and Pandey2004). Such a damaging attribution can come from either explicit or implicit signals; as an example of the latter, attributing the cause of poverty to an individual can happen through a disproportionate focus on individuals living in poverty and a neglect of the contextual factors that help to create poverty. Future mistakes could result from an uncritical awareness of the implicit values held by the discipline of I-O psychology (see Lefkowitz, Reference Lefkowitz2003) and the strong power dynamics that exist in humanitarian aid and international development work (MacLachlan, Carr, & McAuliffe, Reference MacLachlan, Carr and McAuliffe2010).
Despite these concerns we believe that psychology, and in particular I-O psychology, has much to add to humanitarian efforts (e.g., see a review by Carr et al., Reference Carr, Thompson, Dalal, de Guzman, Gloss, Munns and Steadman2014). I-O psychology as a discipline is already helping to address salient humanitarian priorities as evidenced by such prominent developments as the Society of Industrial and Organizational Psychology (SIOP)’s establishment of consultative status with the United Nations (Scott, Reference Scott2011), the adoption of the United Nations Global Compact by I-O psychology programs (Mallory et al., Reference Mallory, Rupp, Scott, Saari, Foster, Osicki and Sall2015), contributions made by I-O psychologists to a report by the United Nations Development Programme (UNDP, 2014) on the role of the private sector in poverty reduction, and the prominent role of an I-O psychologist in the development of an initiative to deliver evidence-based solutions to the United Nations Secretary General (United Nations, 2016). In addition, an international organization of I-O psychologists has been established expressly for the purpose of devoting the discipline to humanistic and humanitarian endeavors (www.gohwp.org; McWha et al., Reference McWha, Gloss, Godbout, Marai, Abdul-Nasiru, Foster and Berry2013). Active I-O psychologists in that group have contributed to at least five edited volumes on the subject since 2010 (Carr, MacLachlan, & Furnham, Reference Carr, MacLachlan and Furnham2012; MacLachlan, Carr, & McCauliffe, Reference MacLachlan, Carr and McAuliffe2010; McWha-Hermann, Maynard, & O'Neill Berry, Reference McWha-Hermann, Maynard and Berry2016; Olson-Buchanan, Koppes Bryan, & Foster Thompson, Reference Olson-Buchanan, Koppes-Bryan and Foster Thompson2013; Reichman, Reference Reichman2014). Chapters in those books have covered a range of topics, including entrepreneurship training in lower-income countries (Bischoff, Gielnik, & Frese, Reference Bischoff, Gielnik, Frese, Olson-Buchanan, Koppes Bryan and Foster Thompson2014); the interrelationship of gender, work, and poverty (Schein, Reference Schein, Carr, MacLachlan and Furnham2012); and the psychological health of humanitarian aid and development workers (Chuen Foo, Reference Chuen Foo, McWha-Hermann, Maynard and O'Neill Berry2016).
The Poverty of a POSH Perspective
I-O psychology's POSH perspective is composed of interrelated biases (Bergman & Jean, Reference Bergman and Jean2016; Gelfand et al., Reference Gelfand, Leslie and Fehr2008; Ruggs et al., Reference Ruggs, Law, Cox, Roehling, Wiener, Hebl and Barron2013; Saxena et al., Reference Saxena, Sall, Scott, Rupp, Saari, Foster and Mallory2015) that have put the predominate focus of the discipline on people in the world who are able to escape the worst ravages of poverty. Similar biases have been observed in the psychological and behavioral sciences. Arnett (Reference Arnett2008) made the case that American Psychological Association journals have been overwhelmingly focused on populations from relatively privileged sectors of the United States. Ryan and Gelfand (Reference Ryan, Gelfand, Leong, Pickren, Leach and Marsella2012) assessed the international nature of I-O psychology via membership in professional associations, author associations, and the foci and samples of journal articles, broadly concluding that the discipline's international focus is limited. In addition, Henrich, Heine, and Norenzayan (Reference Henrich, Heine and Norenzayan2010) made the case that the behavioral sciences are overly focused on populations from Western, Educated, Industrialized, Rich, and Democratic (WEIRD) societies. Underscoring the problematic nature of a WEIRD bias, Henrich and colleagues (Reference Henrich, Heine and Norenzayan2010) cited evidence that behavioral phenomena—from visual perception and moral reasoning to the heritability of intelligence—differ meaningfully between WEIRD populations and other populations.
Below, we discuss and visualize how each dimension of I-O psychology's POSH bias relates to poverty. We do not mean to present evidence regarding I-O psychology's POSH bias per se, because this point has been made (Bergman & Jean, Reference Bergman and Jean2016; Gelfand et al., Reference Gelfand, Leslie and Fehr2008; Ruggs et al., Reference Ruggs, Law, Cox, Roehling, Wiener, Hebl and Barron2013; Saxena et al., Reference Saxena, Sall, Scott, Rupp, Saari, Foster and Mallory2015); instead, we wish to illustrate how a POSH bias captures I-O psychology's neglect of the people most exposed to poverty. To accomplish this, we utilize the country level of analysis as a window on poverty. We must state at the outset that we believe that meaningful gradients of poverty exist on multiple levels of analysis. The POSH acronym highlights at least four levels, namely those of individuals in work units, economies, social groups, and countries (respectively). It is clear that poverty exists throughout the world, including in high-income countries (e.g., DeNavas-Walt & Proctor, Reference DeNavas-Walt and Proctor2015), and even relative forms of poverty (as opposed to poverty defined by a fixed level of prosperity) are concerns for health and well-being (Wilkinson & Pickett, Reference Wilkinson and Pickett2006). However, as is clear by reviewing variability in human welfare around the world (see ILO, 2014; UNDP, 2015a; World Bank, Reference Bank2012), substantial variability in poverty exists across countries. In addition, country names and nationalities are readily codifiable, and many indices of poverty are collected on country levels of analysis (UNDP, 2015b). To help overcome the limitations of using a country level of analysis, we rely predominately on intracountry indices (e.g., indices of intracountry inequality and the percentage of the population or workforce in a country affected by different forms of poverty).
To estimate the connection between a POSH bias and poverty, we measured the extent to which 142 countries featured in the United Nations Development Programme's Human Development Report (UNDP, 2015a) are represented in I-O psychology literature over the past 100 years (1917–2016). We then visually represent countries (Figures 1–4) according to their standing on aspects of poverty that are conceptually linked to one of the four POSH dimensions. We also represent each country by its share of the world population and whether the I-O literature overrepresents or underrepresents it in comparison to its share of the world's population (or alternatively, whether the country is not represented at all). A more detailed explanation of our methodology is included in the Appendix. We conceive of “representation” of a country in the I-O psychology literature broadly. We count all articles in which a country context or nationality is mentioned at least once in English (we excluded instances where prominent psychological professional associations and journals were mentioned, e.g., the American Psychological Association or the American Psychologist). Although previous analyses of a country bias have focused on such criteria as the origin of samples or the nationality of authorship (e.g., Mondo & Kraut, Reference Mondo and Kraut2010; Myers, Reference Myers2016; Ryan & Gelfand, Reference Ryan, Gelfand, Leong, Pickren, Leach and Marsella2012), we believe capturing all mentions of a country context or nationality helps to represent whether, and to what extent, the population in that country has been integrated into I-O psychology's dominant narrative (herein its perspective).
Example of the relationship of a professional bias to a bias away from poverty. Population figures are in millions of people. Figures feature countries represented according to (1) the percentage of men or women receiving a secondary education (ages 25–65); (2) whether the country's representation in I-O literature is greater (well-represented) or smaller (underrepresented) than the country's share of the world's population (if a country was not represented at all, it is categorized as unrepresented); and (3) the size of the country's population, which is reflected in the radius of the bubble reflecting that country. Next to each figure, the total country count (N-country), the total population covered (N-population), group country count (n-country), group population covered (n-population), and group country-level mean on the variable in question (M-country) are displayed. For more information about the methodology underlying these calculations, see the Appendix. All statistics are from UNDP (2015b).

Example of the relationship of a bias toward official work in a formal economy with a bias away from poverty. Population figures are in millions of people. Figures feature countries represented according to (1) the percentage of the population in vulnerable employment (including own-account workers and unpaid family workers) or the percentage of 5–14-year-olds employed more than 1 hour per day; (2) whether the country's representation in I-O literature is greater (well-represented) or smaller (underrepresented) than the country's share of the world's population (if a country was not represented at all, it is categorized as unrepresented); and (3) the size of the country's population, which is reflected in the radius of the bubble reflecting that country. Next to each figure, the total country count (N-country), the total population covered (N-population), group country count (n-country), group population covered (n-population), and group country-level mean on the variable in question (M-country) are displayed. For more information about the methodology underlying these calculations, see the Appendix. All statistics are from UNDP (2015b).

Example of the relationship of a bias toward groups that are relatively safe from discrimination with a bias away from poverty. Population figures are in millions of people. Figures feature countries represented according to (1) standardized values of life expectancy inequality within country (higher value = greater inequality) or standardized values of gender inequality within country based on health, workforce participation, and empowerment (higher value = greater inequality); (2) whether the country's representation in I-O literature is greater (well-represented) or smaller (underrepresented) than the country's share of the world's population (if a country was not represented at all, it is categorized as unrepresented); and (3) the size of the country's population, which is reflected in the radius of the bubble reflecting that country. Next to each figure, the total country count (N-country), the total population covered (N-population), group country count (n-country), group population covered (n-population), and group country-level mean on the variable in question (M-country) are displayed. For more information about the methodology underlying these calculations, see the Appendix. All statistics are from UNDP (2015b).

Example of the relationship of a bias toward high-income countries with a bias away from poverty. Population figures are in millions of people. Figures feature countries represented according to (1) the percentage of the workforce qualified as working poor (< $2/day) or average life expectancy (in years); (2) whether the country's representation in I-O literature is greater (well-represented) or smaller (underrepresented) than the country's share of the world's population (if a country was not represented at all, it is categorized as unrepresented); and (3) the size of the country's population, which is reflected in the radius of the bubble reflecting that country. Next to each figure, the total country count (N-country), the total population covered (N-population), group country count (n-country), group population covered (n-population), group country-level mean (M-country), and group population-weighted mean (M-population) are displayed. For more information about the methodology underlying these calculations, see the Appendix. All statistics are from UNDP (2015b).

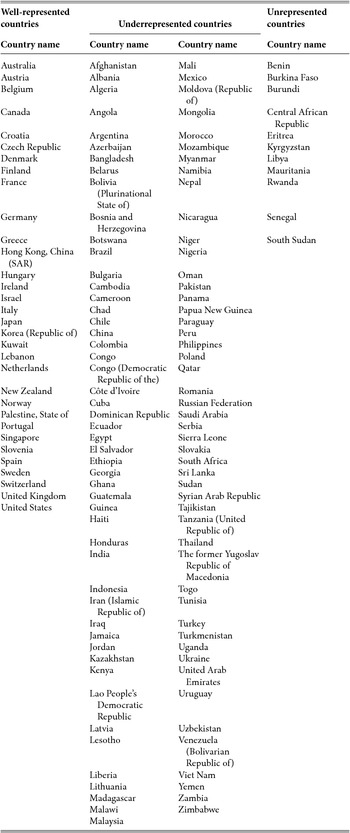
Out of the 142 countries in our analyses, 32 were categorized as “well represented”; these countries accounted for 1.04 billion people, or 14.36% of the world's population in 2014. We categorized 99 countries as “underrepresented,” and they accounted for 6.00 billion people (82.87% of the world). Finally, there were 11 countries that were not represented in our searches, and they accounted for 104 million people (1.44% of the world). We excluded from our categorization all microstates (n = 44), which we defined as countries below 2 million people; together these countries accounted for 26.2 million people (0.36% of the world). Altogether the 142 countries included in our search accounted for 7.14 billion people or 98.62% of the estimated 7.24 billion people in the world in 2014 (UNDP, 2015b).
Professionals
Bergman and Jean (Reference Bergman and Jean2016) have demonstrated that samples in I-O psychology overrepresent “professionals” (including managers, technicians, and salaried workers) in comparison to “workers” (including agricultural/fishery workers, craft/trade workers, and other low-skill personnel and wage earners). Being a professional comes with multiple protections from poverty. Professionals tend to earn more than workers and have a steadier income due to the higher prevalence of salaried versus wage-based work (Bergman & Jean, Reference Bergman and Jean2016). Professionals tend to engage in forms of work that are not as physically taxing or dangerous (UNDP, 2015a). In addition, professionals tend to develop higher levels of human capital on the job (see Organization for Economic Cooperation and Development [OECD], 2013). We believe that the strongest connection between professionalization and poverty is that professionals tend to hold advanced and broad skills that they can leverage for financial capital in local and global markets. Consequently, the lack of a basic education sufficient to facilitate the development of such skills could be considered a manifestation of poverty (see Nussbaum, Reference Nussbaum2003; Sen, Reference Sen1999). We are not arguing that workers without a professional status are inherently impoverished; instead, we are arguing that those without an education sufficient to support the realistic option of a professionalized job are impoverished. By focusing on professionals, I-O psychology tends not to include the perspective of people with such low levels of educational attainment/opportunity.
As noted by Bergman and Jean (Reference Bergman and Jean2016) and by Myers (Reference Myers2016), professionals tend to represent an even smaller percentage of the workforce in lower-income countries. In parallel to this trend, a far smaller percentage of men, and especially women, tend to have attained more than a rudimentary level of education (which we define as less than a secondary level of education). As displayed in Figure 1, the countries that are relatively well-represented in I-O psychology have higher levels of secondary schooling (85.82% for men, 83.11% for women) than unrepresented countries (27.67%, 22.32%) and underrepresented countries (53.80%, 46.32%), which account for 5.73 billion people. Because of the importance of education to effective participation in society, a bias toward professionals contributes to a neglect of people who do not have the opportunity to participate in the wide range of career and social opportunities available to others in society. Therefore, according to our definition of poverty, which is based upon an individual's ability to effectively participate in society, a bias toward professionals appears to reflect an underlying neglect of people living in poverty.
Official Work in a Formal Economy
Saxena and colleagues (Reference Saxena, Sall, Scott, Rupp, Saari, Foster and Mallory2015) describe the limited extent to which literature in I-O psychology has considered work in the informal economy. In line with the International Labor Organization's definition (ILO, 2013), we define work in the informal economy as activities that are not covered, or are insufficiently covered, by formal legal and political arrangements. Categories of work in the informal economy include members of informal producers’ cooperatives, unpaid family workers, home-based producers, and casual wage workers. Being employed in the formal sector in an “official” or legally recognized job tends to be associated with a higher likelihood of protection from poverty due to the regular payment of wages, governmentally guaranteed social protections, formal labor contracts, and legal protections against discrimination (ILO, 2013). We are unaware of an empirical estimation of the extent to which I-O psychology research has considered formal versus informal economic contexts. This is perhaps not surprising given that data on informal work are limited (ILO, 2014). For example, country estimates of informal employment could only be obtained from the United Nations Development Programme (2015b) on 36 countries. Of these 36 countries, all have been either underrepresented or unrepresented in the I-O literature. To overcome data limitations on the informal economy, we utilized two measures to both estimate the extent to which I-O psychology might be biased toward formal versus informal work and to connect the idea of formality to poverty. In Figure 2, we utilize a measure of the extent to which people in a given country are in “vulnerable employment.” This category includes both self-employed workers without full-time employees and unpaid family workers—groups that make up large shares of work in the informal economy (ILO, 2014). Among the 22 well-represented countries with available data, the average rate of vulnerable employment (as a share of the workforce) is 12.09%. In contrast, it is 29.87% for the 27 underrepresented countries and extends to as high as 74% in Tanzania.
In addition to vulnerable employment, Figure 2 provides figures on child labor (defined as children between the ages of 5 and 14 years working more than 1 hour per day). Child labor takes place both legally and illegally throughout the world, often in the informal economy (UNDP, 2015a). The prevalence of child labor is strongly associated with poverty due to its tendency to interfere with children's educational, social, and physical development, and its tendency to greatly increase the risk that children will fall victim to physical injury or sexual exploitation (UNICEF, 2016). The average rate of child labor for the two well-represented countries with available statistics (Lebanon and Portugal) was 2.65%. In contrast, the average rate is 15.05% for the 71 underrepresented countries with available data and 21.31% in unrepresented countries. The highest rate, in Cameroon, is 41.7%.
In summary, a bias in I-O psychology toward formal work in the official economy indicates an omission of people from the I-O literature whose forms of working make them especially vulnerable to poverty.
Safety from Discrimination
Ruggs and colleagues (Reference Ruggs, Law, Cox, Roehling, Wiener, Hebl and Barron2013) argue that I-O psychology has missed an opportunity to understand and improve the welfare of marginalized groups that face a heightened risk of discrimination, including the LGBT community; the young and old; those with disabilities; and those facing discrimination due to their race, religion, weight, or marital status. Discrimination is closely related to poverty, as it is a powerful driver of social and economic exclusion from society (Dalal, Reference Dalal2010). Moreover, the negative effects of discrimination reverberate through generations (Umberson et al., Reference Umberson, Olson, Crosnoe, Liu, Pudrovska and Donnelly2017). The full extent to which I-O psychology has neglected consideration of populations that are susceptible to discrimination is not fully apparent until one looks across countries. The multifarious nature of discrimination can impact directly or indirectly upon discriminated populations in a variety of ways. We attempt to capture the overall impact of discrimination on different populations across countries by measuring intracountry inequality in life expectancy (UNDP, 2015b)—operating on the assumption that great inequality in life expectancy is likely to be due, at least in part, to forms of political, legal, social, or economic discrimination. Conversely, we reason that in countries with relatively high levels of equality in life expectancy, discrimination is on average likely to carry with it less severe consequences and/or to be less prevalent. Although there are multiple causes of inequalities in life expectancy, many of those causes (e.g., policies regarding taxation and healthcare) seem likely to be tied either directly or indirectly to stigma or bias toward a particular group (e.g., toward certain ethnicities, people with disabilities, or people living in poverty; see Singh & Siahpush, Reference Singh and Siahpush2006). As seen in Figure 3, countries that are well-represented in the I-O literature exhibit a low average level of inequality in life expectancy (–1.02, standardized). Indeed, all countries that are well-represented in I-O psychology have below-average levels of inequality in life expectancy. In contrast, underrepresented countries and unrepresented countries have higher average levels (0.23 and 1.17, respectively).
Perhaps the most prevalent form of discrimination in the world is discrimination tied to gender (UNDP, 2015a). To provide a picture of the extent of gender discrimination across countries, we again utilize a measure of intracountry inequality, this time based on factors relating to combined measures of female health, labor-market participation, and empowerment. As seen in Figure 3, 30 well-represented countries in I-O psychology exhibit below-average standardized values of gender inequality (–1.28). Only two well-represented countries (Kuwait and Lebanon) exhibit above-average levels of gender inequality, but their rates are relatively low (0.11 and 0.10, respectively) compared to the highly populous and underrepresented country of India (1.03) and the underrepresented country with the highest overall rating on gender inequality: Yemen (1.98).
In summary, by analyzing statistics that we believe might indirectly and directly reflect discrimination (life expectancy inequality and gender inequality, respectively), we have worked to illustrate how much more prevalent discrimination is in countries outside of those that are well-represented in I-O psychology literature. Because of the close link between discrimination and exclusion from opportunities in society (Dalal, Reference Dalal2010), this trend is another way in which I-O psychology has not engaged with the people who are the most exposed to poverty.
High-Income Countries
Gelfand and colleagues (Reference Gelfand, Leslie and Fehr2008) argue that for organizational psychology to prosper, it needs to adopt a more global perspective. Although an important part of such a global perspective involves developing deeper insight into how culture affects phenomena in organizational psychology, Gelfand and colleagues (Reference Gelfand, Leslie and Fehr2008) also point out that I-O psychology is biased toward the perspective of relatively affluent nations with corresponding high levels of “human development” and “postmaterialist” values (see Inglehart & Welzel, Reference Inglehart and Welzel2005; UNDP, 1990). Aggregate levels of income are often indicators of the prevalence of absolute levels of financial poverty. However, a low level of income in a country does not, necessarily, indicate a higher level of poverty. This point is illustrated in the debate over the appropriateness of measuring societal progress by way of overall happiness, as opposed to the more traditional measures of economic prosperity or growth (Helliwell, Layard, & Sachs, Reference Helliwell, Layard and Sachs2012). Nevertheless, it appears that a good indication of poverty is the number of people who do not earn enough to sustain basic levels of health and well-being. Many such measures have been proposed (Alkire, Reference Alkire2010), but one that is particularly relevant to I-O psychology is the percentage of a country's active workforce who lives on wages below the threshold of $2 per day—adjusted for purchasing power parity. These people are referred to as the “working poor.” As can be seen in Figure 4, with only one exception (the State of Palestine at 3%), data on the working poor are not available for countries that are well-represented in I-O psychology. In contrast, we can see that the vast majority of the world's population (at least 5.74 billion) lives in countries where, on average, over one-third of workers lives on less than $2 per day. In the unrepresented country of Burundi, this figure is 94.80%.
With insufficient levels of income—often while actively employed—it can be difficult to acquire adequate nutrition, healthcare, and instruments of physical comfort and security (UNDP, 2015a). The net effect of such deprivation inevitably manifests in a country's life expectancy, preventing people from enjoying the numerous opportunities that are afforded to people who experience old age. As seen in Figure 4, the life expectancies for all countries that are well-represented in the I-O literature are at or above 72 years of age, with an average of 80.69 years. In contrast, the average life expectancy for populations in countries that are unrepresented in I-O psychology is 61.92 years of age. People in the underrepresented country of Lesotho hold an average life expectancy of 49.8 years. In summary, levels of economic and financial prosperity on a country level of analysis are linked to poverty, not only because such indices reflect variation in income but also because the conditions in those countries tend to constrain average life expectancies.
The Problem of Poverty for Science and Practice
We now turn to the reasons why a relative neglect of poverty is a problem for science and practice in I-O psychology. As before, we acknowledge and attempt to synthesize observations by previous commentators who have done an excellent job of reviewing problems associated with the various facets of I-O psychology's POSH bias (Bergman & Jean, Reference Bergman and Jean2016; Gelfand et al., Reference Gelfand, Leslie and Fehr2008; Green & Dalal, Reference Green and Dalal2016; Lefkowitz, Reference Lefkowitz2016; Ruggs et al., Reference Ruggs, Law, Cox, Roehling, Wiener, Hebl and Barron2013; Saxena et al., Reference Saxena, Sall, Scott, Rupp, Saari, Foster and Mallory2015). We divide this conversation into issues relating to research and practice. In terms of scientific concerns arising from a POSH bias, Bergman and Jean (Reference Bergman and Jean2016) provided a useful framework for this discussion by highlighting how a bias in the discipline might lead to overlooking (a) phenomena that happen to workers, (b) differences in construct meaning, and (c) the moderation of known relationships.
Without further considering populations affected by poverty, I-O is unlikely to consider a range of important experiences and influences in the workplace and broader society that are operative for the vast majority of the world's population. Gradients of poverty help to reflect meaningful change in an individual's social ecology. Socioecological psychology has helped to highlight how objective contextual factors linked to poverty—like pathogen prevalence and climate degradation—work to shape psychological phenomena (Oishi, Reference Oishi2014). In particular, Van de Vliert (Reference Van de Vliert2013) made a case for the influence of climato-economic habitats on a range of psychobehavioral adaptations. For example, in relatively economically impoverished settings, Van de Vliert (Reference Van de Vliert2013) argues that existence needs are emphasized in contrast to growth needs, survival goals are emphasized in contrast to self-expression goals, and stressors might more readily lead to threat appraisals than to challenge appraisals.
Due to differences in the types of needs, goals, and stressors between people living in poverty and those who do not, well-studied relationships or concepts in I-O psychology might not be as relevant in poverty-afflicted areas. As an illustration, consider the needs, goals, and stresses of a small-plot farmer in a lower-income country who relies on her crop both for the subsistence of her family and as a needs-based form of entrepreneurship. Questions of recruitment, selection, organizational development, and work attitudes like organizational commitment are probably not relevant to subsistence farming, at least in the same way as they are for professions in official jobs in higher-income countries. Moreover, a subsistence farmer's daily needs, goals, and stressors are likely to be meaningfully different than those commonly studied in I-O psychology. However, we assert that the benefits of research and practice in I-O psychology might be of as great, if not greater, benefit to impoverished workers than to large corporations. For example, I-O psychologists can assist in the effective design and delivery of information and communication technology (ICT) interventions for impoverished workers to help career and workforce development (Behrend, Gloss, & Foster Thompson, Reference Behrend, Gloss, Foster Thompson, Coovert and Foster Thompson2013), design and support the training of nascent entrepreneurs in lower-income countries (Gielnik & Frese, Reference Gielnik, Frese, Olson-Buchanan, Bryan and Thompson2013), and help to understand and support the motivation of health workers who serve populations living in poverty (Meyer, Kanfer, & Burrus, Reference Meyer, Kanfer, Burrus, McWha-Hermann, Maynard and O'Neill Berry2016).
It is also possible that the very meaning of variables among people living in poverty might be different than they are among people in contexts largely free from poverty. Perhaps the best example of this is an apparent difference in the meaning of financial success across gradients of poverty. In a comparison of the structure of goal content across 15 cultures, Grouzet and colleagues (Reference Grouzet, Kasser, Ahuvia, Dols, Kim, Lau and Sheldon2005) found that the goal of financial success was further from hedonism and closer to physical-safety goals in lower-income countries than in higher-income countries. Another example relates to the concept of discrimination. As highlighted by Gelfand and colleagues (Reference Gelfand, Leslie and Fehr2008), many contexts where I-O psychology have thrived enjoy relative freedom from pronounced warfare and social violence. Such forms of violence tend to predominate in lower-income settings with higher levels of inequality (Elgar & Aitken, Reference Elgar and Aitken2011). Thus, between-group discrimination might carry different undertones for those people both living in poverty and affected by historical hatred and ethnic hostilities (Gelfand et al., Reference Gelfand, Leslie and Fehr2008). Financial success and discrimination are just two concepts that might hold different meanings across gradients of poverty. Without appreciating these differences, I-O psychology might unwittingly misinterpret research findings or make recommendations that could be harmful to populations.
Not only might a POSH bias obscure certain phenomena or change the meaning of certain variables, but the moderating role of poverty might go underappreciated. In particular, based on both research and commentary in I-O psychology (Green & Dalal, Reference Green and Dalal2016; Meyer, Dalal, & Bonaccio, Reference Meyer, Dalal and Bonaccio2009; Meyer, Dalal, & Hermida, Reference Meyer, Dalal and Hermida2010) and scholarship from the field of development economics (Sen, Reference Sen1999), we propose that gradients in poverty are likely to be associated with variation in the extent to which individual freedom is constrained by situations. Green and Dalal (Reference Green and Dalal2016) highlighted that professionals are likely to enjoy different levels of situational strength than other workers. Situational strength can be defined as implicit or explicit cues provided regarding the desirability of various forms of behavior (Meyer et al., Reference Meyer, Dalal and Hermida2010). As discussed by Meyer and colleagues (Reference Meyer, Dalal and Hermida2010), situational strength can be divided into at least four dimensions: consistency, clarity, consequences, and constraints. In line with research on opportunity structures in the labor market and society that operate along socioeconomic gradients and provide salient constraints to behavior (Kreckel, Reference Kreckel1980; Tickamyer & Duncan, Reference Tickameyer and Duncan1990), we reason that the “constraint” dimension of situational strength is likely to exhibit a positive relationship with contexts highly affected by poverty. Furthermore, we claim that this trend is likely tied to all dimensions of a POSH bias because variation in poverty can be observed along the levels of work units, economies, social groups, and countries. To help illustrate this connection, we briefly provide some empirical evidence and theoretical reasoning.
In terms of the relationship between situational constraints and professional work, we adopted an empirical approach and utilized a scale of situational constraints built by Meyer and colleagues (Reference Meyer, Dalal and Bonaccio2009) that relies on data from the U.S. Department of Labor's Occupational Information Network (O*NET; www.onetcenter.org). As a proxy for the professional nature of work, we utilized typical educational requirements in an occupation. We observed a substantial negative correlation (r = –.61, n = 689, p < .001) between educational requirements and occupational situational constraints in support of Green and Dalal (Reference Green and Dalal2016)’s reasoning that professionals (who predominate in occupations with higher levels of education) would hold occupations with lower levels of situational strength. When it comes to the connection between social discrimination and situational constraints, we note the close conceptual connection between exclusion from society due to discrimination and the reduction in available ways one might be freely able to participate in that society (Dalal, Reference Dalal2010). In contrast, a negative association between situational constraints and levels of income on a country level of analysis is broadly supported by findings regarding changing social norms across levels of socioeconomic development. In particular, as has been noted by Inglehart and Welzel (Reference Inglehart and Welzel2005), higher levels of socioeconomic development are associated over time with increases in societal values for, and a greater incidence of, self-expression. In addition, it has also been observed that higher levels of discretionary income (owing to greater societal economic prosperity) facilitate a broader range of discretionary behavior (Sen, Reference Sen1999). Furthermore, aggregate levels of income within a country are associated with greater economic complexity—complexity that allows for a broadening of potential behaviors both for individuals and for firms (see Hidalgo, Klinger, Barabási, & Hausmann, Reference Hidalgo, Klinger, Barabási and Hausmann2007).
The relationship between poverty and situational constraints is relevant to I-O psychology because variation in situational strength has been shown to moderate relationships between individual differences and outcomes at work. For example, Meyer and colleagues (Reference Meyer, Dalal and Bonaccio2009) noted that the relationship between conscientiousness and job performance is stronger in occupations with lower levels of situational strength. The moderating role of poverty is also likely relevant outside of an organizational context. For example, Blustein, Kenna, Gill, and DeVoy (Reference Blustein, Kenna, Gill and DeVoy2008) has observed that core theories of career development that assume a degree of individual agency (see Brown & Lent, Reference Brown and Lent2016) might be less relevant for those without access to education and other socioeconomic opportunities. As an additional example, the extent to which entrepreneurial behavior is driven by the psychological traits and states of individuals (Rauch & Frese, Reference Rauch and Frese2007) might be limited in lower-income settings where more constricted needs-based forms of entrepreneurship abound (Estrin, Meyer, & Bytchkova, Reference Estrin, Meyer, Bytchkova, Casson, Yeung, Basu and Wadeson2006).
In terms of the problematic relationship between a POSH bias and professional practice, we observe that this bias is likely to limit I-O psychology's ability to intervene effectively in organizations and contexts that are highly affected by poverty. Research and practice can be connected in mutually beneficial ways under the right conditions (see Cascio, Reference Cascio2008), but even under such conditions, the relevance of I-O psychology could be limited by a mismatch in the context of research and the context of practice. A mismatch involving the implementation of research findings developed in contexts largely free of poverty but implemented in contexts affected by poverty might be particularly problematic for the future of practice of I-O psychology. Such a mismatch might lead to I-O psychology's tools being relatively less useful in settings with high levels of poverty, which also happen to be where the predominance of the world's economic growth is occurring. As seen in Figure 5, I-O psychology literature has underrepresented countries with higher average rates of economic growth (3.99%) than well-represented countries (1.74%). Furthermore, unrepresented countries exhibit the highest rates of growth at 4.22%. Thus, emerging markets for I-O psychologists’ employers and clients might be constrained by the discipline's POSH bias.
Example of the consequences of a POSH bias as it relates to economic growth. Population figures are in millions of people. Figures feature countries represented according to (1) growth in gross domestic product (GDP) in 2014 (UNDP, 2015b); (2) whether the country's representation in I-O literature is greater (well-represented) or smaller (underrepresented) than the country's share of the world's population (if a country was not represented at all, it is categorized as unrepresented; and (3) the size of the country's total GDP, which is reflected in the radius of the bubble reflecting that country. Next to each figure, the total country count (N-country), the total population covered (N-population), group country count (n-country), group population covered (n-population), group country-level mean (M-country), and group population-weighted mean (M-population) are displayed. For more information about the methodology underlying these calculations, see the Appendix. All statistics except those noted above are from UNDP (2015b).

Contexts affected by poverty present opportunities for I-O psychology practice, both with for-profit organizations and also for humanitarian organizations. Indeed, the two categories are increasingly related. As discussed by the UNDP (2014) report on the role of the private sector in poverty reduction, two prominent methods of both social change and private-sector growth are social entrepreneurship, which utilizes for-profit means for prosocial aims and inclusive business, which includes people living in poverty as clients, customers, and/or employees. The UNDP report outlined a role for I-O psychologist to better understand and accelerate these important drivers of social and economic prosperity through applied research—especially in the informal economy. However, the ability for I-O practitioners to seize the opportunity to engage with social entrepreneurship and inclusive business efforts in lower-income settings is likely contingent upon the discipline's greater engagement with the issue of poverty—and with those workers and organizations actively involved in the work of poverty reduction.
The Case for Human Capabilities
In the previous section, we made the case that I-O psychology's POSH bias reveals an underlying neglect of people and contexts affected by poverty. We also argued that this bias presents problems for I-O psychology's science and practice. However, we believe that the most compelling reason why I-O psychology should work to better understand poverty is the moral imperative to end it. In 2009, Greenberg made the case that I-O psychology should go beyond studying injustice by more readily intervening to promote justice in the world of work. Greenberg (Reference Greenberg2009) cited multiple reasons why interventions have not been more readily adopted, including that managers are unaware of justice problems, the “myth” of moral objectivity in applied science, the difficulty of intervening in organizational systems, and the belief that promoting justice will not help to advance theory. In response to Greenberg (Reference Greenberg2009), Lefkowitz (Reference Lefkowitz2009) further pointed out that I-O psychologists have produced relatively few interventions because consideration for distributive justice has to a certain extent been displaced by concerns for procedural justice, because the discipline's managerial bias discourages intervening on behalf of employees, and because organizational justice has been conceived of as a perceived phenomenon instead of an actual phenomenon. Lefkowitz (Reference Lefkowitz2009) concludes:
I am not suggesting that we abandon our training as scientists who aim to describe and explain human behavior. However, that enterprise doesn't preclude our also adopting moral positions that can be informed by our particular perspectives as psychologists and students of social organization. “But” you say, “that's not science, and anyway—whose notion of ‘justice’ should prevail?” To which I reply, “Yes, that's a good question. Welcome to the fray. Where have you been till now? There's lots to talk about.” (p. 224)
We respond to Lefkowitz's (2009) dialectic by proposing a notion of justice that we believe is the right one to prevail as I-O psychology engages with humanitarian causes. We sidestep relitigating the debate over whether I-O psychology inevitably holds a particular set of values (it does; see: Lefkowitz, Reference Lefkowitz2003), and instead we argue about what those values should be. We begin by stating “first principles” with which we assume that few if any I-O psychologists would disagree (but we hope to be corrected if this is not the case). The first principle is that everyone is born equally deserving of the same basic liberties as anyone else (Rawls, Reference Rawls2001). Second, social and economic inequalities should be to the greatest benefit of the least-advantaged members of society (Rawls, Reference Rawls2001). Third, all I-O psychologists, regardless of their nationality, are joined together by basic principles of professional conduct and responsibility to society (e.g., respect for the dignity of persons; see, e.g., International Union of Psychological Science, 2008). Fourth, I-O psychology as a discipline bestows benefits on segments of society via its science and practice (e.g., the development of relevant theories that can lead to greater understanding and the development of useful practical tools). According to these four principles, we would argue that I-O psychology's bias away from people living in poverty is unjust because it bestows disproportionate benefit on the most advantaged members of global society. Moreover, we assert that to correct this injustice, I-O psychologists around the world should collaborate with one another to concentrate the benefit of their science and practice on the people who are most disadvantaged: those living in multidimensional poverty. We are not claiming that all of the attention of I-O psychologists should be directed toward those living in poverty. Instead, we argue that the institutions that constitute the discipline (e.g., professional associations, journals, and graduate programs) have a moral duty to substantially reorient the field to understand and, where appropriate, intervene to address the needs of the least fortunate members of global society.
The Capability Approach
Better understanding and intervening to support the welfare of people living in the deepest forms of poverty is far easier said than done. There are significant obstacles to engaging with people affected by deep poverty and with humanitarian situations, as they might involve serious threats to physical safety, historic and deeply embedded traditions of injustice, and divergent and conflicting cultural norms (MacLachlan et al., Reference MacLachlan, Carr and McAuliffe2010). In such situations, seemingly clear moral principles often become clouded, and the possibility of committing inadvertent harm through interventions and research becomes heightened (Bernal, Cumba-Avilés, & Rodriguez-Quintana, Reference Bernal, Cumba-Avilés, Rodriguez-Quintana and Comas-Diaz2014; OECD, 2009; Trimble et al., Reference Trimble, Scharrón-del Río, Casillas, Leong, Comas-Dias, Hall, McLloyd and Trimble2014). As both a moral guide and as an impetus for moral action, we propose that I-O psychology should consider the capability approach pioneered by Sen (Reference Sen1992, Reference Sen1999, Reference Sen2009).
In explanation of the capability approach, Sen (Reference Sen1999) makes two defensible and yet seemingly contradictory observations: first, that justice-based interventions by one group on behalf of another are warranted in order to correct great inequities in society; and second, that due to the diversity in conceptualizations of justice that exist between different populations in the world, it is unjust for one group to impose its culturally value-laden conceptualization of justice on other populations. As evidence of the first observation we might cite the largely, but not entirely (BBC, 2006), extinct practice of Sati among Hindu communities in which a recently widowed woman, to some extent either voluntary or by force, burns to death on her husband's funeral pyre. Sen's (Reference Sen1999) general contention here is that such practices should not be justified by any cultural norms, and interventions to stop such practices are morally justified. In support of the second observation, we could reference any number of harmful if not fatal impositions of culture, either deliberate or accidental, by one population on another, including, for example, on the indigenous peoples in North America (Duran & Duran, Reference Duran and Duran1995). Sen (Reference Sen1999, Reference Sen2009) claims that the right for one person or group to live according to their cultural norms is a fundamentally important human liberty.
The capability approach is geared to resolving, or at least providing tools to resolve, the apparent conflict between the above two observations. The approach is centered on the fundamental liberty for everyone to freely set, revise, and pursue their own conception of what is good and just (so long as that right does not impinge on the similar right of another). Sen (Reference Sen1999) argues in the book Development as Freedom that when presented with the opposing realities, that (a) injustices exist and need to be ended and that (b) doing so will inevitably involve imposing one's culturally based value propositions on others, the best way forward is to intervene up to, but not further than, the point at which the person whose welfare is being supported is actually free to decide his or her fate. The actual freedom to do something is labeled by Sen as a “capability.” Therefore, the capability approach outlines an optimally just form of intervention into the lives and values of others. This optimized form of intervention prioritizes, and circumscribes, forms of assistance to those which promote individuals’ capabilities.
As observed by Shrivastava, Jones, Selvarajah, and Van Gramberg (Reference Shrivastava, Jones, Selvarajah and Van Gramberg2016), the capability approach's handling of justice combines elements of both distributive and procedural justice (see Greenberg, Reference Greenberg2009). The capability approach asserts that the full realization of procedural justice is contingent upon people having sufficient resources to participate meaningfully in societal processes. Sen (Reference Sen1999) points to at least three particularly important resources in this regard: basic levels of education, health, and income. Thus, resources like income are not good in and of themselves, but they are good because of their instrumental value in promoting capabilities. Thus, if we are attempting to ascertain whether a given intervention or project has benefitted the people it is meant to help, it is not enough to ask whether there have been objective increases in health, income, or education, but instead one must ascertain whether thanks to the intervention people are more free to live their lives in the manner of their choosing.
Organizational scholars including Giovanola (Reference Giovanola2009) and Renouard (Reference Renouard2011) have utilized the capability approach to explore the ethics of business, employee relations, and corporate social responsibility. These explorations have, in general, proposed that the moral probity of business relations and activities should be judged by whether they support or impinge upon individual capabilities. Nussbaum (Reference Nussbaum2003) has provided another conceptual bridge between the capability approach and the world of work by proposing a set of central human capabilities. This set includes a capability for people to exert a meaningful degree of control over their environment, which itself includes “having the rights to seek employment on an equal basis with others . . . being able to work as a human being, exercising practice reason, and entering into meaningful relationships of mutual recognition with other workers” (Nussbaum, Reference Nussbaum2003, p. 42). In addition, Sen (Reference Sen1999) has proposed five broad types of instrumental freedoms that are necessary for all capabilities, namely political freedoms (e.g., civil rights), economic facilities (e.g., the right to hold property), social opportunities (e.g., right to literacy in order to contribute to social discourse), transparency guarantees (e.g., guarantees of disclosure), and protective security (e.g. a social safety net). As examples of such “sets” of capabilities, we include lists from Nussbaum (Reference Nussbaum2003) and Sen (Reference Sen1999) in Table 1.
Fundamental Sets of Capabilities

The Characteristics of Capabilities and Their Relevance to I-O Psychology
Capabilities hold six notable characteristics (Alikire, 2005; Comim, Reference Comim, Comim, Qizilbash and Alkire2008; Sen, Reference Sen1999). First, capabilities are counterfactual; that is, they are the hypothetical opportunities and potential choices open to a given individual and cannot be fully appreciated by accounting for the choices that an individual actually makes. Second, capabilities are multidimensional—not only are there multiple fundamentally important capabilities, but one capability is not fungible or transferable in relation to another capability. Third, capabilities are differentially prioritized by each individual. Even if one set of capabilities applies to different people, it is likely that people will differentially order capabilities in terms of their relative importance. Fourth, capabilities are multivocal—the same capability might have substantially different meanings according to different people. Fifth, capabilities hold an element of objectivity. As detailed by Sen (Reference Sen1992), a chief concern in the capability approach is the “adaptive preference problem,” wherein individuals’ subjective self-report of capabilities is likely to be influenced by their relative position in society. Sixth, capabilities are fundamentally individualistic; despite the possibility of measuring capabilities on higher levels of analysis, the capabilities of individuals hold moral primacy. Sen (Reference Sen1999) has argued that capabilities need to be anchored to an individual to guard against the abrogation of fundamental individual rights by groups. Despite this individual-level focus, capabilities are also inherently concerned with group-level and social relations due to the fact that social opportunities are one of Sen's (Reference Sen1999) five instrumental freedoms.
Capabilities are usefully compared with two concepts that are more common in I-O psychology research: subjective well-being and empowerment. Subjective well-being, or the degree to which people indicate that their lives are desirable and proceeding well (Diener, Oishi, & Lucas, Reference Diener, Oishi and Lucas2015), is similar to the concept of capabilities in its focus on core aspects of individual welfare. Moreover, like capabilities, subjective well-being is often multidimensional and assessed on an individual level of analysis. However, capabilities appear to be more counterfactual and objective than subjective well-being, and capabilities tend to focus on particularistic evaluations (e.g., the capability to participate in civic affairs) as opposed to the more holistic evaluations of subjective well-being (e.g., of life satisfaction and positive affect). It appears possible to have a wide array of capabilities but to have a fundamental lack of subjective well-being (e.g., an adolescent with a great deal of opportunity in life but without major achievements necessary for life satisfaction or positive affect). Conversely, it appears possible to lack capabilities but to have high subjective well-being (for example, a person who is highly satisfied with what he or she perceives to be a wide range of opportunities, when in reality those opportunities are highly constrained by circumstance).
Capabilities are also similar to the concept of empowerment, particularly the combination of both sociostructural aspects of empowerment that deal with the actual possession of power and the psychological aspects of empowerment that involve the psychological states necessary for individuals to feel a sense of control (Spreitzer, Reference Spreitzer, Cooper and Barling2008). When both sociostructural and psychological aspects of empowerment are intact for a given domain in life (e.g., in the development of one's own career), then one would appear to have capability in that domain. Without either the sociostructural or psychological aspects of empowerment, a capability would be limited. Thus, it is unlikely that a capability could consist of the power to accomplish something alongside ignorance of that power. Oppositely, without the power to accomplish something, belief in one's control over a situation falls short of being a capability. Thus, we might understand capabilities as a set of joint sociostructural and psychological forms of empowerment pertaining to particular areas of one's life. Capabilities are distinguishable from empowerment only in gradations; empowerment seems to be more general (e.g., I feel empowered), whereas capabilities are affixed to specific domains (e.g., I am capable of successfully engaging in political discourse but not capable of pursuing my career). The difference between capabilities and empowerment is slight enough that the capability approach has been seen as the moral justification for multidimensional empowerment (Bhattacharya & Banerjee, Reference Bhattacharya and Banerjee2012).
We see four predominate reasons why I-O psychologists should consider capabilities as a construct in research and practice. First, as the discipline increasingly engages with justice interventions, the capability approach provides a defensible moral guide for how to conduct such interventions. Second, capabilities are a more parsimonious way to conceptualize the combination of sociostructural and psychological empowerment—two concepts that are often considered separately (Maynard, Gilson, & Mathieu, Reference Maynard, Gilson and Mathieu2012). Third, capabilities are promising targets for theoretical development. As mentioned by Greenberg (Reference Greenberg2009), a reason why I-O psychologists have not more readily engaged in research-based justice interventions is because doing so is not rewarded by journals that prioritize theoretical development. Capabilities carry with them a rich and growing history of theoretical development relevant to organizational phenomena (Shrivastava et al., Reference Shrivastava, Jones, Selvarajah and Van Gramberg2016). For example, there is a clear parallel between the moral importance of capabilities and the agentic theory of human development and behavior as proposed by Bandura (Reference Bandura2006). In addition, the capability approach has been related to Ryan and Deci's (Reference Ryan and Deci2000) theory of self-determination (Alkire, Reference Alkire2008). Indeed, Chirkov, Ryan, Kim, and Kaplan (Reference Chirkov, Ryan, Kim and Kaplan2003) appear to claim that personal autonomy's relevance to human well-being across cultures is broadly supportive of Sen's (Reference Sen1999) thesis. Fourth, as I-O psychology engages with humanitarian concerns, the capability approach serves as a conceptual and methodological bridge to practices and research findings from the field of international development studies, which has a long history of considering the promise and peril of interventions to promote fundamental aspects of human welfare (Gloss & Foster Thompson, Reference Gloss, Foster Thompson, Olson-Buchanan, Koppes Bryan and Thompson2013). Stakeholders in the field of international development have established a set of best practices for humanitarian work and assistance that are in keeping with the capability approach and can be readily adapted to guide research and interventions (OECD, 2009).
Operationalizing Capabilities
The better operationalization of capabilities has been identified as the most pressing challenge for the capability approach (Comim, Reference Comim, Comim, Qizilbash and Alkire2008). Indeed, without operationalizing capabilities, their relevance and utility can be hard to grasp. The overall challenge of operationalizing capabilities can be broken down into two major tasks. The first task is to settle on a sufficiently flexible yet specific set of capabilities to consider. Two such sets were introduced in Table 1. In line with principles from the capability approach, the development of a list of relevant capabilities might combine a deductively derived list with another list of capabilities derived inductively. In this inductive process, a mixture of qualitative and quantitative methods might be used to ascertain individuals’ relative prioritization of different capabilities and whether any important capabilities have been left out. As I-O psychology engages with the capability approach, there is an opportunity to incorporate empirically validated taxonomies of needs, values, and/or goals from psychology to help inform this effort (e.g., Grouzet et al., Reference Grouzet, Kasser, Ahuvia, Dols, Kim, Lau and Sheldon2005; Ryan & Deci, Reference Ryan and Deci2000; Schwartz, Reference Schwartz1992). For example, Prilleltensky (Reference Prilleltensky2014) has suggested six fundamental facets of well-being relevant to justice and human development: interpersonal, communal, occupational, physical, psychological, and economic. Such a set could be empirically validated and tested. In addition, a set of fundamental capabilities might be generated that is specific to the world of work or to even more specific domains, such as capabilities for new employees or capabilities for the beneficiaries of corporate social responsibility (CSR) efforts.
The second major task in operationalizing capabilities is the development of a sufficiently simple and easy method for assessment. Although attempts have been made at the operationalization of capabilities into a straightforward survey (e.g., Lelli, Reference Lelli, Comim, Qizilbash and Alkire2008), the complex nature of capabilities has largely stymied attempts to establish a standardized measurement format (see Comim, Qizilabsh, & Alkire, Reference Comim, Qizilbash and Alkire2008). Attempts at the quantification of capabilities have often resorted to the measurement of resources that are known to support capabilities (e.g., income or healthcare). However, as discussed by Sen (Reference Sen1999), such resources are merely means to an end, and the end—an actual freedom—is not fully captured by the measurement of resources. In light of the characteristics of capabilities that present challenges to operationalization, we believe that there is considerable opportunity for I-O psychology to contribute to their reliable and valid measurement. There is a particular opportunity to help operationalize and measure capabilities within the context of work organizations (see Chopra & Duraiappah, Reference Chopra, Duraiappah, Comim, Qizilbash and Alkire2008).
The capability approach has been described as necessarily highly information-rich (Alkire, Reference Alkire2005). Practitioners have begun to utilize structural equation modeling (Bhattacharya & Banerjee, Reference Bhattacharya and Banerjee2012) and fuzzy sets theory (Kuklys, Reference Kuklys2005) to deal with the challenges of capabilities’ latent, multivocal, differentially weighted, and jointly objective and perceived nature. We similarly believe that tools like exploratory structural equation modeling (Asparouhov & Muthen, Reference Asparouhov and Muthén2009), latent profile analysis (Nylund, Asparouhov, & Muthen, Reference Nylund, Asparouhov and Muthén2007), and multidimensional item response theory (Reckase, Reference Reckase2009) can help to overcome challenges inherent in the quantitative estimation of capabilities. In particular, these tools might come in handy when attempting to detect and account for any problems of “response shift,” which I-O psychologists might classify as a problem of measurement equivalence (Tay, Meade, & Cao, Reference Tay, Meade and Cao2015).
Regardless as to how well capabilities are measured quantitatively, the priorities of the capability approach warrant an important role for methodological pluralism. Moreover, due to the subtle and complex nature of capabilities, qualitative methods appear warranted. Because of the capability approach's priority for individuals to define for themselves how to live their lives, research and interventions should be conducted in a participative and flexible manner that prioritizes the ownership and voice of those meant to be understood or benefited (Pistrang & Barker, Reference Pistrang, Barker, Cooper, Camic, Long, Panter, Rindskopf and Sher2012). In particular, the participatory action research paradigm appears well suited to help explore and promote capabilities (Chesler, Reference Chesler1991). Such a flexible and participative approach appears most likely to help I-O psychologists to both maximize the validity of their conclusions and to avoid problems stemming from their discipline's historically POSH perspective (see Barker & Pistrang, Reference Barker and Pistrang2005).
Putting Capabilities to Work: Illustrative Examples
To add clarity to an idea of how capabilities might be applied to research and practice in I-O psychology, we briefly describe three lines of research and then introduce different fictional scenarios where the use of capabilities would be beneficial. To support these scenarios, we provide an example of how capabilities might be measured in Table 2. This example lists four capabilities that might emerge out of an initial investigatory process that combines the deductive inclusion of some capabilities from a literature review and the inductive inclusion of others from a set of semistructured interviews with community members. We stress that although we cite research leading up to each scenario, the scenarios we describe are entirely fictitious and are simply meant to illustrate the potential utility of capabilities measurement.
Example of a Capability Set for Potential Use in I-O Psychology Research and Practice

Note. This list of hypothetical capabilities and indicators is drawn from Bhattacharya and Banerjee (Reference Bhattacharya and Banerjee2012), Nussbaum (Reference Nussbaum2003), Sen (Reference Sen1999).
Living Wages
Many people in vulnerable forms of employment are not protected by minimum wage legislation (World Bank, Reference Bank2012). Even those who are protected by such legislation, such as some pickers in the tea industry in Malaŵi (Oxfam, 2014), are often unable to make ends meet because their country's legal minimum wages are insufficient to support basic needs (ILO, 2016). The concept of a “living wage” is commonly defined as the minimum income necessary for a worker and their household to meet their everyday aspirations for a decent quality of life. Yet many questions remain. For example, might there be an identifiable “tipping point” or “pivotal range” across working contexts where increases in wage rates do the most to benefit human capabilities (Carr, Parker, Arrowsmith, Watters, & Jones, Reference Carr, Parker, Arrowsmith, Watters and Jones2016)? This is the core question guiding a recently launched project, led by I-O psychologists, on the work psychology of decent work and living wages known as GLOW (Global Living Organizational Wage, 2017).
Scenario 1: Assessing the outcomes of a living wage intervention
Using the capabilities listed in Table 2, we might be able to test an intervention meant to determine the effects of introducing a living wage. By adopting a participatory action research paradigm and by casting our empirical net across all four capabilities, we might find that increases in wages are especially important at certain times of the year due to increases in home heating costs. Alternatively, we might also discover that the payment of wages in cash on the job site compromises the physical safety of women when they travel back home from the job site. The assessment of the effects of a living wage might also include the assessment of the capabilities of both immediate family and a random sampling of community members. Although there might be no noticeable benefits of a living wage to an employee, we might find that there are benefits to family members’ health and affiliative capabilities.
Organizational Inequality
The world's current international development agenda has prioritized concepts such as shared prosperity and sustainable livelihoods (UN, 2016). These concepts imply a degree of equal opportunity both in the broader society and in the workplace. At the same time, organizations have been identified as one of the primary sites for the production of inequality in modern societies (Stainback, Tomaskovic-Devey, & Skaggs, Reference Stainback, Tomaskovic-Devey and Skaggs2010). The issue of organizational inequality has been researched from a variety of perspectives. For example, Carr, McWha, MacLachlan, and Furnham (Reference Carr, McWha, MacLachlan and Furnham2010) explored the interpretations of pay differentials, referred to as “dual salaries,” between expatriates and locals in a variety of organizational contexts. Moreover, McWha (Reference McWha2011) has explored the importance of inequality in income and power within the context of humanitarian and development organizations (see also Core Humanitarian Standard, 2017). Already, research in this vein has prompted a rethinking of approaches to pay salary discrepancies between expatriates and locals in multinational organizations (Carr, Reference Carr2011), but many questions remain; for example, what are the long-term results of both objective and subjective pay inequality?
Scenario 2: Studying the effects of an organization's changes to pay
Measuring capabilities could help researchers to better understand the effects of changes in an organization's pay policies and the organization's level of pay inequality. After a company's preplanned change in certain pay rates, an investigation might discover that employees at the lower end of the organizational pay scale maintain relatively high levels of job satisfaction (a capability indicator in Table 2) before, during, and after the change. However, comparison of job satisfaction responses to indicators of capabilities might indicate a “response shift” in job satisfaction ratings among the employees from the lowest socioeconomic classes. This might call into question the reliance on job satisfaction scales in evaluating the effects of pay inequality at work. Without the inclusion of objective indicators and other capabilities, such a response shift might go unnoticed.
The Impact of CSR on Capabilities
Within the organizational sciences, a relatively large share of research has been devoted to understanding the effects of CSR on employees and organizational outcomes (Aguinis & Glavas, Reference Aguinis and Glavas2012). As discussed by Rupp and Mallory (Reference Rupp and Mallory2015), consideration of the impact of CSR efforts on the stakeholders that such efforts are aimed at helping has been “all but abandoned to the shadows” (p. 226), and where it has been considered, dependent variables are usually econometric in nature. The measurement of capabilities provides an opportunity to more robustly consider the impact of CSR efforts on human well-being. In particular, as outlined in the UNDP's (2014) report on the relationship of the private sector to poverty reduction, the testing of best practices in internal and external CSR provides an opportunity for I-O psychologists to experimentally manipulate key features of CSR efforts to determine their effects on the capabilities of members of the community. Best practices in aid and development efforts can help to inform practices in CSR. Moreover, these best practices tend to be broadly in line with principles from the capability approach. For example, the Paris Declaration on Aid Effectiveness (OECD, 2009) has emphasized the importance of an aid recipient's ownership of humanitarian projects.
Scenario 3: Guiding and evaluating a CSR effort
Both the capability approach and the measurement of capabilities could help to inform CSR efforts. The capabilities in Table 2 might be included in a pre- and postevaluation of a CSR effort in a lower-income community meant to deliver food, clothing, and household items to impoverished families. The managers responsible for the CSR effort might discover that the recipients of those goods were unexpectedly excluded from community activities after the CSR effort concluded. With some follow-up, it might be discovered that the recipients of the goods were ostracized from the community because community elders were not properly consulted and goods were not distributed to the neediest members of the community. According to both the principles of the capability approach and best-practices in humanitarian aid, the company running the CSR program might work with the community in a more participatory manner going forward to ensure that recipients, as well as members of their broader community, feel a sense of ownership over the project and have their capabilities enhanced to run their own community.
The Role of Capabilities in I-O Research
As is illustrated in the above three scenarios, the measurement of sets of capabilities has the benefit of providing a broad, information-rich, and multifaceted picture on human well-being. As reflected in the first scenario, although capabilities are measured on an individual level of analysis, they can and should be liberally assessed in the broader social networks of those people who are the intended beneficiaries of research or assistance. As indicated in the second scenario, the multifaceted and simultaneously objective and subjective nature of capabilities allows greater insight into response patterns and whether those patterns fully reflect an underlying capability. Finally, as illustrated in the third scenario, capabilities and the principles of the capability approach might help to inform the processes of humanitarian assistance and research with people living in poverty.
Limitations
This article's characterization of I-O psychology's POSH bias has limitations. Despite poverty existing on multiple levels of analysis, we were restricted to utilizing a predominately country level of analysis to characterize I-O psychology's perspective. This reliance on a country level of analysis likely underestimates the extent to which I-O psychology has focused on POSH priorities because, due to a tendency to overrepresent professionals, workers in the formal economy, and populations not affected by great discrimination, some of the people least affected by poverty in lower-income countries are likely studied when studies are conducted in those countries. Another limitation of our estimation of a POSH bias is that our search criteria relied on the explicit mention of a country context in English characters. It is possible that subnational regions or supranational regions were considered at different rates than the national rates we observed. Moreover, it is possible that anomalies in the trivial use of country names has meaningfully distorted our results. Although this is a possibility, we judge it to be an unlikely one in light of the high reliability observed among our three searches (α = .91). Finally, our searches were limited to the 23 academic journals listed by Zickar and Highhouse (Reference Zickar and Highhouse2001), which excludes books, conference proceedings, and the content of other journals in which I-O psychologists might regularly publish.
Beyond methodological limitations, this article's emphasis on the importance of capabilities also carries limitations. First, in extreme conditions, it is certainly possible to overemphasize the importance of freedom, as discussed by Schwartz (Reference Schwartz2000). Second, the capability approach has been criticized for its emphasis on the individual as a level of analysis and on the moral primacy of individual liberty. We believe that this is an inherent limitation of the approach, but we agree with Sen (Reference Sen1999) that this is the best of any alternative because it protects against the abrogation of the liberties of vulnerable individuals from powerful individuals and groups. Third, we neglected to parse the extent to which climatic variables either exacerbate or mollify various effects of poverty on capabilities. As argued by Van de Vliert (Reference Van de Vliert2013), the influence of climate can be substantial in this regard. Finally, this article is limited in its scope because it has excluded robust discussions of why I-O psychology holds such a POSH perspective and what I-O psychologists can practically do to correct it. We avoided focusing on these topics because they have been handled well elsewhere (e.g., Bergman & Jean, Reference Bergman and Jean2016; Koppes, Reference Koppes2007; Lefkowitz, Reference Lefkowitz2016; McWha, Mji, MacLachlan, & Carr, Reference McWha, Mji, MacLachlan, Carr, Griffith, Thompson and Armon2014).
Conclusion
As we mentioned at the beginning of our article, in 1960 Baritz provided a stinging critique of industrial social scientists for having helped to “restrict the freedom of millions of workers” (p. 209). Despite a decidedly POSH perspective over the past 100 years, we believe that I-O psychology has begun to emerge from the shadow of such characterizations thanks to the gradual but continual broadening of the field to include more humanistic and humanitarian concerns. We hope that our arguments help to make a case for why a focus on promoting the freedoms, that is, the capabilities, of people living in the deepest forms of poverty is not only good for science and practice but also an attainable moral imperative. Finally, we hope that this article will generate discussion regarding what notion of justice should guide I-O psychology's scientist–practitioner–humanist model because, as suggested by Lefkowitz (Reference Lefkowitz2009), there is a lot yet to talk about.
Appendix
To estimate the incidence of populations and contexts affected by poverty, we attempted to identify the role of country contexts in the dominant narrative of I-O psychology and then characterize those country contexts in terms of multidimensional poverty. To estimate the incidence of country contexts in the I-O psychology dominant narrative, we conducted three different searches of the PsycINFO database for articles in I-O psychology journals. We analyzed the content of peer-reviewed journals because of their importance in shaping the dominant narrative within the field of I-O psychology. For all three searches, we limited results to the 23 journals that Zickar and Highouse (Reference Zickar and Highhouse2001) classified as common outlets for I-O psychology research. A total of 57,516 journal articles published from 1917 to 2016 was gathered in a search for all available articles from the target journals.
The first search was based on country names and utilized PsycINFO's location-specific search field as a way to identify studies that considered each of 188 country contexts from UNDP (2015a). This field is “a standardized description of continents, regions, and country names related to the content of the document” (American Psychological Association, 2017). The second search was based on country names and utilized PsycINFO's all-text search field. The third search was based on nationalities and also utilized the all-text search field. For the second search, we used multiple alternative names in addition to the official United Nations name (UNDP, 2015b) whenever alternatives were listed in the United States Central Intelligence Agency's (CIA's) World Factbook (www.cia.gov). Alternative names included official long-form names, official short-form names, unofficial names, outdated names, and names of countries in the dominant local language in English characters. For the third search, we searched for both nouns and adjectives associated with the nationalities of each country, again using terms from the CIA's World Factbook.
Each search yielded a count of articles. For each search, we calculated each country's percentage representation among all articles retrieved. For the purposes of enhanced reliability, we then averaged country article representation from the three searches. Aggregation appeared justified in light of a high Cronbach alpha value of 0.91. If a country's average article representation was larger than its share of the total population of the 188 countries for which we had population data from UNDP (2015a), then it was classified as “well-represented.” If a country's average article representation was smaller than its population share, it was classified as “underrepresented.” If a country was not identified in the three searches, then it was classified as “unrepresented.” Country categorizations are listed in Table A1. To reduce the degree to which categorization could be misleading due to small country populations, we excluded the 44 countries with populations less than 2 million people.
Representation Levels of Countries