

Disclaimer
Other than the material expressly identified in this paper as being the intellectual property and copyright of Ortec Finance, the IFoA owns any and all intellectual property rights, including copyright in this paper and its content is protected by copyright.
You are permitted to use and/or view this paper provided that (i) you do not modify the content in any way; (ii) you do not use this paper or any part(s) of it in a misleading context; (iii) your use of this paper is for your own personal information or for a non-commercial purpose; (iv) any copies of this paper or any part(s) of it for a permitted purpose described in this notice, will include an acknowledgement that copyright belongs to the IFoA and Ortec Finance (as appropriate).
The IFoA and Ortec Finance do not accept any responsibility or liability to any person for loss or damage suffered as a consequence of their placing reliance upon any view, claim or representation made in this paper. The information, including the modelling scenarios, and expressions of opinion contained in this paper are not intended to be a comprehensive study, nor do they provide actuarial advice or advice of any nature and should not be treated as a substitute for specific advice concerning individual situations. We have used this tool to model the effects of three different climate pathways through sets of alternative economic assumptions that mimic various possible evolutions of the economy depending on which climate pathway the world follows.
Executive Summary
Climate change will fundamentally impact how economies perform as a whole. It will affect macro-economic variables such as gross domestic product (GDP) growth and in turn have a significant influence over the resulting performance of asset classes and industry sectors. This paper shares more of the financial outputs from the modelling within “Climate scenario analysis for pension schemes: A UK case study” that was written by the same authors.
This paper examines the long-term economic and financial impacts projected by a model that combines climate science with macro-economic and financial effects to examine the relative impacts of the three different climate pathways summarised in Figure 1.
Climate change pathways modelled.

This paper first considers the impact on GDP, expressed as a percentage of baseline GDP where there is no explicit allowance for climate change, as shown in Figure 2.
Climate-adjusted GDP growth UK and World (ratio of cumulative medians to the cumulative median of climate-uninformed baseline pathway).

In the UK, the initial impacts on GDP in the Paris pathways are fairly limited, but the longer-term impacts are modestly negative, resulting in 11.5% lower GDP in 2100 (0.15% p.a.). The Failed Transition Pathway is initially similar to the Paris Transition pathways. However, the higher impact of physical damages is noticeable even by 2040 and continues to accelerate as the physical impacts increase, resulting in GDP which is 60% lower than baseline by 2100.
Global GDP follows a similar pattern although greater sensitivity to physical risks means that by 2100 GDP is 20% lower than baseline in the Paris-aligned pathways and 70% lower in the Failed Transition Pathway.
There are also significant short-term and long-term impacts on financial markets, illustrated here for global equities:
Figure 3 illustrates the potential short-term shock from a disorderly transition pathway, where a sentiment shock exacerbates the rapid pricing-in of a Paris-aligned transition. In the model:
-
Median equity market returns fall by 18% relative to baseline within two years, although the median then recovers part of those losses in the following two years.
Global equity return percentage difference of medians to median baseline.
Source: Ortec Finance to all figures and tables unless otherwise stated.

Figure 3 also shows the longer-term impact:
-
In Paris-aligned pathways, the annualised decline is material but moderate with 15% and 25% declines by 2060 (equating to 0.4% p.a. and 0.7% p.a.) respectively.
-
In the Failed Transition Pathway, there is a significant 50% decline by 2060 with physical climate impacts accounting for over 2% p.a. loss of equity returns by 2060, and continuing on a downward path.
What’s more, after 2060 the physical impacts on GDP within the Failed Transition Pathway overwhelm GDP growth leading to nominal GDP decline. The model’s financial markets projections cease in 2060 as the relationships with the unprecedented downward-trending GDP cannot be reliably determined.
These represent significant market risks and have significant implications for financial planning within financial institutions over both short- and longer-term horizons. Our companion paper “Climate scenario analysis for pension schemes: a UK case study” provides an illustration of how this analysis can be applied to a UK pension scheme.
There are also implications for financial modellers. These different climate pathways are not represented in historical data and modellers should consider the degree to which the impact on expected returns and volatility is reflected in their assumptions. They should also consider how they might advise their clients on managing the short- and long-term risks that the modelling of these different climate pathways has illustrated.
The implications for markets and GDP should be noted by regulators and policymakers. Policymakers in particular should consider the long-term implications for economies that are projected to contract in a Failed Transition Pathway. The broader real-world consequences of failure to transition, such as food shortages, migration and conflicts, are not captured in the model and are likely to make the actual impacts far worse.
This paper reflects outputs from one model. Climate scenario analysis for financial institutions is a relatively new area where significant work is currently underway. The examination of the climate impact calibrations and comparisons with alternative models is outside the scope of this paper, but we hope that the results provide a useful data point against which other model outputs can be compared. A comparison of the calibrations across different models could be considered in future papers.
Over the next few years, we do expect climate-financial modelling approaches to become more sophisticated and for consensus to start to emerge around which scenarios and calibrations to use. In the meantime, we hope this paper is helpful to actuaries and others in demonstrating the potential impacts of climate change and their potential significance over the longer-term.
1. Introduction
This is a companion paper to “Climate scenario analysis for pension schemes: a UK case study” written by the same authors that shares more of the model’s outputs. In this paper, we examine the long-term economic and financial impacts projected by the Ortec Finance Climate MAPS model that combines climate science with macro-economic and financial effects. The model integrates quantified systemic climate risks and opportunities (both physical and transition) into traditional multi-horizon real-world scenario sets.
Our case study paper explores how climate scenario analysis can be used as a tool for forward-looking assessment of the risks and opportunities for pension schemes and other financial institutions. This paper focuses on some of the model’s outputs that highlight the relative impact of three different climate pathways (Paris Orderly Transition, Paris Disorderly Transition and Failed Transition, described in Chapter 3). It compares them to a “climate-uninformed” baseline that assumes historic trends with no allowance for additional climate impacts. Almost all the charts and tables are referenced to this baseline, so that calibration of the baseline largely drops out, enabling the discussion to focus on the economic and financial impacts of the three different climate pathways.
We are not aware of any recent papers highlighting these long-term effects in such detail. So this paper is likely to be of interest to all those considering long-term financial and economic implications of climate change, which includes not only actuaries and financial institutions but also regulators and policymakers.
Chapters 2 and 3 and Appendices A, B and G are very similar to the corresponding parts of our case study paper. Those who have already read that paper can therefore skip these.
1.1. Economic and Financial Impacts of Climate Change
The potential influence and risk of climate change is not in doubt, Intergovernmental Panel on Climate Change (IPCC) (2018). It is an unprecedented challenge and poses significant risks to the economy and to the financial system. Some of these risks are already manifesting themselves through changing climatic conditions (such as temperatures and rainfall patterns), rising sea levels and extreme weather events (such as hurricanes, wildfires and flooding). These events have significant negative impacts and disruption on various sectors such as agriculture and forestry, supply chains and infrastructure. Actions to limit the extent of climate change by cutting greenhouse gas emissions, primarily through reducing the use of fossil fuels and switching to renewable energy sources, will fundamentally change many aspects of business and everyday life. Some assets, such as fossil fuel reserves, are likely to lose much of their value if emissions limits are imposed, the problem of stranded assets. The business models in many industries are likely to change, and new industries may emerge. Hence, the socio-economic consequences of climate-related impacts will be wide-ranging and long lasting. Crucially from an actuarial perspective, due to the systemic nature of climate change, these impacts can be difficult to predict, quantify and model due to the systemic nature of climate change.
Climate change will almost certainly fundamentally impact how economies perform as a whole. It will affect macro-economic variables such as GDP growth and in turn have significant influence over the resulting performance of asset classes and industry sectors. Since the risks associated with climate change are systemic in nature, they will affect all assets to some extent and so cannot be avoided completely through careful selection of investments.
Climate change is not the only systemic risk to which financial institutions are exposed. Since the majority of the work on this paper was completed, the world has experienced a major shock in the form of the COVID-19 pandemic, which is having unprecedented financial market impacts. The climate impacts we illustrate may seem less significant now they are being considered against that backdrop. An important difference is that real-world climate impacts, although are already being felt, will manifest themselves over a period of decades, extending beyond the typical regulatory horizon and the lifetime of almost all readers and are likely to emerge much more slowly than those of COVID-19. The mounting awareness of climate risks among financial participants, facilitated by tools such as scenario analysis, should help to mitigate the market impacts by enabling the effects to be priced-in gradually, although pricing-in shocks are still likely to occur and could be significant. Even these shorter-term impacts are likely to be material for the majority of financial institutions and the longer-term financial implications of a Failed Transition should concern us all. COVID-19 demonstrates the impact that globally integrated events can have on economies and financial systems and the importance of preparedness.
1.2. The Objectives of this Paper
There has been an explosion of interest in climate scenario analysis due to its prominence in the Task Force on Climate-related Financial Disclosures (TCFD) recommendations. “Organizations should describe how resilient their strategies are to climate-related risks and opportunities, taking into consideration a transition to a lower-carbon economy consistent with a 2°C or lower scenario and, where relevant to the organization, scenarios consistent with increased physical climate-related risks”, TCFD (2017). As predicted, we are seeing considerable work in this area as financial institutions start to implement the recommendations. Globally, central banks and regulators are taking more interest in the modelling of the impact of climate risks, including the Bank of England, which recently consulted on its 2021 Biennial Exploratory Scenario that will focus on the impact of climate risks, Bank of England (2019a).
This paper looks to support this interest by illustrating a model’s results across three different climate-financial pathways. There will naturally be interest in the calibrations and parameterisation to create such model outputs. An outline of the model is provided in the Appendices with links for further reading. The examination of such calibrations and comparisons with alternative models is outside the scope of this paper but we hope that the results provide useful data points against which other model outputs can be compared. A comparison of calibrations across different models could be considered in future papers.
This paper assumes that the reader already has some knowledge of climate change and its impact on future macro-economic outcomes. The reader may be interested in previous IFoA working party papers (IFOA, 2020) which have acknowledged the challenge of assessing the financial impact of climate risks. These earlier papers noted the disconnect between existing scientific data describing climate-related risks and opportunities with the use of this information in financial performance measurement, risk assessment and economic scenario analysis at the strategic level. We believe the model used in this paper illustrates a credible approach in bridging this gap and provides an illustration of the outcomes from doing so.
1.3. Uses of this Paper
We hope that the projections provided will help actuaries and financial institutions understand the potential implications of climate change on financial markets. This can highlight where they may need to make undertake more specific investigations on the impact on their investment strategy and where more detailed consideration may be needed before providing advice. We hope that it may also help inform regulators and policymakers on the potential long-term financial implications of climate change and in particular the risks of taking no action.
The modelled climate pathways we present are intended to be realistic and the numerical results illustrate possible plausible outcomes rather than forecasts. The climate pathways illustrated are not intended to be extreme and so do not represent “worst case” scenarios. Moreover, the model we have used does not take account of the full effects of climate change, as it ignores broader environmental tipping points and knock-on effects, such as climate change related migration and conflict. Given the pathways we have described, these real-world gaps imply there is a strong bias towards optimism in our results.
Details of the approach taken in the modelling are given in Appendices A and B, which also include links to further reading. Details of the median shock sizes by asset classes are given in the other Appendices.
2. The Systemic Nature of Climate Risk
As outlined in Chapter 1, climate change is an unprecedented challenge and poses significant risks to the economy and to the financial system. The risks are often classified into two main types:
-
1. Physical: These arise from both gradual changes in climatic conditions and extreme weather events; and
-
2. Transition: These arise from the move to a low-carbon economy and include impacts relating to policy, technology, markets and reputation (TCFD, 2017).
There are likely to be significant opportunities too, particularly in relation to the transition, although the net impact is likely to be negative for many sectors and for the financial system as a whole.
The physical and transition impacts that actually materialise will depend crucially on the speed and magnitude of climate change and the policy response. There are many possible pathways, driven by the choices made by governments and society at large, varying from those in which our behaviour does not change (leading to more severe physical impacts) to those in which drastic action is taken to counteract climate change (leading to more severe transition impacts). The actual pathway that we will follow is highly uncertain. Nonetheless, it is certain that there will be financial impacts from some combination of physical and transition effects.
These climate impacts will have macro-economic consequences (i.e. economy-wide effects) that will affect indicators such as GDP growth, interest rates, inflation, investment and international trade flows. This will in turn affect risk-return expectations across all asset classes, regions and sectors and also the value placed on the liabilities of pension schemes. The risks are therefore systemic in nature, they will affect large parts of the economic and financial system, with many companies potentially affected in similar ways at similar times. The Bank of England has warned repeatedly that climate risks could cause instability of the financial system, Bank of England (2019b).
It is therefore imperative that pension schemes and other financial institutions start to assess and determine the potential impact of transition and physical risks on their assets and liabilities. Not only will this help individual schemes navigate the uncertain waters ahead, it will also help facilitate an understanding of how, and on what scale, climate change creates risks for the whole financial system.
2.1. Modelling the Financial Impacts of Climate Change
The modelling of climate systems is a long-established area of research. Considerable work has also been carried out to model the economic costs and benefits of climate change and related policy action. More recently, attention has turned to modelling the effects on financial markets and financial institutions. However, most models currently used by actuaries do not make explicit adjustments for climate change. They often assume that market prices fully reflect climate-related risks, despite the warnings of financial regulators and others that this is unlikely to be the case.
Of the analysis of financial impacts that is currently available, most focuses on bottom-up climate-related risk analysis and reporting of investment impacts and does not consider top-down integration via macro-economic risk analysis into asset-liability modelling and long-term strategic asset allocation.
Although bottom-up approaches for carrying out climate scenario analysis are useful for some purposes, they suffer from a number of disadvantages. They are mainly focused on individual companies or sectors on the assets side, or individual effects on health or mortality on the liabilities side. They are unable to take economic networked effects into account, thus missing the structural impacts on the global economy and making it difficult to consider assets and liabilities consistently.
A top-down or “systemic” perspective is increasingly being considered in the academic literature, as well as in guidance documents, and by regulators and key experts in the field, United Nations Principles for Responsible Investment (PRI) (2019), Institutional Investors Group on Climate Change (IIGCC) (2019). Such a top-down approach to scenario analysis captures the systemic nature of climate risks that are not identified in “bottom-up” metrics and methodologies.
It is acknowledged that a micro-economic approach is necessary to drill down to the individual holding level. This is important for understanding how climate risks are distributed within the investment portfolio and hence where mitigating actions should be focused. Therefore, “top-down” and “bottom-up” approaches to climate scenario analysis are complementary and both need to be considered.
3. Introducing the Systemic Climate Risk Scenario Tool
For this paper, we have used Climate MAPS, the top-down modelling tool developed by Ortec Finance in partnership with Cambridge Econometrics. This tool combines climate science with macro-economic and financial modelling in order to integrate quantified systemic climate risks and opportunities (both physical and transition) into traditional multi-horizon real-world scenario sets. The climate risk integration logic “ties together” climate science, macro-economic modelling and financial modelling. The methodology is relevant for a broad range of financial organisations, covers both physical and transition risks and provides granularity down to the country and sector level across asset classes for several global warming pathways and stress-test scenarios. It is described in more detail in Appendix A.
Climate MAPS is not the only modelling tool that could have been used. The precise numerical results from the modelling would be different had another tool been used. We consider that Climate MAPS provides useful insights in spite of its limitations (see Chapter 3.2) and think it likely that other tools might provide similar insights. An interesting area of further work would be to perform some comparisons across different modelling tools.
We have used Climate MAPS to model the effects of three different climate pathways through sets of alternative economic assumptions that mimic various possible evolutions of the economy depending on which climate pathway the world follows. The scenarios aim to be a realistic representation of possible policy, technology and physical risk developments under different temperature pathways. They therefore represent plausible climate-aware real-world scenarios rather than climate stress-test scenarios, i.e. they are not potential worse case scenarios.
Each pathway includes a set of climate-related risks and opportunities. These risks can be further broken down into physical and transition risks. For example, risks arising from a transition to a low-carbon economy require a large shift of investments across all sectors towards low-carbon alternatives. On the other hand, if the world continues on an unchanged path, more physical risks will come into play and disrupt expected growth. It should be noted that there are some physical effects that will materialise regardless of the pathway, due to locked-in impacts caused by greenhouse gases already emitted over the past decades. These physical effects are much smaller if we transition towards a low-carbon economy, but they should not be neglected.
3.1. Climate Pathways
The three climate pathways that we have modelled are shown in Figure 1 and described in more detail in Appendix B. They consist of two pathways in which the world transitions to a low-carbon economy in a way that is consistent with the Paris Agreement, United Nations Framework Convention on Climate Change (UNFCCC) (2015), and one in which there is no such transition.
In the Paris Orderly Transition Pathway, action to achieve the Paris Agreement goals starts immediately and continues until net-zero global emissions are achieved in 2066. Because of the timely awareness and response of policy and financial actors, the pricing-in of climate-related risks (transition and physical) takes place gradually over the period 2020–2024. It should be noted that this pathway is expected to limit average global temperatures to below 2°C (75% probability) but not necessarily 1.5°C (50% probability) by the end of this century. The alternative 1.5°C narrative is of increasing interest to financial institutions, especially those which have committed to net-zero emissions by 2050. Achieving this pathway with a greater probability than 50% would require an even steeper transition pathway (based on IPCC SR1.5 instead of RCP 2.6) with quicker technology take-up, stricter policy measures and negative emissions from carbon capture technologies and/or afforestation/reforestation measures.
The Paris Orderly Transition Pathway includes the same real-world transition risks and opportunities as the Paris Orderly Transition Pathway. The assumptions regarding matters such as policies across sectors and countries as well as technology uptake are the same in both pathways. The physical risks associated with a Paris pathway, i.e. those gradual physical risks and extreme weather events associated with staying below 2°C global average temperature rise from pre-industrial levels by 2100, are also the same for both. What differs, however, is how markets become aware of, and address, these transition and physical risks. In the Paris Orderly Transition Pathway, the financial markets have little initial awareness of the scale and speed of the transition that is required. There is an abrupt realisation of the problem in 2024, followed by a re-evaluation of assets directly and indirectly related to carbon-intensive economic activities. In addition, stocks and bonds are abruptly repriced in 2024, with a consequential sentiment shock, i.e. a carbon bubble/stranded asset event, in 2025. These abrupt responses on financial markets also lead to increased market volatility from 2024 to 2026.
In the Failed Transition Pathway, there is no impetus for policymakers to implement additional policies over and above those already in place, and therefore the Paris Agreement goals are not achieved. The scale and potential impact of the physical risks to 2050 that this pathway implies are priced in over the period 2025–2029. The severe physical risks beyond 2050, and the structurally lower growth expectations due to these physical risks, are then considered as part of a second repricing in the period 2035–2039.
These three climate-aware pathways are compared to a climate-uninformed baseline economic outlook, in which no account is taken of the effects of future temperature increases, climate-related policies or technology trends. More details of the baseline are provided in Appendix A.
3.2. Limitations
Given that the future is uncertain, the random variation in future economic variables and investment returns over the short-term may result in experience that is significantly different to the expected long-term average experience. This is true of all stochastic financial models but is particularly important here because there is material uncertainty in all aspects of climate scenario modelling. The use of judgement is required at all stages in both the formulation and application of climate scenario models.
Furthermore, as most current economic models are built on past experience, including implicitly the assumptions that climate change is not occurring and there is no energy transition, there is an important question for users of these models about the level of uncertainty inherent in them.
The modelling is intended to illustrate possible plausible impacts on the economy and financial markets. Rather than focusing on the absolute results under each pathway, we encourage readers to focus on the relative results of the climate-aware pathways compared with the climate-uninformed baseline.
The pathways we have modelled do not cover the full range of possibilities. For example, our Paris Disorderly Transition assumes a late realisation only on the part of the financial markets of the physical and transition risks of climate change. Other possible drivers of disorder include a late realisation of the risks by policymakers leading to abrupt policy action, unexpected technological breakthroughs, or a sudden shift in consumer sentiment. These would all result in disorderly impacts that would differ in impact and timing from what we have modelled. Moreover, the actual outcome is likely to be different from any of our pathways. However, the pathways do give some idea of the types of impacts that may be seen and of their potential relative significance.
The model we have used relies on Cambridge Econometrics’ macro-econometric model E3ME to integrate transition and physical risk drivers and calculate their impact on macro-economic outputs (see Appendix A). E3ME considers only carbon dioxide (CO2) emissions from energy use and does not model other emissions or emissions from agriculture or changes in land use. In order to capture the effects of other greenhouse gas emissions, the model uses a climate sensitivity coefficient that implicitly includes these other emissions. In addition, E3ME assumes that the supply of natural resources (e.g. water, forests) is equal to demand, i.e. only demand is modelled, not supply. Other models are available but as actuaries with some experience in this field, we are satisfied that this is a reasonable model and captures most of the features that we would like.
The modelling translates the impacts of climate-adjusted GDP shocks onto a wide range of financial and economic variables. To do this, GDP is the only translation mechanism from the macro econometric model to the stochastic financial scenario model. Other potential translation mechanisms (such as carbon price impact on inflation and interest rates) are out of scope and follow purely from the estimated relationships with GDP in the financial model. The results of the modelling are highly dependent on the assumptions used to translate the GDP shocks onto the other variables.
There is particular uncertainty about how climate change might affect interest rates and inflation since there has not yet been much research in this area, and the available evidence is mixed. Historically, inflation and interest rates have generally been lower when economic growth is low. In this model, inflation and interest rates fall broadly together in the climate pathways which means that the real interest rate does not change that much. That is, in the coming 20 years, real rates are assumed to decline by 10 (Paris) to 15 (Failed Transition) basis points relative to the baseline. By 2060, real rates are expected to be 30 (Paris) to 60 (Failed Transition) basis points lower than the climate-uninformed baseline. However, plausible narratives can be constructed in which interest rates fall but inflation is stable or even rises. As an example, Aon has produced a “Forced Green” scenario in their Climate Change Challenges paper, Aon (2018), which explores the impact of delayed action for five years, with governments eventually forced to address greenhouse gas emissions due to increasing extreme weather events leading to lower nominal yields but higher inflation. Such scenarios, which are not considered in this paper, could lead to significant increases in the value of inflation-linked liabilities.
Existing research on how climate change affects financial market volatility is limited and inconclusive. Volatility might increase as the physical and transition impacts of climate change unfold, particularly if this happens in an unpredictable manner. Due to the inconclusiveness of the research, the modelling does not make any allowance for this, except in the Paris Orderly Transition Pathway during the period 2024–2026 while pricing-in of climate-related risks takes place.
The outputs of this paper focus on median results and compare the projections to a “climate-uninformed” baseline that assumes historic trends with no allowance for additional climate impacts. Almost all the charts and tables are referenced to this baseline, so that calibration of the baseline largely cancels out, enabling the discussion to focus on the economic and financial impact of the three different climate pathways. The impact on tail risks will be significantly influenced by any increases in financial market volatility and thus we have focused on median results in this paper. Future work could be undertaken to consider the impact of different baseline assumptions and further investigation of tail risk impacts.
There is a great deal of subjectivity in the assumed timing of market movements. In our model the biggest market movements under a Failed Transition Pathway occur after 2030. Those looking to mitigate the impact of the risks described should be wary of the timing risk they may be taking on and in particular the potential for an output to flatter a particular approach which is highly dependent on the timing within a model, if this is relatively arbitrarily assumed.
The modelling does not incorporate any changes to the definitions of UK inflation measures, for example in the gap between retail price index and consumer price index (CPI) measures. The effects of any changes are expected to be very similar under each scenario, so there would be minimal impact on the gap between the climate-aware scenarios and the climate-uninformed baseline.
The modelling is based on market conditions at 31 December 2019 and makes no allowance for subsequent events, notably the COVID-19 pandemic.
Furthermore, it should be noted that the modelling does not consider broader environmental tipping points and knock-on effects, such as climate change related migration and conflicts. Nor does it consider the potential for food or other resource shortages which may lead to both lower GDP and higher inflation. In aggregate, it is quite likely that the modelling is biased to underestimate the potential impacts of climate-related risks, especially for the Failed Transition Pathway.
4. Macro-economic Impacts: GDP, CPI and Interest Rates
This chapter demonstrates the impact of climate-related transition risks/opportunities as well as physical risks on macro-economic variables by looking at the outputs of the Ortec Finance Climate MAPS model.
As described in the previous chapter, the modelling starts with a non-equilibrium, macro-econometric model (E3ME) containing modules representing the economy, energy and the environment. E3ME makes allowance for perturbations caused by changes in productivity, sector outputs, demand/supply relationships or supply chain dependencies and project the impact of such changes on economic growth through time. This climate-aware growth outlook is integrated into Ortec Finance’s stochastic financial model, enabling a climate-aware stochastic financial scenario set, where all economic and financial variables are calculated for the different climate change pathways. In a nutshell, Climate MAPS delivers insights as to how the integration of three types of climate risks (transition risk/opportunities, gradual physical risks, extreme weather events) changes expectations for economic growth, CPI, interest rates, and how, via historic relationships between variables, this also changes risk-return expectations across all asset classes. Further details of this integration in the model is given in Appendix B.
The timing and relative effect of the different climate-related impacts are calibrated differently in the three global warming pathways, as shown in Figure 1.
The calibrations have been undertaken with regards to expected climate impacts within each pathway as well as against historically-observed changes and disruptions. The economy may adapt better than history suggests and experience may be better or worse than assumed. But, as noted in Chapter 3.2, there are also many more impacts that are not accounted for, in particular the potential for damage to biodiversity, food supply, climate-related migration and heightened geopolitical tensions. For a given pathway, it seems more likely that the longer-term impacts are under-estimated in the modelling rather than over-estimated, particularly in the Failed Transition Pathway.
4.1. GDP Impact: UK and World to 2100
We examine the impact of the climate pathways by first considering the impact on GDP expressed as a percentage of baseline GDP where there is no explicit allowance for climate change as shown in Figure 2.
In the UK, the initial impacts on GDP in the Paris pathways are fairly limited, with positive stimulus effects of low-carbon investment offset by physical impacts and decommissioning carbon intense activities, as shown in Figure 2. In the longer-term, investments in low-carbon electricity and energy efficiency improvements are paid back, resulting in lower levels of consumer spending. Although the UK benefits from the recycling of carbon tax revenues (through reduced VAT and income taxes), this effect is not sufficient to outweigh the negative impacts of physical risks, higher prices for consumers and debt repayment, driving an overall small negative transition impact on GDP in the long-term.
The impact on UK GDP from the Failed Transition Pathway is initially similar to the Paris Transition pathways. However, the higher impact of physical damages is noticeable even by 2040 and continues to accelerate as the physical impacts increase, resulting in GDP which is 60% lower than baseline by 2100.
Ortec Finance’s modelling indicates that over the longer-term the UK is expected to experience larger GDP impacts from the physical effects of climate change than the European average, in particular under the Failed Transition Pathway. This is because many UK cities have relatively higher exposure to extreme weather event risk as they are at higher risk of more severe flooding.
The World GDP projections are similar to the UK, albeit GDP declines further to 20% below baseline by 2100 in the Paris Pathways and is 73% below baseline in the Failed Transition Pathway, reflecting the higher physical impacts on the world as a whole.
Figure 2 illustrates the long-term impact that climate change can have on GDP and in particular how the physical impacts of a Failed Transition could damage the long-term economy. Relative to no climate change, the median projected long-term impacts of Paris transition are very modest. For example, the total fall in UK GDP (relative to baseline) under the Paris pathways is 11.5% to 2100 which is 0.15% p.a. In contrast, the median projected drop in UK GDP to 2100 under the Failed Transition Pathway is 60%, which is 1.1% p.a. It is notable that in the Failed Transition Pathway GDP tracks the Paris pathways fairly closely in early years, but then climate impacts accelerate through to 2100.
Further details on the decomposition of GDP impacts by type of climate risk (transition, gradual physical, extreme weather and financial market sentiment) are given in Appendix C.
4.1.1. Nominal GDP growth under climate pathways: UK and World
The charts of nominal GDP show that, in the long run, unmitigated climate impacts (Failed Transition) are projected to overwhelm the intrinsic growth of GDP which starts to fall in both the UK and globally, as shown in Figure 4. The damage and disruption caused by climate change overwhelm the capacity for productivity and innovation gains. This would create a fundamental challenge for modern financial markets which have no precedent for long-term falls in world GDP.
Climate-adjusted GDP UK and World growth (2020 = 100).

As noted in Chapter 3.2, these projections make no allowance for geopolitical tensions, migration and food supply disruption which are likely to significantly add to the negative impacts. And finally, these charts show median outcomes.
On the other hand, a low-carbon transition that achieves the Paris Agreement targets, especially if done in an orderly manner, does not have noticeable negative consequences on GDP until mid-century. The lower growth expectations even under a successful transition are primarily explained by two factors: the repayment of debt that helped finance the transition; as well as the increasing impacts of physical risks in a + 2°C world compared to what we experience today (approximately 1.1°C world). Even the later years’ impacts remain modest at approximately 0.3% p.a. lower world GDP growth over the period 2020–2100.
4.1.2. Regional GDP impacts
In studying the GDP impacts, it should be noted that there can be considerable variation in the impacts across geographic regions. These differences are mainly caused by the level of transition risks over the short-term and physical risks over the longer-term. Examples are given in Figure 5 which shows the differences in GDP impacts across four countries (Canada, China, UK and US).
Climate-adjusted GDP growth across regions and climate pathways (ratio of cumulative medians to the cumulative median of climate-uninformed baseline pathway).

In a Paris transition, Canada GDP takes an initial hit due to the steeply decreasing demand for its tar sands and other energy-intensive fossil fuel extraction. Longer term it recovers almost all of the losses due to its other natural resources and the ameliorating climate being a net positive with 2 degree warming. However, in a Failed Transition, whilst the short-term impacts are neutral, in the longer term the negative physical climate impacts of 4 degrees warming on the Canadian and the world economy overwhelm the initial ameliorating climate effect.
Similar to the UK, the initial Paris pathways in China are similar to baseline. But China is more sensitive to longer-term physical risks which means greater longer-term GDP impacts with declines by 2100 of 20% for Paris-aligned pathways and 70% for the Failed Transition relative to baseline.
In the US, there is a slight initial net GDP loss under the Paris-aligned pathways reflecting reductions in shale fossil fuel and coal production, but it is not nearly as severe as Canada. The longer-term physical impacts of the Paris-aligned pathways are approximately 15% of GDP by 2100, i.e. between those of UK and China. US is also between their sensitivities to the physical risks in the Failed Transition Pathway which drops approximately 65% by 2100 relative to a climate-uninformed baseline.
As these examples illustrate, transition and physical impacts are likely to play out rather differently in different countries around the world. Thus, to consider the long-term impacts of climate change it is important to consider these country-level insights into systemic climate risks in addition to a micro-level analysis of individual assets.
4.2. CPI Impact
In the current modelling set-up and assumptions, CPI is not shocked separately, but is affected via the historic relationship with GDP. A reduction in long-term economic growth is assumed to lead to a reduction in inflation in the long term, as has occurred in previous recessions. However, it might be the case that certain climate impacts cause a negative supply shock, particularly on food, and in this case one could expect CPI to increase in the short term, although this potential impact is not modelled.
The modelling of CPI, and all financial market impacts, stops at 2060, as shown in Figure 6. This is because the relationships with unprecedented downward-trending GDP cannot be reliably determined. Furthermore, other variables such as agricultural production and inflationary impacts of supply chain disruption are not modelled and are likely to be material factors for inflation in the second half of the century.
Climate-adjusted CPI (annualised difference of medians to median climate-uninformed baseline pathway).

Within the Paris Orderly Pathway, the median modelled UK CPI impacts relative to the climate-uninformed baseline are very modest, less than 0.1% p.a. until 2050 when they decline towards 0.3% p.a. lower than the baseline. The initial slight rise is due to the higher investment demand for the low-carbon transition. It then declines as GDP declines, with fractional interactions between investment, debt repayment and physical damage. Longer term, CPI is assumed to drop to approximately 0.3% p.a. lower than the baseline, reflecting the fractionally lower GDP growth.
The transition shock of the Paris Disorderly pathway creates short-term inflation volatility, but inflation then settles along the Paris Orderly level from 2035 onwards.
In the Failed Transition Pathway, CPI drops to 0.5% p.a. lower than baseline by 2060, reflecting the lower GDP growth. As noted above, other factors that have not been modelled may increase rates of inflation although higher costs of production would reduce GDP further than projected by the model.
4.3. Nominal Interest Rate Impact
The median of the UK 20-year government interest rate is not affected much in the short-term due to limited GDP impacts across all the pathways, as shown in Figure 7. In the mid-term, the UK experiences some negative impacts from higher debt due to the transition. In the longer term, the UK gilt yield declines due to lower GDP forecasts. This long-term fall is relatively modest in the Paris pathways (0.4% to baseline by 2060 which has an assumed nominal interest rate of 4.2%). However, the significant drop in GDP for the Failed Transition Pathway leads to a more significant (1%) drop in yields in 2060 relative to the baseline. 20-year UK gilt yields are relatively insulated within the Paris Disorderly pathway. The impact of a disorderly shock is assumed to be relatively modest with an initial yield rise, some volatility and then returning to the same path.
Climate-adjusted 20 year nominal yields of UK government and investment grade bonds (annualised difference of medians to median climate-uninformed baseline pathway).

Investment grade bond behaviour for the Paris Orderly and Failed Transition Pathways is assumed to be quite similar to sovereign bonds, although the Failed Transition effect is slightly smaller in the long term (0.8% drop versus 1%) because spread levels are expected to increase due to increasing physical risks. However, the market disruptions, within both the Paris Disorderly and Failed Transition Pathways, are more pronounced for investment grade bonds, leading to greater volatility.
5. Financial Insights: Impact on Global Equity Markets
The modelling translates the climate-adjusted GDP expectations and impacts on inflation and interest rates to asset classes, regions and sectors via a stochastic economic scenarios generator.
This chapter looks at the insights the model provides on global equity market impacts through to 2060, as shown in Figure 3.
Both the Paris pathways have a significant impact on global equity markets, especially over the next 10 years. The Paris Orderly Transition Pathway shows a median drop of 6% relative to baseline in the early years reflecting investment in the transition, disinvestment from fossil fuels and the pricing of long-term physical impacts. Cumulative equity returns very gradually decline longer-term due to the ongoing physical impacts and lower than expected GDP. In the Paris Orderly Transition, the nominal median return is relatively low over the short-term but recovers over the long-term. Over the whole period to 2060, it represents a reduction of 0.4% p.a. to median equity returns.
The Paris Disorderly Transition has limited equities impact in the early years followed by a significant shock in 2024–2025 with a drop of 18% in global markets compared to baseline. Sentiment recovers, but there is a permanent further loss of around 10% of value relative to the Paris Orderly Transition median. On a nominal basis, this still means a significant shock in 2025, with a recovery thereafter. Over the whole period to 2060, it represents a reduction of 0.7% p.a.
There is limited transition cost in the Failed Transition Pathway. Instead, this pathway has two step downs in market value in 2025–2029 and 2035–2039, as investors price-in the future physical impacts of climate change (to 2050 and then 2100 respectively). The trajectory further declines as lower GDP impacts expected returns, leaving a long-term reduction in equity returns of 50% compared to baseline. Beyond 2060 real GDP growth becomes structurally negative and the relationship with market returns too hard to project, but a rapid acceleration of this downward trend would be expected.
On a nominal basis, this means that cumulative equity returns under the Failed Transition Pathway stay positive from a 2020 starting point, but reflect a drop of approximately 1.7% p.a. that accumulates between 2025 and 2040 and with longer-term physical impacts.
The graphs in Figure 8 show the model’s projected impacts on median equity market returns by year from 2020 to 2060, split between these contributions:
-
Transition: cost of transition policies, required investment and decommissioning fossil fuel production
-
Gradual physical risks
-
Extreme weather risks
-
Pricing shocks: transition, physical and extreme weather, allowance for market repricing of the core expectations of these future costs
-
Sentiment shock: in the disorderly pathway, markets add sentiment shock due to sudden realisation of climate-related impacts (a “Minsky moment”).
Global equity median returns (year-on-year) per climate pathway: contribution analysis by climate risk factor.
NB: Figure 8 graphs have different scales, with the Paris Disorderly and Failed Transition Pathways exhibiting larger impacts.
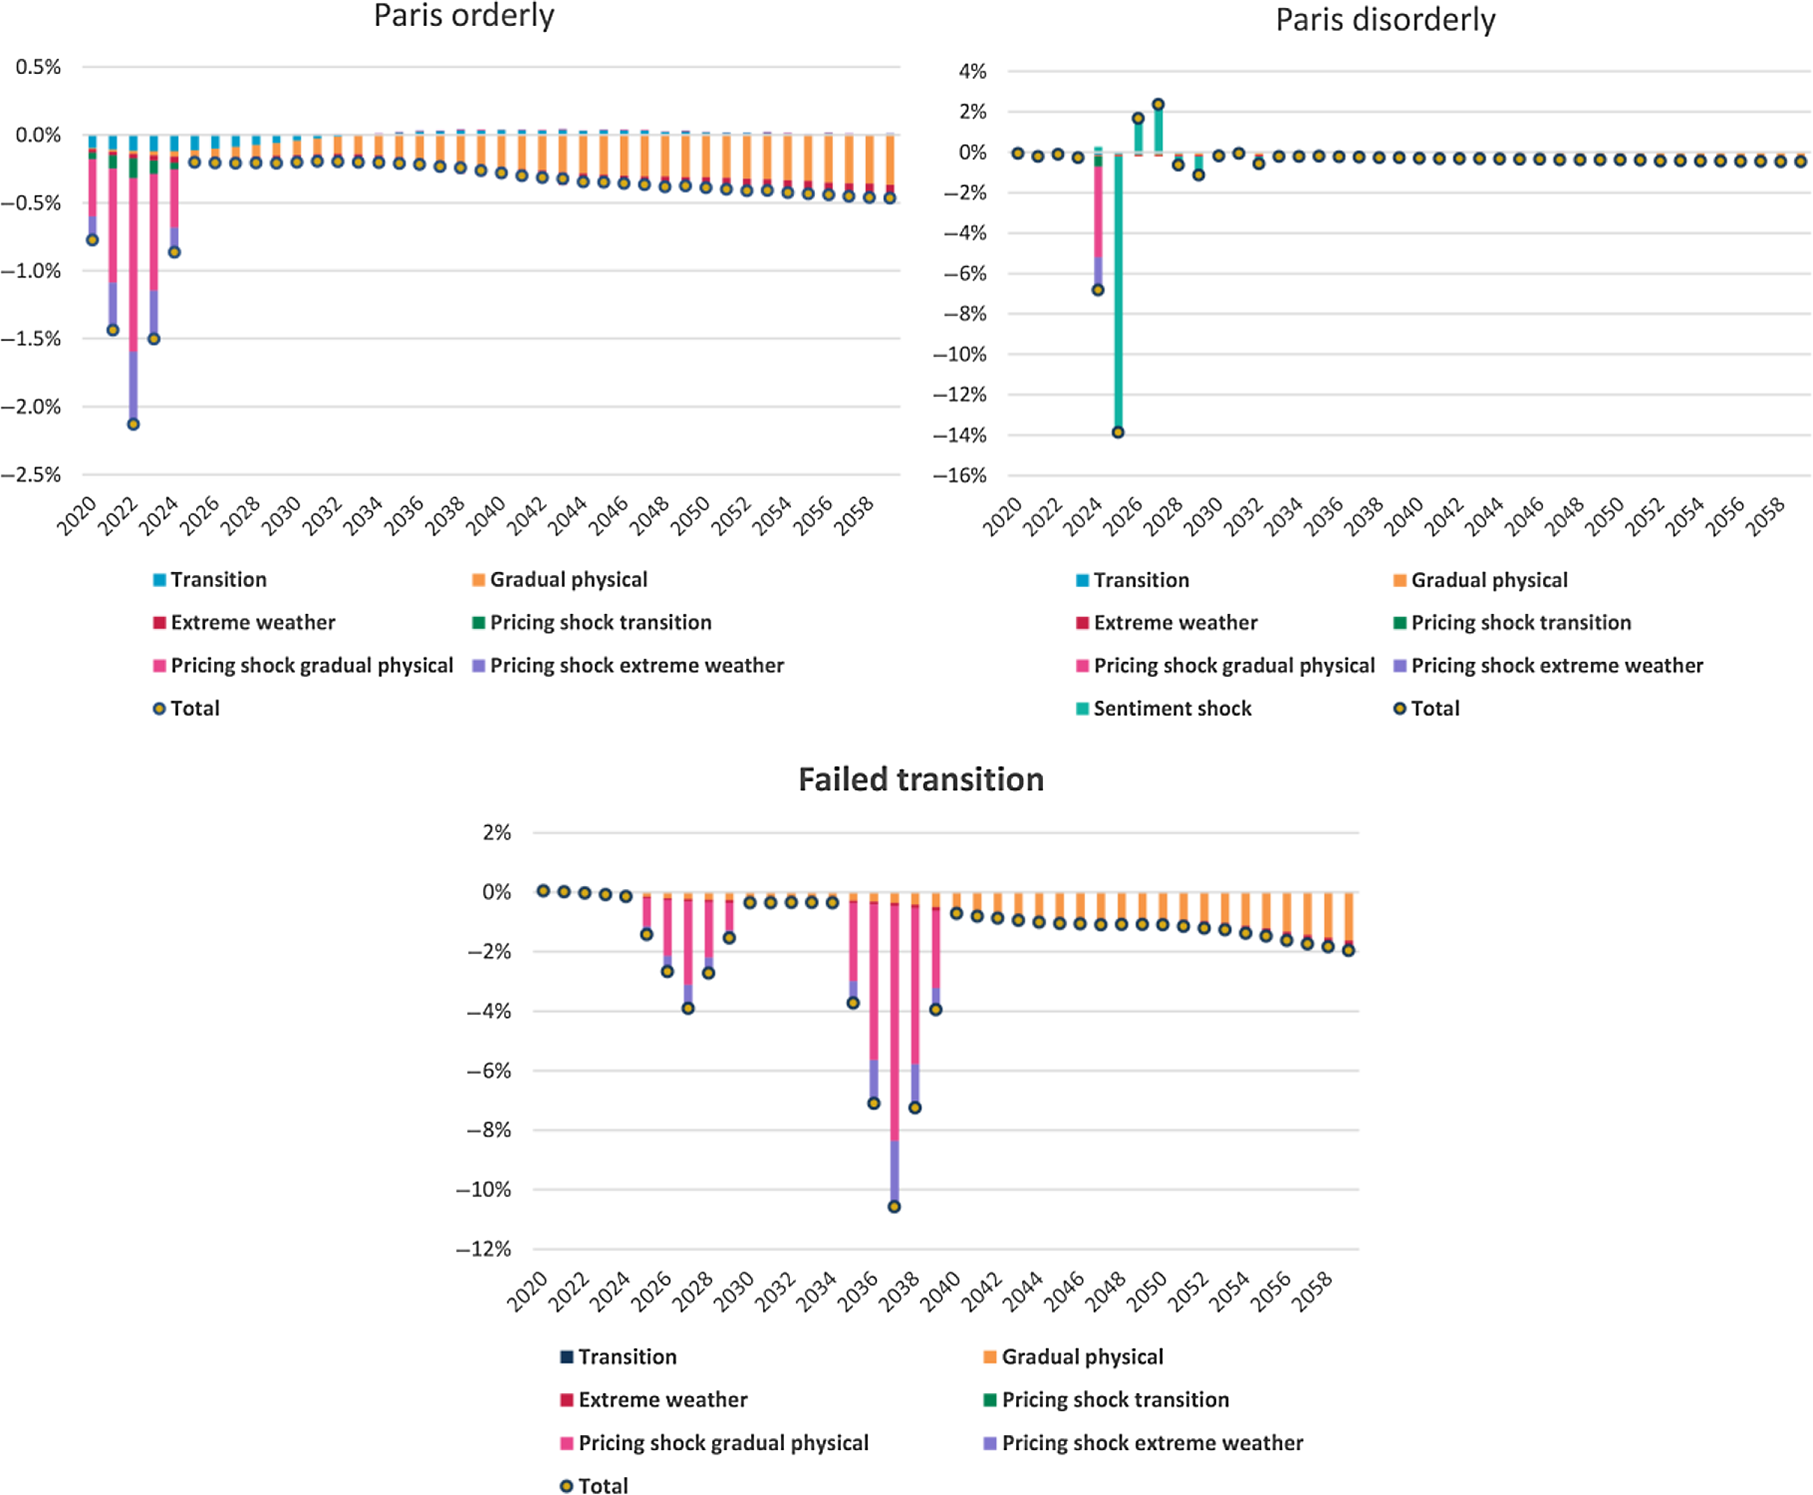
The most significant contributions within a specific pathway vary over different time periods. It should be noted that the exact timing and number of years these impacts are spread over are functions of the choices within the pathways. So these graphs are merely representative of the patterns. For example, it is not possible to predict whether a Paris Disorderly shock will happen in 2025, but the pattern given is reflective of what may happen if we had such a shock in the next decade.
As the expected short-term impacts on GDP are relatively limited, global interest rates are not significantly affected in the short run. The main driver of differences in equity investment returns in the coming decade between the different pathways is therefore a potential price correction (“pricing-in”). That is, at a certain point in time, financial markets will realise the extent of both the longer-term impacts of the transition to a low-carbon world under the Paris pathways and the impacts of gradual physical risks (such as reduced agricultural productivity) and extreme weather events (whether the transition succeeds or not). By translating these impacts to changes in future expected output, earnings and dividend growth, the model estimates the expected price correction by financial markets. This price correction differs by climate pathway and by country and sector. Finally, we also note that the yearly impact within the Paris Orderly pathway is much, much more modest than the other pathways, the maximum deviation from baseline is just over 2% against 14% and 10% for Paris Disorderly and Failed Transition respectively.
5.1. Paris Orderly
In the Paris Orderly Transition Pathway, we assume that pricing-in will take place in the coming five years, i.e. 2020–2024. During this period, equity returns are impacted by the impact on earnings of the transition costs and a repricing due to the lower long-term future expected earnings and dividends in fossil-fuel-intensive sectors.
Future physical risks explain most of the lower long-term returns and thus the repricing in the short-term. Long term, there is a modest net repayment for the transition investments. The majority of the longer-term impact is then addressing the cost of the gradual physical risks as they arise. The pricing-in shock in 2020–2024 only takes into account impacts until 2050, so physical impacts beyond that date are not priced in yet, impacting markets only at a later stage. Furthermore, although we assume that financial markets have a general understanding of the long-term impact of physical risks, and this is priced-in in the coming years, we do not assume perfect foresight. Because the exact timing of physical risks and extreme weather events materialising is uncertain, they still have some impact on financial markets when they actually occur. The overall long-term physical impacts remain modest at approximately 0.5% p.a.
5.2. Paris Disorderly
In the Paris Orderly Transition Pathway, we assume that pricing-in starts later, in 2024, and that the full price correction materialises within one year. This large price correction leads to negative market sentiment, and consequently to a sentiment shock in 2025, followed by (positive) price corrections in consecutive years to compensate for the overshooting in previous years. Market volatility is extremely high in this 2024–2026 period. Over the long-term, the impacts are the same as Paris Orderly but not directly visible on this chart due to the scale.
5.3. Failed Transition
The initial impacts of the Failed Transition Pathway are negligible as the current physical impacts of climate change have little global economic impact. There are no additional transition costs relative to those required in current climate policies, which are included in the baseline. However, in the second half of this decade, we assume that investors will start to realise that the transition to a low-carbon economy will fail. Therefore, in the period 2025–2029 they will price-in the resulting impact of increasing physical risks and extreme weather events on expected future output, earnings and dividend growth up to 2050. The pricing-in of these physical impacts is significant (up to 3% p.a.) and larger than in the Paris pathways.
However, in the Failed Transition Pathway, physical risks will increase very significantly in the second half of this century. At some point in the future, financial markets will start to price-in these very substantial post-2050 physical risks. We assume that this occurs in the second half of the 2030s. These impacts are not only larger (up to 8% p.a.) but also have substantial adaptation costs as well.
In the longer term, the Failed Transition Pathway is impacted by physical risks impacts as they occur. These become significant, rising to over 2% p.a. by 2060. Again, this limits the forecasting horizon of the model, as the physical damage now starts to overwhelm GDP projections and assumed relationships between the economy and markets are likely to break down. Furthermore, impacts on food production, water scarcity, migration and geopolitical risks (which are omitted from the modelling) are almost certain to be significant factors at or before this point.
Zoom-in: Pricing-in effects on global equity returns per sector
As discussed in Chapter 2.1, climate risk impacts can also be explored from a bottom-up perspective. The model can provide some insights into this by considering the impact by sector.
Figure 9 depicts the impact on global equity returns from the pricing-in shock per sector across the different climate pathways. As can be seen, only the low-carbon utilities sector sees positive returns compared to the baseline scenario under the two Paris pathways. All other sector equity returns are negatively impacted by the Paris pathways, in particular the Energy and Other Utilities sectors. The physical risks of the Failed Transition Pathway also negatively affect sector equity returns.
This is a relatively high-level perspective, but gives an indication of potential mitigating actions that financial institutions can take, such as refocusing investment approaches away from market cap weightings, increasing allocations to less impacted sectors and allocating less to highly impacted sectors. However, it also shows that whilst such mitigation could be beneficial under the Paris pathways, there would be only modest benefit in the Failed Transition Pathway in which all sector outcomes are negative and differences are modest. Moreover, given only one small sector is positively impacted in the Paris pathways, it is effectively impossible to build a diversified portfolio that fully hedges climate risk, even for the Paris pathways.
Finally, note that these graphs reflect the impact on sectors relative to the baseline. If sectors such as Low Carbon Energy were significantly overvalued at the point of purchase, they could still underperform the rest of the market. Similarly, a very undervalued sector might outperform even if the climate impact was negative.
Percentage difference in the median total equity return from 2020 to 2030 due to sectoral pricing-in shocks (relative to climate-uninformed baseline).

6. Conclusions
There is an increasing expectation that financial institutions use scenario analysis to understand their potential exposure to climate-related impacts. This paper illustrates the outcomes from one possible approach that uses a top-down model to explore the financial impacts of three plausible climate pathways.
It is important to note that the scenarios illustrated are not intended to be extreme. The climate impacts under “worst case” scenarios could be much larger than those illustrated. However, these impacts alone are quite dramatic, particularly for the Failed Transition Pathway in which:
-
UK GDP is 60% lower than baseline by 2100, with similar impacts globally. Indeed, in the longer term the physical damage caused by climate change is expected to outweigh the economy’s ability to grow, resulting in GDP declining from the 2060s and future generations being worse off than their parents.
-
Financial market impacts will also be significant, with permanent declines in median cumulative equity returns of 50% relative to baseline by 2060 and an accelerating downward trend.
There are also significant short-term risks for financial markets, especially in the Paris Disorderly pathway:
-
Equity markets fall by 18% relative to baseline within two years, although the median then recovers part of those losses by 2028.
-
There could be a spike in corporate investment grade yields of around 0.5% p.a. at the same time, although yields are assumed to recover quicker than equity markets.
A Paris Orderly Transition would have less severe short-term impacts, with dampened equity market returns over the next five years, and minimal interest rate impact. Longer-term, the Paris-aligned pathways also underperform the climate-uninformed baseline due to lower GDP growth. Their median equity returns to 2060 are approximately 0.4% p.a. and approximately 0.7% lower for the Orderly and Disorderly pathways respectively.
The lower GDP growth also leads to lower long-term sovereign interest rates by 2060, which are down approximately 0.4% p.a. under both Paris pathways and approximately 1% p.a. in the Failed Transition.
These represent significant market risks and have significant implications for financial planning within financial institutions over both short- and longer-term horizons. Our companion paper “Climate scenario analysis for pension schemes: a UK case study” provides an illustration of how this analysis can be applied to a UK pension scheme.
There are also implications for financial modellers. These different climate pathways are not represented in historical data and modellers should consider the degree to which the impact on expected returns and volatility is reflected in their assumptions, as well as how they might advise their clients on managing the short- and long-term risks that the modelling of these different climate pathways has illustrated.
The implications for markets and GDP should be noted by regulators and policymakers. Policymakers in particular should consider the long-term implications for economies that are projected to contract in a Failed Transition Pathway. The broader real-world consequences of failure to transition such as food shortages, migration and conflicts, are currently not captured by the model and are likely to make the actual impacts far worse.
This paper reflects outputs from one model. Climate scenario analysis for financial institutions is a relatively new area where significant work is currently underway. The examination of the climate impact calibrations and comparisons with alternative models is outside the scope of this paper, but we hope that the results provide a useful data point against which other model outputs can be compared. A comparison of the calibrations across these different models could be considered in future papers.
Over the next few years, we do expect climate-financial modelling approaches to become more sophisticated and for consensus to start to emerge around which scenarios and calibrations to use. In the meantime, we hope this paper is helpful to actuaries and others in demonstrating the potential impacts of climate change and their potential significance over the longer-term.
Appendix A. Modelling Methodology
The modelling methodology was developed and tested in 2018 by Ortec FinanceFootnote 1 during a joint pilot project with its strategic partner Cambridge EconometricsFootnote 2 along with leading academics and a group of clients. After being made more broadly available in early 2019 asset owners, asset manager and insurance companies from around the world have used the methodology for informing their strategic investment policy.
Methodology Explained
The climate risk integration logic applied in order to “tie together” climate science, macro-econometric modelling and financial modelling has been shaped and can be explained as shown in Figure 10.
Systemic Climate Risk Scenario Solution: climate risk integration logic.

The climate change impact per global warming pathway and the policy and technological changes necessary to reach the different temperature targets are based on robust climate science. These assumptions inform the macro-econometric model of Cambridge Econometrics, which takes into account worldwide macro-economic interactions. The Cambridge Econometrics E3ME model is a non-equilibrium global macro econometric model with linkages between the economy, the energy sector, and the environment, Cambridge Econometrics (2019). It can fully assess both short and long-term impacts and is not limited by many of the restrictive assumptions common to Computable General Equilibrium (CGE) models. The model facilitates the integrated treatment of the world’s economies, energy systems, emissions and material demands, see Figure 11. This enables it to capture two-way linkages and feedbacks between these components.
E3ME model schematic representing key components and interactions between them.

The outputs from the macro-econometric model are deltas (differences) in annual growth rates per country, from a macro-economic baseline outlook that does not make allowance for any climate specific impacts i.e. that is climate-uninformed.
This climate-uninformed baseline assumes the same implicit rates of innovation, physical climate damage and fiscal shocks that have been observed in the past. It assumes no increase of physical risks due to climate change and does not make any explicit assumptions about the transition to a low-carbon economy. This enables the examination of the impact of different climate pathways but the financial impacts outlined within this paper suggest that this assumption does not remains credible.
Within the climate-uninformed baseline pathway, financial returns for each asset class are based on long-term assumptions related to GDP growth and adjusted for market conditions at the start of the modelling period (31 December 2019). The median returns for each asset class, as well for the example pension scheme’s total assets, are summarised in Table 1.
To calculate the asset class returns in each climate pathway, the “climate-adjusted GDP deltas” per country/sector, per year, are then input into the Ortec Finance stochastic financial model. This model translates the impacts of the climate-adjusted GDP shocks onto a wide range of financial and economic variables (including interest rate, inflation, impacts on different asset classes) via stylised facts based on historic data and economic rationale.
The resulting systemic climate risk-aware scenarios set delivers quantified climate-adjusted consistent global economic and financial outlooks up to 2060 differentiated per country/sector and per global warming pathway, which then can be used for climate-informed portfolio analysis. Given that this analysis is compared to the climate-uninformed baseline, the first order effects of the assumptions in the financial projections cancel out to enable a focus on the relative outcomes of the different pathways. Of course, second order effects from the assumptions and GDP projections remain. We have not investigated the sensitivity of the results to these impacts.
It should be noted that the pathway assumption narratives extend out to the end of the century as this aligns with climate science time horizons. Financial modelling is not extended beyond 2060 as, under the Failed Transition Pathway, changes might become so dramatic that stability of the entire financial system is at risk. This is uncharted territory and would render quantified modelling results very uncertain. It should be noted, however, that in order to capture in particular the likely severe physical risks beyond mid-century under the Failed Transition Pathway, these structurally lower growth expectations have been “priced-in” in the period 2035–2039.
Ortec Finance updates its climate-informed scenario sets every six months to reflect the latest market situation, as well as to capture any advances in climate science and next iterations of the modelling methodology. The scenario sets used here reflect December 2019 market conditions and incorporate all the modelling updates up to March 2020.
Scope of the Modelling
Figure 12 summarises the scope of the available forward-looking climate-informed real-world scenarios and asset class risk assessments. The asset classes modelled in this paper are calibrated to represent broad market, institutional-like exposures.
Scope of Climate MAPS model.

The energy transition sectoral impacts are captured directly within the equity market modelling and allowance made for the compositions within each regional market. These impacts are not directly captured within the credit markets modelling (eg allowance for the higher energy exposure in US High Yield) although there is an implicit allowance through the connection of domestic credit markets with domestic GDP. (Credit markets with higher energy allocations typically reflect higher sensitivity to energy transition in their GDP.)
The systemic climate risk portfolio modelling tool helps investors to determine whether their current investment strategy is likely to be robust across different global warming pathways. The quantified results provide insights into the effects on risk and return of the risks associated with different climate pathways and how they differ per time horizon. In this way, trade-offs can be assessed between e.g. a Paris Disorderly Transition to a low-carbon economy and a Failed Transition Pathway. In addition, investment opportunities, e.g. innovative renewable energy or transport technologies, may be identified. In summary, the methodology captures the directional signal of potential impacts stemming from systemic climate risks for an investor’s investment portfolio.
Appendix B. Climate Pathway Narratives
The modelling in this paper considers two broad options for the future: either the world continues on our current path or we transition to a low-carbon economy. To represent these two alternative pathways, Ortec Finance has developed economic scenario sets to reflect these two variants: the Paris Transition pathway and the Failed Transition Pathway. These two pathways inform the underlying transition and physical climate risk parameters. Furthermore, the Paris Transition pathway is then broken down into two possible market reactions: orderly versus disorderly. In the latter case, the transition risks are supplemented by a confidence shock representing an aggressive market correction of carbon-intensive and related assets.
Each main pathway is built on key policy and technological assumptions across countries and sectors to represent transition risks and opportunities. Physical risks are composed of, on the one hand, gradual physical risks, such as sea level rise and temperature effects on worker and agricultural productivity. On the other hand, physical risk also derives from increasing frequency and loss impacts of extreme weather events, such as floods, storms, wildfires, that are attributable to climate change.
A continuation of current policies and technological trends will lead to increasing global CO2 emissions (Failed Transition Pathway) and in turn continuously increasing average global temperature reaching up to 4°C by the end of this century. However, in a pathway that limits warming to below 2°C, CO2 emissions peak in 2020 and decrease sharply to reach net zero before 2066 (in both Paris pathways), as shown in Figure 13.
Annual global CO2 emissions.
Note: Only CO2 emissions from fossil fuel combustion and industrial processes are currently included in E3ME: other greenhouse gases and emissions from land use, i.e. CO2 equivalents, are not currently modelled.

There is much uncertainty around the extent of the global temperature response to increasing emissions but not the direction. In order to calculate how these emissions trajectories map to a projected change in average global temperatures above pre-industrial levels as shown in Figure 14, we use a ratio of the globally averaged surface temperature change per unit carbon dioxide (CO2) emitted (transient climate response to cumulative carbon emissions; TCRE), Millar & Friedlingstein (Reference Millar and Friedlingstein2018). The TCRE in this paper (1.43–2.37°C per trillion tonnes of carbon (TtC) are within the established range for the TCRE used in other climate model simulations and are used widely in the scientific literature, including the IPCC Special Report on Global Warming of 1.5°C, although recent research suggests these figures may be underestimates, Forster et al (Reference Forster2019).
Expected average global temperature change (above pre-industrial level) until 2100.

The TCRE implicitly captures a unique relationship between CO2 emissions, non-CO2 emissions and total warming, although there is large uncertainty about the extent to which this relationship will continue in the future, Hausfather (2019).
Regional temperature anomalies are derived by adjusting the global projected temperature changes with the regional differences in vulnerability to temperature change from the IPCC.
Although there is uncertainty about the level of warming since the pre-industrial era, there is some consensus that levels of global warming were between 1.1 and 1.25°C above pre-industrial levels in 2018, as shown in Figure 15. Future warming effects are estimated by taking the cumulative emissions from 2019 onwards and multiplying them by the TCRE term, which translates total cumulative CO2 emissions to a change in temperature.
Global temperature change from multiple datasets, presented as the lower bound on warming since the pre-industrial era (defined here as 1720–1800), Hawkins et al. (2017).

In the Paris Transition pathways, we take assumptions for the current level of warming and the TCRE that are aligned to the consensus view coming from the climate literature. Specifically, it is assumed that temperatures were 1.1 °C higher in 2018 than in the pre-industrial era and the median TCRE, 1.84°C/TtC, is used to estimate the effects of cumulative emissions on temperature change.
In the Failed Transition Pathway, by contrast, to reflect a slightly more extreme case, we assume higher levels of current warming and a higher responsiveness of temperature to emissions. In this scenario, we assume that warming between the pre-industrial era and 2018 is approximately 1.25°C and that the TCRE is equal to 2.29°C/TtC.
The different assumptions about warming above pre-industrial levels and the TCRE in each scenario are motivated by:
-
The uncertainty around these parameters within the scientific literature: Failed Transition scenario uses a higher TCRE than the Paris pathways, reflecting recent research suggesting that previous TCRE figures may be underestimates; and
-
The fact that, due to non-linearities and tipping points, it is highly likely that the TCRE will be higher under higher warming scenarios.
Paris Orderly Transition Pathway
To reduce emissions in line with the Paris Agreement, economies must reduce their carbon intensity. Given the current state of play of technology (and likely technological trajectories) especially relating to energy efficiency and negative emissions, it is unlikely that current fossil fuel use can be maintained as well as meeting emission reduction requirements. This implies a strong shift away from fossil fuels, and related physical and human capital, business models and supporting financial and regulatory infrastructure. Almost every sector in the economy will have to be retooled in order to shift away from fossil fuel dependency in a very short time frame of one to two decades.
In the Paris Orderly Transition Pathway, political and social organisations act quickly and in a coordinated manner to meet the objectives of the Paris Agreement. With this immediate action, global CO2 emissions start to fall in 2020. Financing to meet ambitious decarbonisation investment goals is made available in all regions worldwide.
Demand for coal, oil and gas decreases steadily and the share of renewables in the electricity generation mix increases to almost 70% by 2050. There are investments in carbon capture and sequestration technology (CCS), including some limited deployment of net-negative emissions technologies such as bioenergy with carbon capture and storage (BECCS). The share of electric vehicles on the roads steadily increases to almost 70% by 2050 and a large share of the remaining conventional vehicles use biofuels instead of petrol or diesel.
A reduction in fossil fuel demand and prices leads to stranded fossil fuel assets. There is a negative economic impact in fossil fuel exporting regions (such as the Middle East and North America), where lower royalties from natural resource extraction deplete government revenues. In these regions, the double effects of reduced oil and gas export revenues and reduced government spending drives a negative impact on GDP.
Because of the timely awareness and response of policy and financial actors, the pricing-in of climate-related risks (transition and physical) takes place gradually over the period 2020–2024.
In many other regions, investments in low-carbon technology and energy efficiency measures, reduced dependence on imported fossil fuels, and the recycling of carbon tax revenues back into the economy, drive a short- to medium-term GDP stimulus (under the assumption of an orderly transition).
In this pathway, net-zero global emissions are achieved by 2066, but physical impacts continue to increase over the rest of the century due to the delays in the reaction to the temperature rises. Locked-in physical climate impacts in a 1.5°C world are less severe than in the Failed Transition Pathway, but nonetheless have negative impacts on growth when compared to today’s baseline in a world that is at roughly 1.1°C of warming, as shown in Figure 14. To illustrate this: the Climate MAPS model projects that even in the Paris-aligned pathways there may be a 20% increase in climate-related extreme weather events by 2050, increasing to over 25% in 2100 compared to the number of worldwide extreme weather events we observe today. In addition to the higher frequency, the severity of these events may be 10% more than what is seen today even under a successful transition scenario.
Paris Orderly Transition Pathway
The Paris Orderly Transition Pathway contains the same general transition and physical risk parameters as the Paris Orderly Transition Pathway. This means the adjustments in longer-term growth expectations implemented in the stochastic financial model are identical.
What differs, however is an assumption of belated awareness by financial market participants of the scale and speed of the transition required that will likely lead to additional systemic risk via two main channels:
-
1. Stocks and bonds of assets directly and indirectly related to carbon-intensive economic activities (“stranded assets”) are abruptly repriced within one year (2024),
-
2. with a consequential sentiment shock in 2025 and an increase in market volatility around these events (2024–2026).
The abrupt repricing, which is referred to as a “Minsky moment” by the Bank of England is assumed to be triggered by a sudden shift in investor sentiment. It should be noted that our modelling does not prescribe the exact trigger cause for a Minsky moment, but rather focuses on exploring the consequent financial implications of such a sentiment shock. In the event of a “Minsky moment”, fossil fuel assets may undergo a fire-sale by investors, at the moment when they fully understand the real risk involved in holding these in their portfolios. This would lead to a race to the bottom, where investors try to get rid of these assets as quickly as possible. This loss would propagate across the real economy and could threaten entire industries that are dependent on fossil fuel income.
This unexpected and aggressive market reaction causes an increase in uncertainty (loss of confidence). This in turn leads to greater fluctuations in market prices and greater deviations from the mean and therefore an increase in volatility. The shock and increased volatility in fossil intense sectors may lower overall market confidence and therefore impact other asset classes. It thus has a negative systemic impact on the financial market and the economy as a whole. Intuitively the narrative can be compared to the contagion and confidence effect that the crisis in the real estate sector had on the rest of the financial system and the economy during the 2008 financial crisis. In our narrative, however, it is fossil fuel related stranded assets that trigger the crisis instead of high-risk mortgage products.
Failed Transition Pathway
The Failed Transition Pathway reflects current policies as of 2019. This means that low-carbon policies in the Failed Transition Pathway are assumed to be a continuation of the existing policies and to have the same level of ambition, e.g. no carbon price-in most regions, except for the continuation of existing regimes such as the EU Emission Trading System. Similarly, low-carbon technology developments and the fall of relative cost of these technologies are limited compared to the Paris Transition pathways. As a result, the world will not succeed in reaching the Paris goals. Increases in consumption, particularly driven by economic growth in emerging economies drives an increase in demand for fossil fuels and increases in CO2 emissions globally.
The physical risks thus diverge significantly from those in the two Paris Transition pathways. By 2050, the planet is already around 2°C warmer than pre-industrial levels (increasing to around 4°C by end of this century), and many countries are suffering from extreme drought and water shortages. Melting permafrost and melting icecaps lead to feedback loops and tipping points which drive further increases in warming. Higher temperatures lead to negative health impacts (increased prevalence of heat-related illness) and affect infrastructure that is designed to operate most efficiently in much cooler climates. This leads to a less productive labour force. Agricultural productivity is also affected, and crop yields are reduced, which drives up food prices. Lower labour productivity and higher industry costs of production (e.g. due to higher insurance premiums resulting from the increasing incidence of climate-related losses) leads to an increase in prices. These impacts are reflected in aggregate by the drag on future GDP.
The number of climate-related extreme weather events will continue to rise. The number of climate-related extreme weather events in 2100 under the Failed Transition Pathway is expected to more than double from what it is today and their average impacts much more severe. By 2100 the losses from climate-related extreme weather events could be more than five-fold what we see today.
In addition to adjusted growth expectations, the modelling also takes into account market “pricing-in” effects from a physical risk perspective. After several severe extreme weather events hit the Western world, the market becomes aware of the lower expected market performance up to 2050 due to these expected physical impacts, which is priced-in over the period of 2025–2029. A second physical risk pricing in moment is modelled in the period 2035–2039 which reflects the physical risks beyond 2050. However, the modelling does not consider broader environmental tipping points and knock-on effects, such as climate change related migration and conflicts. Nor does it consider the potential for food or other resource shortages which may lead to both lower GDP and higher inflation.
Appendix C. Further Details on UK GDP Impacts
Figure 16 shows the modelled GDP impacts for the UK and World economy split by transition, gradual physical, extreme weather and sentiment shock risk.
Percentage difference in the median level of UK GDP explained by the various climate risk drivers (difference to climate-uninformed baseline pathway).
NB: the graphs in Figure 16 have different scales, with the Paris Orderly pathway exhibiting smaller impacts.
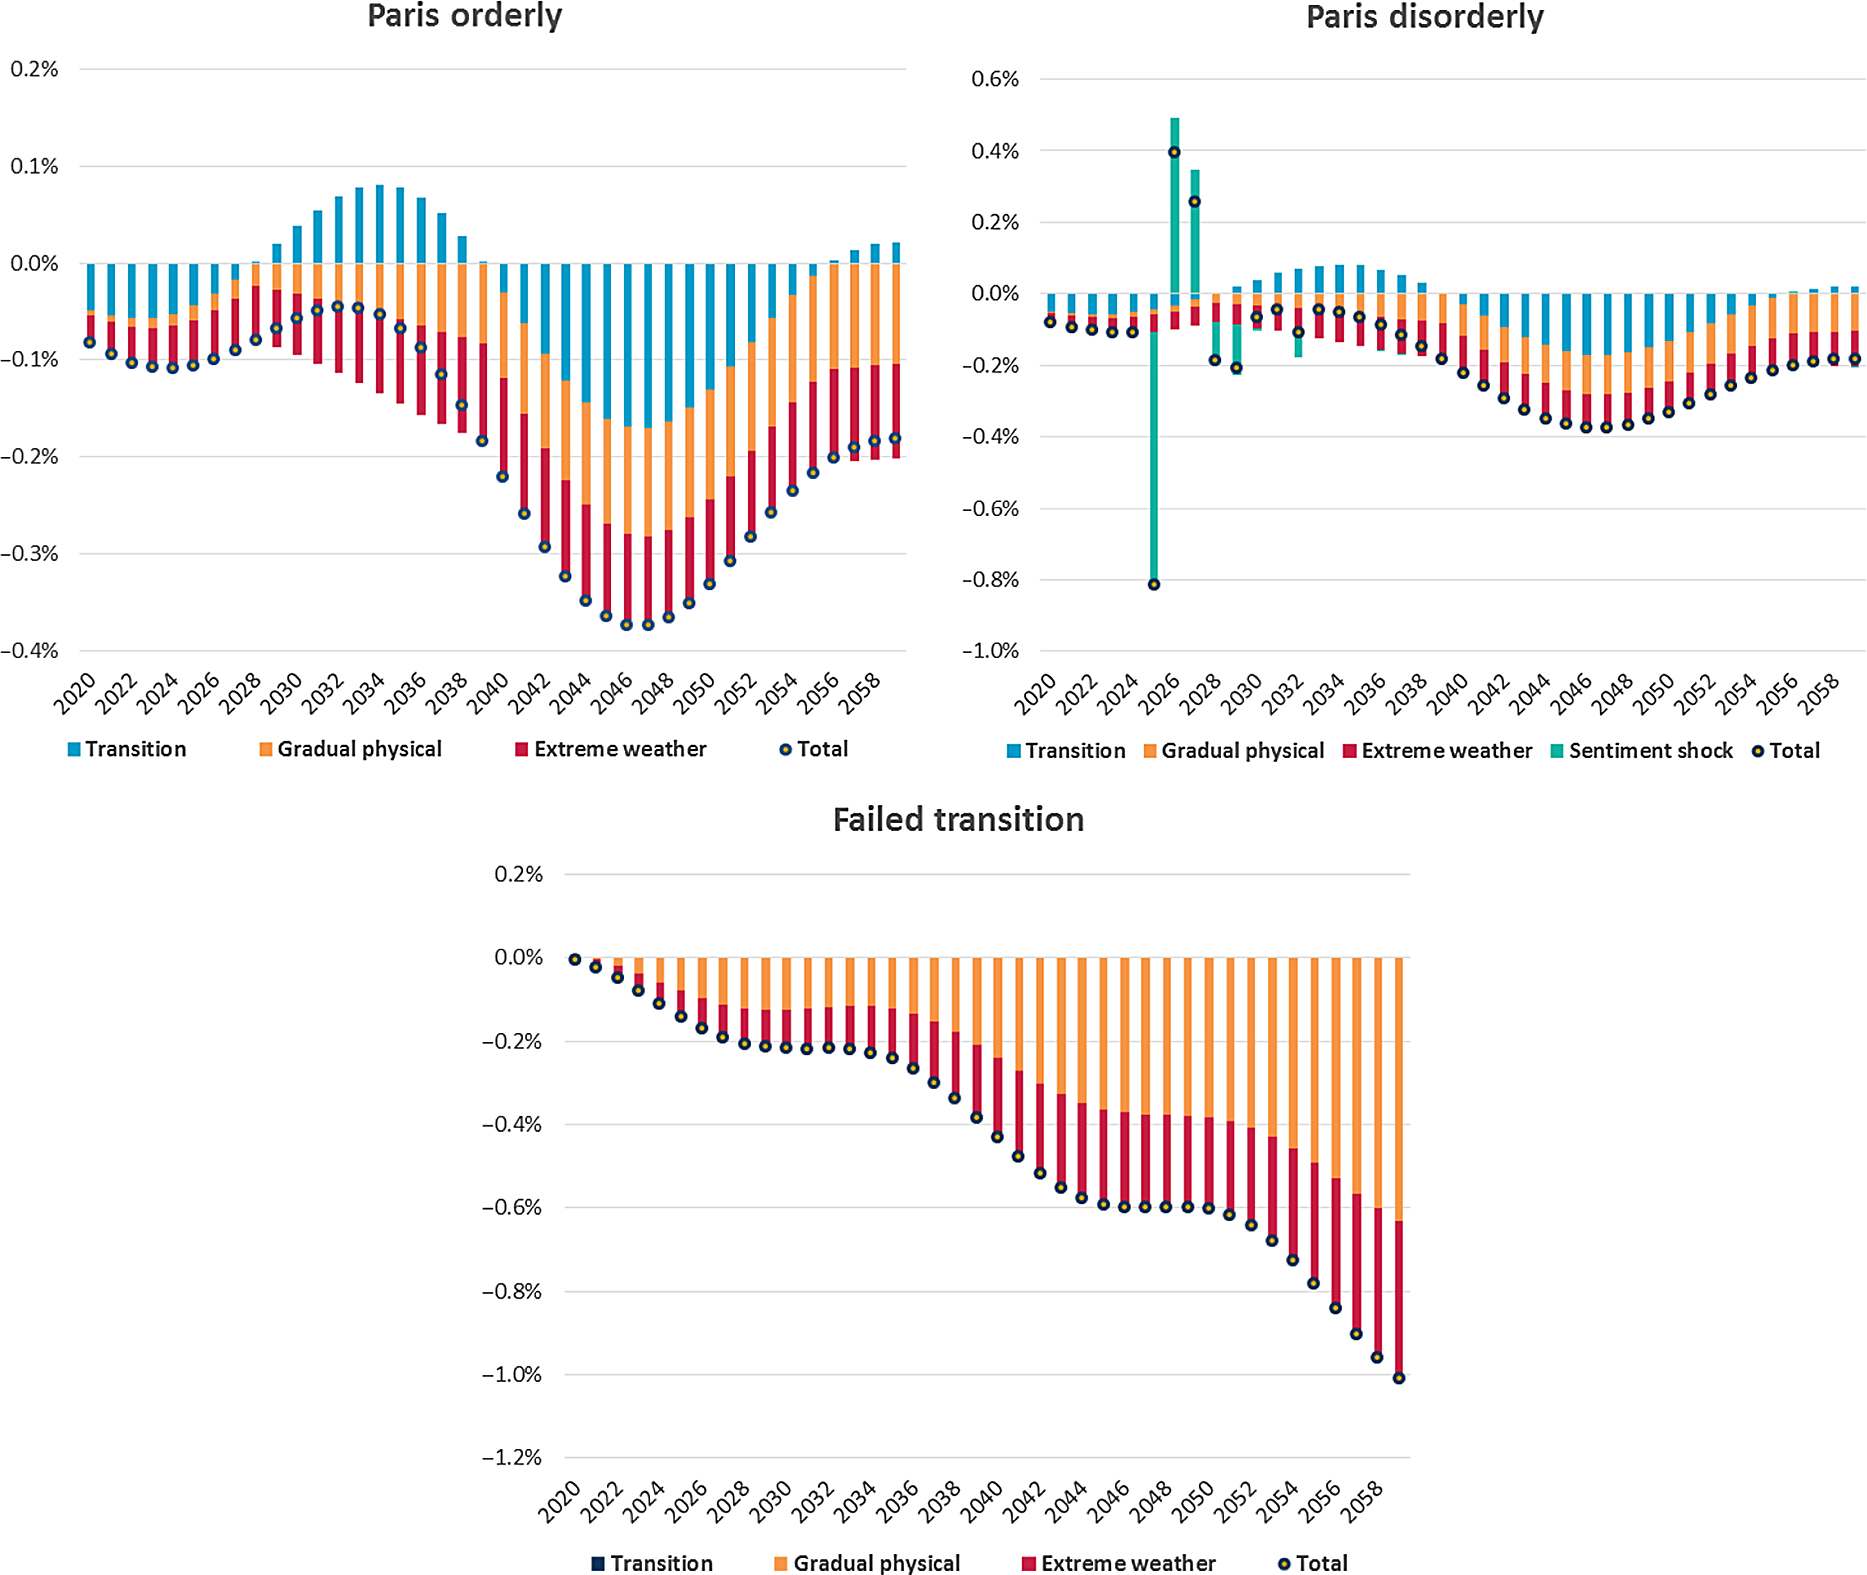
The expected impact of both successful and Failed Transition Pathways on annual UK GDP in the coming ten years is relatively limited. In the Paris Transition pathways, positive impacts driven by the stimulus effects of low-carbon investment and negative impacts driven by disinvestments and stranded assets in the fossil fuel and brown utilities sectors roughly compensate each other. In the longer run, although many countries benefit from the recycling of carbon tax revenues (through reduced VAT and income taxes), in the UK this effect is not sufficient to outweigh the negative impacts of debt repayment, driving the overall small negative impacts on GDP in the long-term.
Paris Transition
GDP in the two Paris Transition pathways is only modestly impacted throughout the period (at most 0.4% p.a.). There is a continual drag of 0.1–0.2% p.a. due to the gradual physical risks and extreme weather events. Around these are two sets of transition costs and opportunities:
-
In the first 8 years, the net impact of transitioning to a low-carbon economy is slightly negative.
-
In the second phase of the transition (2029–2039), the net impact is slightly positive. So some of the initial transition costs are repaid as positive effects in future years.
In the Paris Disorderly Transition, the sentiment shock in the markets is also expected to impact the real economy leading to a modest, additional long-term GDP reduction relative to an orderly transition.
Failed Transition
In the Failed Transition there are no assumed transition costs (investments) relative to the baseline. However, physical impacts, both gradual and extreme weather, impact GDP. Whilst the effects are modest to begin with (approximately 0.1% p.a.) they grow rapidly and reach over 2.5% p.a. by 2100. This overwhelms the ability of GDP to grow.
Appendix D. Impact on UK and Regional Equity Portfolios
UK
There is a similar overall pattern of returns for UK equities as global equities, as shown in Figures 3 and 17. In the long run, the UK impacts of the Paris pathways are similar to global (down 15% and 25% for orderly and disorderly respectively over the period 2020–2060 compared to baseline). The long-term impact of the Failed Transition Pathway is much worse than the Paris pathways, but is relatively lower for the UK, being a 40% drop compared to baseline by 2060 rather than 50% for global equities. This is due to global markets, especially Asian ones, being more sensitive to physical risks.
Climate-adjusted UK equity returns (ratio of cumulative medians to the cumulative median of climate-uninformed baseline pathway).
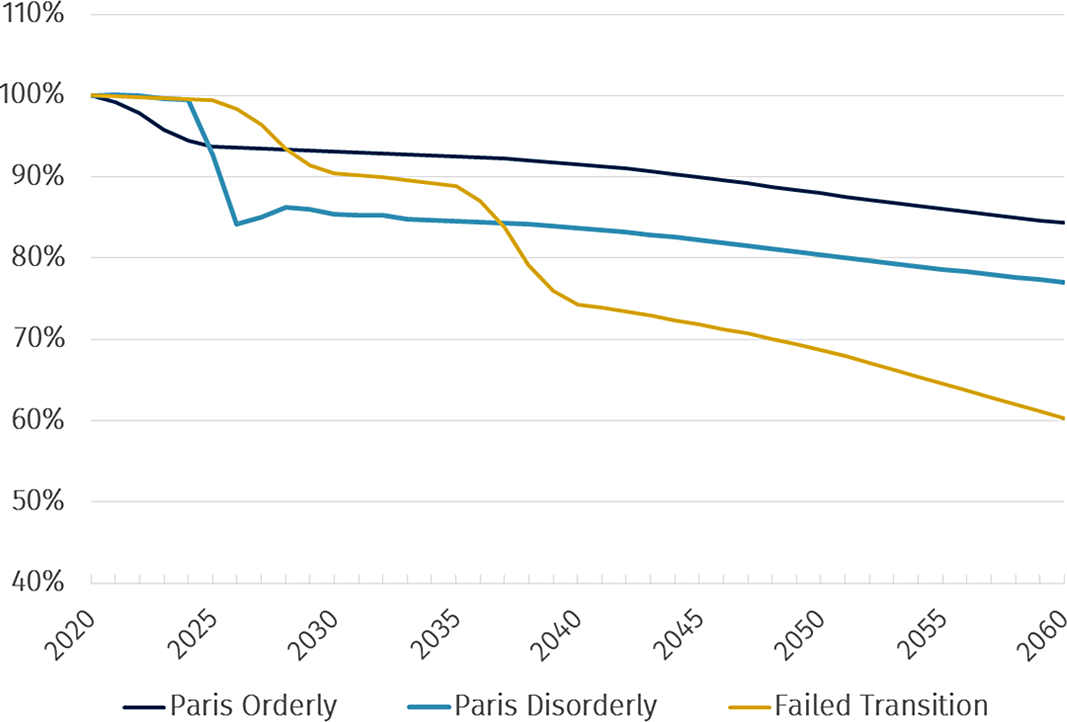
The overall patterns of the climate risk factor contributions in UK equities are very similar to global equities, albeit with less severe maximal impacts and less severe long run impacts under the Failed Transition, as shown in Figures 8 and 18. Notably, in the long run under a Failed Transition, UK equities are slightly more vulnerable to the impact of extreme weather events as a proportion of total losses, although the difference in median total annual loss in 2060 (2%) is similar.
Climate risk factor contribution analysis for UK equity under all climate pathways (annual difference of medians to median climate-uninformed baseline pathway).
NB: Figure 18 has different scales, with the Paris Disorderly and Failed transition exhibiting larger impacts.

Comparison to Other Regions
Similar patterns are found for other regional equity markets, with the drivers, magnitude and net direction dependent on:
-
Proportion of market within climate sensitive sectors
-
Current degree of investment in low-carbon transition
-
Vulnerability to gradual physical risks and extreme weather events. In general, countries closer to the equator are more sensitive to physical risks.
Appendix E. Impact on Fixed Income
UK
Gilts: Overall Climate Impacts
For gilts, the differences in cumulative returns are modestly positive, reflecting the drop in yields, as shown in Figure 19.
Climate-adjusted UK 20-year fixed interest gilt yield levels (difference of medians to median baseline level).

For fixed interest gilts, the differences in cumulative returns are very modest to 2040 in all pathways reflecting the very modest impact on UK GDP as shown in Figure 20. The yields decline more significantly, after 2040 due to the greater climate impacts, which feed through to GDP and then gilt yields.
Climate-adjusted UK 20-year index-linked gilt return (ratio of cumulative medians to the cumulative median of climate-uninformed baseline pathway).

For index-linked gilts, expected returns in the climate-informed pathways are lower in the long run, especially for the Failed Transition Pathway. This is due to lower expected inflation and lower real yields, as shown in Figure 21.
Climate-adjusted UK 20-year index-linked gilt yield (difference of medians to median baseline).

The overall impact is relatively modest for the Paris pathways (0.3% p.a. decline in real yields to 2060) but more significant in the Failed Transition Pathway (0.6% p.a. decline in yields to 2060, plus returns impact compounded with inflation also being lower).
Investment Grade Bonds: Overall Climate Impacts
For UK corporate bonds, there are tensions in opposite directions, with the drop in gilt yields being offset by an expected increase in credit spreads (due to lower creditworthiness of companies), as shown in Figure 22.
Climate-adjusted UK investment grade bond yield levels (difference of medians to median baseline level).

For the Paris Orderly Transition, this leads to a very modest increase in yields in the first five years as the costs of transition and physical risks are priced-in. In the longer term, the median decline is 0.4% p.a. by 2060, reflecting a 0.1% p.a. higher credit spread than the non-climate-adjusted baseline.
In the Paris Disorderly Transition, there is no initial impact but a very significant spike in yields (more than 1% p.a.) as the transition and sentiment shocks are rapidly priced-in in 2025. After some volatility, this pathway settles to the same yield difference as the Paris Orderly Transition.
In the Failed Transition, the two pricing-in shocks create spikes in yields due to the larger credit spreads. In the longer term, yields fall by 0.6% p.a., reflecting a 0.4% p.a. higher credit spread than the baseline. This larger impact on credit spreads means the long-term yields are closer to the Paris pathways than for gilt yields.
High Yield Bonds: Overall Climate Impacts
The impacts on high yield bonds are an extension of the relative impacts on investment grade bonds due to their higher credit spread sensitivity, as shown in Figure 23.
Climate-adjusted UK high yield bond yield levels (difference of medians to median baseline level).

Paris Orderly median spreads rise 0.5% p.a. in the early years and then drop to 0.2% p.a. below baseline by 2060, reflecting approximately 0.3% p.a. higher credit spreads over gilts than in the baseline.
Paris Disorderly has the same long-term path as Paris Orderly, but yields spike by over 2.5% p.a. during the disorderly shock.
High yield spreads in the Failed Transition Pathway are also more sensitive to the physical risk pricing-in shocks than investment grade spreads. In the long run, higher credit spreads offset almost all the decline in gilt yields, i.e. they are approximately 1% higher than in the baseline. The net impact is that median yields on high yield bonds drop less than in the Paris Transition pathways.
Fixed Interest Gilts: Analysis of Climate Risk Drivers
For UK gilts, the climate risk factor contribution analysis shows a similar pattern to that of UK GDP, due to the way the underlying drivers of the UK GDP impacts feed through to the UK gilt market, with declining GDP and inflation leading to declining yields, as shown in Figure 24.
Climate risk factor contribution analysis for median UK 20-year fixed interest gilt yields under all climate pathwaysFootnote 3 .

Investment Grade Bonds: Analysis of Climate Risk Drivers
For investment grade corporate bonds under the Paris Transition pathways, in the shorter-term the repricing impact for the gradual physical risks and more extreme weather, along with the sentiment shock for the disorderly transition, increase spreads slightly reflecting negative credit impacts, as shown in Figure 25. These dominate the physical risk impacts. Longer term, the physical impacts remain but have a very modest impact on the spreads.
Climate risk factor contribution analysis for median UK investment grade bond spreads under all climate pathways.

In the Failed Transition, there is very little initial impact followed by physical risk pricing-in shocks in the late 2020s and 2030s. Physical impacts rise over the longer term, leading to spread levels increasing to over 30 basis points above baseline spread levels by the mid-2050s.
High Yield Bonds: Analysis of Climate Risk Drivers
The contribution and timing of impacts for UK high yield bonds is similar to UK investment grade corporates, although much higher due to their greater credit spread sensitivity, as shown in Figure 26.
Climate risk factor contribution analysis for median UK high yield spreads under all climate pathways.
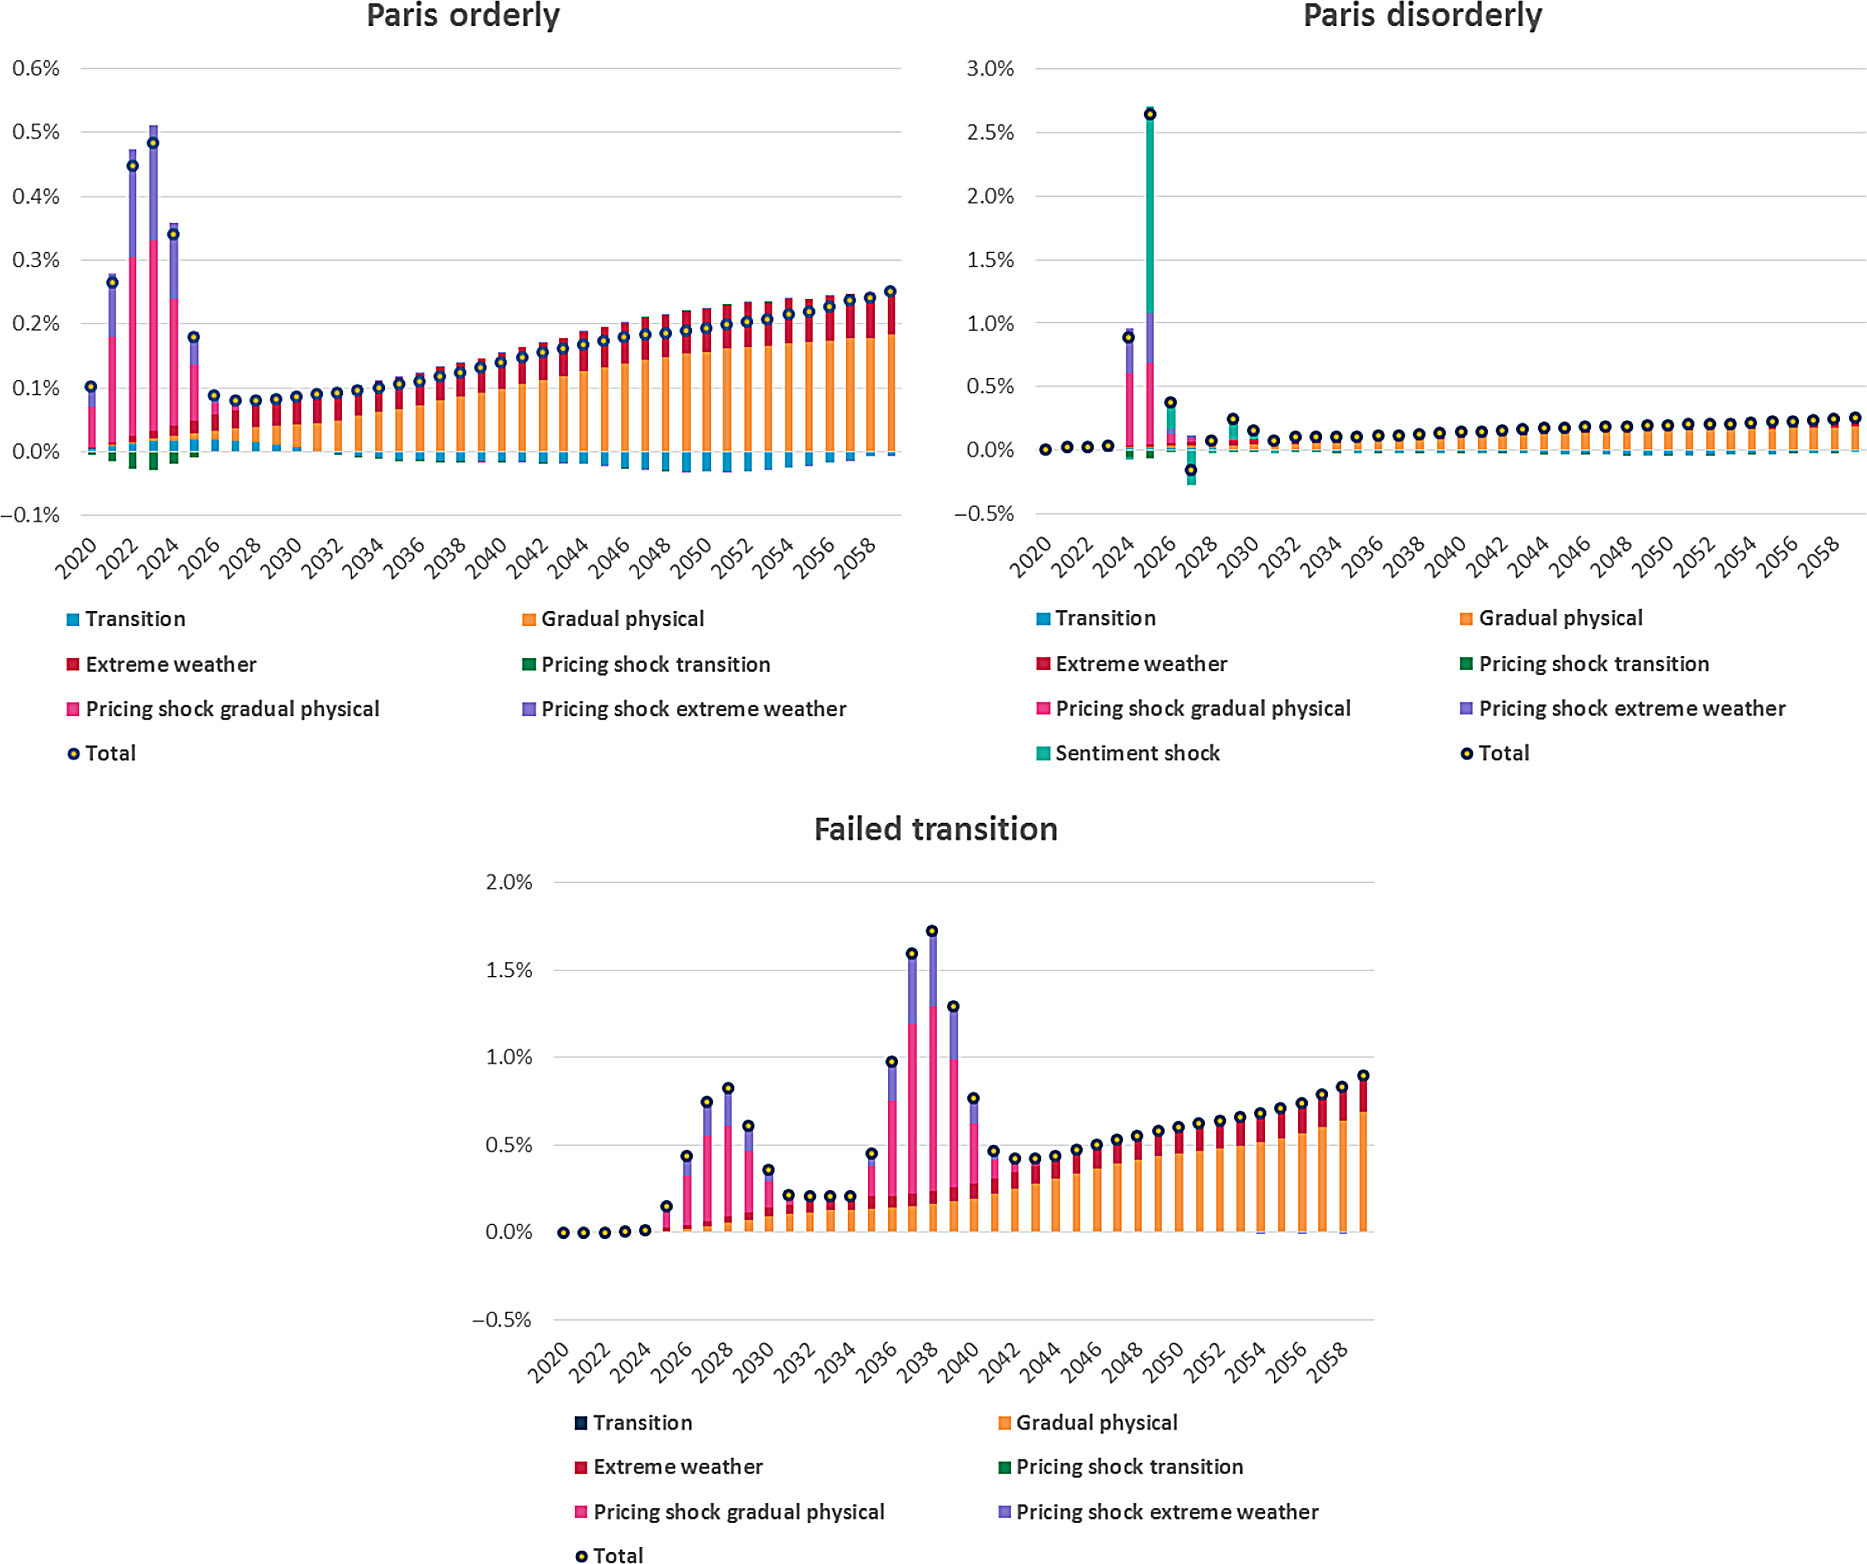
CPI: Analysis of Climate Risk Drivers
In general, the CPI impacts are fairly modest and reflect the interlinkages with GDP, as shown in Figure 27. In the Paris Transition pathways, the net impacts of transition spending, taxes and fossil fuel disinvestment broadly offset one another. There is a sentiment impact within the Paris Disorderly pathway, although CPI settles to the same long-term trend as the Paris Orderly pathway.
Climate risk factor contribution analysis for median UK CPI under all climate pathways.
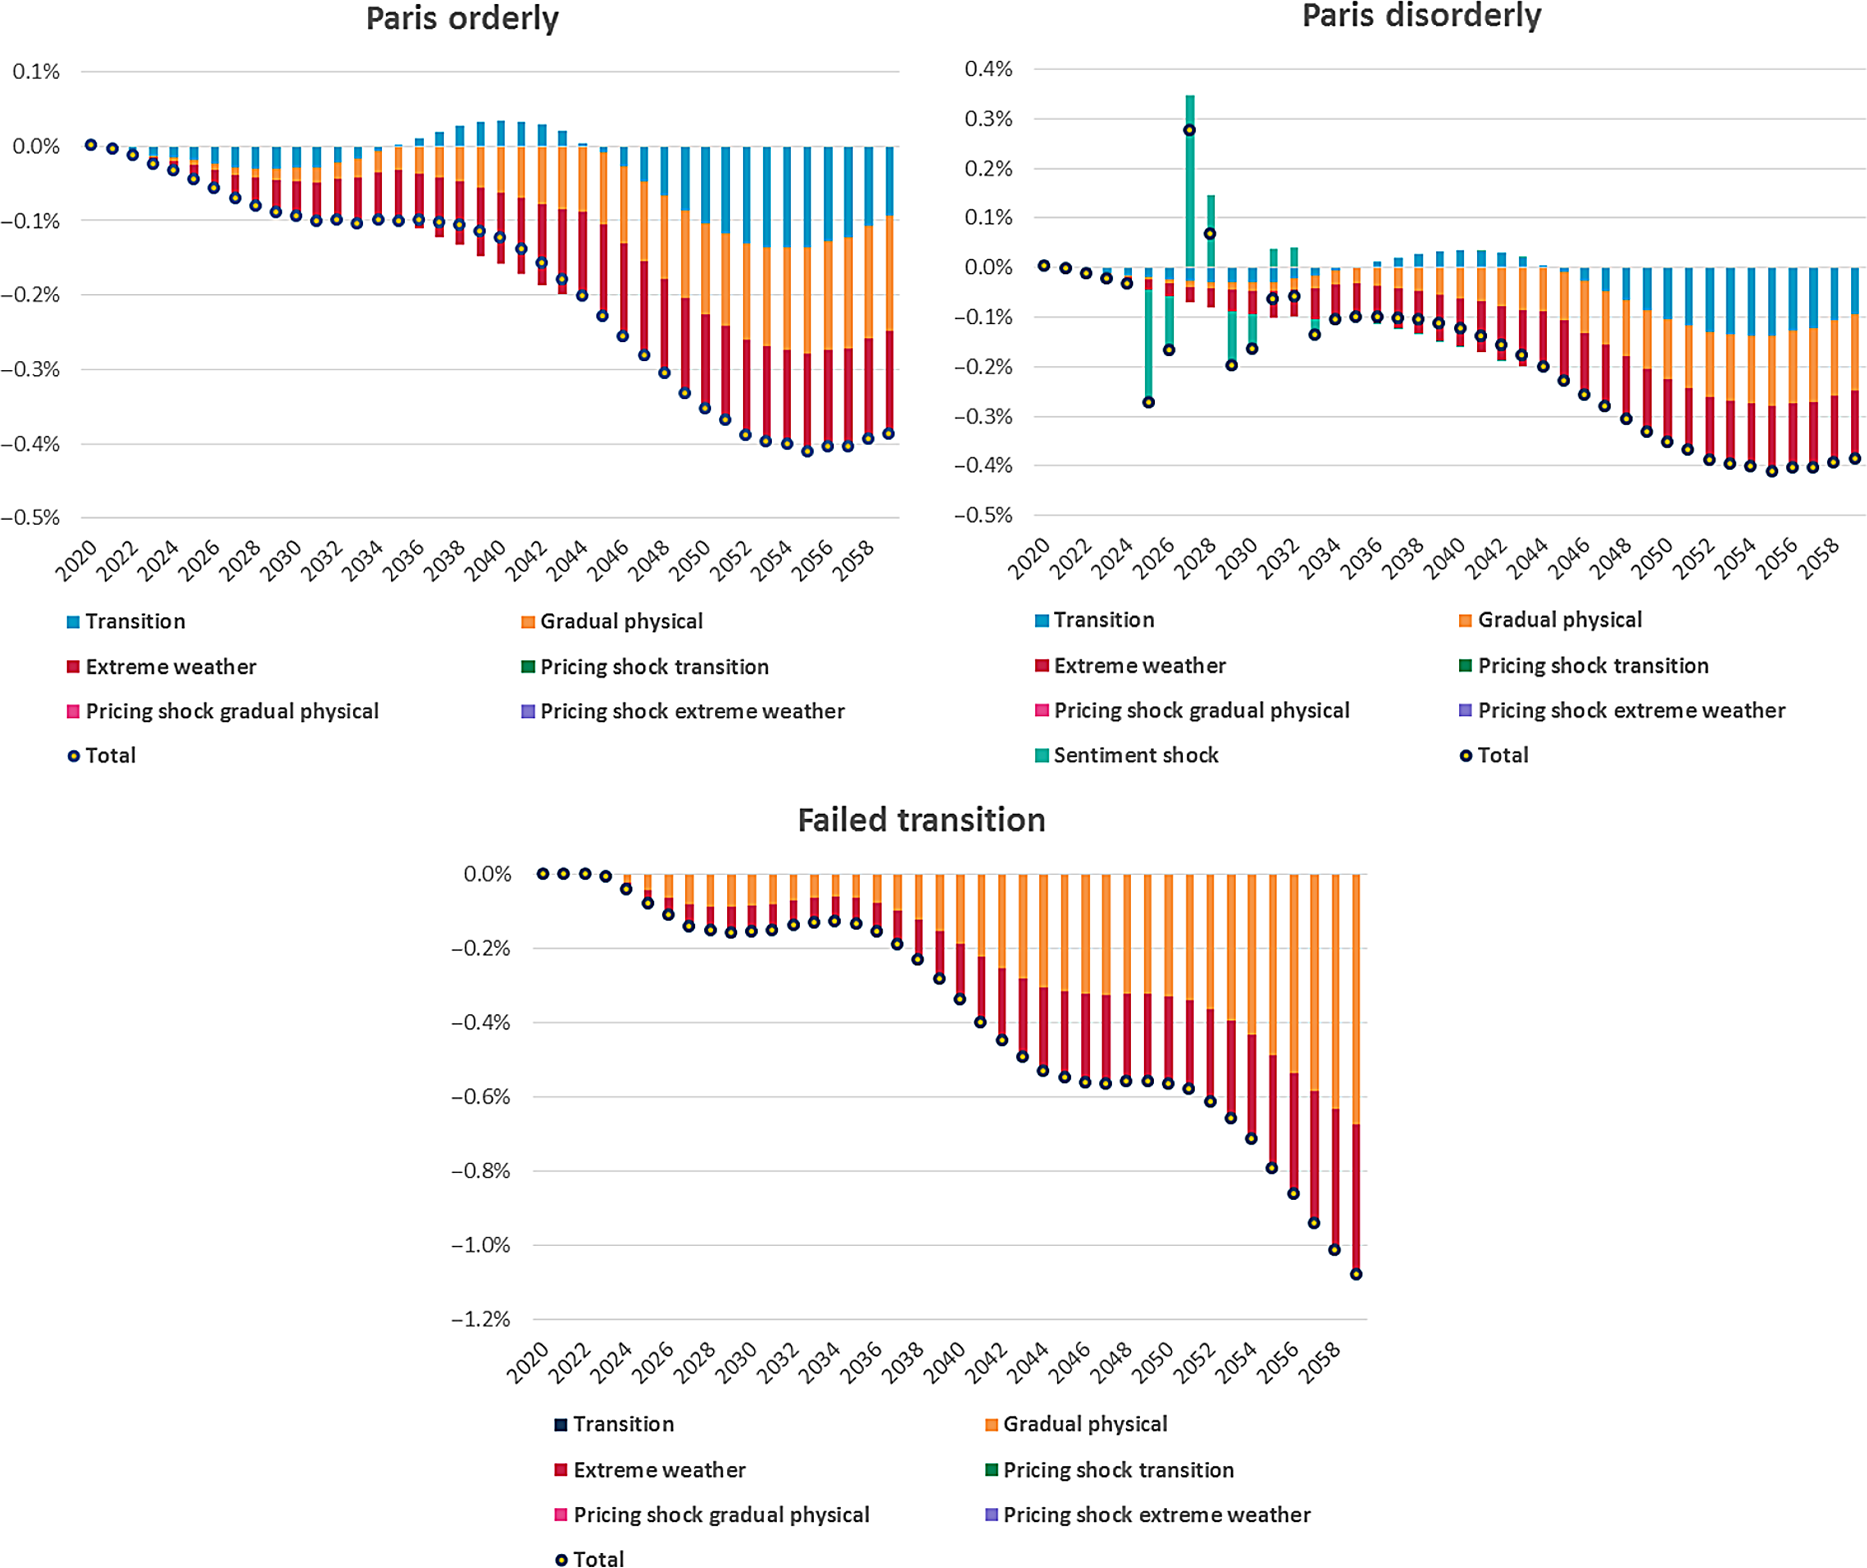
In the Failed Transition Pathway, there are no pricing-in shocks but longer-term physical and extreme weather impacts lead to long-term GDP decline, which is linked to lower inflation.
As noted elsewhere in the paper, other factors that have not been modelled may increase rates of inflation, particularly within the Failed Transition Pathway, although higher costs of production would have broader impacts, such as further reductions in GDP, which would also need to be taken into account.
Comparison to Other Regions
Similar patterns are found for other regional bond markets, with the drivers, magnitude and net direction dependent on:
-
Vulnerability of GDP (and thus sovereign interest rates and spread levels) to physical or transition impacts
-
Typical maturity of corporate bonds, which influences the sensitivity of regional corporate spreads to risk driver changes.
Appendix F. Impact on Direct Real Estate
UK
Whilst the pattern and quantum of outcomes of this graph look very similar to UK equities, real estate is typically a less volatile and lower returning asset class than equities, as shown in Figure 28. Thus, this represents a relatively larger shock and impact for the asset class. This reflects the greater vulnerability of real estate to physical risks than other asset classes, which is especially visible in the Failed Transition Pathway.
UK direct real estate returns (assumed 50% retail and 50% office): Percentage difference of medians to median to climate-uninformed baseline.

The Paris Transition pathways have very similar patterns to UK equities, albeit slightly higher longer-term physical impacts, which again are particularly notable relative to smaller expected returns, as shown in Figure 29.
Climate risk factor contribution analysis for median UK direct real estate returns.

In the Failed Transition, the shock impacts are smaller than the sentiment shock in the Disorderly Transition, but the physical impacts are larger, particularly due to the impact of severe weather events. Towards the end of the period, severe weather impacts account for approaching 50% of the total physical climate impact.
Comparison to Other Regions
Similar patterns are found for other regional real estate markets, with the drivers, magnitude and net direction dependent on vulnerability to physical impacts, especially severe weather events.
Appendix G. Climate Impacts on Asset Returns
In Tables 2, 3 and 4, we present the return impacts for each asset class we illustrated in our companion paper’s UK pension scheme case study, and for the example scheme’s total assets, across all climate-informed pathways. These provide some cross comparisons and tabulation of the returns illustrated in our earlier graphs. They are included for those actuaries who wish to see more detailed figures, for example so they can perform broad-brush calculations themselves to get a feel for the potential impact of climate change on financial institutionsFootnote 4.
Median asset class returns under baseline pathway over each time period

Aggregate climate impacts on median asset class returns under Paris Orderly Transition Pathway over each time period

Aggregate climate impacts on median asset class returns under Paris Orderly Transition Pathway over each time period

Aggregate climate impacts on median asset class returns under Failed Transition Pathway over each time period

Diving deeper into each pathway, we note that equity returns are the most sensitive to climate change across all pathways. Real estate investments suffer to a similar extent. When it comes to UK gilts and credit, we see much smaller impacts across all pathways, although other countries such as Canada and the US face more severe climate risks. Nonetheless, all asset classes are affected due to their global and systemic nature.
In the Paris Orderly Transition Pathway, we observe that the impacts stem entirely from equities and real assets in the short-term. The limited remaining impacts stem from already locked-in physical impacts generated by past emissions.
We note that the same asset classes are hurt more severely in the Paris Orderly Transition Pathway than in the Paris Orderly Transition Pathway, due to stronger pricing-in effects, the sentiment shock and increased volatility. The remainder of the horizon is similar in both pathways, with locked-in physical impacts generating minor losses.
Ultimately, under the Failed Transition Pathway, limited impacts are shown in the short-term since no transition occurs. However, severe losses ensue in the medium-run due to pricing-in impacts and in the long run (beyond 2040) because of increased physical risks.


 Open access