

Introduction
In recent decades vulture populations across Africa have shown rapid declines, variously attributed to deliberate and accidental poisoning (Komen Reference Komen2009, Ogada and Keesing Reference Ogada and Keesing2010, Otieno et al. Reference Otieno, Lalah, Virani, Jondiko and Schramm2010, Ogada and Buij Reference Ogada and Buij2011), changes in land use resulting in a decline in food supply (Thiollay Reference Thiollay2006a, Virani et al. Reference Virani, Kendall, Njoroge and Thomsett2011), and trapping for human consumption or traditional medicines (Mundy et al. Reference Mundy, Butchart, Ledger and Piper1992, Beilis and Esterhuizen Reference Beilis and Esterhuizen2005, Thiollay Reference Thiollay2006a, Anon Reference Anon2008, Saidu and Buij Reference Saidu and Buij2013). In addition, depletion of wild herbivore populations and improved husbandry of domestic stock have together reduced the availability of carrion in some parts of Africa, further impacting on vulture populations (Thiollay Reference Thiollay2006a,Reference Thiollayb, Western et al. Reference Western, Russell and Cuthill2009). Use of the non-steroidal anti-inflammatory drug diclofenac, as a veterinary treatment, also poses a potential threat to African vultures, having devastated vulture populations on the Indian subcontinent (Green et al. Reference Green, Newton, Shultz, Cunningham, Gilbert, Pain and Prakash2004, Oaks et al. Reference Oaks, Gilbert, Virani, Watson, Meteyer, Rideout, Shivaprasad, Ahmed, Chaudhry, Arshad, Mahmood, Ali and Khan2004, Anderson et al. Reference Anderson, Piper and Swan2005), although there is no evidence thus far that it has contributed towards the declines seen in Africa. Nonetheless, despite a long history of human interest in vultures, and a widespread recognition of their ecological importance (Ogada et al. Reference Ogada, Torchin, Kinnaird and Ezenwa2012, Choisy Reference Choisy2013, Haas and Mundy Reference Haas and Mundy2013, Moleón et al. Reference Moleón, Sánchez-Zapata, Margalida, Carrete, Owen-Smith and Donázar2014), six out of seven species occurring largely or wholly within Africa are now listed by IUCN as globally threatened (BirdLife International 2013).
As their threat status has changed it has become increasingly necessary to establish baseline indices of abundance, and to monitor subsequent trends. Yet in most African countries, including Uganda, historical changes in vulture populations have been poorly documented. Of eight species recorded in Uganda, two, the Bearded Vulture or Lammergeier Gypaetus barbatus and Egyptian Vulture Neophron percnopterus, bred formerly but are now only vagrants (Carswell et al. Reference Carswell, Pomeroy, Reynolds and Tushabe2005). Populations of White-backed Gyps africanus, Rüppell’s G. rueppellii, Lappet-faced Torgos tracheliotos and White-headed Vulture Trigonoceps occipitalis were all formerly more widely distributed, but are likely to have fluctuated markedly over the past 50–60 years (Carswell et al. Reference Carswell, Pomeroy, Reynolds and Tushabe2005), reflecting the impact of tsetse control measures in the 1960s and exceptionally high levels of poaching pressure on wild herbivore populations in the 1970s. The two remaining species, Hooded Necrosyrtes monachus and Palm-nut Vulture Gypohierax angolensis, are widespread, although the former is concentrated in urban areas. Current threats to vulture species in Uganda, as elsewhere, include land use change and incidental poisoning from illegal baits placed for lions Panthera leo and other large predators, in and around National Parks (Omoya and Plumptre Reference Omoya and Plumptre2011, Uganda Wildlife Authority unpubl. reports).
Despite being large and conspicuous, vultures pose particular survey problems. First, the seven species occurring predominantly in Africa are widely distributed, being native to, and extant within, between six and 39 range states (BirdLife International 2013). Consequently, determining range-wide estimates of population size and rates of change requires that basic, comparable methods are used within multiple range states, some of which lack the resources to undertake large-scale or technically complex surveys. Second, being often thinly distributed but highly clumped, and capable of foraging over large areas, vultures have been counted using a diverse range of methods, with varying degrees of success. They include counts of occupied nests, both at cliff colonies and in wooded savanna (e.g. Borello and Borello Reference Borello and Borello2002, Virani et al. Reference Virani, Kirui, Monadjem, Thomsett and Githiru2010, Reference Virani, Monadjem, Thomsett and Kendall2012). Murn et al. (Reference Murn, Combrink, Ronaldson, Thompson and Botha2013), for example, list 15 studies in which tree nests have been counted, an approach that appears straightforward, but requires that all occupied nests are detected, often over an extensive area, and may be complicated by the species’ intermittent or protracted breeding cycles (Mundy et al. Reference Mundy, Butchart, Ledger and Piper1992). A quite different method, involving simultaneous counts at provisioned carcasses in a set of National Parks, has been applied in Uganda (Pomeroy et al. Reference Pomeroy, Dranzoa, Anyii, Friday, Kaphu, Sande and Seifert2004, Reference Pomeroy, Byaruhanga, Kaphu, Opige, Masiko and Lutuk2011, Reference Pomeroy, Kaphu, Nalwanga, Ssemmanda, Loyuk, Opeto and Matsiko2012), where few recent breeding records exist for most vulture species. However, while this approach yields minimum counts, these are likely to be confounded by extraneous factors, including local game movements and the varying proximity of alternative, natural carcasses. Similarly, surveys at supplementary feeding sites have been used to estimate vulture abundance, although the accuracy of this approach is considered questionable, being potentially subject to a number of biases (Margalida et al. Reference Margalida, Oro, Cortés-Avizanda, Heredia and Donázar2011).
African vulture populations have also been surveyed extensively through road counts from slow-moving vehicles, initially by Brown (Reference Brown1972) in East Africa and Thiollay (1977, 1978, 2006a,b,c) in West Africa. This method has been used to determine the effects of land use on encounter rates, as well as to monitor population change; notably, the steep declines evident in West African populations over a period of 30–35 years (Thiollay Reference Thiollay2006a,Reference Thiollayb,Reference Thiollayc) and in the Masai Mara ecosystem during the 1980s–2000s (Virani et al. Reference Virani, Kendall, Njoroge and Thomsett2011). A major limitation of the method, however, is that it has typically been used to provide linear indices (birds 100 km-1), which are difficult to compare with the density estimates (pairs or birds 100 km-2) obtained through nest counts. This limitation has persisted to date, despite the availability of robust, transect-based methods for estimating population densities, applied successfully to other avian taxa, using Distance sampling (Buckland et al. Reference Buckland, Anderson, Burnham and Laake1993).
Based on annual road counts of raptors in Uganda, made over a six-year period, we sought to establish an index of abundance for six vulture species (Palm-nut, Hooded, White-backed, Rüppell's, Lappet-faced and White-headed Vulture), focusing mainly on the country’s four large savanna National Parks. In addition to recording encounter rates we noted the distance of each bird to the transect line, and used Distance sampling to estimate population densities. Here, we present encounter rates for the six species, in relation to land use and PA status, and contrast these with rates reported from elsewhere in East and West Africa. We also assess the potential use of Distance sampling as a means of generating vulture density estimates from road surveys, these being more readily comparable with measures obtained through other survey methods, and applicable in any season.
Methods
During 2008–2013 we recorded the number of vultures seen whilst driving a series of transects along 1,813 km of roads and tracks, of which 866 km (48%) lay within protected areas. Transects were of 9–122 km in length, and in most cases were surveyed repeatedly over the six-year period, in January (84% of transects) to March. Much of the country receives high levels of sunshine during these months, providing conditions favourable for soaring. Since seven out of 15 egg-laying dates for scavenging species have occurred in November–February (Carswell et al. Reference Carswell, Pomeroy, Reynolds and Tushabe2005), our survey coincided with a seasonal increase in breeding activity. Due to logistical constraints the total distance surveyed varied substantially between years, being higher during 2010–2013 than previously (Table 1; Appendix S1 in the online supplementary material). All surveys were made by experienced observers and, with the exception of one survey of Kidepo Valley National Park, included one or more of the authors. Observer teams normally comprised a recorder and 2–4 observers, with one always on each side of the vehicle. In National Parks, and on some lesser roads outside the parks, two observers watched from outside the vehicle cab, seated on the roof or standing behind the cab, in an open pick-up, where they were able to obtain complete views in all directions, as well as overhead. Most transects were surveyed between 09h00 and 17h00, when birds were more likely to be in the air, and hence more visible. While most transects were surveyed only once each year, some were surveyed twice (out and back), in which case we used the mean count for each species, since in a small number of cases the recorded distance surveyed in each direction differed slightly. Although we usually stopped when vultures were seen, some birds were identified on the move, and distant birds were sometimes recorded as ‘vulture sp.’. During these brief stops we identified those birds already seen. Rarely, additional vultures were seen as a result of stopping, and were included in the count. The time spent stationary was also included as part of the survey duration. The perpendicular distance of each bird from the road or track (when first seen) was estimated and assigned to one of four distance bands, of 0–100, 100–200, 200–500 and > 500 m.
The length of transects surveyed in each land use category and year. Survey effort is expressed as the transect length within each land use type, as a percentage of the total distance surveyed. The area of each land use category is expressed as a percentage of the surface area of Uganda.

1 All Natural land lay within Protected Areas.
The survey made use of networks of tracks in Lake Mburo, Queen Elizabeth, Kidepo Valley and Murchison Falls National Parks, and in Bugungu Wildlife Reserve, a buffer area for Murchison Falls NP. Together, these two PAs are referred to as Murchison Falls Conservation Area. Counts were also made on public roads from Entebbe to Mbarara, Entebbe to Murchison Falls CA, and from Soroti to southern Karamoja, in north-east Uganda. Each transect was assigned to one of four land use categories: natural (within PAs); pastoral (vegetation almost entirely natural, but with wild herbivores replaced largely by domestic stock); agricultural; and built. Most pastoral transects included small areas of agricultural land and vice-versa, and both contained human settlements, mainly small trading centres. We also recorded transect length (km, by odometer); start and end time and hence mean vehicle speed; mean altitude (from topographical maps); mean annual rainfall (from Government of Uganda 1967); human population density (UBOS 2012) and woodland cover (open grassland, lightly wooded, heavily wooded, forest). A small proportion of transects within PAs were predominantly woodland, dominated by Acacia and Combretum spp. ‘Woodland’ was defined as > 20% tree canopy cover, after Pratt and Gwynne (Reference Pratt and Gwynne1977).
Data analysis
Encounter rates:
We used generalised linear mixed models (GLMMs) to investigate the relationship between the number of vultures detected from each transect, and the following potential explanatory variables: transect length, land use category, woodland cover, altitude, annual rainfall and the presence of ‘outside’ observers. For consistency between land use types, and to standardise methods for any future surveys, we excluded sightings of birds more than 500 m from the transect line. Since our data included repeated surveys of the same transects in different years we entered ‘transect’ and ‘year’ as random terms in all models. We derived minimal models through elimination of the least significant fixed variables, and selected final models from those with the lowest Akaike Information Criterion (AIC) score.
In each model the response variable was either the presence or the number of individuals of a given species or species group: of Gyps vultures (White-backed and Rüppell’s Vulture) or scavenging vultures (Hooded, White-backed, Rüppell’s, Lappet-faced and White-headed Vulture). Since most transects yielded zero or few vulture sightings the distribution of each response variable was highly skewed. We therefore examined habitat associations using two model structures. First, using data from all transects, we identified explanatory variables associated with the presence/absence of a given species or group, specifying a binomial error distribution. In the second model we restricted the dataset to cases where at least one individual of the target species or group had been detected, and specified a Poisson error distribution. GLMMs were fitted using the glmer function in the lme4 package in R (3.0.1; R Development Core Team 2009). The R plot, qqnorm and hist functions were used to determine whether final models reasonably met with model assumptions (Crawley Reference Crawley2013). To determine encounter rates in relation to land use we used data from all transects within land use categories in which the target species had been recorded at least once, and specified a Poisson error distribution. Fitted values were derived from final models using the R fitted function, and used to estimate the mean (± SE) individuals encountered 100 km-2 in each land use category. All probabilities are quoted as two-tailed.
Density and population estimates:
Densities were estimated using Distance V6.0, Release 2 (Thomas et al. Reference Thomas, Buckland, Rexstad, Laake, Strindberg, Hedley, Bishop, Marques and Burnham2010). Where excessive heaping of detection distances occurred, wider intervals were selected to offset this. All detection data were right-truncated to 500 m, since the distances of birds sighted beyond this band were not recorded. Four model types were fitted (half-normal, hazard-rate, uniform and negative-exponential), each with cosine, simple polynomial and hermite polynomial adjustments. The negative-exponential model, regarded as a model of last resort, was only considered if goodness of fit (tested by chi-square) suggested that no other model provided a satisfactory fit (Buckland et al. Reference Buckland, Anderson, Burnham and Laake1993). Selection of the most appropriate detection function was based on minimum AIC. To estimate densities of a target species within different strata we first determined whether the detection function varied significantly across the strata, using a chi-square test. Where no significant differences were found we used Multiple Covariates Distance Sampling (MCDS; Thomas et al. Reference Thomas, Buckland, Rexstad, Laake, Strindberg, Hedley, Bishop, Marques and Burnham2010), stratifying accordingly (e.g. by land use). We also used this approach where the total number of detections for a given species was low; that is, we pooled sightings of two or more species (e.g. Gyps species) and then stratified by species in MCDS.
To estimate a species’ population size within each land use category we multiplied the estimated density for a given category by its estimated area within Uganda. Land use areas were derived from those of 13 land cover types given in UBOS (2012), up to 2005. We assigned these land cover types to the four broad land use categories used here, as follows: commercial farmland and cultivated land identified by UBOS (2012) was assigned to ‘agricultural’; bushland, grassland and all woodland areas thought to be grazed by domestic herds (including those grazed illegally within PAs) to ‘pastoral’; open, non-forested habitat within PAs to ‘natural’; and built up land to ‘built’. However, because the level of survey effort applied within ‘built’ land was insufficient to yield meaningful estimates of encounter rates or densities, this category was excluded from the analyses. In some cases area estimates for PAs were adjusted to take account of the proportion of land thought to be grazed by domestic livestock in each PA. Overall, our national area estimates were as follows: agricultural, 99,703 km2; pastoral, 83,002 km2; natural, 9,573 km2; and built, 366 km2. The total area within these four land use categories (192,644 km2) comprised 80% of the surface area of Uganda (241,550 km2; UBOS 2012). The remaining 20% of land consisted of habitats within which vultures were likely to have been sparse or absent: water bodies, wetlands, tropical forest and plantations.
Results
Encounter rates
During 2008–2013 we made 784 vulture detections over a combined distance of 8,232 km (Table 1). Six species were seen in sufficient numbers to determine encounter rates and densities; a seventh, Egyptian Vulture, was seen only once. The number of vultures counted varied markedly in relation to land use, most species being recorded mainly, or only, in protected areas (Figure 1). Using GLMMs we investigated the effects of this and other potential explanatory variables on the number of vultures encountered on each transect. Although vehicle speed differed significantly between transects on public roads (mean: 33.1 km hr-1) and in protected areas (24.0 km hr-1; Mann-Whitney U 8,15 = 23.50; P = 0.006), the importance of recording time of day at the start and end of each transect was not fully appreciated by the field teams. Hence, these variables were recorded too infrequently to be included in the models.
Species encounter rates (mean ±1SE individuals encountered 100 km-1) in relation to land use category, calculated from GLMM fitted values.

Binomial GLMMs showed that Rüppell’s and White-headed Vultures were significantly more likely, and Hooded Vultures less likely, to be detected from transects within PAs than elsewhere (Table 2). Collectively, the five scavenging species were also more likely to be detected from transects within PAs and in pastoral land, than in agricultural land. Within these land use categories White-backed, Rüppell’s and White-headed Vultures were less likely, and Lappet-faced Vultures more likely, to be detected in heavily wooded areas than in grassland or lightly wooded habitats, perhaps reflecting differences in their detectability, rather than their abundance. GLMMs fitted with a Poisson error distribution showed that on transects where Hooded or White-headed Vulture were detected, the number of individuals counted was significantly lower within PAs than elsewhere. In contrast, the number of Palm-nut Vultures counted was higher along transects within PAs than on transects in agricultural land.
Summary of generalised linear mixed models examining associations between potential explanatory variables and: the likelihood of detecting at least one individual from a transect (Binomial models); the number of individuals detected (Poisson models; restricted to transects from which at least one individual was detected). H. wooded = Heavily wooded; L. wooded = Lightly wooded.

1 Number of cases. One case = one transect surveyed in one year.
2 Pooled sightings of Hooded, White-backed, Rüppell’s, Lappet-faced and White-headed Vulture.
The likelihood of detecting Gyps species, and the number of individuals of Gyps and of scavenging vulture species detected, was significantly higher where ‘outside’ observers were deployed (Table 2). Note, however, that outside observers were deployed more often within PAs (82% of transect-surveys) than elsewhere (13% of transect-surveys), potentially confounding the relationship between protected area status and vulture abundance. To investigate this effect we used a GLMM model to determine whether the presence of outside observers increased the likelihood of detecting members of the five scavenging species, which search mainly while soaring. First, we specified a binomial error distribution to examine the likelihood of encountering at least one individual of the five species, on transects surveyed within protected areas, and in the presence/absence of outside observers. We then restricted the dataset to transects on which at least one individual vulture was detected, and used a Poisson error distribution to determine whether the number of individuals detected was linked to the presence/absence of outside observers. These models showed, respectively, that the presence of outside observers did not influence the likelihood of detecting at least one scavenging vulture individual, but had a significant positive effect on the number of birds detected (Effect = 0.97 ± 0.196; z = 4.964; P < 0.001). Fitted values from the Poisson model indicate that the mean encounter rate was 55% higher when outside observers were deployed (29.4 ± 5.64 SE birds 100 km-1), than when they were absent (18.9 ±5.98 SE birds 100 km-1).
Using GLMM fitted values, mean encounter rates within the four savanna PAs surveyed varied substantially between species, the encounter rate for White-backed Vulture being some eight times that of Rüppell’s, and 10–25 times that of each of the three remaining scavenging species. In all cases, mean encounter rates recorded for scavenging vultures were lower than those reported from recent road surveys in Kenya and West Africa (Table 3).
Mean (± SE) vulture numbers detected 100 km-1 during road surveys within protected areas in Uganda, Kenya and West Africa. Estimates for Uganda were calculated from GLMM fitted values.

1 This study.
2 Road surveys in the Masai Mara, Kenya, January–May 2004–2005: from Virani et al. (Reference Virani, Kendall, Njoroge and Thomsett2011).
3 Road surveys in Burkina Faso, Mali and Niger (Thiollay Reference Thiollay2006a).
4 Two birds seen; excluded from analysis.
5 Excludes a single high count. If included, mean ± SE = 20.5 ± 9.99.
6 Hooded, White-backed, Rüppell’s, Lappet-faced and White-headed Vulture.
Density and population estimates
With a density of c.17 birds 100 km-2, White-backed Vultures were the most abundant species on natural land, followed by Palm-nut Vulture, at c.7 birds 100 km-2 (Table 4). White-backed Vultures were thus 5–7 times more abundant in this land use type than any other scavenging vulture, including its congener, Rüppell’s Vulture (2.4 birds 100 km-2). Note, however, that the detection pattern for these two Gyps species differed; 42% of White-backed Vultures were detected in the furthest distance band from the transect (200–500 m), compared with only 9% of Rüppell’s Vultures (χ2 2 = 30.00; P < 0.001). This suggests that White-backed Vultures were either more sensitive to disturbance or more easily detected at that distance. Alternatively, there may have been a tendency for observers to identify the more distant individuals as the commoner of the two Gyps species. Accordingly, combined densities for Gyps species are also given (Table 4).
Vulture density estimates (birds 100 km-2) derived through Distance sampling, in relation to land use.
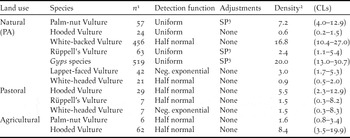
1 Number of detections.
2 Birds 100 km-2.
3 SP: Simple polynomial.
Hooded and White-headed Vultures were the least abundant species in protected areas, at a density of < 1 bird 100 km-2). White-headed, along with Rüppell’s Vulture, were also recorded on pastoral land at densities similar to those estimated for protected areas. Estimates within pastoral land, however, were based on just seven sightings of each species and hence produced wide confidence limits, varying by a factor of c.27 (upper/lower CL). In contrast, Hooded Vultures appeared to be nine and 14 times more abundant on pastoral and agricultural land, respectively, than in PAs.
Based on overall densities within natural land, the four PAs appeared to support a combined total of c.1,000–3,000 individuals of the five scavenging species, and a further 300–1,000 Palm-nut Vultures. Area estimates for open, natural land within Uganda’s remaining PAs suggest that its protected area network is likely to hold c.1,300–3,900 scavenging vultures, and c.400–1,200 Palm-nut Vultures (Table 5). Since White-backed and Lappet-faced Vultures were recorded only in PAs, our estimates for these species (c.1,000–2,600 and 160–500 birds, respectively) represent national population estimates. We were unable to determine national population sizes for the four remaining species, each of which occurred within 2–3 land use types, and in three cases were detected only rarely in at least one of these. Since pastoral and agricultural land together accounts for c.76% of the surface area of Uganda, the chance sighting of just 1–2 additional or fewer individuals in either land use type would have had a substantial impact on national population estimates. Consequently, the density estimates generated had extremely wide confidence limits, such that we were unable to derive meaningful population estimates for these species in these land use types.
Population estimates (individuals; CLs in brackets) within the four protected areas surveyed, and within all PAs combined.

1 Including natural land within Uganda’s remaining PAs.
2 Since White-backed and Lappet-faced Vulture were detected only within PAs, these figures represent national population estimates for Uganda.
Discussion
The five globally threatened vulture species surveyed here are widespread throughout Africa, and include colonial, cliff-nesting species (Rüppell’s Vulture) as well as solitary and loosely colonial tree nesters, among which the proportion of adults actually breeding may vary between species, sites and years (Mundy et al. Reference Mundy, Butchart, Ledger and Piper1992). Consequently, many of the range states involved are likely to lack the funding or expertise required to mount surveys of nest occupancy, on a scale large enough to yield robust population indices. While nest surveys indicate the size of the breeding population, and hence yield an important measure of the local status of these long-lived, slow-breeding species, the existence of a non-breeding component within the population, capable of replacing nest- or territory holders, could initially mask declines among breeding individuals. Conversely, monitoring the abundance of non-breeding individuals could provide an early warning of any decline in the breeding population (Margalida et al. Reference Margalida, Oro, Cortés-Avizanda, Heredia and Donázar2011).
In many instances, as here, road surveys may offer a more straightforward, practical alternative, providing a means of generating both population indices and density estimates, comparable between range states. Furthermore, road surveys include breeding adults, non-breeding adults and immatures, and are therefore more comprehensive than nest counts. They are, however, subject to a number of biases, particularly with respect to the routes surveyed, although this is more serious when making population estimates than for monitoring. Care should be taken to avoid sampling densely occupied areas in close proximity to nest colonies, and to consider the effects of breeding seasonality. In this study, for example, adults incubating or brooding nestlings will have been missed, leading to a degree of underestimation. More generally, trend estimates from visual surveys may be strongly influenced by spatial variation in food availability or the presence of competitors, and are hence likely to be less accurate than estimates obtained from detailed demographic models (Margalida et al. Reference Margalida, Oro, Cortés-Avizanda, Heredia and Donázar2011).
Encounter rates and densities: which are more precise?
Over a six-year period we surveyed 4,250 km of roads and tracks within protected areas, in which four of the six vulture species were more common than elsewhere. Although these transects yielded a large number of encounters (669), the level of uncertainty associated with mean encounter rates was high in the case of scarce species, including Rüppell’s, White-headed and (in protected areas) Hooded Vulture. For example, we detected a mean of 1.3 (± 0.33 SE) Rüppell’s Vultures 100 km-1, yielding 95% CLs of ± 0.65. This indicates that a future survey would be unable to detect a change in the encounter rate of less than 50%, with statistical confidence. With the exception of Hooded Vulture, for which CLs were extremely wide, equivalent estimates for the remaining species were similar to, or lower than that of Rüppell’s: 54% (White-headed), 39% (Palm-nut), 38% (White-backed) and 25% (Lappet-faced Vulture). Levels of precision achieved using Distance sampling were generally lower than those associated with linear encounter rates. Therefore, in most cases it would be possible to detect a smaller decline in a species’ encounter rate than in its density, with statistical confidence. Two exceptions were Hooded and White-headed Vulture, for which declines in density (of at least 67% and 44%) would be more easily detectable than declines in encounter rate.
Recording the perpendicular distance of each bird or group of birds from the transect line provided added value, enabling us to estimate each species’ density and population size, particularly within protected areas. Note, however, that Distance sampling requires that several key assumptions are met (Buckland et al. Reference Buckland, Anderson, Burnham and Laake1993). First, the distance between the observer and the bird should be measured accurately. In this study we assigned all detections to one of three wide distance bands, thereby minimising the proportion of detections subject to inaccurate distance estimation. Second, each bird should be detected before it moves in response to the observer (or vehicle). Although this assumption seems likely to have been met on most occasions, there remains the possibility that soaring vultures may have adjusted their flight path in response to the vehicle, prior to detection. Here again, the adoption of wide distance bands may have partially mitigated such an effect. Third, all birds present at zero distance from the transect (i.e. directly overhead) must be detected. Although the deployment of outside observers appears to have raised the proportion of birds detected, it was not practicable to have such observers on busy public roads, and there remains the possibility that a small proportion of birds directly overhead were missed, resulting in under-estimation of the true density. Fourth, to minimise double-counting the observer must be moving more quickly along the transect than the subject. Whereas the mean vehicle speed in natural areas was 24.0 km hr-1, mean cross-country speeds of Gyps species (in the Serengeti) have been estimated at 47–56 km hr-1 (Pennycuick Reference Pennycuick1973). Although in most cases the birds recorded here are unlikely to have been flying parallel to the transect, it is possible that some individuals were recorded more than once on the same transect.
The routes surveyed should have provided a representative sample of each of Uganda’s four main savanna National Parks. In practice, however, survey effort was uneven, Kidepo Valley NP being under-represented due to cost constraints. Ideally, our transects should also have been located independently of features likely to influence vulture densities (Buckland et al. Reference Buckland, Anderson, Burnham and Laake1993). Clearly, the routes taken by public roads and tracks within protected areas do not meet this assumption, since they avoid difficult terrain, are subject to repeated disturbance and, in the case of public roads, have a positive association with human habitation. These factors are likely to have led to an underestimation of vulture densities in pastoral and agricultural areas, with the exception of Hooded Vulture, given its association with (roadside) human settlements. These points strongly influence the accuracy of density estimates, but are less important when the data are used for monitoring, provided that the same routes are surveyed each time.
Potential refinements
As an alternative to annual counts, surveys repeated at longer intervals (e.g. of 3–4 years), might prove more cost-effective, and statistically more powerful, as a way of detecting trends in vulture abundance. Furthermore, the application of Distance sampling in this survey was only partially successful, in two respects. First, in most cases MCDS did not improve the precision of density estimates sufficiently to enable us to generate national population estimates for species detected in pastoral and agricultural land, where very few detections were made. Clearly, generating meaningful estimates for Palm-nut, Rüppell’s and White-headed Vulture in these land use categories would require increased survey effort, perhaps by a factor of four or five. Second, the precision of density estimates made in natural areas was also low, but might be improved by assigning detections to finer distance bands, e.g. five 100 m bands, and by using an electronic rangefinder.
Vulture abundance in Uganda and elsewhere
Our findings demonstrate the importance of protected areas, or of the ‘natural’ habitats and herbivore populations that they support, for the conservation of vultures in Uganda, and probably in much of tropical Africa. Collectively, the five scavenging vulture species were detected from four to six times more frequently within PAs than in agricultural and pastoral land, and two species (White-backed and Lappet-faced Vulture), were recorded nowhere else during the course of the survey. Nevertheless, pastoral land is of particular importance to vulture populations in Uganda, being almost nine times more extensive than natural land, and providing corridors between the savanna parks. Also, pastoral land is likely to change less in coming years than agricultural areas, which were important only for Hooded and Palm-nut Vultures (Table 4).
Gyps species :
Our findings suggest that Uganda holds c.1,000–2,600 White-backed Vultures (0.4–1.0% of the global population; BirdLife International 2013), and that its protected areas hold c.1,200–2,900 Gyps individuals, including c.100–500 Rüppell’s Vultures. Gyps encounter rates within protected areas in Uganda were just 50-60% of those reported from West Africa (Thiollay Reference Thiollay2006a) and the Masai Mara, Kenya, during the non-migration season (Virani et al. Reference Virani, Kendall, Njoroge and Thomsett2011). Furthermore, the density of White-backed Vulture in Uganda’s protected areas (10–27 birds 100 km-2) was much lower than that reported from the Masai Mara National Reserve (c.72–286 birds 100 km-2; Virani et al. Reference Virani, Kendall, Njoroge and Thomsett2011) and from protected areas in Swaziland (c.38–208 birds 100 km-2; Monadjem and Garcelon Reference Monadjem and Garcelon2005), but was similar to density estimates for Kruger National Park, South Africa (Murn et al. Reference Murn, Combrink, Ronaldson, Thompson and Botha2013).
A possible explanation for Uganda’s low density of Gyps vultures, relative to that of the Masai Mara, is the depletion, during the mid-1970s, of its wild herbivore populations (R. Lamprey pers. comm. 2013), which remain well below the levels recorded in the 1960s (Lamprey et al. Reference Lamprey, Buhanga and Omoding2003). The paucity of breeding records of Gyps vultures in Uganda in recent decades (R. Ssemmanda and D. Pomeroy pers. obs.) suggests that each is part of a metapopulation covering a much larger area. This is supported by a recent observation of large numbers of vultures drifting northwards, at a great height over Lake Mburo National Park (Pomeroy Reference Pomeroy2008).
White-headed and Lappet-faced Vultures:
Uganda is likely to support a population of c.160–500 Lappet-faced Vultures (c.2–6% of the global population; BirdLife International 2013), while its protected area network may support c.30–150 White-headed Vultures, with additional birds present on pastoral land. The encounter rate for White-headed Vulture (0.4 birds 100 km-1) was only c.30% of that recorded in West Africa and Kenya (1.3–1.4 birds 100 km-1; Thiollay Reference Thiollay2006a, Virani et al. Reference Virani, Kendall, Njoroge and Thomsett2011), while Lappet-faced Vultures were detected at very similar rates in this study and in West Africa (1.0–1.1 birds 100 km-1), but at 4–5 times this rate in the Masai Mara (Virani et al. Reference Virani, Kendall, Njoroge and Thomsett2011). Consequently, even within protected areas White-headed and Lappet-faced Vultures were recorded at extremely low densities (< 2 birds and 2–5 birds 100 km-2, respectively), broadly consistent with densities reported from protected areas in South Africa (Hitchins Reference Hitchins1980), Swaziland (Monadjem and Garcelon Reference Monadjem and Garcelon2005) and Tanzania (Pennycuick Reference Pennycuick1976).
Being more solitary, territorial, better at searching over wide areas (Spiegel et al. Reference Spiegel, Getz and Nathan2013) and more likely to arrive early at carcasses (Mundy et al. Reference Mundy, Butchart, Ledger and Piper1992), White-headed and Lappet-faced Vulture are more adept at finding and exploiting a wider range of carcass sizes, and hence are less dependent on large herbivore concentrations (Pennycuick Reference Pennycuick1976). The few nests observed of these species in Uganda have been in tree species that are plentiful, so that nest site availability is unlikely to limit their numbers.
Hooded Vulture:
Hooded Vultures are sparsely distributed in Uganda’s protected areas, where the encounter rate (0.5 birds 100 km-1) was much lower than that recorded in the Masai Mara (2.3 birds 100 km-1; Virani et al. Reference Virani, Kendall, Njoroge and Thomsett2011) and in West African PAs (c.16 birds 100 km-1; Thiollay Reference Thiollay2006a). While Uganda’s protected area network thus appears to hold just c.20–150 Hooded Vultures, its more extensive areas of pastoral and agricultural land may support much larger populations. However, as noted above, our estimates are likely to have been inflated by the species’ close association with human habitation, and hence with Uganda’s road network. The biggest population of this species is in Kampala, where numbers have declined from about 400 in the early 1970s to just over 100 in 2014 (Pomeroy Reference Pomeroy1975, Ssemmanda and Pomeroy Reference Ssemmanda and Pomeroy2010, M. Kibuule pers. comm., authors’ unpubl. data).
Palm-nut Vulture:
Palm-nut Vulture is thought to be increasing in Uganda’s protected areas (Reference PomeroyPomeroy in press), which appear to support c.390–1,230 birds, at a density of 4–13 birds 100 km-2. This is much lower than the exceptionally high densities reported by Thiollay (Reference Thiollay1998) in Cote d’Ivoire in 1996 and 1972, of 11 and 13 pairs in a 2,000 ha study site; equivalent to 110-130 birds 100 km-2.
Conclusions
In view of the large number of range states occupied by Africa’s threatened vulture species (BirdLife International 2013) there is clearly a need to develop simple, robust field methods yielding comparable measures of their abundance. To date, tree nest counts have been used as a measure of population density in at least 15 studies, mainly in southern Africa (Murn et al. Reference Murn, Combrink, Ronaldson, Thompson and Botha2013), while road surveys have been used more widely in West Africa and, to a lesser extent, in East Africa, providing linear indices of abundance. Here, we demonstrate that Distance sampling, even when based on relatively wide distance bands, provided estimates that were broadly comparable with the densities derived from nest counts, and in two cases were more precise than those associated with linear encounter rates. The latter varied significantly between protected and unprotected land, by a factor of 4–6, and were sufficiently precise (in four cases) to enable future road surveys to detect declines of 25–54% within Uganda’s protected areas.
Supplementary Material
The supplementary materials for this article can be found at journals.cambridge.org/bci
Acknowledgements
We are particularly grateful to the Uganda Wildlife Authority for granting permission to make counts in protected areas, and for making available their most experienced rangers. Several volunteers from NatureUganda acted as recorders. Roger Skeen kindly provided the data for Kidepo Valley National Park. We are also especially grateful to Will Cresswell for providing guidance on statistical analyses, and to Eric Rexstad, who advised on the Distance sampling analysis. The cost of field work was generously covered by The Peregrine Fund (USA) and the Royal Society for the Protection of Birds (UK).


