


NATO allies faced two key changes as they emerged from the coronavirus pandemic. The first is the high debt burdens driven higher by the economic response to the health emergency in which governments spent unprecedented sums to support sidelined businesses and workers. While initially generous, many states are now grappling with the prospect of repaying these debts as monetary policy support is curtailed and fiscal space risks being further curtailed by rising inflation, with the prospect of more stringent enforcement of fiscal commitments (IMF 2022). This is especially true in countries like Italy, which entered the pandemic with already high debt burdens, and are likely to face strong pressure from creditors to credibly address their debt burdens.
The second challenge is bearing the costs of adjustment to increasing geostrategic instability. The Russo-Ukrainian war has stimulated discussions of increasing defense spending in many countries, but burden-sharing concerns have been a constant in NATO's history (Sloan Reference Sloan2020). While US President Donald Trump became known for his harsh criticism of allied investments in defense (Becker et al. Reference Becker2019), presidents from Kennedy (Reference Kennedy1963) to Obama (Gates Reference Gates2011) also expressed ‘aggravation’ (Goldberg Reference Goldberg2016) about European allies under-investing in defense. Geopolitical events have led many allies – including Italy (Lanzavecchia Reference Lanzavecchia2022) – to recommit to meeting the defense spending guidelines they agreed on at their 2014 Wales Summit (Belgian MOD 2022; Scholz Reference Scholz2022; van Defensie Reference van Defensie2022). However, public support for increased spending is not guaranteed, not least because of the budgetary trade-offs they imply. For example, in the days since Italy pledged to increase military spending in line with the 2 per cent of GDP Wales Pledge, public sector workers have protested against the allocation of scarce resources towards the military (Rathbone Reference Rathbone2022).
Recent events provide an opportunity to probe two open questions regarding the relationship between economics and security in Europe. First, what role do threats (or their absence) play in support of military spending? Scholars have an incomplete understanding of how emergent threats do or do not translate into new security spending. While Nordhaus, Oneal, and Russett (Reference Nordhaus, Oneal and Russett2012) found that external threats correlate with aggregate military spending, operationalizing threats is challenging (Becker Reference Becker2019; Haesebrouck Reference Haesebrouck2019), as is identifying a causal link between them and spending. Beyond looking at threats and public support for military spending (Eichenberg and Stoll Reference Eichenberg and Stoll2003), it has been difficult to establish if public support for military spending grows with external threats or if collective action problems (Olson and Zeckhauser Reference Olson and Zeckhauser1966; Schelling Reference Schelling1963) persist even in heightened threat environments.
Second, it is unclear how public opinion over military spending responds to increases in public debt and calls for consolidation in the context of deteriorating international security environments in which threats appear to be increasing (Schilde Reference Schilde2017). While previous research has demonstrated that fiscal constraints limit military spending in cross-national country-year observational studies (Christie Reference Christie2019; DiGiuseppe Reference DiGiuseppe2015) and that cutting back discretionary spending such as military spending entails lower political costs than in the case of entitlement spending (Breunig and Busemeyer Reference Breunig and Busemeyer2012), the theorized public constraint has yet to be convincingly established. A stream of recent studies, conducted pre-pandemic, suggests that voters confronted with policy options to reduce debt burdens find cutting military spending the most attractive (Bansak, Bechtel, and Margalit Reference Bansak, Bechtel and Margalit2021; Huebscher, Sattler, and Truchlewski Reference Huebscher, Sattler and Truchlewski2021). However, these studies were conducted in periods and countries with relative geostrategic calm and within surveys that prioritize economic policy and neglect other government activities. Will such results hold up in surveys asking respondents to consider the threat environment in addition to material economic considerations?
We address these questions with a survey experiment fielded in Italy as Russian troops massed on Ukraine's border pre-invasion in January of 2022. To examine the effect of a heightened threat environment, we randomly assigned half of our respondents to read a news article with actual quotes about the potential consequences of a Russian invasion on Italian national security and then measured respondents' fiscal policy preferences. We found that information about national security threats increases military spending support by approximately 20 per cent of a standard deviation and, in a multidimensional fiscal trade-off, decreases support for military spending cuts to reduce public debt by 11–16 per cent on average.
To demonstrate the validity of our results, we recontacted respondents who received no information about the threat, our control group, three weeks after the February 2022 invasion of Ukraine and again measured their fiscal policy preferences. Responses were consistent with our original survey experiment. Italians were more supportive of military spending post-invasion and less willing to cut military spending to reduce government debt than they were pre-invasion.
Our findings have implications for several literatures. First, this is the only study we are aware of that uses random assignment of information about security threats to assess public opinion towards military spending. There have been several experimental studies on public opinion toward the use of force (Kertzer Reference Kertzer, Huddy, Sears, Levy and Jerit2023), but few studies have leveraged the randomization of experiments to probe how people think about longer-term fiscal commitment towards security beyond an isolated incident like an intervention (Tomz and Weeks Reference Tomz and Weeks2013), and none have examined how such choices occur within the context of more realistic multi-dimensional policy trade-offs. This is important because most of our knowledge about the relationship between public opinion and military spending comes from observational studies (Williams Reference Williams2015) and most of these focus on the United States (Hartley and Russett Reference Hartley and Russett1992; Higgs and Kilduff Reference Higgs and Kilduff1993; Bartels Reference Bartels1994). While some studies address threats directly (Ostrom and Marra Reference Ostrom and Marra1986), and others address threat perceptions in Europe (Béraud-Sudreau and Giegerich Reference Béraud-Sudreau and Giegerich2018; Eichenberg and Stoll Reference Eichenberg and Stoll2017), no study to date, as far as we know, has used experimental data to analyze the relationship between threat perceptions and public support for defense spending in Europe. By experimentally priming threat, as we do here, we can have greater confidence in our estimates of the causal effect of public threat perceptions on defense spending.
Next, our study has implications for those interested in public support for fiscal policies and especially those concerned with the composition of austerity policies. We demonstrate that attitudes towards fiscal trade-offs are malleable – they change based on exposure to information about, in the case of our survey experiment, external military threats. As such, evidence that military spending is not a priority for respondents (Bansak, Bechtel, and Margalit Reference Bansak, Bechtel and Margalit2021; Huebscher, Sattler, and Truchlewski Reference Huebscher, Sattler and Truchlewski2021) is potentially overstated or is at least partially a feature of an economic-oriented survey environment. When security is made salient and threats are identified, citizens' appetite for military spending cuts is substantively moderated.
Third, our findings contribute to the political economy of security work disentangling the complex foundations of budget composition preferences among electors. In particular, we identify micro-foundations for arguments that ‘guns versus butter’ preferences are both conditional (Hauenstein, Smith, and Souva Reference Hauenstein, Smith and Souva2021; Whitten and Williams Reference Whitten and Williams2011) and malleable (Williams Reference Williams2019). Access to additional information affects respondents' attitudes toward budgetary tradeoffs involving defense spending.
Lastly, our paper has clear policy implications for the current crisis and beyond. First, it shows that worries about the commitment of European allies to NATO were potentially overstated. Consistent with work by Schilde, Anderson, and Garner (Reference Schilde, Anderson and Garner2019), European allies are ready to commit to defense when confronted with a threat, even when under fiscal stress. Second, it suggests that a clearer understanding of an external threat among electorates may moderate a more general tendency to free- or easy-ride (Cornes and Sandler Reference Cornes and Sandler1984) on the investments of allies. Since 2014, threat perceptions moderating free- and easy-riding has been apparent – at least anecdotally: Douglas Lute, US Permanent Representative to NATO from 2013 to 2017, argued that ‘the president most responsible for NATO's increased defense spending was neither Obama nor Trump, but Putin’ (Lute Reference Lute2021). This argument was made in reference to Russia's illegal annexation of Crimea in 2014 – the Russian attack on Ukraine in 2022 has yielded further evidence of European willingness to invest in defense when threats are apparent to voters. Moreover, responsiveness to the threat of public opinion on budget composition suggests that subsequent multilateral and institutional pressure to bear a fair share of the responsibility for collective defense may also bear fruit. Not only did states geographically vulnerable to Russian aggression decide to further increase defense spending (Janes 2022; Rolander Reference Rolander2022; Vanhanen Reference Vanhanen2022), but geographically distant states like the Netherlands (van de Broek Reference van de Broek2022) and traditional defense spending laggards like Belgium and Germany (Belgian MOD 2022; Scholz Reference Scholz2022) did as well. Our study identifies some of the micro-foundations of these choices and tests them empirically.
Does the Public Constrain Defense Allocation?
States' requirements to invest in military capabilities to secure their territory against external threats and meet international obligations (like NATO's Wales Pledge on Defense Investment) compete with the need to ensure electoral competitiveness by providing public or private goods at home. This ‘guns versus butter’ trade-off often implies that electorates' desire for ‘butter’ constrains democratic governments' provision of security (Powell Reference Powell1993; Whitten and Williams Reference Whitten and Williams2011).
Anecdotal evidence from Italy provides a key illustration of how public constraints impact military spending. Following NATO's 2014 Wales Pledge on Defense Investment, American officials traveled to allied capitals to reinforce the importance of the pledge to Washington and check on progress. When the US Permanent Representative to NATO discussed the topic with senior Italian officials, he learned that Italy had emerging military shipbuilding projects that it did not plan to include the costs of in its reports on military equipment expenditures to NATO allies because, in a time of fiscal austerity, such expenditures would be difficult to justify domestically if they were made public (Lute Reference Lute2022).
This tension between domestic politics and defense spending is not limited to Italy. Although many allies and thought leaders (Chollet, Keil, and Skaluba Reference Chollet, Keil and Skaluba2020) have suggested a focus on defense ‘outputs’ rather than ‘inputs’, states have been reluctant to discuss such outputs publicly. The concept of defense outputs is in itself challenging – economists generally argue that there are no concrete measures for defense outputs the way there are in private markets (Hartley Reference Hartley2012). While inputs can be clearly quantified in the form of defense expenditures (and might be considered ‘costs’ by economists), outputs (which may be considered ‘benefits’) can come in the form of non-quantifiable security benefits, or economic spillover effects, both of which differ among individual allies. ‘The value of defense items can only be ascertained by considering counterfactual consequences: What would the world look like absent those expenses?’ (Cooley et al. Reference Cooley, Nexon, Poast, Alley and Fuhrmann2022). NATO, however, has agreed on ‘output metrics’, which it cites specifically in the Wales Pledge on Defense Investment (NATO 2014) – it is to these output metrics that commentators like those cited above are referring. In economic terms, they are ‘measures of intermediate, rather than, final outputs such as protection, security, safety, peace, and stability’ (Hartley and Solomon Reference Hartley, Solomon, Melese, Richter and Solomon2015). In practice, allies can argue that even when their ‘inputs’ are lagging, they may be so efficient that their ‘outputs’ are not. However, only Denmark (NATO 2013) has elected to publicly release the outputs report NATO Ministers of Defence agreed upon, and outputs tracked by the European Defence Agency correlate strongly with NATO's defense spending metrics (Becker Reference Becker2017). This further suggests that allies are reluctant to engage in detailed public discussion of the politics of defense spending and capabilities acquisition.
While the public has often been theorized to be a constraint on military spending (Becker Reference Becker2019; Carter, Ondercin, and Palmer Reference Carter, Ondercin and Palmer2021; DiGiuseppe Reference DiGiuseppe2015; Fordham and Walker Reference Fordham and Walker2005), few studies have attempted to probe this mechanism directly. However, in line with anecdotal evidence, they generally find that military spending correlates strongly with public preferences for military spending (Eichenberg and Stoll Reference Eichenberg and Stoll2003; Hartley and Russett Reference Hartley and Russett1992, 199). Relatedly, policymakers do seem to be responsive to the public's foreign policy preferences. Two recent studies show that public opinion has a causal effect on policy makers' stated policy preferences by randomly providing information about public opinion concerning the use of force in Israel (Tomz, Weeks, and Yarhi-Milo Reference Tomz, Weeks and Yarhi-Milo2020) and UK power projection in the South China Sea to legislators (Chu and Recchia Reference Chu and Recchia2022). Consequently, there is a reasonable expectation that the public's voice on defense concerns, which is often considered divorced from domestic politics, is heard. The underlying mechanisms of this expectation merit further exploration.
Does the Public Prefer Butter to Guns?
If the public is an important constraint on military spending, it is worth asking whether the public is generally averse to military spending when public preferences change. Here, again, there is limited research within the security literature that addresses the question at the microfoundational level by exploring public opinion. Existing studies all rely on observational data overwhelmingly drawn from US samples (Knopf Reference Knopf1998) and have limited temporal coverage. One exception is Fay (Reference Fay2020) who examines the correlates of support for military spending among thirteen NATO countries. He finds that attitudes towards NATO and a strong economy are predictive of unidimensional support for military spending. However, all studies deviate from the ‘guns versus butter’ theoretical framework and only ask about unidimensional support for military spending that does not explicitly invoke budgetary trade-offs that are at the heart of fiscal policy decisions and preferences. In other words, these studies examine questions that pose an increase in military spending without the acknowledgement of its fiscal consequences or closed answer choices that allow respondents to choose among various options.
Researchers focused on fiscal policy preferences have found evidence pointing toward popular distaste for military spending. Recent studies in this research area have probed multidimensional preferences for budget trade-offs. For example, Bonica (Reference Bonica2015) and Barnes, Blumenau, and Lauderdale (Reference Barnes, Blumenau and Lauderdale2022) allow respondents to select their preferences for spending packages along multiple dimensions in the US and UK, respectively. Both find little appetite for military spending, especially among left-wing voters. Notably, several studies have examined support for budget consolidation or austerity policies in the context of debt reduction. Huebscher, Sattler, and Truchlewski (Reference Huebscher, Sattler and Truchlewski2021) assessed preferences for austerity policies in the UK, Spain, and Germany. Here they found that in all three countries, citizens, when given the choice to determine the composition of spending cuts, strongly prefer that most spending cuts come from defense expenditures. Experimental evidence also supports this notion. Bansak, Bechtel, and Margalit (Reference Bansak, Bechtel and Margalit2021) asked respondents in the UK, Spain, Italy, Greece, and France to compare pairs of austerity policies that had randomly distributed elements like spending cuts on different government programmes or tax increases on different segments of society. They found that hypothetical programs that included military spending cuts had the most support compared to the average proposal. Lastly, in a study of US voters, Roth, Settele, and Wohlfart (Reference Roth, Settele and Wohlfart2021) find that simply providing the correct information about the size of the debt-to-GDP ratio decreased support for military spending in a unidimensional framework.
While security scholars generally acknowledge such a public constraint on military spending, they continue to debate its specific nature and effects. Bueno de Mesquita et al.'s (Reference Bueno de Mesquita, Morrow, Siverson and Smith1999) formal, game theoretical analysis of the underpinnings of democratic peace theory found that such a peace rested on two factors: that elected officials with large winning coalitions are more dedicated to victory once war has broken out and that they are more careful about starting wars in the first place – not that public opinion is systematically opposed to defense spending. Fordham and Walker (Reference Fordham and Walker2005, 142) find, however, ‘that, although other considerations may outweigh the effects of regime type, liberal states tend to devote proportionally less to their militaries than do autocratic states’. Subsequent work added nuance and conditionality to these findings, however. Whitten and Williams (Reference Whitten and Williams2011) found that at the national level, parties' approaches to defense spending are driven simultaneously by two factors: first, attitudes toward internationalism and, second, attitudes toward welfare spending. Internationalists who favour welfare spending are most likely to support higher defense spending. Williams (Reference Williams2019, 1,194) finds micro-level confirmation for this argument using non-experimental survey data: ‘voters who favor increased welfare spending subsequently also support increased defense spending’, particularly those voters who are interested in the government's role in job creation. Becker (Reference Becker2021) found that governments in Europe and North America seemed to understand these preferences – increasing spending on military personnel at the expense of equipment modernization when faced with rising unemployment. In another observational study, Hauenstein, Smith, and Souva (Reference Hauenstein, Smith and Souva2021) find that the apparent propensity of democracies to spend less on defense is, in fact, driven by threats. Our analysis seeks to subject these theories to experimental analysis at the micro-level.
So, while some researchers have found that the public has a distaste for military spending and is willing to sacrifice security when confronted with options to reduce government debt and budget deficits, other work points toward scepticism regarding these claims. In addition to this dissensus in the literature, there are at least three other reasons for such scepticism. First, these studies were conducted in a period when respondents' countries were experiencing relative peace and concerns about security were minimal among the public. Second, these survey environments primed respondents to think largely about economic priorities and consequences. Notably, the surveys asked respondents to consider austerity options and the consequences for both personal and national economic priorities.
Furthermore, the finding that citizens neglect national defense to preserve their material welfare is at odds with literature suggesting the public can be hawkish and are willing to make sacrifices in the name of national defense. For example, Knopf (Reference Knopf1998) shows that US public opinion on military spending moved with Soviet actions during the Cold War. In the context of Europe, Schilde, Anderson, and Garner (Reference Schilde, Anderson and Garner2019) suggest that European citizens are more hawkish than conventional wisdom assumes. For evidence, they cite a Transatlantic Trends survey devoted to studying foreign policy views, which suggests Europeans were on average more likely to support budget cuts to domestic spending areas than defense when asked about debt reduction (Everts et al. Reference Everts2012). Notably, Europeans were found to be less supportive of defense cuts than the traditionally more hawkish American public. Together, this suggests that the systematic evidence that defense is a low priority among citizens may be a product of survey environments or lack of validity outside the peaceful period in which the surveys were conducted. When foreign policy and threats are salient, citizens are potentially more permissive of military spending even in times of economic duress. As such, concerns that fiscal consolidation will further reduce the public's appetite to contribute to collective defense may be overstated.
Threats and Public Opinion
The idea that individuals are responsive to information about national security threats is consistent with those studying support for military interventions. Several experimental studies show this to be the case. For example, Malhotra and Popp (Reference Malhotra and Popp2012) measure attitudes towards counterterrorism measures among respondents that were randomly distributed a hypothetical probability of a terrorist attack in the next five years. Those that were provided with a higher threat probability indicated more hawkish foreign policy views. Gadarian (Reference Gadarian2010) shows that people express more hawkish views when presented with more threatening compared to non-threatening contexts. Similarly, Myrick (Reference Myrick2021) shows that non-partisan priming of threats can influence foreign policy attitudes toward China among US respondents, while Kertzer and Zietzoff (Reference Kertzer and Zeitzoff2017) show that partisan and social cues can have a great effect on an individual's support for foreign intervention. Lastly, within the context of terrorism, Conrad et al. (Reference Conrad2018) show that support for torture increases when perceptions of threat levels are increased.
These and other studies suggest that attitudes toward foreign and domestic security policy are malleable. Consequently, the nature of public attitudes towards military spending is also likely to shift depending on both the survey context and real-world events. This also corresponds with research that shows framing and elite cues have the potential to shift opinion on a variety of economic issues including budgetary preferences (Ardanaz, Murillo, and Pinto Reference Ardanaz, Murillo and Pinto2013; Bansak, Bechtel, and Margalit Reference Bansak, Bechtel and Margalit2021; Bisgaard and Slothuus Reference Bisgaard and Slothuus2018; Ferragina and Zola Reference Ferragina and Zola2022; Slothuus and Bisgaard Reference Slothuus and Bisgaard2021).
The previous literature leaves open several questions. First, we have a poor understanding of the malleability of citizens' preferences toward military spending and fiscal trade-offs. Evidence indicates that in times of relative peace and within economic policy surveys, citizens are averse to military spending. However, it remains to be seen if this will change as threats are made salient. As discussed above, there is good reason to believe citizens' attitudes in this area are subject to change through increasing levels of threat perception (Gadarian Reference Gadarian2010; Malhotra and Popp Reference Malhotra and Popp2012), and that national policy is sensitive to threats as well (Hauenstein, Smith, and Souva Reference Hauenstein, Smith and Souva2021). Consequently, we expect that citizens will be more accepting of military spending when provided with information about national security threats.
Hypothesis: Information about threats will increase support for military spending
We also pre-registered another main hypothesis and four ancillary hypotheses that returned null results. First, we hypothesized that information about Italy's debt would decrease support for military spending, conditional on individuals' prior estimation of debt-to-GDP size, left-right orientation, and employment status. Next, we hypothesized that information about debt would condition the effect of threats on military spending. Notably, the debt information treatment does not have a significant interaction effect with the threat treatment on the outcomes we report below.Footnote 1 As such, we are justified in ignoring this treatment in the analysis that follows.
Methodological Approach
Typically, studies of military spending rely on observational country-year panel analysis. While this research is useful for observing general correlations in military effort variation and how institutions shape spending (Digiuseppe and Poast Reference Digiuseppe and Poast2018; Fordham and Walker Reference Fordham and Walker2005), it is less useful for understanding the impact of more dynamic political constraints such as public opinion. Further, relying on observational (non-experimental) studies of public opinion towards military spending allows for comparisons across time but has a limited ability to identify causal effects given the scarcity of appropriate instruments, exogenous shocks, or data on confounding factors.
In light of these limitations, we use randomization via survey experiments to help study the effect of the threat environment on the relationship between external threats and military spending. To do so, we recruit a nationally representative sample in Italy using a pre-existing internet panel (N = 1,544). We chose Italy because it is a hard case. Italy entered the pandemic with a high and longstanding debt burden and thus faces a greater urgency for debt stabilization than other NATO allies.Footnote 2 Italy also has relatively fewer security externalities than other NATO countries given they are quite far from Russia and have a sizeable political constituency that is relatively friendly to Russia (Baldolini Reference Baldolini2022). For example, among other large NATO allies, the Italian public has more confidence in Putin and is more likely to view Russia as a ‘friend’ in public opinion surveys. Among Italians, 36 per cent were confident that Vladimir Putin would do the ‘right thing’ in world affairs in 2021 compared to a median of 22 per cent in nine other polled European states (Silver and Moncus Reference Silver and Moncus2022). In 2022, 22 per cent of Italians still viewed Russia as friendly compared to an average of 14 per cent in six other polled countries. Italy's longest serving prime minister since the Second World War, Silvio Berlusconi, reported exchanging gifts and ‘sweet letters’ with Russian President Putin in 2022, and has blamed Ukraine for the most recent iteration of the Russo-Ukrainian War (Castelletti Reference Castelletti2023). As such, information about threats may have a harder time priming concern amongst Italian voters compared to other European publics. Lastly, Italy is the fifth most populous European country in NATO and, compared to other NATO allies, disproportionally hosts US troops. As such, public opinion within Italy is more consequential for NATO security than members that contribute less to collective defense.
Our survey experiment uses events at the time of the survey as the basis for a realistic threat treatment. We fielded this survey between 19 January 2022 and 4 February 2022. This was a period of heightened and highly publicized tension between NATO and Russia, but before the invasion that started a month later. Following several questions about their concern for the seriousness of public debt in Italy, we randomly present half the respondents with a fictional, short newspaper article and an image as seen in Fig. 1. The fictional news article draws on public reporting and actual official statements about the events. The article mentions that an invasion is possible and that, because of Italy's affiliation with NATO, there is the potential for the conflict to escalate and draw in Italy. Further, we drew on existing documents to elaborate on the particular consequences of a conflict for Italy. To do so, we drew on the 2015 Italian Ministry of Defense ‘White Paper for International Security and Defense’ (Ministero della Difesa Reference Ministero Della2015). We aimed to not only ask respondents to think about European security but also how it might directly impact Italy, which we did by citing passages about destabilization in the Mediterranean Basin. Lastly, since the threat is conditional on existing power, we mention uncertainty over Italy's preparation to deal with these threats with current capabilities.
Threat treatment.

We compare the effect of our treatment against a ‘pure control’ instead of a placebo.Footnote 3 We do this for several reasons. First, the only purpose of a placebo would be to hold the delivery of the treatment constant across experimental conditions. As such, placebo use in survey experiments is often poorly justified (Porter and Velez Reference Porter and Velez2022). Second, we were hard-pressed to find a placebo that would not have its own unintended effects, increasing the likelihood of a type I error. Further, solutions to this problem, such as using AI-generated content (Porter and Velez Reference Porter and Velez2022), were not possible at the time in the Italian language. In the trade-off between risking a placebo effect or potential treatment condition effects (for example the effect of reading any news article), we chose the latter. As such, our findings are conditional on the assumption that the method of treatment delivery has zero effect on the outcome rather than being conditional on the fact that a placebo has zero effect.
After the experimental treatments, we measure our dependent variables. Following Roth, Settele, and Wohlfart (Reference Roth, Settele and Wohlfart2021) we first ask respondents three questions about their preferences for three types of government spending: defense and national security, infrastructure, and education. They are worded as follows: ‘Do you think the amount of government spending on [defense and national security, education, infrastructure] should be increased, decreased, or remain the same?’ Responses take on one of five values: It should be increased a lot, it should be increased a little, it should remain as it is, it should be decreased a little, it should be decreased a lot. The question on defense spending serves as the first dependent variable of interest. The other two outcomes serve to test if the treatment is working to prime threat, but not other considerations, as intended.Footnote 4 We expect the threat treatment to have a negligible effect on these outcomes.
This initial dependent variable is easily understood but fails to consider the multidimensional reality of budget trade-offs that citizens confront (Bansak, Bechtel, and Margalit Reference Bansak, Bechtel and Margalit2021; Bremer and Bürgisser Reference Bremer and Bürgisser2023; Huebscher, Sattler, and Truchlewski Reference Huebscher, Sattler and Truchlewski2021). As such, it may overestimate support for military spending because nothing is being sacrificed to provide it. We thus follow up with two additional dependent variables that attempt to get closer to actual budgetary trade-offs that occur when governments are aiming to reduce expenditures to repay government debt. As such, we give respondents the option to trade off certain policies as well or choose to enact both (which implies neglecting the national debt, a tradeoff in itself). In two separate questions, we ask respondents about their preference for cutting military spending in relation to increased taxes or domestic spending cuts in two separate questions. They are worded as follows:
Given the high government debt of the Italian government, experts have recommended that Italy decrease spending to reduce debts incurred during the pandemic. Do you think Italy should decrease military spending, domestic spending, or neither? [military spending, domestic spending, neither]
If Italy had to choose between reducing military spending and raising taxes to reduce its debt, which option would you prefer?’ [reducing military spending, raising taxes, neither]
Results
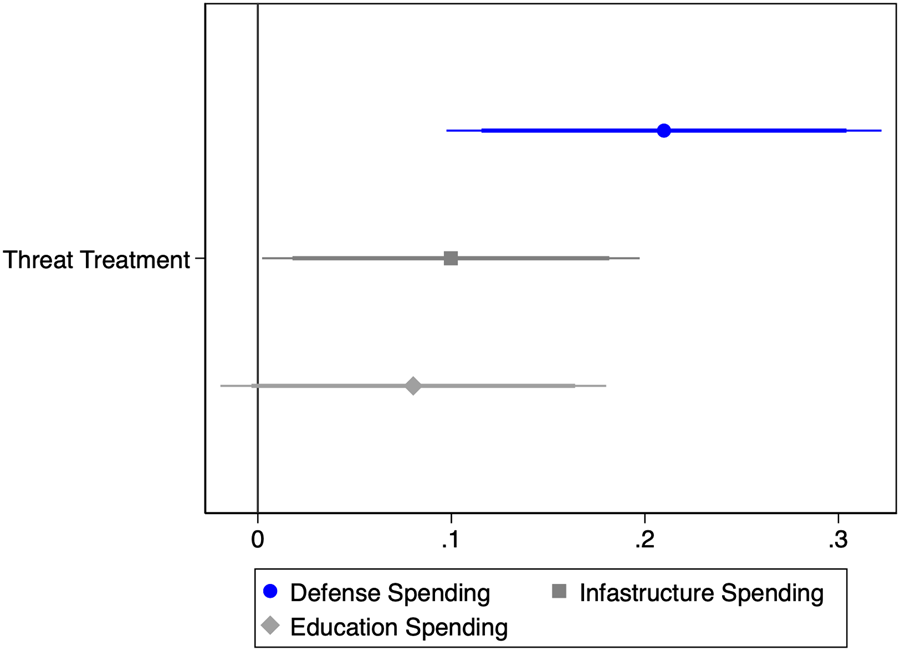
Figure 2 presents the coefficients for the threat and debt treatments for three models estimating unidimensional support for military, infrastructure, and education spending.Footnote 5 Each model, estimated using OLS with robust standard errors, regresses both of these treatments on a different outcome absent any covariates. For each model, higher values of the dependent variable indicate support for increasing spending in the category concerned. We see that the threat treatment has a significant and positive effect on preferences for defense spending. Substantively, the effect represents a 19 per cent of a standard deviation increase in support for defense spending.Footnote 6 While this may appear small, it is consistent with the effect of other informational treatments (Haaland, Roth, and Wohlfart Reference Haaland, Roth and Wohlfart2020, 202).
Effect of treatments on spending preferences.
Note: The thick and thin lines indicate the 95 per cent and 90 per cent confidence intervals, respectively, around the coefficients from three separate OLS models estimated with robust standard errors. Each model estimates the effect of each treatment on three separate spending outcomes (N = 1,544). We present the full regression results in the Supplementary Appendix.

Further, we see that the threat treatment has a minimal or insignificant impact on other spending categories, notably education spending. The threat treatment does not significantly increase preferences for education spending. As the lack of statistical significance does not enable us to conclude that an effect is substantively negligible, to strengthen our claim of a meaningless effect of threat treatment on education spending, we use an equivalence test (Hartman and Hidalgo Reference Hartman and Hidalgo2018; Rainey Reference Rainey2014). In particular, we test for equivalence using the 90 per cent confidence interval, which we report in Fig. 2. The upper bound of the 90 per cent confidence interval around the education spending estimate is 0.16. It means that we could not reject the null hypothesis, that is, we could not claim that an effect is negligible, for effects equal to or greater than 16 per cent of a standard deviation. On the other hand, the threat treatment significantly increases preferences for infrastructure spending (p < 0.042). However, the effect is half the size at 9 per cent of a standard deviation. Moreover, the order of the questions was not randomised, with the question on infrastructure spending always following the question on military spending. This order may have primed respondents to interpret infrastructure spending as closely related to military infrastructure spending, while perceiving education spending as a clearly distinct spending category.Footnote 7 Thus, we have greater confidence that the treatment is working,Footnote 8 at least partially, through individuals' concern for national security matters and that it does not reflect a general preference for increased spending in response to threats or new information.
It is also worth noting, again, that the threat treatment is moving all three spending categories in a positive direction. This further suggests that a unidimensional outcome fails to account for the budgetary trade-offs. Consequently, we next examine the impact of the treatments on defense spending preferences when respondents are confronted with multidimensional trade-offs.
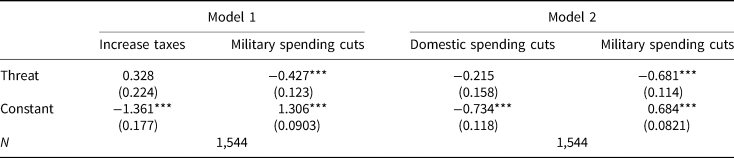
Given the questions about trade-offs (see above), each of these dependent variables can take on three possible categorical outcomes in each question. In model 1, the three outcomes are decrease military spending, decrease domestic spending, or neither. In model 2, the three outcomes are reducing military spending, raising taxes, or neither. We estimate each model with a multinomial logit. This requires we set one value of the dependent variable as the baseline. In both models, we set the baseline condition to ‘neither.’
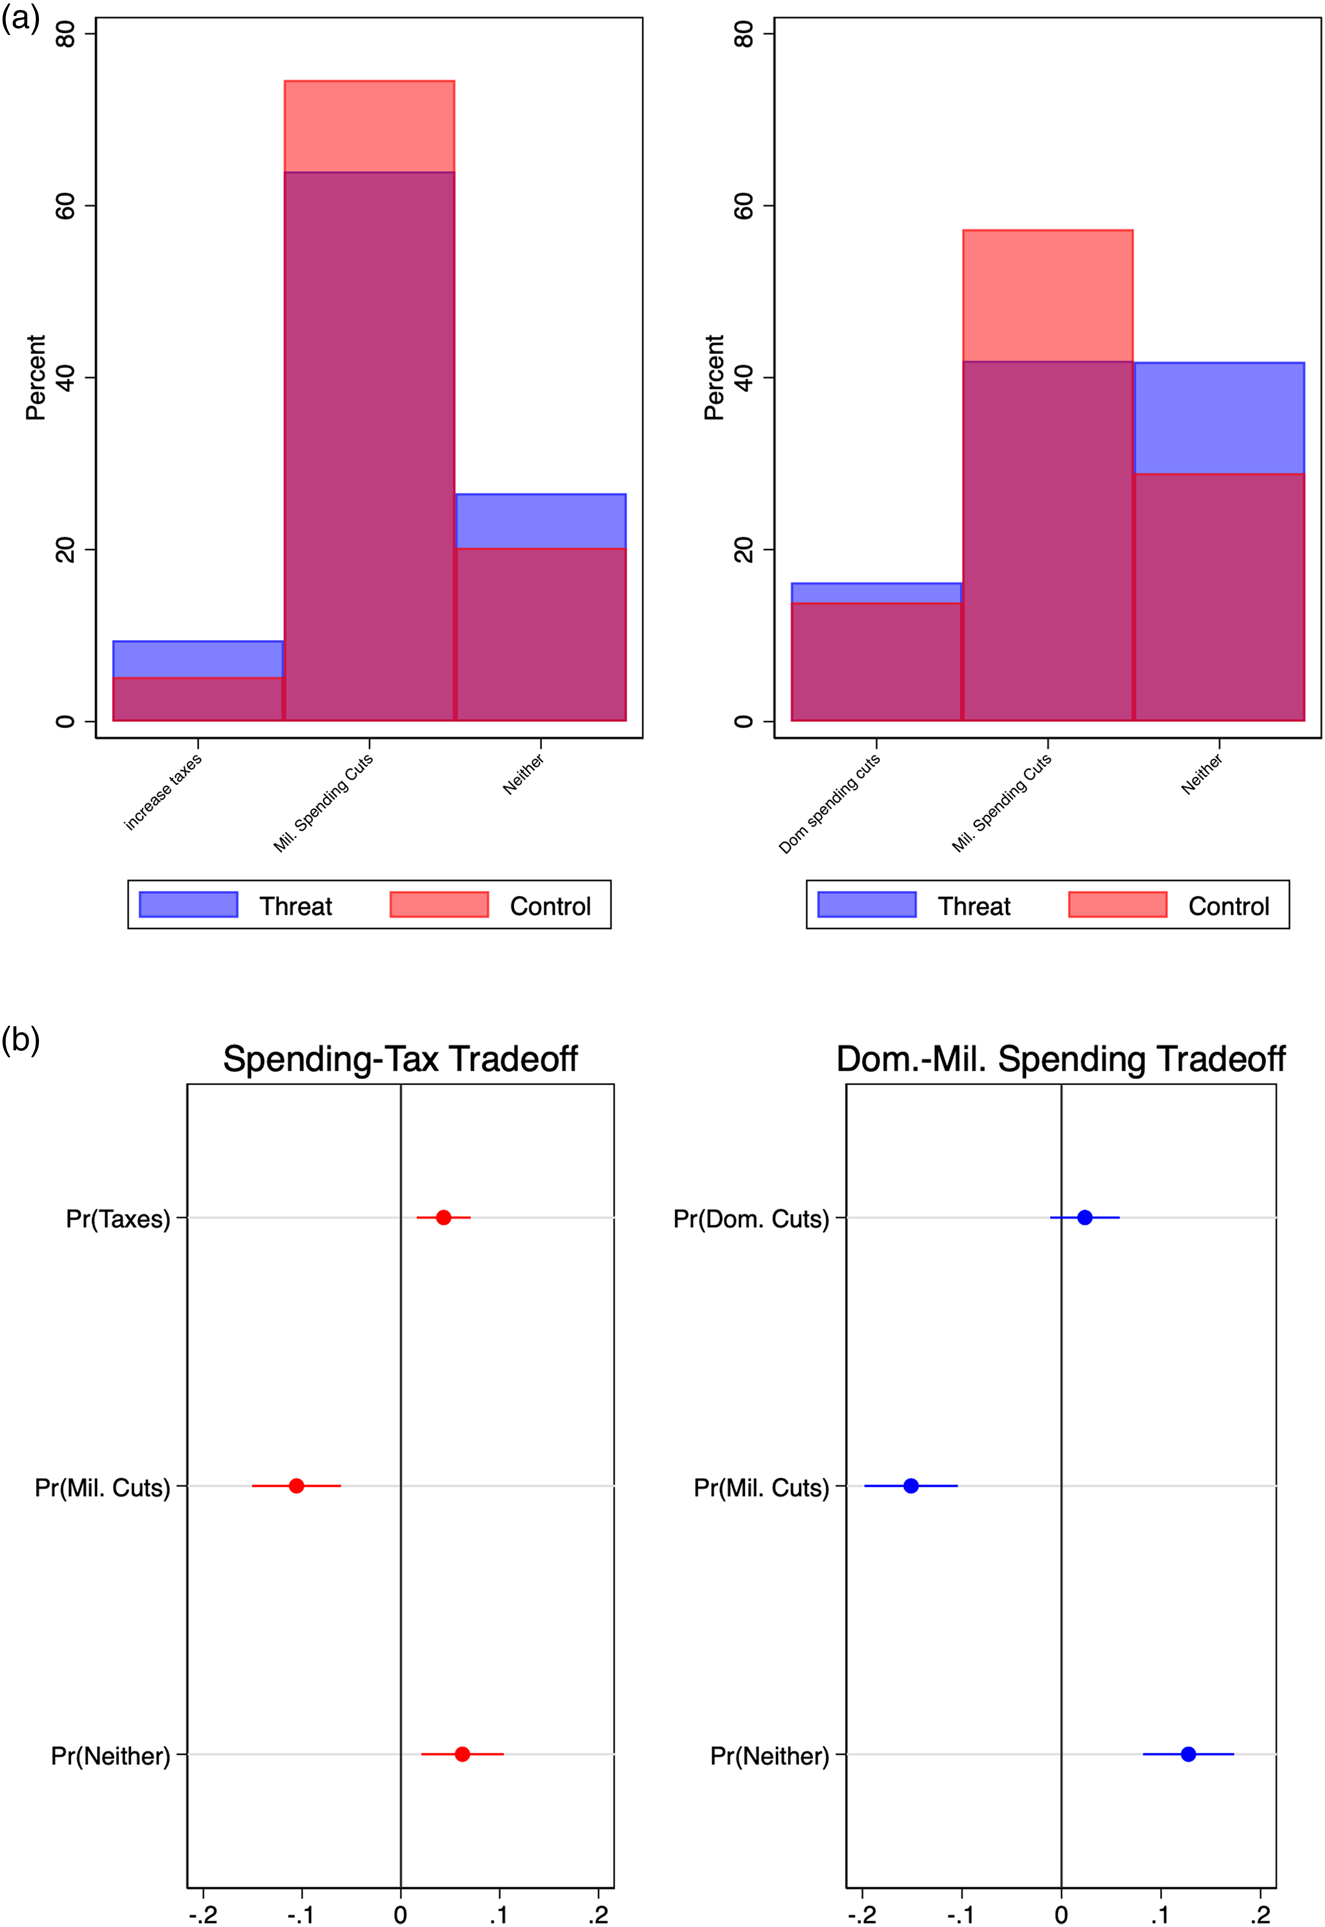
Table 1 presents the coefficients from the multinomial logit regression.Footnote 9 Relative to the ‘neither’ condition, individuals are significantly less likely to support military spending cuts under the treatment condition than when no treatment was delivered. For a more intuitive display of the results, the top panels of Fig. 3 present two histograms of the choices individuals made under the pure control and threat treatment conditions for two questions regarding options to reduce sovereign debt.
Multinomial logit models of budgetary trade-offs

Standard errors in parentheses,*** p < 0.001, ** p < 0.01, * p < 0.05.
Changes in discrete outcomes.
Note: The top panels (a) show the percent support for each consolidation strategy in the treatment (Threat) and control (No Threat) conditions. The bottom panels (b) present the estimated change in average predicted probabilities by moving the treatment variable from zero to one based on two multinomial logit models. The dot indicates the change in predicted probability for each of the three outcomes estimated in each model. The lines indicate the 95 per cent confidence intervals around the estimate.

First, notice that military spending is a preferred choice to reduce sovereign debt among the respondents in both trade-off scenarios. This is consistent with the findings of previous research that we discussed above (Bansak, Bechtel, and Margalit Reference Bansak, Bechtel and Margalit2021; Huebscher, Sattler, and Truchlewski Reference Huebscher, Sattler and Truchlewski2021). Next, we see obvious differences in support for military spending cuts under the different treatment conditions that correspond with Table 1's estimates. We next plot these results in the form of the effect of the threat treatment on the change in the average predicted probability our respondents will select each of the three possible outcomes in each model. The bottom panels in Fig. 3 confirm that the threat treatment has a significant and substantive effect on individuals' constrained fiscal policy choices. The bottom-left panel presents these marginal effects for a trade-off between taxes, military spending reductions, or neither. We see that respondents are 11 per cent less likely to select military spending as an option for reducing sovereign debt under the threat condition than they are under the control condition. The bottom-right panel substitutes tax cuts for domestic spending cuts. We see that when confronted with a choice between domestic cuts, military spending cuts, or neither, respondents are 16 per cent less likely to select military spending under the treatment condition.
It is also interesting that the respondents are less likely to move their support from military cuts to either domestic spending cuts or tax increases. Instead, the threat condition increases support for doing “neither’. We chose to include this option as a way to provide respondents with a way to express displeasure with both options and to preserve the status quo. We can only speculate but it may imply that respondents are willing to delay fiscal consolidation in the presence of a threat. This would be consistent with the idea that governments tend to rely on credit markets to fund military expansions in the presence of domestic opposition to changes in domestic fiscal policy (Becker Reference Becker2019; DiGiuseppe Reference DiGiuseppe2015). However, more research is needed to understand citizens’ motivation for selecting the ‘neither’ option.
Validating the Experiment Post-Invasion
A common critique of survey experiments in political science is that the treatments are ‘short, fleeting, and weak (Mutz Reference Mutz, Druckman and Green2021, 230).’ As such, one might doubt that such effects replicate in response to real-world stimuli. In this section, we attempt to demonstrate that our results mirror responses to the actual invasion of Ukraine.
We fielded our study between 19 January and 4 February 2022. Twenty days later, on the 24 February, Russia invaded Ukraine. This unfortunate turn of events provided an opportunity to examine if our experimental treatment corresponds with real-life events. In effect, we can examine if the onset of the war changed opinions regarding spending priorities within-subject. To do so, we recontacted respondents in our control arm between 11 March and 20 March 2022 and had them complete the survey again. We were successful in recontacting 86 per cent of the respondents in the control arm of the original sample.Footnote 10
We also point out that the follow-up survey was not pre-registered as we moved fast to capitalize on the unfolding events. However, we have only made a few necessary changes to the original pre-analysis plan to adjust to the within-subject data structure. Given that we have two observations for each individual, one pre-invasion and one post-invasion, we cluster the standard errors in our analysis by the respondent.Footnote 11 We also adjust our inference criteria to account for a one-tailed test given our updated expectations about the direction of the effect in Wave 1. Yet, we report both the 90 per cent and 95 per cent confidence intervals in our presentation of the results.
It is also worth pointing out that the findings are not causally identified given that many events happened between the two waves of our survey, such as the substantive increase in energy and wheat prices. When confronted with a trade-off between cutting military spending, increasing taxes, or postponing consolidation, respondents could have preferred the first option driven by concerns about their already reduced disposable income. However, this event would make our findings even stronger because we still find decreased support for military spending cuts. Moreover, we find the information useful as a validation of the original experiment. Besides, given the prominence of the invasion and the news coverage it did receive, it would be unlikely that changes in our dependent variables from one wave to the next were due to other events that did not stem directly from the invasion.
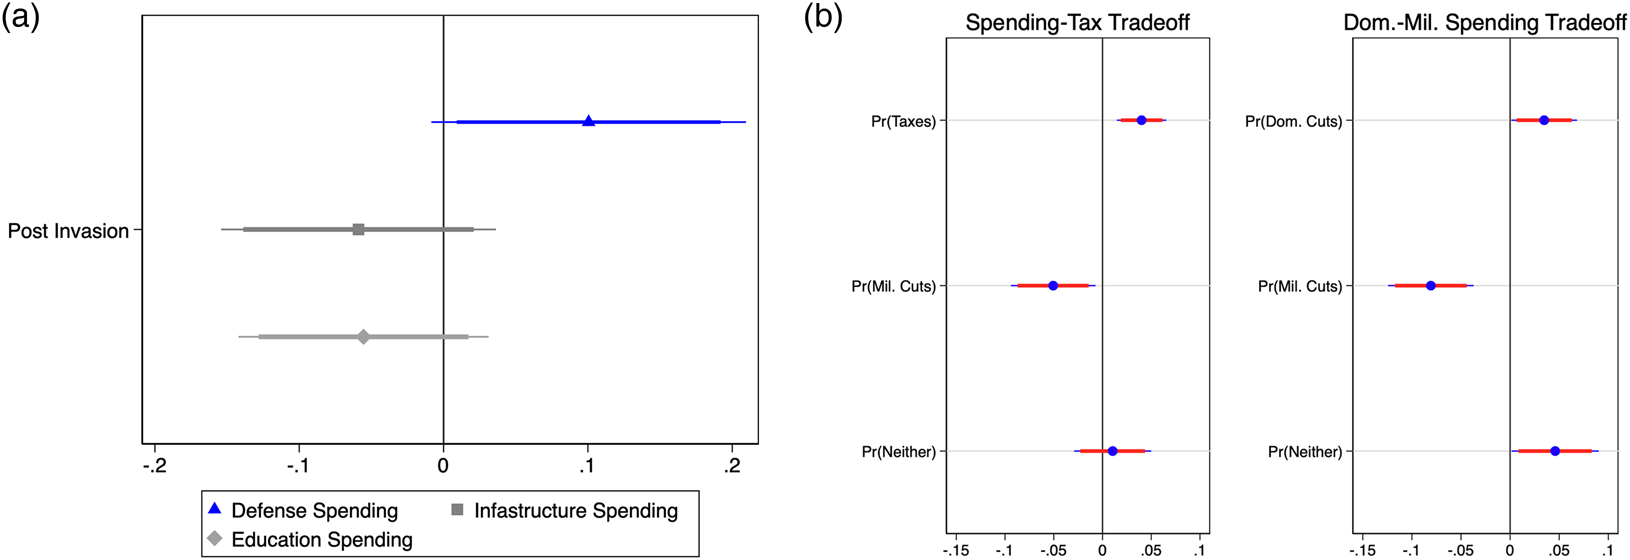
Figure 4 presents the analysis. Preferences for an increase in spending increased within respondent for military spending while there was no appreciable change in preferences for education or infrastructure. In the fiscal trade-off scenarios, we also see that the results are similar pre- and post-invasion to our survey treatment. Our respondents are less likely to support cuts to military spending after the invasion relative to before the invasion. They are also significantly more likely to accept spending cuts and tax increases.
Pre- and post-invasion on spending priorities. (a) (b). Panel 1: The lines indicate the 90 per cent (thick) and 95 per cent (thin) confidence intervals around the coefficients from three separate OLS models estimated with standard errors clustered by respondent. Each model estimates the difference in the DVs from the pre-invasion of Ukraine to the post-invasion of Ukraine (N = 1,154). The confidence intervals are derived from standard errors clustered by respondent. Panel 2: These panels plot the average difference in predicted probabilities pre-invasion to post-invasion estimated from two multinomial logit models. The dot indicates the change in predicted probability for each of the three outcomes estimated in each model. The lines indicate the 90 per cent (wide) and 95 per cent (thin) confidence intervals around the estimate. The confidence intervals are derived from standard errors clustered by respondent.

Among all the dependent variables, the ‘effect’ of the real-life treatment is smaller than that observed in the initial survey experiment. While this may seem surprising at first, we note that we did nothing to prime respondents in our follow-up survey to consider the invasion of Ukraine in their responses. Changes in their opinions are, we assume, due to actual events. Thus, we speculate that the drop in magnitude is likely due to the absence of a prime to think about the events in Ukraine directly. The only treatment that respondents brought to this new survey was their exposure to the events in between survey waves.
Conclusion
While ‘the sinews of war’, Cicero is said to have remarked, may be ‘infinite money’, governments' supplies of money are generally finite. States that are near the limits of their fiscal capacity and that cannot count on the favorable opinions of creditors must confront a guns-versus-butter trade-off. In a free society, that trade-off will be subject to democratic preferences. As existing empirical work in comparative political economy has shown (Bansak, Bechtel, and Margalit Reference Bansak, Bechtel and Margalit2021; Huebscher, Sattler, and Truchlewski Reference Huebscher, Sattler and Truchlewski2021), democratic preferences are biased strongly towards butter rather than guns. In this study, we have tested the sensitivity of this preference to contextual insights about the international security environment. We have shown that the public will relax their opposition to military spending when provided with information about realistic national security threats. Our experiment has shown the finding to be robust to both unidimensional and multidimensional policy choice frameworks. Further, we have shown that real-world preferences correspond with the experimental treatment.
This finding contributes to debates about the political economy of security and alliance politics that are central to conversations about the current international order. Most of the existing literature, as well as conventional wisdom, suggests a strong public preference for ‘butter’ over ‘guns.’ But by fielding a survey experiment in Italy, a challenging case that appeared at first glance to be very likely to conform to this conventional wisdom, we identified mutability at the microfoundational level – public opinion is responsive to contextual information about threats.
As the European and transatlantic security architectures – as well as the larger international system in which they operate – face the challenge of high-intensity war involving great powers in Ukraine, the relationship between public threat perceptions and willingness to invest in national defense takes on greater policy importance. For instance, will European public opinion continue to support Ukraine in the face of rising energy costs? Our findings suggest that this may depend on national leaders' ability to frame the Russo-Ukrainian war as a threat to their own states' national security.
By testing the relationship between threat framing and public attitudes toward defense spending in Italy, we have laid the groundwork for future work across Europe, and across elite and popular opinion. It is far from certain that commitments to European defense will be able to hang together strategically in the context of the material costs of the Russo-Ukrainian war, but our findings suggest it is more likely than previously imagined.
Finally, our findings point to the micro-foundations of a critical transatlantic policy issue. If citizens are more likely to support defense spending when primed to consider threats, allies may give more consideration to the public components of joint threat assessments. Balancing regional concerns in threat assessment, scenario development, and operational and defense planning is an evergreen challenge for NATO as a political alliance. Given that different allies experience threats differently, ‘rediscovering the early principle that allies should concentrate on those tasks for which they are the most geographically suited’ (Mattelaer Reference Mattelaer2018) holds particular promise. If national public opinion is indeed responsive to threat perceptions in general, it is likely that such opinion is even more inclined to support higher defense spending that is focused on more proximate threats.
Supplementary material
The supplementary material for this article can be found at https://doi.org/10.1017/S0007123423000443.
Data availability statement
Replication Data for this article can be found in Harvard Dataverse at: https://doi.org/10.7910/DVN/EOWDU0.
Acknowledgements
Previous versions of this manuscript were presented at West Point, EISS 2022 in Berlin and EPSA 2022 in Prague. We want to thank Fenella McGerty, Dominika Kunertova, Niccolo Petrelli, Vytautas Koukstis and Irene Menendez for helpful feedback and comments.
Financial support
This work was supported by the HORIZON EUROPE European Research Council under grant #852334.
Competing interests
None.
Ethical standards
The research was conducted in accordance with the conditions and principles set by the Ethics Review Committee of the Social Sciences at Leiden University.


 Open access