

1 Introduction
Detecting election fraud from official voting returns is an increasingly important and popular topic in political methodology. Given that roughly half of elections held these days result in some form of allegations about manipulation and fraud,Footnote 1 the wide interest in the statistical methods of fraud detection is clearly understandable. Since election fraud often cannot be observed directly, researchers and policy makers often have to rely on inferential methods to uncover unusual patterns in the official election data that might serve as plausible evidence that election results were tampered with.
Existing fraud-detection methods explore various features of election data that can be suggestive of fraud: unusual distributions of digits in vote count data (Mebane Reference Mebane, Alvarez, Thad E. and Susan D2008; Beber and Scacco Reference Beber and Scacco2012; Medzihorsky Reference Medzihorsky2015), a systematic relationship between turnout and party support rates (Myagkov, Ordeshook, and Shakin Reference Myagkov, Ordeshook and Shakin2009; Klimek, Yegorov, Hanel, and Thurner Reference Klimek, Yegorov, Hanel and Thurner2012), skewness and kurtosis (Myagkov, Ordeshook, and Shakin Reference Myagkov, Ordeshook and Shakin2009) and statistical outliers in election data (Mebane and Sekhon Reference Mebane and Sekhon2004). Cantú and Saiegh (Reference Cantú and Saiegh2011) and Levin, Pomares, and Alvarez (Reference Levin, Pomares, Alvarez and Alvarez2016) use machine learning tools for probabilistic detection of election fraud. Montgomery, Olivella, Potter, and Crisp (Reference Montgomery, Olivella, Potter and Crisp2015) propose a method combining multiple tools of fraud forensics and incorporating covariate information.
Statistical methods of fraud detection are often invoked in public debates on electoral integrity as was the case, for example, in the 2004 referendum in Venezuela (Weisbrot, Rosnick, and Tucker Reference Weisbrot, Rosnick and Tucker2004; Cordero and Márquez Reference Cordero and Márquez2006), in the 2009 presidential election in Iran (Mebane Reference Mebane2009; Berman and Rintoul Reference Berman and Rintoul2009), in the 2011 parliamentary elections in Russia (Gehlbach Reference Gehlbach2012; Mebane Reference Mebane2013), the 2014 parliamentary elections in Turkey (Meyersson Reference Meyersson2014), among others. These analyses suggest that depending on the political context, election fraud can be committed in diversely ingenious ways. To be able to detect various forms of fraud, it is essential to continuously expand the set of forensic tools and explore different features of election data that can be indicative of fraud.
I propose a method of fraud detection based on identification of irregular patterns in the distribution of party (or candidate) vote-shares across the polling stations. The method builds on an observation that in some allegedly fraudulent elections, there are many polling stations where the ruling party receives the percentage of votes that is evenly divisible by five – e.g., 50%, 65%, 75% (Klimek, Yegorov, Hanel, and Thurner Reference Klimek, Yegorov, Hanel and Thurner2012; Gehlbach Reference Gehlbach2012). Intuition would dictate that in large electorates, it is exceedingly unlikely for a party to receive exactly such a coarse vote-share across many precincts without some form of vote falsification.
I first consider whether the frequent occurrence of coarse vote-shares in election data is actually indicative of fraud. Using analytical results and simulations, I argue that whenever election data contain a large number of moderately sized electoral units (less than tens of thousands of voters), it is entirely expected that coarse vote-shares will occur relatively frequently. Thus, impressionistic judgements about incidence of fraud will inevitably result in false positive inference.
To avoid the false positive errors, I propose a systematic method to detect whether the observed distribution of vote-shares deviates from the hypothetical distribution we would expect to observe in elections without fraud. I refer to this method as the resampled kernel density method (RKD), since it draws inference by comparing the kernel density of the observed data against a sample of kernel densities drawn from the null distribution. I illustrate and evaluate this method with data from multiple elections in Russia and Canada as well as simulated data. Finally, I discuss how the proposed method differs from the digit-based methods to fraud detection (Mebane Reference Mebane, Alvarez, Thad E. and Susan D2008; Beber and Scacco Reference Beber and Scacco2012; Medzihorsky Reference Medzihorsky2015), and show that the two methods are designed to capture different types of fraud.
Although the main contribution of this paper is the new forensic method for detecting fraud, it also makes a wider normative point about the potential pitfalls of statistical fraud detection. It shows that completely clean election data can exhibit some highly irregular patterns, which could be easily mistaken for fraud if the data generating process is not carefully accounted for. Given the growing consensus in the empirical literature that allegations of election fraud often spark postelection violence (Tucker Reference Tucker2007; Collier Reference Collier2009; Daxecker Reference Daxecker2012), fraud-detection methods should put a particularly high weight on avoiding false positive errors.
2 A Motivating Example
To motivate the idea behind the method, consider the parliamentary elections in Russia held in December of 2011. The United Russia party, led by the incumbent president Vladimir Putin officially received 49.3 percent of votes and 64 percent of seats. Although the United Russia performed worse than expected, there were many indications that the election results were manipulated. Russian and Western analysts pointed out various “irregularities” in the official voting data: the distribution of votes was not bell-shaped, turnout rates and support for the United Russia were highly correlated, and in many precincts the United Russia party received a coarse proportion of votes. I focus on the latter feature.
The upper panel of Figure 1 shows the kernel density estimate of the vote-shares for the United Russia part in the 2011 parliamentary elections. The density shows very clear spikes of probability mass that peak at coarse vote-shares. This pattern is especially evident at the upper tail of the distribution where the United Russia received overwhelmingly high support (0.6, 0.75, 0.8). As has been suggested by some analysts (Klimek, Yegorov, Hanel, and Thurner Reference Klimek, Yegorov, Hanel and Thurner2012; Gehlbach Reference Gehlbach2012; Mebane Reference Mebane2013), these mass spikes appear so implausible that they should raise qualified suspicions of election results having been falsified in many precincts by rounding up the United Russia’s vote-shares. Remarkably, this statistical evidence of fraud was publicly displayed on posters during the protests that ensued shortly after the election.
Estimated density (Gaussian kernel, bandwidth
 $=$
0.0001) and the raw frequencies of the United Russia vote-shares in the 2011 elections.
$=$
0.0001) and the raw frequencies of the United Russia vote-shares in the 2011 elections.
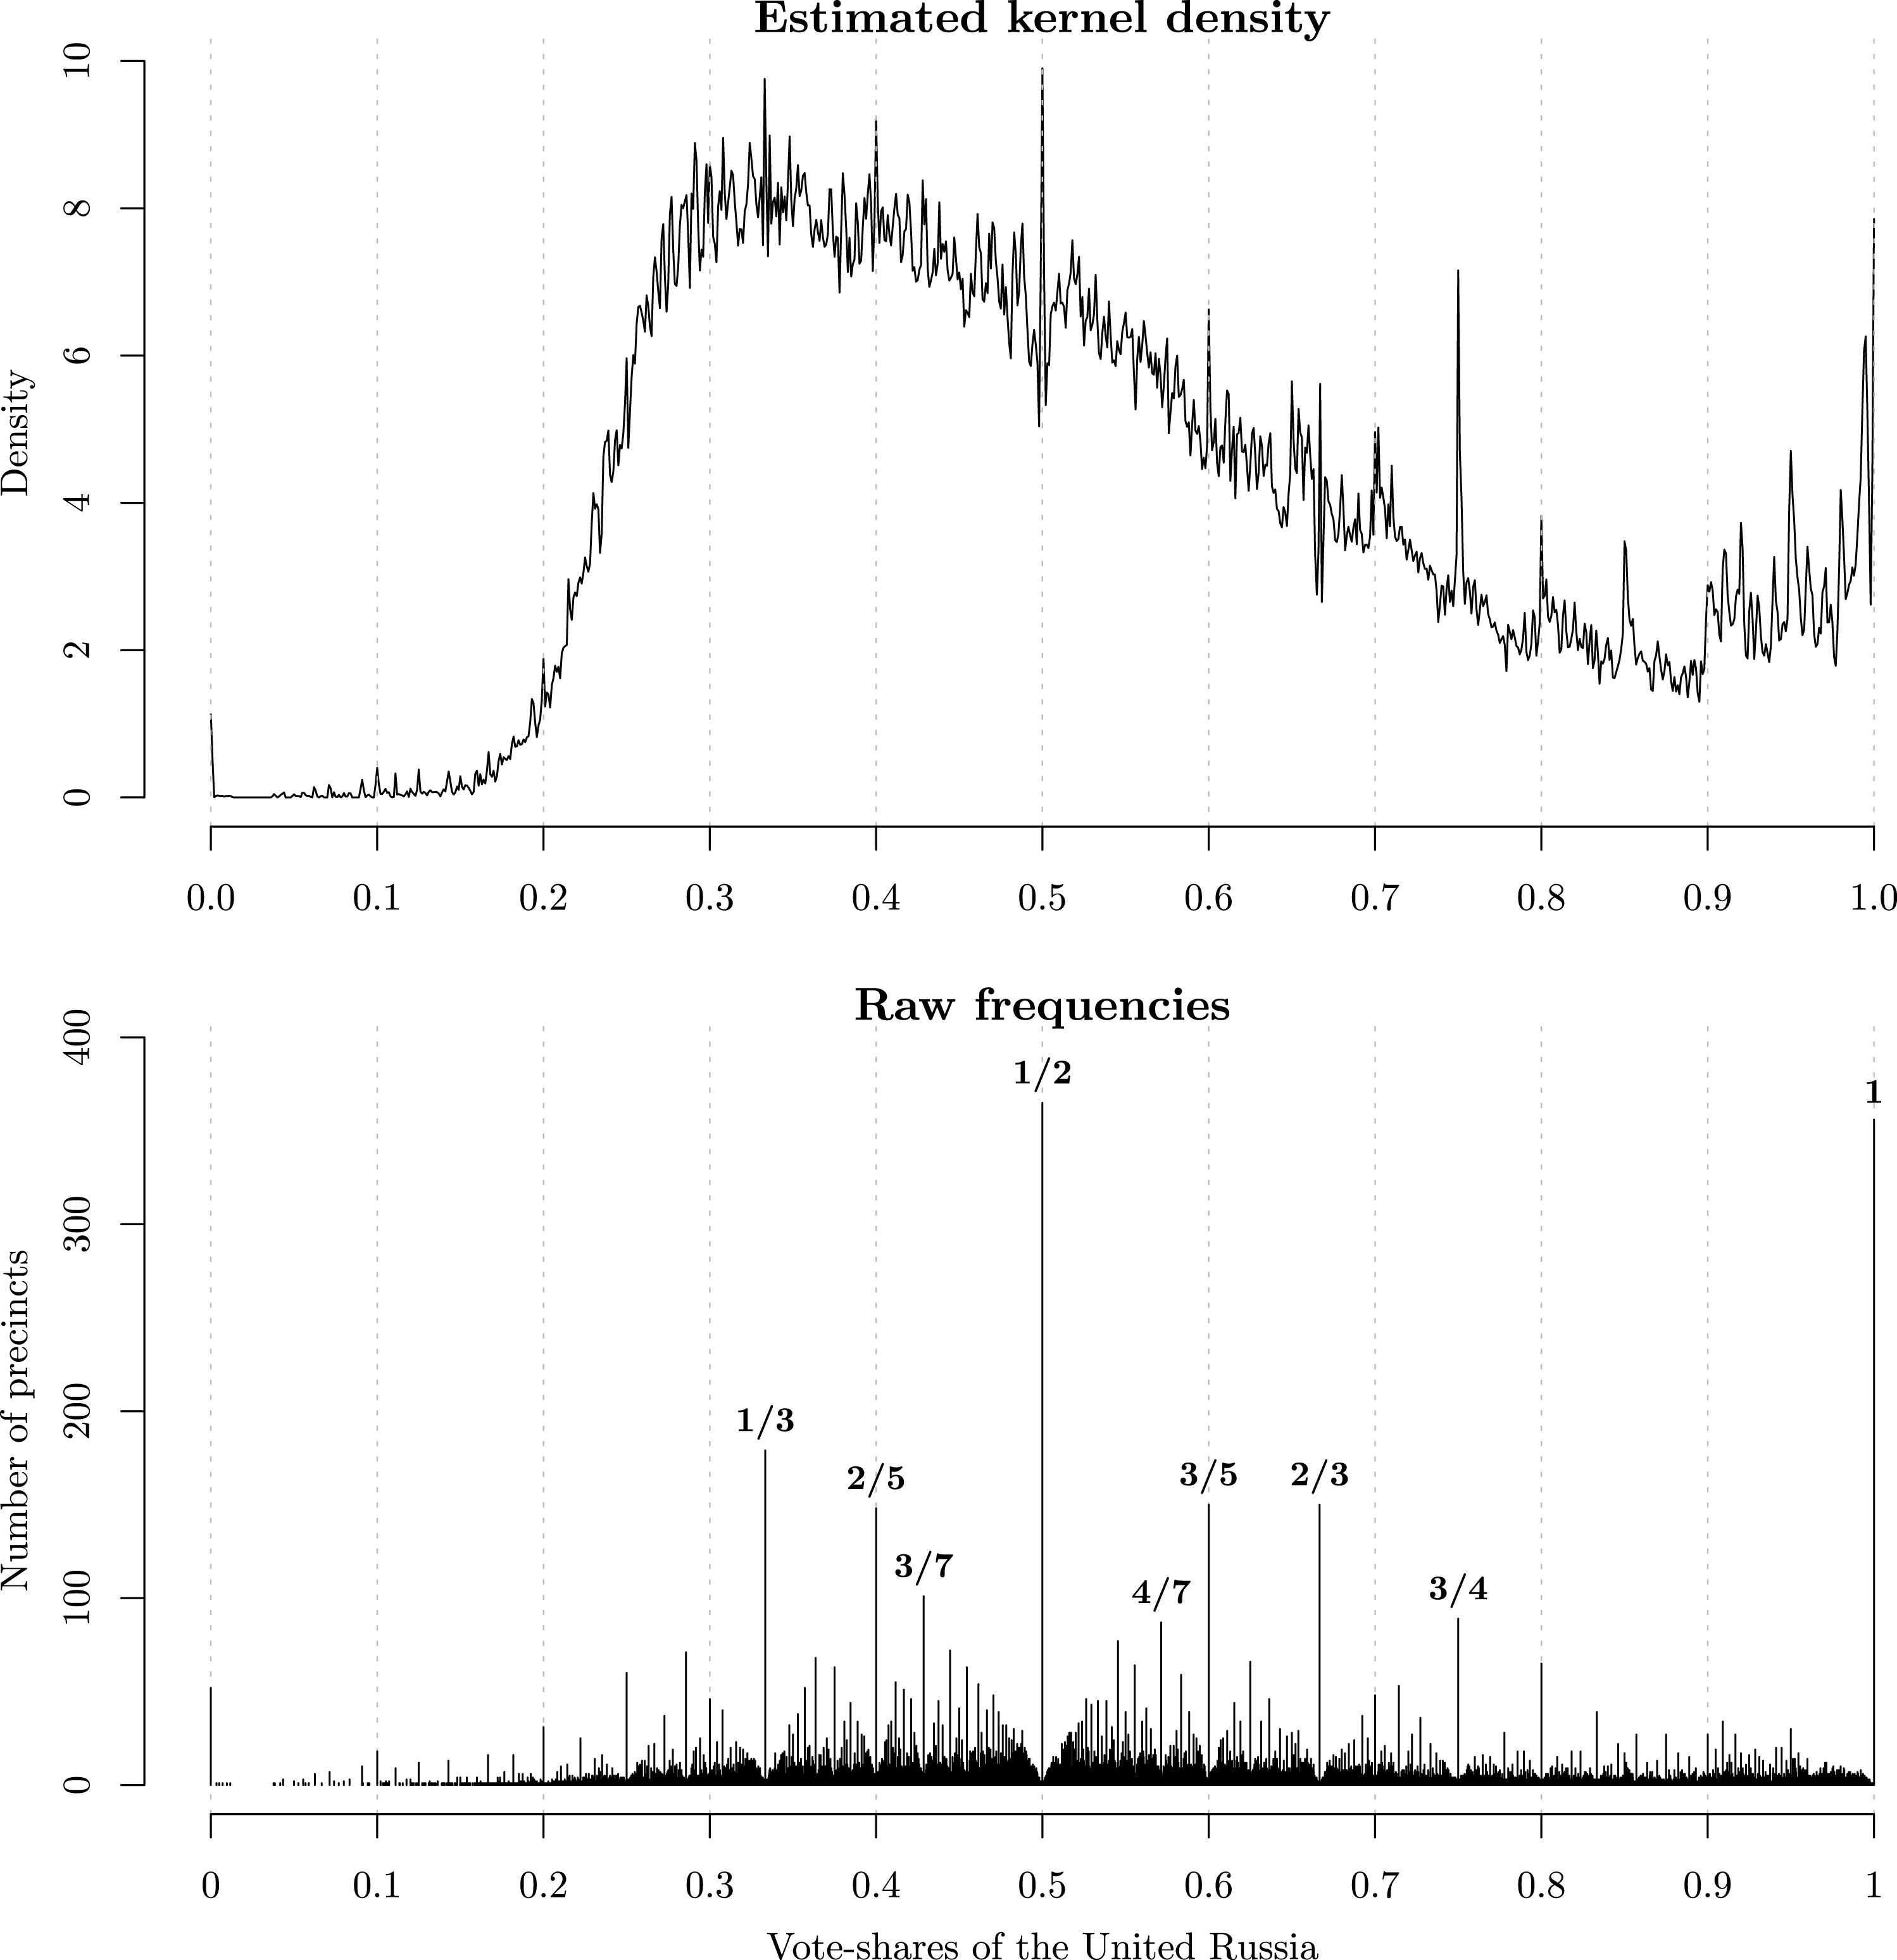
The lower panel in Figure 1 shows a different visualization of the same data. It displays the distribution of raw frequencies of each observed vote-share. The raw frequency plot makes it even clearer that election outcomes with exactly 50, 60, or 75 percent of votes occurred with significantly higher frequencies than other outcomes. Given that an average Russian electoral precinct has about 1000 registered voters, the high frequency of such coarse vote-shares indeed appears suspicious.
The idea that these peculiar patterns could be driven by falsification of results at the precinct level is sensible for at least two reasons. First, psychologists have documented a natural human tendency to use round numbers as reference points (Pope and Simonsohn Reference Pope and Simonsohn2011; Alter and Hershfield Reference Alter and Hershfield2014). If a party’s local agent wants to falsify election results, he is likely to choose some focal number indicating that a particular electoral benchmark (e.g., 60 percent) has been reached. Second, recent formal theories of election fraud argue that the government’s local agents may actually have incentives to signal their loyalty by falsifying election results in a detectable and conspicuous fashion (Rundlett and Svolik Reference Rundlett and Svolik2016). The fact the United Russia party has received exactly 55 or 70 percent of votes in so many precincts is consistent with this story of “loyalty signaling.”
Although both of these explanations are reasonable, one must also consider a simpler alternative that the seemingly irregular patterns in the vote-share data are not driven by fraud. In the next section, I argue that inferring fraud impressionistically from the presence of “spikes” in the distribution of vote-shares might result in a high rate of false positive errors – many elections are at risk of being judged as fraudulent even if they are clean.Footnote 2
3 Distribution of Vote-Shares Without Fraud
To understand why election data may frequently contain coarse vote-shares, it is important to recognize two facts about the nature of such data. First, contrary to what is almost universally assumed in empirical research, vote-shares are not continuous variables because they represent rational (hence, discrete) numbers. While in many applications this discrete nature of vote-shares might be of no consequence, it plays a key role in understanding why the distribution of vote-shares has visible mass spikes at certain “focal” numbers.
Second, note that the mass spikes in the distributions of vote-shares do not necessarily occur at numbers that are integral multiples of five (e.g., 0.5, 0.55), but at specific fractions with low denominators. As we see in Figure 1, some of the very common spikes (e.g., at 1/3 or 2/3) are not located at vote-shares that are integral multiples of five. Instead, the integral multiples of five can be expressed as fractions with a low denominator. Thus, explaining why the distributions of vote-shares have spikes at some focal numbers requires explaining why vote-share data may have many fractions with a low denominator.
For brevity, I use the term “low-order fraction” to refer to a vote-share that can be expressed as an irreducible fraction with a ‘small’ denominator. In contrast, I refer to a vote-share which can be expressed only as an irreducible fraction with a large denominator as a “high-order fraction.” For example, 500/1000 is a low-order fraction as it can be expressed as an irreducible fraction 1/2 (the lowest-order fraction), whereas 98/200 is a higher-order fraction because it can only be reduced to a fraction 49/100.
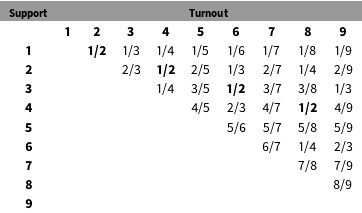
To see the basic intuition of why low-order fractions can be quite frequent even in clean election data, consider the following unrealistic but helpful example. Suppose the electorate consists of nine voters. Table 1 shows all possible voting outcomes in such an electorate (for brevity, and without loss of generality, I exclude the cases where the party received zero votes or all votes). The lowest-order fraction 1/2 appears most frequently in the matrix of results, whereas higher-order fractions appear less often. The reason for this pattern is simple: in an electorate with nine voters, the outcome 1/2 can occur in four different scenarios (when turnout is equal to 2, 4, 6, and 8), whereas higher-order fractions occur in fewer scenarios.
Possible vote-fractions outcomes in a small electorate.
More generally, in an electorate with
 $n$
voters, the number of election outcomes (combinations of turnout and support) that yield a vote-share with the denominator
$n$
voters, the number of election outcomes (combinations of turnout and support) that yield a vote-share with the denominator
 $m$
is equal to
$m$
is equal to
 $\lfloor n/m\rfloor$
, where
$\lfloor n/m\rfloor$
, where
 $\lfloor x\rfloor$
denotes the largest integer smaller than
$\lfloor x\rfloor$
denotes the largest integer smaller than
 $x$
(see Supplementary Appendix A for derivation). Evidently, the number of election outcomes that yield a high-order vote-share is strictly decreasing in
$x$
(see Supplementary Appendix A for derivation). Evidently, the number of election outcomes that yield a high-order vote-share is strictly decreasing in
 $m$
, which is why low-order fractions are expected to appear relatively frequently in voting data even in large electorates. In an electorate of one thousand voters, it is far more surprising for a party to receive 63.9 percent of votes than exactly 50 percent of votes because the only way it can actually receive 63.9 of votes is if all voters turnout to vote and the party receives exactly 639 votes. In contrast, there are five hundred ways the party can receive exactly 50 percent of votes (
$m$
, which is why low-order fractions are expected to appear relatively frequently in voting data even in large electorates. In an electorate of one thousand voters, it is far more surprising for a party to receive 63.9 percent of votes than exactly 50 percent of votes because the only way it can actually receive 63.9 of votes is if all voters turnout to vote and the party receives exactly 639 votes. In contrast, there are five hundred ways the party can receive exactly 50 percent of votes (
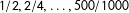 $1/2,2/4,\ldots ,500/1000$
) in such precinct.
$1/2,2/4,\ldots ,500/1000$
) in such precinct.
Of course, the likelihood with which low-order vote-shares occur depends not only on the number of outcomes that yield such vote-shares (combinations of turnout and support), but also on the joint probability distribution of turnout and support. For a more formal treatment, let
 $T\in \{1,\ldots ,n\}$
denote the random variable representing the turnout, and let
$T\in \{1,\ldots ,n\}$
denote the random variable representing the turnout, and let
 $t$
represent the realized turnout. Let
$t$
represent the realized turnout. Let
 $V\in \{0,\ldots ,t\}$
denote the number of people who support the party at the ballot box, with
$V\in \{0,\ldots ,t\}$
denote the number of people who support the party at the ballot box, with
 $v$
representing its realized value. Let
$v$
representing its realized value. Let
 ${\mathcal{G}}=\{(T,V)~|~V\leqslant T\}$
denote the sample space of all possible election outcomes. Let
${\mathcal{G}}=\{(T,V)~|~V\leqslant T\}$
denote the sample space of all possible election outcomes. Let
 $R=V/T$
denote the random variable representing the vote-shares of the party. Finally, let
$R=V/T$
denote the random variable representing the vote-shares of the party. Finally, let
 $\Pr \{T=t,V=v\}$
be the joint probability mass function (PMF) of turnout and support. I refer to the PMF’s of the random variables
$\Pr \{T=t,V=v\}$
be the joint probability mass function (PMF) of turnout and support. I refer to the PMF’s of the random variables
 $T$
and
$T$
and
 $V$
as “generative distributions.” The probability that
$V$
as “generative distributions.” The probability that
 $R$
takes a value
$R$
takes a value
 $k/m$
is given by
$k/m$
is given by
 $$\begin{eqnarray}\displaystyle & \displaystyle \Pr \left\{R=\frac{k}{m}\right\}=\displaystyle \mathop{\sum }_{a=1}^{\lfloor n/m\rfloor }\Pr \left\{V=a\cdot k,T=a\cdot m\right\}. & \displaystyle\end{eqnarray}$$
For heuristic reasons, it is useful to briefly consider the most tractable (though not the most realistic) case where the variables
 $T$
and
$T$
and
 $V$
are distributed jointly uniformly so that
$V$
are distributed jointly uniformly so that
 $\Pr \{T=t,V=v\}=1/|{\mathcal{G}}|$
for all
$\Pr \{T=t,V=v\}=1/|{\mathcal{G}}|$
for all
 $(t,v)\in {\mathcal{G}}$
. In this case, we have
$(t,v)\in {\mathcal{G}}$
. In this case, we have
 $$\begin{eqnarray}\displaystyle & \displaystyle \Pr \left\{R=\frac{k}{m}\right\}={\displaystyle \frac{2\lfloor n/m\rfloor }{n(n+1)}}, & \displaystyle\end{eqnarray}$$
(see Supplementary Appendix A for the proof). Hence, for any given number of voters
 $n$
, the probability of an irreducible fraction
$n$
, the probability of an irreducible fraction
 $k/m$
decreases in
$k/m$
decreases in
 $m$
– low-order fractions are expected to occur with a greater likelihood than high-order fractions even in a large electorate. As the number of voters (
$m$
– low-order fractions are expected to occur with a greater likelihood than high-order fractions even in a large electorate. As the number of voters (
 $n$
) increases, the probability of observing any given vote-share
$n$
) increases, the probability of observing any given vote-share
 $k/m$
diminishes, but the relative probability of a low- vs high-order fraction remains large.
$k/m$
diminishes, but the relative probability of a low- vs high-order fraction remains large.
The same strong patterns where the probability of a fraction is monotonically decreasing in its denominator will not hold for all generative distributions. For instance, if the joint distribution of
 $(V,T)$
is such that
$(V,T)$
is such that
 $\Pr (V>T/2)=1$
for all
$\Pr (V>T/2)=1$
for all
 $T$
, then 1/2 will not be the most frequent vote-share, in contrast to the joint uniform case. However, a weaker version of the same pattern will hold for most generative distributions that we can realistically encounter: the PMF of vote-shares will exhibit relatively large mass points at low-order fractions that are “significantly” covered by the PMF.
$T$
, then 1/2 will not be the most frequent vote-share, in contrast to the joint uniform case. However, a weaker version of the same pattern will hold for most generative distributions that we can realistically encounter: the PMF of vote-shares will exhibit relatively large mass points at low-order fractions that are “significantly” covered by the PMF.
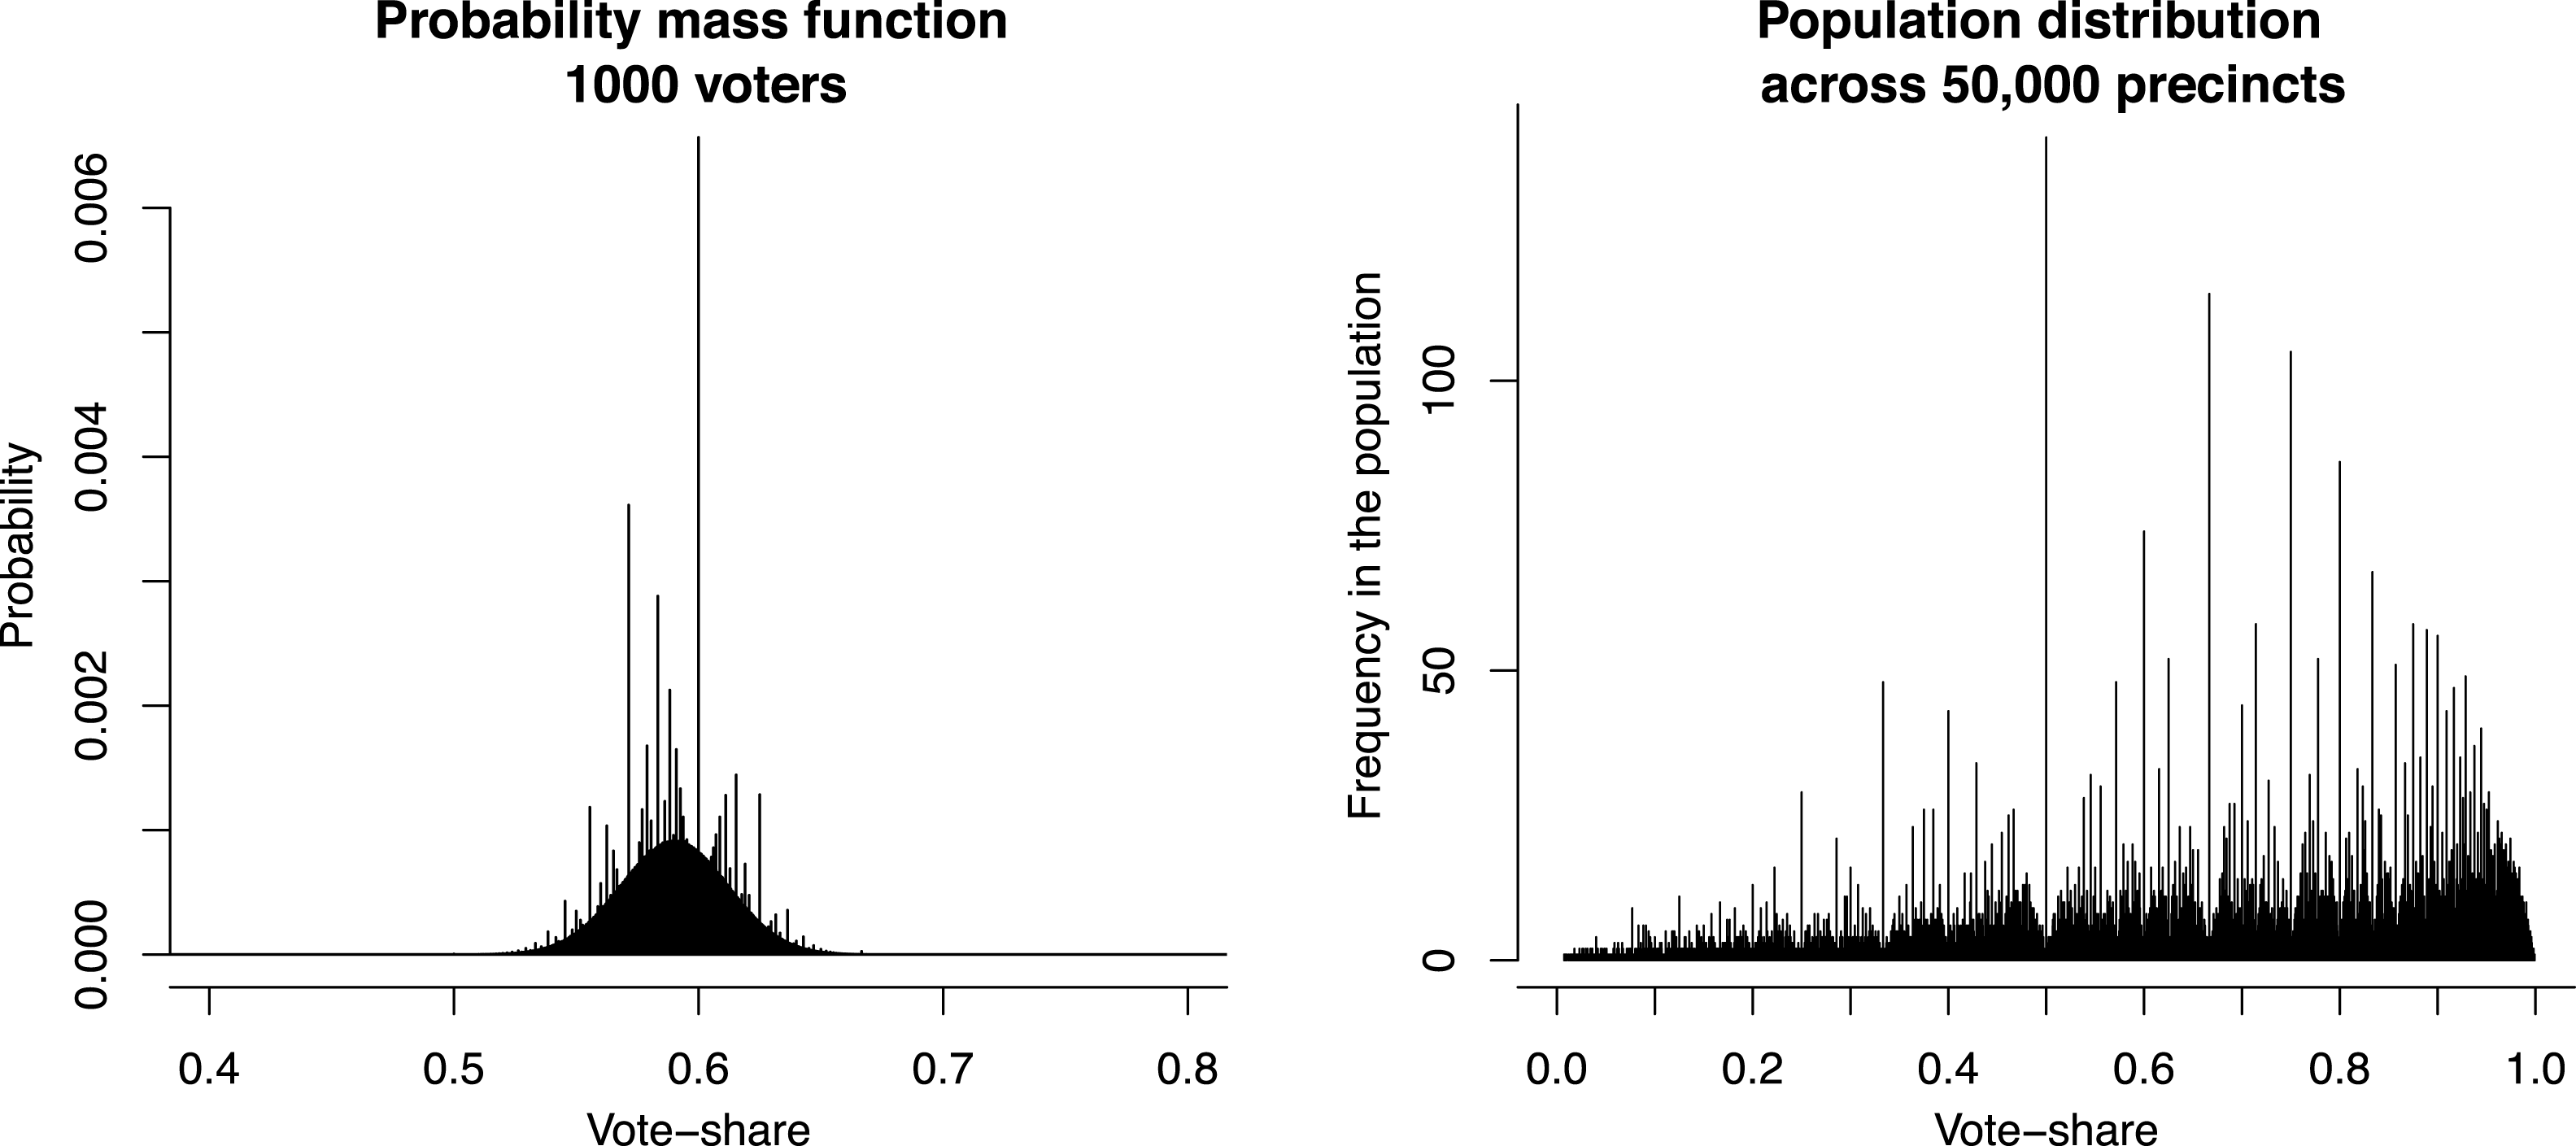
The left panel of Figure 2 illustrates this point. It shows the PMF of vote-shares derived from the generative model where
 $T\sim \text{Binomial}(1000,0.5)$
and
$T\sim \text{Binomial}(1000,0.5)$
and
 $V|T\sim \text{Binomial}(T,0.59)$
. Most of the probability mass in this function is concentrated in the interval between 0.55 and 0.65 and so 1/2 is not significantly covered by the PMF, which is the reason why there is no mass spike at 1/2. However, another low-order fraction (3/5) is significantly covered by the PMF. Accordingly, there is a large spike of mass at 3/5 and other low-order fractions that are covered by this PMF.
$V|T\sim \text{Binomial}(T,0.59)$
. Most of the probability mass in this function is concentrated in the interval between 0.55 and 0.65 and so 1/2 is not significantly covered by the PMF, which is the reason why there is no mass spike at 1/2. However, another low-order fraction (3/5) is significantly covered by the PMF. Accordingly, there is a large spike of mass at 3/5 and other low-order fractions that are covered by this PMF.
Precinct-level PMF of vote-shares from the binomial generative model (left) and the resulting population-level distribution of vote-shares across 50,000 precincts (right).
The vote-shares tend to cluster at low-order fractions even if the expected vote-share in a given precinct is not a low-order fraction. Given the above generative model, the probability of receiving exactly 60 percent of votes in a precinct of 1000 voters is
 $$\begin{eqnarray}\displaystyle \Pr \left\{R=0.6\right\} & = & \displaystyle \displaystyle \mathop{\sum }_{t\in \{5,10,\ldots ,1000\}}\Pr \{V=0.6t|T=t\}\Pr (T=t)\nonumber\\ \displaystyle & = & \displaystyle \displaystyle \mathop{\sum }_{t\in \{5,10,\ldots ,1000\}}\binom{t}{0.6t}0.59^{0.6t}0.41^{0.4t}\binom{1000}{t}0.5^{t}0.5^{n-t}=0.007.\nonumber\end{eqnarray}$$
By comparison, the probability that the party receives 59 percent of votes is about 7 times smaller:
 $$\begin{eqnarray}\displaystyle \Pr \{R=0.59\}=\mathop{\sum }_{t\in \{100,200,\ldots ,1000\}}\Pr \{V=0.59t|T=t\}\Pr \{T=t\}=0.0009.\end{eqnarray}$$
Hence, a low-order fraction is more likely to occur relative to a nearby higher-order fraction, even if the high-order fraction is the expected value of the random variable.
The argument so far explains why low-order fractions are likely to occur if we take a draw from the PMF of vote-shares in a single precinct. However, real life data do not represent multiple draws of vote-shares from the same precinct, but a collection of single draws of vote-shares from a population of precincts, each with its own data generating model. More formally, let
 $N$
represent the number of precincts, let
$N$
represent the number of precincts, let
 $\{t_{i}\}_{i=1}^{N}$
be the sample of turnout from each precinct, and let
$\{t_{i}\}_{i=1}^{N}$
be the sample of turnout from each precinct, and let
 $\{v_{i}\}_{i=1}^{N}$
be the sample of supporting votes from each precinct. Accordingly,
$\{v_{i}\}_{i=1}^{N}$
be the sample of supporting votes from each precinct. Accordingly,
 $\boldsymbol{r}=(v_{1}/t_{1},\ldots ,v_{N}/t_{N})$
represents the realized population-level sample of vote-shares.
$\boldsymbol{r}=(v_{1}/t_{1},\ldots ,v_{N}/t_{N})$
represents the realized population-level sample of vote-shares.
Interestingly, the population-level distribution of vote-shares exhibits even more pronounced spikes of probability mass than each individual precinct-level PMF of vote-shares. First, if low-order fractions are likely to occur under each individual PMF, then they will also be likely to occur in a population of such PMF’s. Second, and more importantly, the population-level distribution of vote-shares will typically have a much wider coverage (if there is heterogeneity across precincts) than each individual PMF. In sum, this will lead to a pattern where a sample of vote-shares from a cross-section of precincts will exhibit large spikes of probability mass.
This is illustrated in the right panel of Figure 2 showing a population-level sample of vote-shares. Here, I assume that there
 $N=50,000$
precincts, that the precinct sizes
$N=50,000$
precincts, that the precinct sizes
 $\{n_{i}\}_{i=1}^{N}$
are drawn independently from the discrete uniform distribution on
$\{n_{i}\}_{i=1}^{N}$
are drawn independently from the discrete uniform distribution on
 $\{500,\ldots ,1500\}$
, and the turnout rates
$\{500,\ldots ,1500\}$
, and the turnout rates
 $\{t_{i}^{\ast }\}_{i=1}^{N}$
and the support rates
$\{t_{i}^{\ast }\}_{i=1}^{N}$
and the support rates
 $\{v_{i}^{\ast }\}_{i=1}^{N}$
were each drawn from beta distributions
$\{v_{i}^{\ast }\}_{i=1}^{N}$
were each drawn from beta distributions
 $\text{Beta}~(2,2)$
and
$\text{Beta}~(2,2)$
and
 $\text{Beta}~(2,1)$
, respectively. Under this model, the PMF of each individual precinct looks similar to that in the left panel of the Figure 2 (only each located at different mean) and has few mass spikes, but the population-level distribution shows much more pronounced spikes.
$\text{Beta}~(2,1)$
, respectively. Under this model, the PMF of each individual precinct looks similar to that in the left panel of the Figure 2 (only each located at different mean) and has few mass spikes, but the population-level distribution shows much more pronounced spikes.
The degree to which population-level distribution of vote-shares will exhibit mass spikes depends on the properties of the data generating process in each individual precinct. The two key properties are the size of the precinct and the degree of over-dispersion in turnout and support at the level of each precinct. As the size of the precinct increases, the PMF of vote-share becomes less spiky, but this happens at a very low rate if the data generating process is over-dispersed.
Figure 3 shows how the likelihood of low- vs high-order fractions changes with the size of voting population and over-dispersion. The figure compares the binomial (under-dispersed) and beta-binomial (over-dispersed) generative models, in both cases assuming that the expected turnout rate is 0.5 and the expected support rate is 0.59. The two curves represent the log-ratio of probabilities
 $\Pr \{R=0.5\}$
vs
$\Pr \{R=0.5\}$
vs
 $\Pr \{R=0.59\}$
as the size of the precinct increases. In both cases, the ratio is significantly larger than zero, indicating that the low-order fraction is more likely than the high-order fraction. The ratio decreases nonmonotonically in
$\Pr \{R=0.59\}$
as the size of the precinct increases. In both cases, the ratio is significantly larger than zero, indicating that the low-order fraction is more likely than the high-order fraction. The ratio decreases nonmonotonically in
 $n$
, but very slowly: even with 5,000 voters the probability of the event
$n$
, but very slowly: even with 5,000 voters the probability of the event
 $\{R=0.6\}$
is ten (in the binomial model) and seventeen (in the beta-binomial model) times larger than that of
$\{R=0.6\}$
is ten (in the binomial model) and seventeen (in the beta-binomial model) times larger than that of
 $\{R=0.59\}$
despite the fact that the expected value of
$\{R=0.59\}$
despite the fact that the expected value of
 $R$
is 0.59.
$R$
is 0.59.
Number of voters and the relative probability of party receiving 60 versus 59 percent of votes when its expected support is 59 percent.
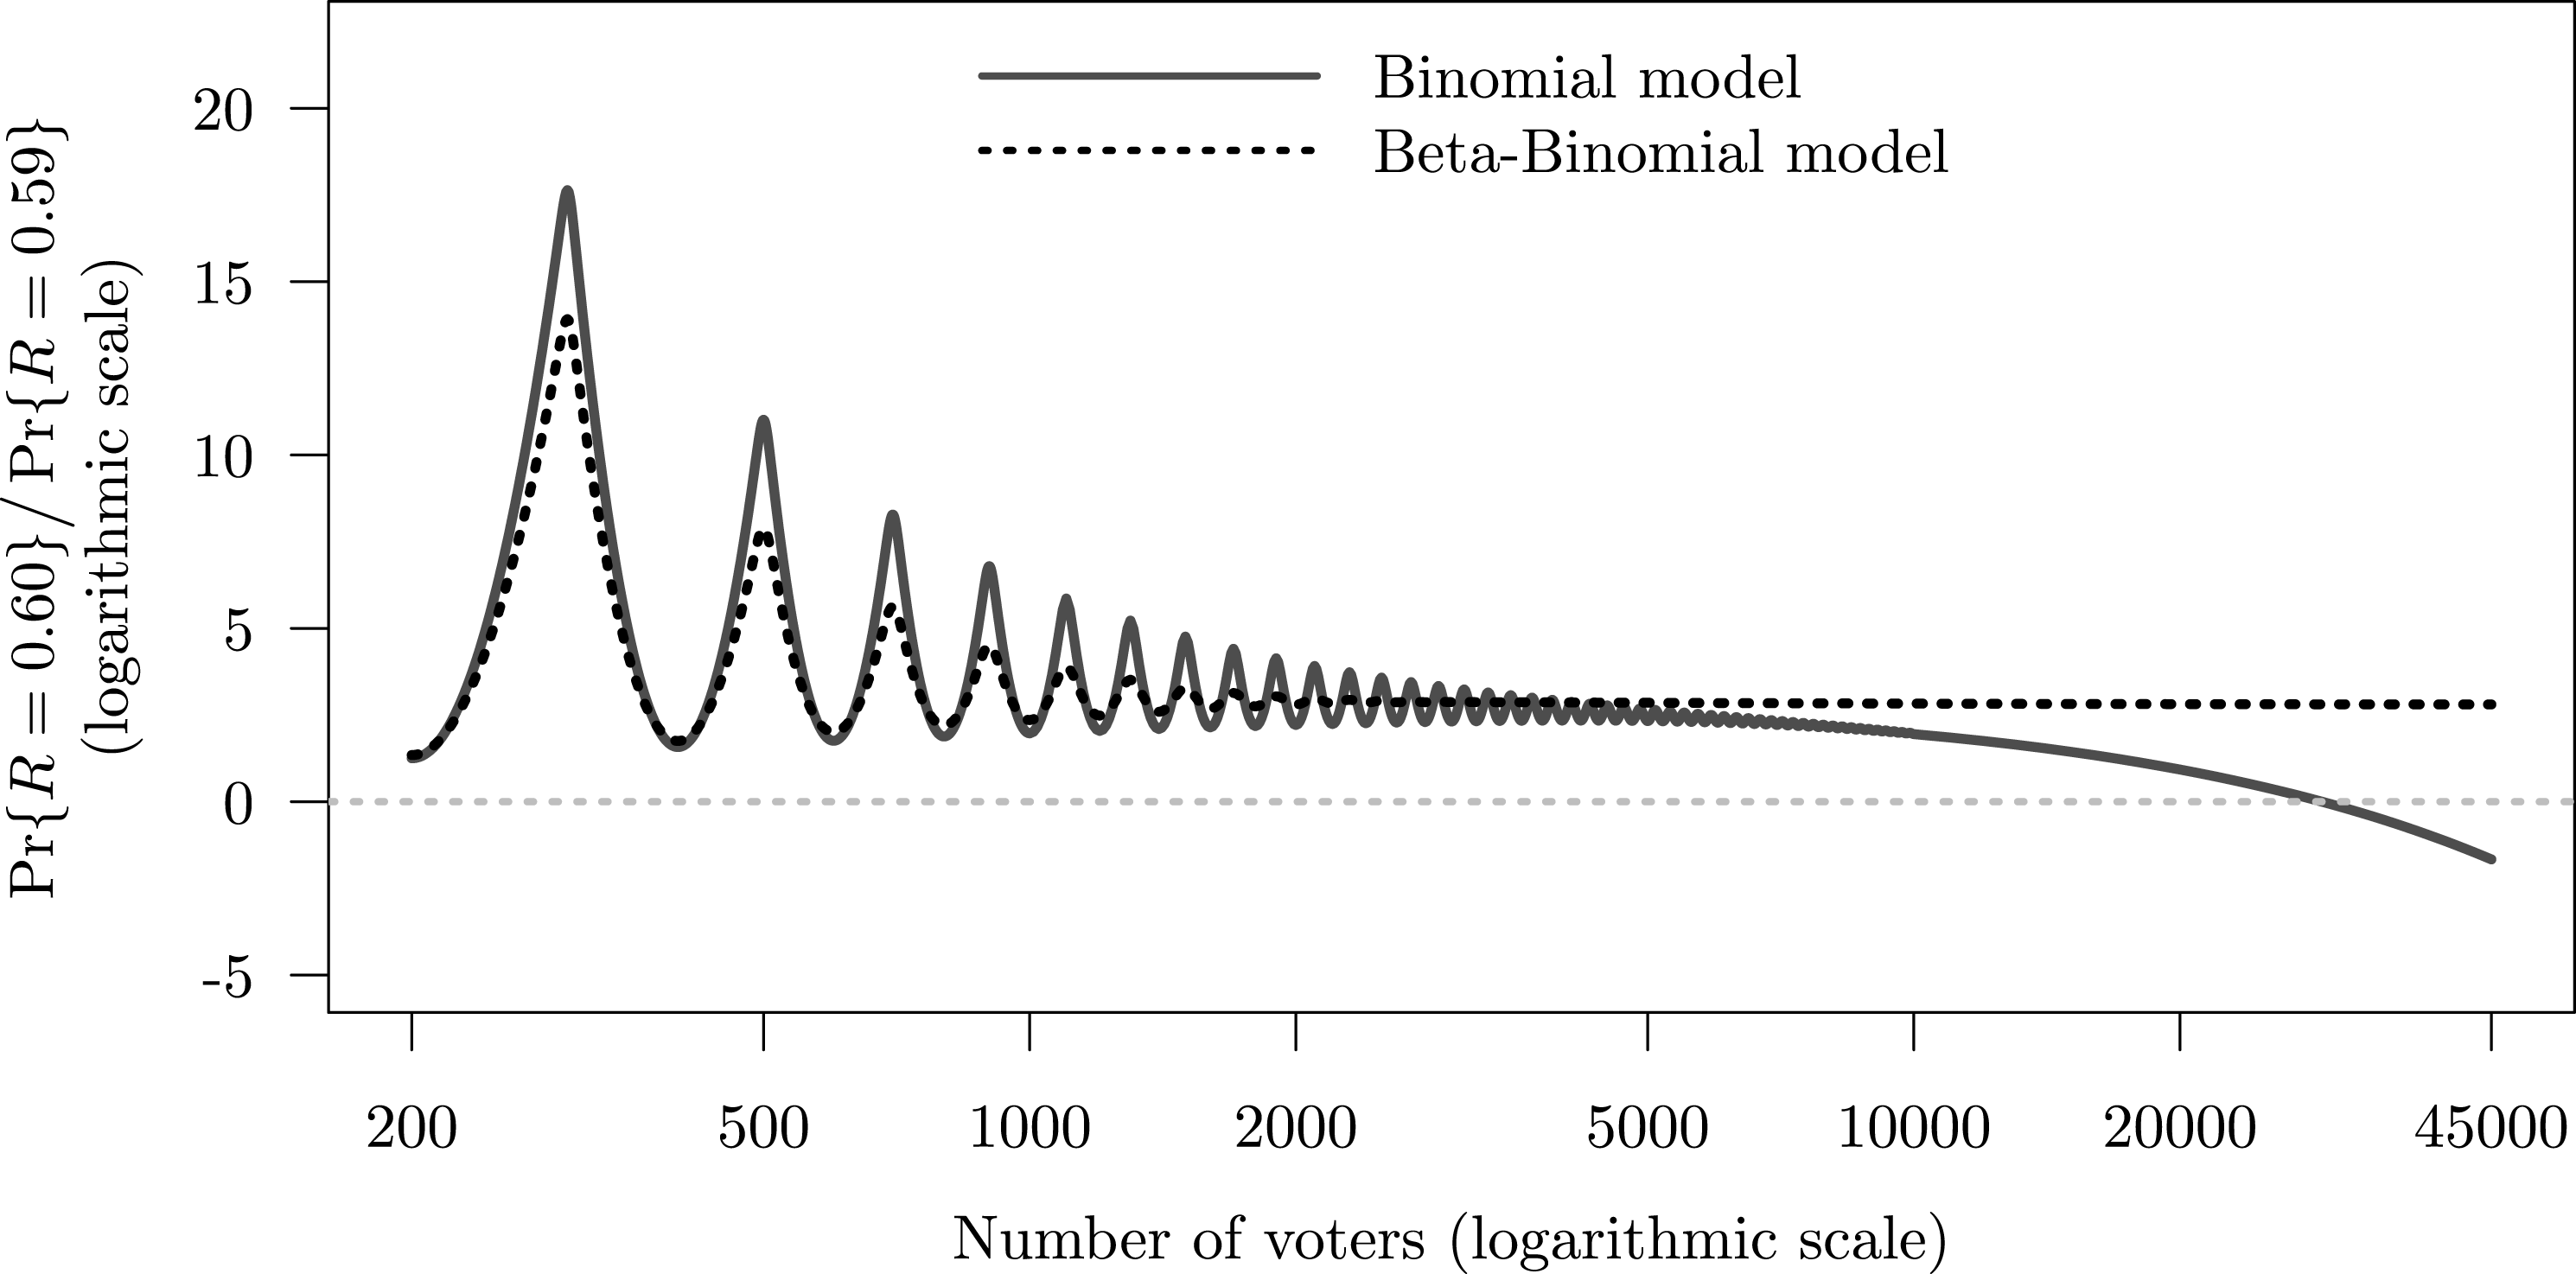
Under the binomial model, the log-ratio crosses the zero line (at which point the probability of the event
 $R=0.6$
becomes smaller than the probability of the event
$R=0.6$
becomes smaller than the probability of the event
 $R=0.59$
), when the precinct has about 33,000 voters. Under the beta-binomial model, due to over-dispersion, the log-ratio of the probabilities decreases at an extremely low rate and does not reach zero even with 500,000 voters. In conclusion, in moderately sized electoral units, we can expect vote-shares to have mass spikes at low-order fractions under a variety of distributional assumptions. When electoral units are very large (e.g., Congressional districts in the United States), we should not expect to see mass spikes in the distribution of vote-shares unless we strongly believe that turnout and support levels are highly over-dispersed.
$R=0.59$
), when the precinct has about 33,000 voters. Under the beta-binomial model, due to over-dispersion, the log-ratio of the probabilities decreases at an extremely low rate and does not reach zero even with 500,000 voters. In conclusion, in moderately sized electoral units, we can expect vote-shares to have mass spikes at low-order fractions under a variety of distributional assumptions. When electoral units are very large (e.g., Congressional districts in the United States), we should not expect to see mass spikes in the distribution of vote-shares unless we strongly believe that turnout and support levels are highly over-dispersed.
In Supplementary Appendix B, I show the PMF’s of vote-shares for a number of alternative generative models— conditionally uniform, beta-binomial, hypergeometric. The distributions of vote-shares follow the same pattern as the binomial model shown in Figure 2: they each exhibit large mass points at low-order fractions that are significantly covered by the PMF. Consistent with the above analysis, the examples also clearly indicated that the degree of spikiness in the PMF’s directly depends on the over-dispersion in the generative models: when the generative distributions are not over-dispersed (binomial or hypergeometric), the mass spikes are less pronounced compared to when they are over-dispersed (conditionally uniform or beta-binomial). As over-dispersion of the generative distributions increase, the coverage of the resulting PMF’s of the vote-shares widens, leading to more numerous and more sizable probability mass spikes.Footnote 3
In sum, a sample of vote-shares from a set of precincts is likely to exhibit noticeable spikes of probability at low-order fractions in a wide set of conditions: (1) when the voting population in each electoral unit is not too large, (2) when there is variability (over-dispersion) in voting patterns within each electoral unit, and (3) when there is variability in turnout and support rates across electoral units. When at least some of these conditions hold, vote-share data will likely show pronounced mass spikes at coarse proportions due to simple numeric laws. Judging impressionistically elections as fraudulent based on the presence of spikes in the histogram or the kernel density of vote-share data risks flawed inference.
However, this argument does not in any way imply that all mass spikes we observe in a given dataset are necessarily the artifacts of these numeric laws. The next section develops a systematic way to measure whether the irregularities in the election data are due to the numeric laws or (possibly) fraud.
4 Resampled Kernel Density Method
The resampled kernel density method (RKD) detects fraud by comparing the kernel density of the observed vote-shares against a sample of kernel densities drawn from the null distribution of vote-shares. I build upon the following stochastic model of elections:
 $$\begin{eqnarray}\displaystyle t_{i}^{\ast } & {\sim} & \displaystyle P_{t^{\ast }},\end{eqnarray}$$
 $$\begin{eqnarray}\displaystyle T_{i}|t_{i}^{\ast } & {\sim} & \displaystyle \text{Binomial}(n_{i},t_{i}^{\ast }),\end{eqnarray}$$
 $$\begin{eqnarray}\displaystyle v_{i}^{\ast } & {\sim} & \displaystyle P_{v^{\ast }},\end{eqnarray}$$
 $$\begin{eqnarray}\displaystyle V_{i}|t_{i},v_{i}^{\ast } & {\sim} & \displaystyle \text{Binomial}(t_{i},v_{i}^{\ast }),\end{eqnarray}$$
for each precinct
 $i=1,\ldots N$
. The turnout
$i=1,\ldots N$
. The turnout
 $T_{i}$
is a binomial draw from the population of size
$T_{i}$
is a binomial draw from the population of size
 $n_{i}$
(the number of registered voters in precinct
$n_{i}$
(the number of registered voters in precinct
 $i$
) with the precinct-specific success probability
$i$
) with the precinct-specific success probability
 $t_{i}^{\ast }$
. The number of people who vote for the ruling party is also a binomial draw from the population of size
$t_{i}^{\ast }$
. The number of people who vote for the ruling party is also a binomial draw from the population of size
 $t_{i}$
(the realized value of
$t_{i}$
(the realized value of
 $T_{i}$
) with the success probability
$T_{i}$
) with the success probability
 $v_{i}^{\ast }$
. The functions
$v_{i}^{\ast }$
. The functions
 $P_{t^{\ast }}$
and
$P_{t^{\ast }}$
and
 $P_{v^{\ast }}$
represent the unknown population-level distributions of precinct-level turnout rates and support rates, respectively.
$P_{v^{\ast }}$
represent the unknown population-level distributions of precinct-level turnout rates and support rates, respectively.
The key assumption behind the RKD method is that
 $P_{t^{\ast }}$
and
$P_{t^{\ast }}$
and
 $P_{v^{\ast }}$
are both continuous distributions without any mass points. The continuity assumption simply rules out the possibility that a country contains many precincts with exactly the same, let alone coarse, latent turnout rates and support rates. The assumption is highly reasonable because we should not expect a country to contain many precincts where the latent support for a party is exactly 50 or 65 percent.
$P_{v^{\ast }}$
are both continuous distributions without any mass points. The continuity assumption simply rules out the possibility that a country contains many precincts with exactly the same, let alone coarse, latent turnout rates and support rates. The assumption is highly reasonable because we should not expect a country to contain many precincts where the latent support for a party is exactly 50 or 65 percent.
Even though the latent turnout and support rates are distributed continuously across the precincts, the vote-shares sampled from each precinct will exhibit large mass points at some lower-order fractions for the reasons given in the earlier section. The distribution of vote-shares generated from the stochastic process in equations (3)–(6) can serve as a benchmark as to how often certain vote-shares are expected to occur in clean elections. Under the null hypothesis of no fraud, the size of these mass points in the resampled data should be similar to that in the observed data. However, substantial differences between the number and size of probability mass spikes between the observed data and the data resampled from the generative model in (3)–(6) would indicate fraud.
To compare the observed data with the samples from the above generative model, we need to estimate the distributions
 $P_{t^{\ast }}$
and
$P_{t^{\ast }}$
and
 $P_{v^{\ast }}$
, from which the variables
$P_{v^{\ast }}$
, from which the variables
 $\{\unicode[STIX]{x1D70F}_{i}^{\ast }\}_{i=1}^{N}$
and
$\{\unicode[STIX]{x1D70F}_{i}^{\ast }\}_{i=1}^{N}$
and
 $\{v_{i}^{\ast }\}_{i=1}^{N}$
are drawn. To approximate the unknown densities
$\{v_{i}^{\ast }\}_{i=1}^{N}$
are drawn. To approximate the unknown densities
 $P_{t^{\ast }}$
and
$P_{t^{\ast }}$
and
 $P_{v^{\ast }}$
, I use the finite mixture of beta distributions:
$P_{v^{\ast }}$
, I use the finite mixture of beta distributions:
 $$\begin{eqnarray}\displaystyle t_{i}^{\ast } & {\sim} & \displaystyle \displaystyle \mathop{\sum }_{\ell =1}^{L_{t}}\unicode[STIX]{x1D70B}_{\ell }\text{Beta}\left(\boldsymbol{\unicode[STIX]{x1D703}}_{\ell }^{(t)}\right)\end{eqnarray}$$
 $$\begin{eqnarray}\displaystyle v_{i}^{\ast } & {\sim} & \displaystyle \displaystyle \mathop{\sum }_{\ell =1}^{L_{v}}\unicode[STIX]{x1D70B}_{\ell }\text{Beta}\left(\boldsymbol{\unicode[STIX]{x1D703}}_{\ell }^{(v)}\right),\end{eqnarray}$$
where
 $\boldsymbol{\unicode[STIX]{x1D703}}_{\ell }=\big(\unicode[STIX]{x1D703}_{1,\ell },\unicode[STIX]{x1D703}_{2,\ell }\big)$
are the two shape parameters of the beta distributions for the mixture component
$\boldsymbol{\unicode[STIX]{x1D703}}_{\ell }=\big(\unicode[STIX]{x1D703}_{1,\ell },\unicode[STIX]{x1D703}_{2,\ell }\big)$
are the two shape parameters of the beta distributions for the mixture component
 $\ell$
. Since the latent turnout and support rates are contained in the unit interval, we cannot use the more common Gaussian mixtures model to estimate densities
$\ell$
. Since the latent turnout and support rates are contained in the unit interval, we cannot use the more common Gaussian mixtures model to estimate densities
 $P_{t^{\ast }}$
and
$P_{t^{\ast }}$
and
 $P_{v^{\ast }}$
. A simpler approach would be to fit the standard beta model by setting
$P_{v^{\ast }}$
. A simpler approach would be to fit the standard beta model by setting
 $L_{t}=L_{k}=1$
(this would imply that
$L_{t}=L_{k}=1$
(this would imply that
 $T_{i}$
’s and
$T_{i}$
’s and
 $V_{i}$
’s each, marginally, follow the beta-binomial distribution). However, since real election data often have multiple interior modes, the standard beta distribution fits these data very poorly. Instead, the mixture beta model allows to approximate the distributions of latent support very flexibly without sacrificing continuity.
$V_{i}$
’s each, marginally, follow the beta-binomial distribution). However, since real election data often have multiple interior modes, the standard beta distribution fits these data very poorly. Instead, the mixture beta model allows to approximate the distributions of latent support very flexibly without sacrificing continuity.
The resampled kernel density algorithm (RKD) proceeds in the following steps:
1. Estimate the smooth distributions
 $P_{t^{\ast }}$
and
$P_{v^{\ast }}$
.
$P_{t^{\ast }}$
and
$P_{v^{\ast }}$
.2. Iterate the following steps
$M$
times:(a) sample
$\big\{t_{i}^{\ast }\big\}_{i=1}^{N}\sim \hat{P}_{t^{\ast }}$
and
$\big\{v_{i}^{\ast }\big\}_{i=1}^{N}\sim \hat{P}_{v^{\ast }}$
, where
$\hat{P}_{t^{\ast }}$
and
$\hat{P}_{v^{\ast }}$
denote estimated distributions from step 1;(b) for
$i=1,\ldots N$
, sample
$t_{i}\sim \text{Binomial}(n_{i},t_{i}^{\ast })$
and
$v_{i}\sim \text{Binomial}(n_{i},v_{i}^{\ast })$
;(c) compute the resampled vote-shares
$\boldsymbol{y}=(v_{1}/t_{1},\ldots ,v_{n}/t_{N})$
;(d) estimate the kernel density
$\hat{f}_{\boldsymbol{y}}(z)$
of the resampled vote-shares
$\boldsymbol{y}$
at points
$z=\{z_{1},\ldots ,z_{K}\}$
.
3. Estimate the proportion of precincts with fraudulent election results by comparing the kernel density of the observed vote-shares
$\boldsymbol{r}$
,
$\hat{f}_{\boldsymbol{r}}(z_{k})$
, with the kernel densities of the sampled vote-shares
$\big\{\hat{f}_{\boldsymbol{y}^{(1)}}(z_{k}),\ldots ,\hat{f}_{\boldsymbol{y}^{(M)}}(z_{k})\big\}$
, where
$\boldsymbol{y}^{(j)}$
denotes the set of vote-shares sampled at iteration
$j$
.


The technical details of the density estimation in Step 1 are discussed in the Supplementary Appendix C. Steps 2(a)–2(c) are fairly straightforward. In step 2(d), to estimate the kernel density
 $\hat{f}$
given the sample of vote-shares
$\hat{f}$
given the sample of vote-shares
 $\boldsymbol{y}$
, the usual Gaussian kernel density estimator is used:
$\boldsymbol{y}$
, the usual Gaussian kernel density estimator is used:
 $$\begin{eqnarray}\displaystyle \hat{f}_{\boldsymbol{y}}(z_{k})=\frac{1}{n}\mathop{\sum }_{i=1}^{n}\frac{1}{h}\unicode[STIX]{x1D719}\Big(\frac{z_{k}-y_{i}}{h}\Big), & & \displaystyle\end{eqnarray}$$
where
 $\unicode[STIX]{x1D719}$
denotes the standard Gaussian density function,
$\unicode[STIX]{x1D719}$
denotes the standard Gaussian density function,
 $h$
denotes the bandwidth of the estimator, and
$h$
denotes the bandwidth of the estimator, and
 $z_{k}$
denotes the point at which the density is evaluated. The grid
$z_{k}$
denotes the point at which the density is evaluated. The grid
 $\{z_{1},\ldots ,z_{K}\}$
is the set of equally spaced points on the closed unit interval (the choice of
$\{z_{1},\ldots ,z_{K}\}$
is the set of equally spaced points on the closed unit interval (the choice of
 $K$
is discussed later). It is important that the chosen bandwidth
$K$
is discussed later). It is important that the chosen bandwidth
 $h$
is not too large, because otherwise the estimated density will not exhibit any spikes and the resulting measure will not detect fraud. I discuss the choice of the bandwidth
$h$
is not too large, because otherwise the estimated density will not exhibit any spikes and the resulting measure will not detect fraud. I discuss the choice of the bandwidth
 $h$
later in this section and in the Supplementary Appendix D.
$h$
later in this section and in the Supplementary Appendix D.
After estimating the set of kernel density functions
 $\hat{f}_{\boldsymbol{y}^{(j)}}(z)$
for
$\hat{f}_{\boldsymbol{y}^{(j)}}(z)$
for
 $j=1,\ldots M$
in step 3 of the algorithm, we compute the proportion of precincts with fraudulent election results using the following formula:
$j=1,\ldots M$
in step 3 of the algorithm, we compute the proportion of precincts with fraudulent election results using the following formula:
 $$\begin{eqnarray}F=\mathop{\sum }_{k=1}^{K}w_{k}\mathbb{1}\Big\{\hat{f}_{\boldsymbol{r}}(z_{k})>\max \big\{\hat{f}_{\boldsymbol{y}^{(1)}}(z_{k}),\ldots ,\hat{f}_{\boldsymbol{y}^{(M)}}(z_{k})\big\}\Big\},\end{eqnarray}$$
where the indicator function
 $\mathbb{1}\{\cdot \}$
is equal to one if the observed density at point
$\mathbb{1}\{\cdot \}$
is equal to one if the observed density at point
 $z_{k}$
is greater than the estimated density at point
$z_{k}$
is greater than the estimated density at point
 $z_{k}$
across all simulated datasets.Footnote
4
The first term inside the indicator function,
$z_{k}$
across all simulated datasets.Footnote
4
The first term inside the indicator function,
 $\hat{f}_{\boldsymbol{r}}(z_{k})$
, denotes the kernel density of the observed data
$\hat{f}_{\boldsymbol{r}}(z_{k})$
, denotes the kernel density of the observed data
 $\boldsymbol{r}=\{r_{1},\ldots ,r_{N}\}$
evaluated at point
$\boldsymbol{r}=\{r_{1},\ldots ,r_{N}\}$
evaluated at point
 $z_{k}$
, whereas the second term denotes the upper envelope of the kernel density at point
$z_{k}$
, whereas the second term denotes the upper envelope of the kernel density at point
 $z_{k}$
based on the simulated datasets
$z_{k}$
based on the simulated datasets
 $\{\boldsymbol{y}^{(1)},\ldots ,\boldsymbol{y}^{(M)}\}$
. The value of the indicator function at point
$\{\boldsymbol{y}^{(1)},\ldots ,\boldsymbol{y}^{(M)}\}$
. The value of the indicator function at point
 $z_{k}$
will be equal to one if the kernel density of the observed data at that point is higher than the upper envelope of the all kernel densities estimated from the resampled data. For example, if we let
$z_{k}$
will be equal to one if the kernel density of the observed data at that point is higher than the upper envelope of the all kernel densities estimated from the resampled data. For example, if we let
 $z_{k}=2/3$
and find that the kernel density of the observed data at point
$z_{k}=2/3$
and find that the kernel density of the observed data at point
 $2/3$
is higher than in any of the simulations, then it serves as an indication that there are too many precincts in the data where the vote-shares are equal to 2/3. The measure
$2/3$
is higher than in any of the simulations, then it serves as an indication that there are too many precincts in the data where the vote-shares are equal to 2/3. The measure
 $F$
estimates whether the spikes in the observed distribution are too large relative to the null distribution of vote-shares.
$F$
estimates whether the spikes in the observed distribution are too large relative to the null distribution of vote-shares.
The weights
 $w_{k}$
in the definition
$w_{k}$
in the definition
 $F$
refer to the estimated proportion of precincts around the point
$F$
refer to the estimated proportion of precincts around the point
 $z_{k}$
with election results inconsistent with the null hypothesis of no fraud. Formally, this quantity is defined as
$z_{k}$
with election results inconsistent with the null hypothesis of no fraud. Formally, this quantity is defined as
 $w_{k}=\max \{0,{\hat{w}}_{k}\}$
where
$w_{k}=\max \{0,{\hat{w}}_{k}\}$
where
 $$\begin{eqnarray}\displaystyle {\hat{w}}_{k} & =\displaystyle \frac{1}{n}\mathop{\sum }_{i=1}^{n}\mathbb{1}\Big\{z_{k}-l\leqslant r_{i}<z_{k}+l\Big\}-\frac{1}{nM}\mathop{\sum }_{i=1}^{n}\mathop{\sum }_{m=1}^{M}\mathbb{1}\Big\{z_{k}-l\leqslant y_{i}^{(m)}<z_{k}+l\Big\}. & \displaystyle\end{eqnarray}$$
Although the above expression appears complex, it has a very intuitive interpretation.
 $\mathbb{1}\{\cdot \}$
denotes the indicator function equal to one if the vote-share
$\mathbb{1}\{\cdot \}$
denotes the indicator function equal to one if the vote-share
 $v_{i}$
falls in the interval
$v_{i}$
falls in the interval
 $[z_{k}-l,z_{k}+l)$
, where
$[z_{k}-l,z_{k}+l)$
, where
 $l$
is equal to the half-distance between
$l$
is equal to the half-distance between
 $z_{k}$
and
$z_{k}$
and
 $z_{k+1}$
. Thus, the first term represents the proportion of observed voting results that fall in an interval centered around point
$z_{k+1}$
. Thus, the first term represents the proportion of observed voting results that fall in an interval centered around point
 $z_{k}$
. The second term represents the proportion of sampled observations that fall within the same interval, averaged over all simulations
$z_{k}$
. The second term represents the proportion of sampled observations that fall within the same interval, averaged over all simulations
 $1,\ldots ,M$
. For example, if we take again
$1,\ldots ,M$
. For example, if we take again
 $z_{k}=2/3$
, then
$z_{k}=2/3$
, then
 ${\hat{w}}_{k}$
represents the excess proportion of precincts where the party received 2/3 of the vote. In contrast to many existing measures of fraud, which only test an omnibus null hypothesis that elections are not tainted by fraud, the RKD method estimates the proportion of precincts where fraud is likely to have happened, and identifies precincts with possibly fraudulent results.
${\hat{w}}_{k}$
represents the excess proportion of precincts where the party received 2/3 of the vote. In contrast to many existing measures of fraud, which only test an omnibus null hypothesis that elections are not tainted by fraud, the RKD method estimates the proportion of precincts where fraud is likely to have happened, and identifies precincts with possibly fraudulent results.
The RKD method is a version of the posterior predictive check often used to evaluate model fit in the Bayesian analysis (Gelman, Carlin, Stern, and Rubin Reference Gelman, Carlin, Stern and Rubin2003). As in the standard posterior predictive checking, we first use the observed data to estimate the parameters of the model (in this case, the latent distributions
 $P_{t^{\ast }}$
and
$P_{t^{\ast }}$
and
 $P_{v^{\ast }}$
) and then compare the data sampled from the estimated model against the observed data. The standard posterior predictive check proceeds by choosing a statistic
$P_{v^{\ast }}$
) and then compare the data sampled from the estimated model against the observed data. The standard posterior predictive check proceeds by choosing a statistic
 $T$
(e.g., average) and then compares the statistic of the observed dataset,
$T$
(e.g., average) and then compares the statistic of the observed dataset,
 $T(y)$
, with the set of statistics from
$T(y)$
, with the set of statistics from
 $M$
sampled datasets,
$M$
sampled datasets,
 $\{T(y_{1}^{\ast }),\ldots ,T(y_{M}^{\ast })\}$
. The RKD algorithm is different only in that one evaluates multiple statistics (the kernel density
$\{T(y_{1}^{\ast }),\ldots ,T(y_{M}^{\ast })\}$
. The RKD algorithm is different only in that one evaluates multiple statistics (the kernel density
 $\hat{f}$
is evaluated at each point
$\hat{f}$
is evaluated at each point
 $z\in \{z_{1},\ldots ,z_{K}\}$
) and then aggregates them to measure how strongly the observed data deviate from the smooth latent model.
$z\in \{z_{1},\ldots ,z_{K}\}$
) and then aggregates them to measure how strongly the observed data deviate from the smooth latent model.
As described up to this point, the RKD algorithm yields a point estimate of fraud without any measure of statistical uncertainty. The statistical uncertainty in the estimation of fraud originates from the uncertainty regarding latent distributions
 $P_{t^{\ast }}$
and
$P_{t^{\ast }}$
and
 $P_{v^{\ast }}$
. Calculating this uncertainty is difficult in the frequentist framework, but feasible (though computationally intensive) in the Bayesian setting. The following procedure can be readily implemented by iterating over the following steps:
$P_{v^{\ast }}$
. Calculating this uncertainty is difficult in the frequentist framework, but feasible (though computationally intensive) in the Bayesian setting. The following procedure can be readily implemented by iterating over the following steps:
1. Draw a sample from the posterior distributions
$P_{t^{\ast }}$
and
$P_{v^{\ast }}$
.2. Use the posterior draw from Step 1 in place of
$\hat{P}_{t^{\ast }}$
and
$\hat{P}_{v^{\ast }}$
in the RKD algorithm and compute the fraud statistic
$F$
.


Repeating this procedure
 $m$
times yields a posterior sample of
$m$
times yields a posterior sample of
 $\{F_{1},\ldots ,F_{m}\}$
, which then can be used to compute the credible intervals from the sample quantiles. The Bayesian estimation of the functions
$\{F_{1},\ldots ,F_{m}\}$
, which then can be used to compute the credible intervals from the sample quantiles. The Bayesian estimation of the functions
 $P_{t^{\ast }}$
and
$P_{t^{\ast }}$
and
 $P_{v^{\ast }}$
amounts to computing the posterior distributions of the parameters in the beta-mixture model given in Equations (7)–(8) above. The Bayesian density estimation procedure is described in Supplementary Appendix C.
$P_{v^{\ast }}$
amounts to computing the posterior distributions of the parameters in the beta-mixture model given in Equations (7)–(8) above. The Bayesian density estimation procedure is described in Supplementary Appendix C.
The RKD algorithm has three parameters that have to preset by the user: the number of resamples (
 $M$
), the size of the grid
$M$
), the size of the grid
 $\{z_{1}\ldots ,z_{K}\}$
on which the kernel density is estimated (
$\{z_{1}\ldots ,z_{K}\}$
on which the kernel density is estimated (
 $K$
), and the bandwidth for the kernel density (
$K$
), and the bandwidth for the kernel density (
 $h$
). The choice of
$h$
). The choice of
 $M$
involves a trade-off between type I and type II errors, the choice of
$M$
involves a trade-off between type I and type II errors, the choice of
 $K$
involves a trade-off between the computational efficiency and precision. The calibration exercise in Supplementary Appendix D suggests that choosing
$K$
involves a trade-off between the computational efficiency and precision. The calibration exercise in Supplementary Appendix D suggests that choosing
 $M=1,000$
and
$M=1,000$
and
 $K=1,001$
balances these trade-offs fairly well, and overall the results are not sensitive to these choices. The choice of the bandwidth
$K=1,001$
balances these trade-offs fairly well, and overall the results are not sensitive to these choices. The choice of the bandwidth
 $h$
is more straightforward as the RKD algorithm is not sensitive to the choice of the bandwidth as long as it is sufficiently small (
$h$
is more straightforward as the RKD algorithm is not sensitive to the choice of the bandwidth as long as it is sufficiently small (
 $h\leqslant 0.001$
) so that the kernel density can capture spikes in the vote-share density.
$h\leqslant 0.001$
) so that the kernel density can capture spikes in the vote-share density.
5 Applications
To illustrate and assess the proposed method, I apply it to five real elections and a battery of simulated elections. The first batch of data are from parliamentary (2003, 2007, and 2011) and presidential (2012) elections in Russia. For presidential elections, I study votes for Vladimir Putin, while for the parliamentary elections I study votes for the United Russia party. The 2011 and 2012 elections (and to as smaller degree, the 2007 elections) were criticized for election fraud by various observers and agencies, but the 2003 elections were considered relatively clean. As a contrasting case where fraud should be highly unlikely, I use precinct-level vote-shares of the Canadian Conservative Party from the 2011 parliamentary elections.
In addition, I apply the method on six simulated datasets: one of the simulated datasets is “clean” in that it does not contain any fraud, while other five datasets are “contaminated” by variable degrees of fraud. The data are simulated using the generative model in (3)–(6). For the latent distribution of turnout,
 $P_{t^{\ast }}$
, I choose a beta distribution with mean 0.5, and for the latent distribution of support I use a two-component mixture of beta distributions with the mean of
$P_{t^{\ast }}$
, I choose a beta distribution with mean 0.5, and for the latent distribution of support I use a two-component mixture of beta distributions with the mean of
 $0.56$
. The precinct sizes
$0.56$
. The precinct sizes
 $\{n_{i}\}_{i=1}^{N}$
are drawn from the uniform distribution on the interval
$\{n_{i}\}_{i=1}^{N}$
are drawn from the uniform distribution on the interval
 $\{500,\ldots ,1500\}$
, as in earlier simulations. To create the contaminated datasets, I sample without replacement a set of precincts from the clean simulated dataset and then randomly assign them a coarse fraction from the set
$\{500,\ldots ,1500\}$
, as in earlier simulations. To create the contaminated datasets, I sample without replacement a set of precincts from the clean simulated dataset and then randomly assign them a coarse fraction from the set
 $\{0.60,0.65,\ldots ,0.90,0.95\}$
.Footnote
5
$\{0.60,0.65,\ldots ,0.90,0.95\}$
.Footnote
5
RKD-based estimates of fraud with 95 percent credible intervals.

Table 2 shows the results – the estimated levels of fraud (
 $F$
) with the 95 percent credible intervals. By this count, elections in Russia were becoming increasingly fraudulent from 2003 to 2012. If in 2003, the results could be deemed as suspicious in about 0.24 percent of precincts, by 2011 and 2012, roughly one percent of precincts reported fraudulent results. Given the 95 percent credible intervals, we can say that with 95 percent probability between 0.86 and 1.01 percent of precincts reported fraudulent results in the 2011 parliamentary elections in Russia (the results are very similar for the 2012 presidential elections). Thus, the probability mass spikes in the distribution of the United Russia vote-shares discussed earlier indeed were not statistical artifacts and are indicative fraud, consistent with what analysts and activists suggested. Although one percent might appear tiny, it is important to note that this number only represents the estimated amount of the specific kind of fraud. Most likely, the estimated one percent fraud constitutes the lower bound on the total amount of fraud perpetrated in these elections.
$F$
) with the 95 percent credible intervals. By this count, elections in Russia were becoming increasingly fraudulent from 2003 to 2012. If in 2003, the results could be deemed as suspicious in about 0.24 percent of precincts, by 2011 and 2012, roughly one percent of precincts reported fraudulent results. Given the 95 percent credible intervals, we can say that with 95 percent probability between 0.86 and 1.01 percent of precincts reported fraudulent results in the 2011 parliamentary elections in Russia (the results are very similar for the 2012 presidential elections). Thus, the probability mass spikes in the distribution of the United Russia vote-shares discussed earlier indeed were not statistical artifacts and are indicative fraud, consistent with what analysts and activists suggested. Although one percent might appear tiny, it is important to note that this number only represents the estimated amount of the specific kind of fraud. Most likely, the estimated one percent fraud constitutes the lower bound on the total amount of fraud perpetrated in these elections.
There is no strong evidence of fraud in the 2011 Canadian elections as the estimated proportion of precincts with suspicious coarse vote-shares is only 0.07 percent with the lower bound of the 95 percent credible interval very close to zero. Furthermore, the RKD method detects the true levels of fraud quite accurately across all six simulated elections. In elections without fraud, the 95 percent credible interval includes zero, as it should. The estimated levels of fraud for all elections are within a few decimal points of the ground truth and the 95 percent credible intervals mostly cover the true values.
Figure 4 illustrates the mechanics of the RKD method. The figures show kernel densities of observed vote-shares and the upper envelope of the kernel densities from the resampled data. The gray vertical bars represent the points at which the kernel density of the observed data exceeds the upper envelope of the kernel density of the resampled data – these are the points where the indicator function
 $\mathbb{1}\{\cdot \}$
in the equation (10) is equal to one. The width of the vertical gray bars is proportional to the value of the weight
$\mathbb{1}\{\cdot \}$
in the equation (10) is equal to one. The width of the vertical gray bars is proportional to the value of the weight
 $w_{k}$
, and so that it indicates how many precincts with a voting result around
$w_{k}$
, and so that it indicates how many precincts with a voting result around
 $z_{k}$
are suspected to have fraudulent results. For example, a wide gray bar located at 0.75 indicates that many precincts where the party received 75 percent of votes are suspicious.
$z_{k}$
are suspected to have fraudulent results. For example, a wide gray bar located at 0.75 indicates that many precincts where the party received 75 percent of votes are suspicious.
Kernel densities of observed vote-shares (lower curve) and their resampled upper envelopes (upper curve). Vertical gray bars indicate potentially falsified results.
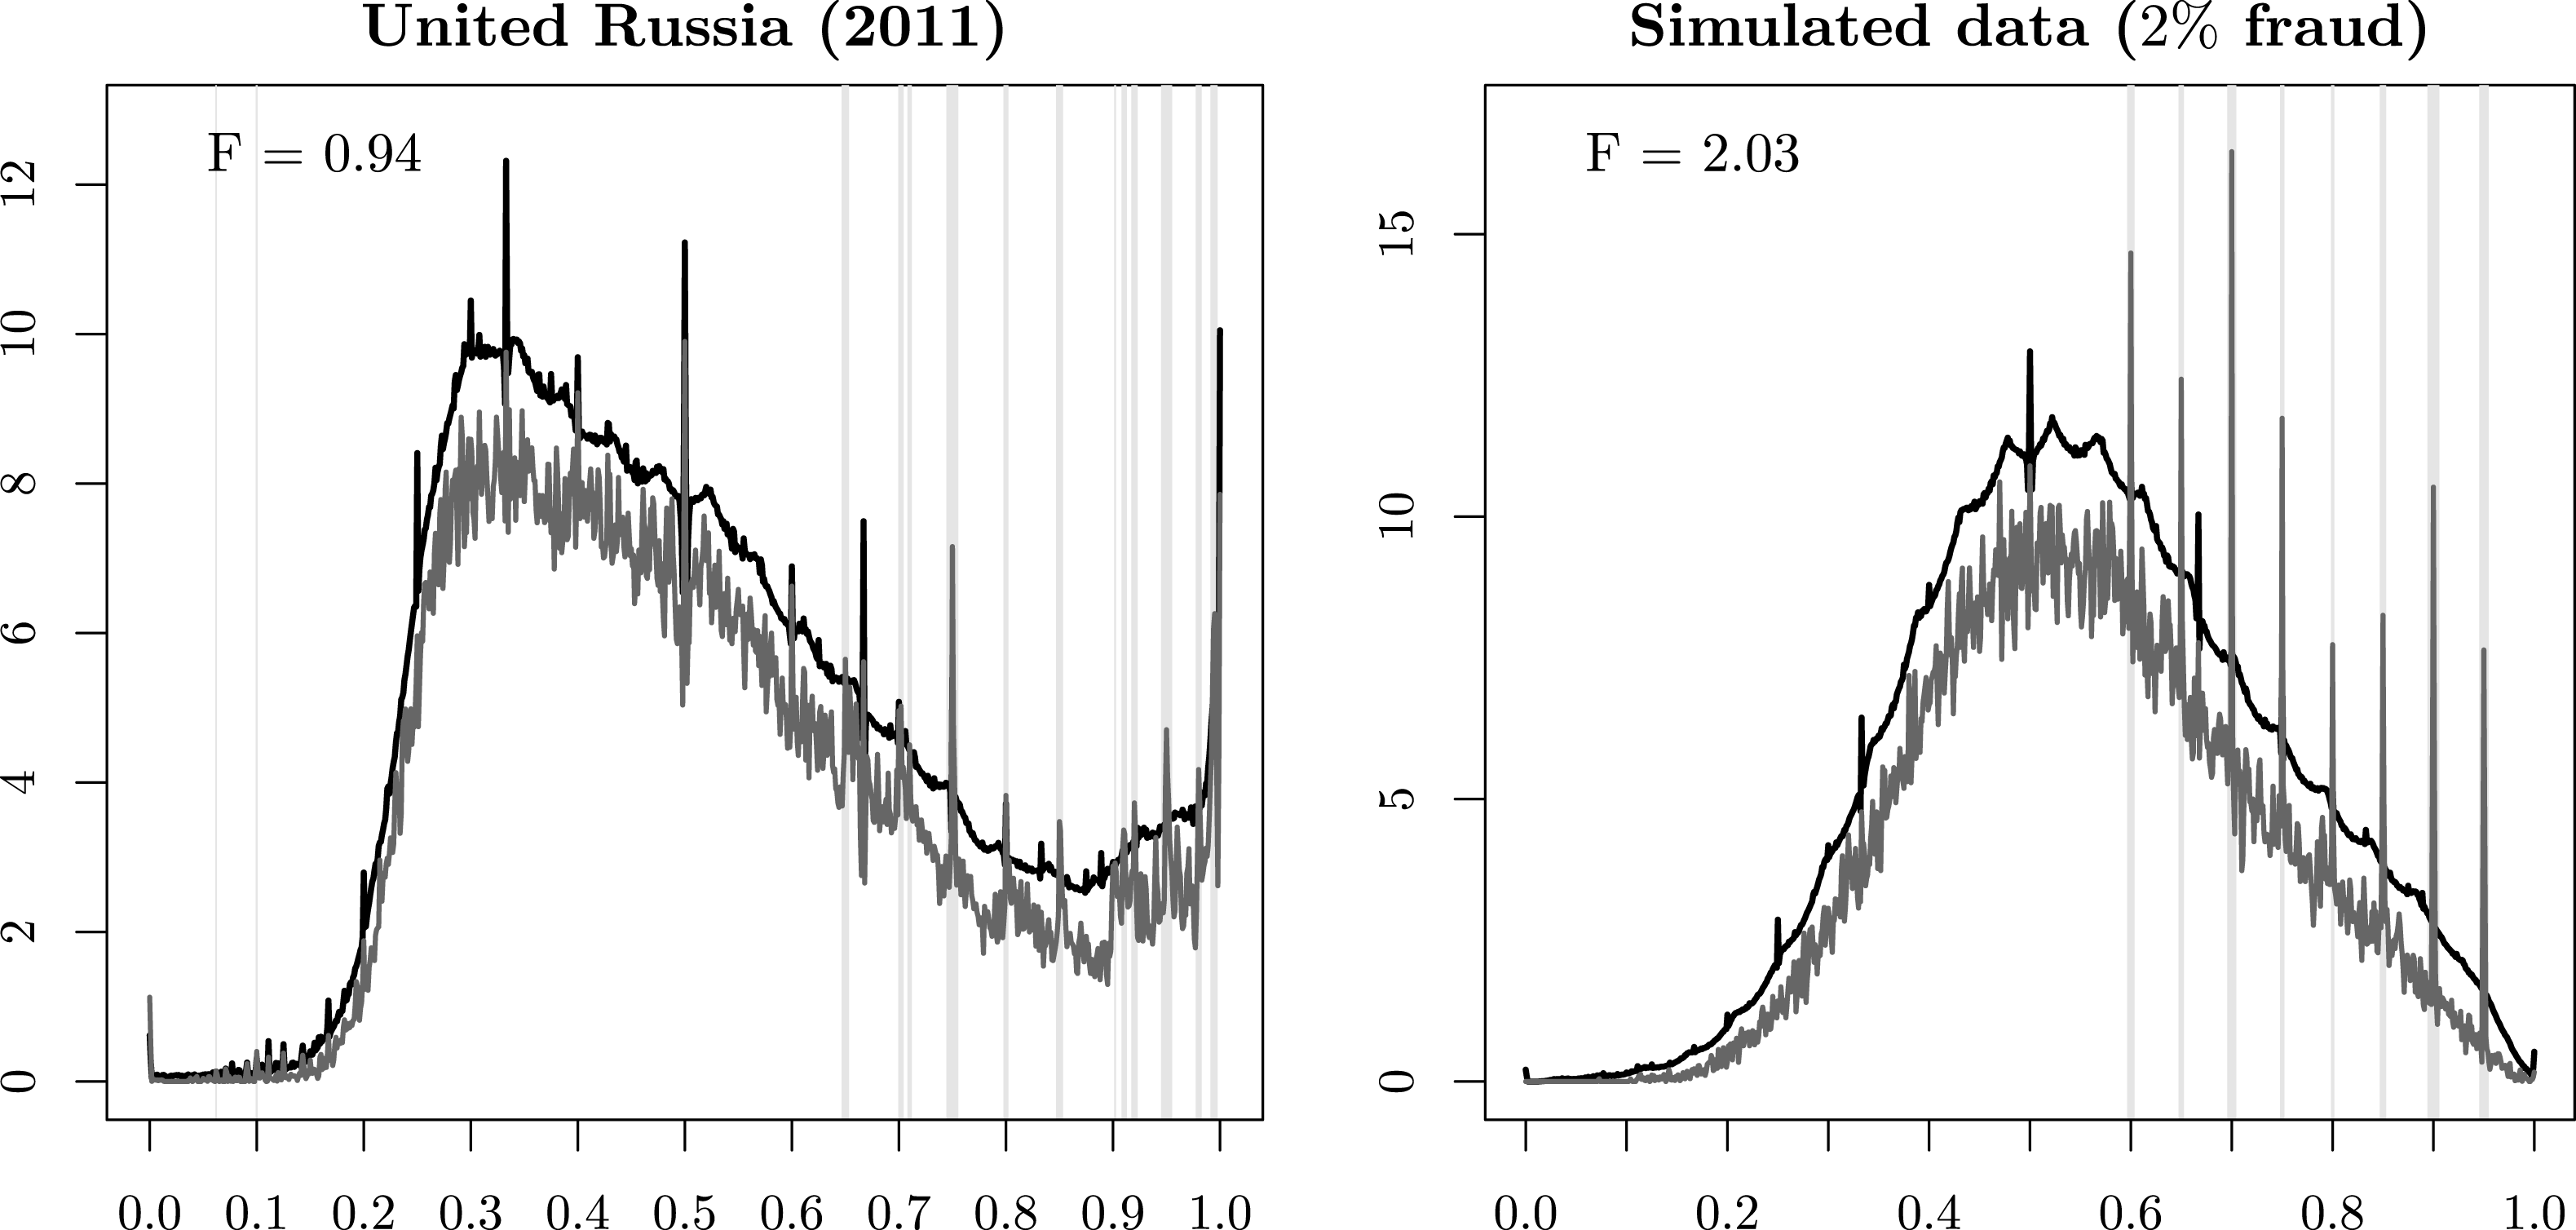
The left panel of Figure 4 plots the results for the United Russia party in the 2011 elections. The kernel density of the observed data (lower gray curve) exceeds the upper envelope of the kernel density of the resampled data (upper black curve) at multiple points, and especially so in precincts where the United Russia party received a high proportion of votes (at 0.75, 0.85, and at multiple points above 0.9). Given that the government’s local agents would commit fraud by inflating the vote-share of the ruling party to some large number, this pattern appears plausible. It is also consistent with previous research on these elections, which concluded that the Russian government was committing fraud not in marginal precincts, but in precincts where it had strong support (Rundlett and Svolik Reference Rundlett and Svolik2016).
It is instructive to note that large spikes in the observed data do not necessarily indicate fraud. In case of the Russian 2011 elections, the largest spike in the observed vote-shares is at point 0.5. However, the magnitude of this spike is below the upper envelope of the resampled kernel density; thus, we cannot conclude that a large proportion of precincts with exactly 50 percent of votes for the United Russia party indicates fraud. This example serves as a useful reminder that seemingly strange patterns in voting data do not necessarily indicate fraud.
The right panel of Figure 4 shows how the measure of fraud performs on a simulated dataset with two percent of precincts contaminated by fraud. First, the method correctly identifies the set of precincts with fraudulent results – the vertical gray bars are located precisely on the points where election data were contaminated in the simulation. Second, the estimated amount of fraud is very close to the ground truth. Third, some probability mass spikes in these data (e.g., 1/2 or 2/3) are correctly identified as not indicative of fraud.
6 Comparison To Digit-Based Methods
Currently the most popular approaches to fraud detection use distributions of digits in vote count data to identify fraud.Footnote 6 The digit-based methods are designed to detect manipulation of vote counts, whereas the RKD method proposed here is designed to detect manipulation of vote-shares. While these are different types of fraud, it is important to consider whether the digit-based methods would detect the manipulation of vote-shares, since manipulation of vote counts could potentially have spillover effects on the distribution of vote-shares.
I consider two digit-based tests – the second-digit test and the last-digit test. The second-digit test is based on the idea that second significant digits in vote count data should approximately follow Benford’s law (Mebane Reference Mebane, Alvarez, Thad E. and Susan D2008). According to this law, the probability that the second digit takes value
 $d\in \{0,\ldots ,9\}$
is
$d\in \{0,\ldots ,9\}$
is
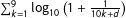 $\sum _{k=1}^{9}\log _{10}\left(1+\frac{1}{10k+d}\right)$
.Footnote
7
Inference about fraud can then be made using a chi-squared test comparing the observed frequency of vote counts against the null distribution.
$\sum _{k=1}^{9}\log _{10}\left(1+\frac{1}{10k+d}\right)$
.Footnote
7
Inference about fraud can then be made using a chi-squared test comparing the observed frequency of vote counts against the null distribution.
The last-digit test is based on the notion that, in normal circumstances, any last digit between 0 and 9 should occur with equal likelihood in vote count data (Beber and Scacco Reference Beber and Scacco2012). Thus, if some digits (e.g., zero or five) occur significantly more often than others, it can serve as evidence of fraud. The null hypothesis of no fraud can then be tested using the chi-squared test that compares the observed distribution of last digits with the null uniform distribution.Footnote 8
Chi-square test statistics (
 $df=8$
) for the Benford’s second-digit tests (BL2) and the last-digit tests.
$df=8$
) for the Benford’s second-digit tests (BL2) and the last-digit tests.

Bootstrapped p-values:
 $\dagger <0.001$
,
$\dagger <0.001$
,
 $\ast \ast <0.01$
,
$\ast \ast <0.01$
,
 $\ast <0.05$
.
$\ast <0.05$
.
Table 3 shows the results of the two digit-based tests for the eleven datasets analyzed earlier. The chi-square statistics for the second-digit test are very large in all cases leading us to reject the null hypothesis of no fraud both in the elections were fraud is likely to have happened or did happen (Russia 2011 and 2012 as well as contaminated synthetic data) and in elections where fraud likely or surely did not happen (Canadian data and clean synthetic data).Footnote 9 According to the last-digit tests, all four Russian elections were fraudulent,Footnote 10 but the Canadian ones were not. However, the test fails to correctly detect fraud in the simulated elections.
The results reported in Table 3 in no way suggest that the digit-based tests are somehow inferior to the vote-share based method. They merely indicate that manipulation of election results through falsification of vote-shares would not be correctly detected using the digit-based tests – the second-digit test would most likely lead to false positive errors, whereas the last-digit test most likely would lead to false negative errors. Conversely, as a method constructed to detect falsification of vote-shares, the RKD algorithm should not be expected to detect falsification of vote counts.
7 Discussion
I presented a method of fraud detection based on patterns in the distribution of vote-shares. The analysis shows that without a statistical model describing the distribution of data under the null hypothesis of no fraud, one is likely to make a false positive error. When the dataset contains a large set (tens of thousands) of moderately sized electoral units (thousands of voters or fewer), it will exhibit seemingly irregular behavior: there will be many electoral units with coarse vote-shares, easily detectable in a histogram with narrow bins or a kernel density plot with a small bandwidth. I explained the theoretical reasons as to why this pattern holds in clean elections and showed this to be the case with examples of admittedly fraud-free elections in Canada as well as simulated elections.
The paper proposed a systematic method, the resampled kernel density, to detect manipulation of vote-shares. Using the RKD method, one can reduce the risk false positive errors, identify the types of precincts (based on their returns) where fraud is most likely to have taken place, and estimate the proportion of precincts subjected to fraud. When elections are manipulated by falsifying vote-shares as opposed to vote counts, such manipulation cannot be detected using the standard digit-based methods.
The method proposed here detects only a specific kind of fraud where local agents falsify election results by inflating the pro-government’s vote-share to some focal number. The motive of the local officials to signal their loyalty to the central government is one of the central features of many many countries where election fraud is known to happen, including Russia, Ukraine, Mexico (Magaloni Reference Magaloni2006), or Indonesia (Martinez-Bravo Reference Monica2014). Although the method of the paper was largely motivated by the example of Russia where the incentives of the local agents to commit fraud in order to signal their loyalty to the incumbent party machine are well documented (Kalinin and Mebane Reference Kalinin and Mebane2012; Simpser Reference Simpser2013; Rundlett and Svolik Reference Rundlett and Svolik2016), it could be productively applied to other polities were such incentives for local agents exist.
Finally, as any other forensic method that relies on a specific feature of election data (digits, fractions, skewness, etc.), the RKD method is susceptible to the “feedback effect” problem: once a government learns that a specific form of fraud is detectable, it might switch to another form of fraud. On the one hand, this problem underscores the need for continuous innovations in the methodology of fraud detection. On the other hand, the problem can be alleviated by integrating the RKD method with other forensic tools through ensemble learning algorithms (e.g. Levin, Pomares, and Alvarez Reference Levin, Pomares, Alvarez and Alvarez2016) to detect multiple types of election fraud simultaneously.
Supplementary material
For supplementary material accompanying this paper, please visit https://doi.org/10.1017/pan.2016.9.


