


Introduction
Modern discussions of gender and language can be traced, somewhat uncomfortably, to Otto Jespersen’s (Reference Jespersen1922) book Language: Its Nature, Development and Origin, specifically chapter 13, “The Woman.” Writing with confidence but little evidence, Jespersen claimed that women’s language was inherently limited, that women spoke less precisely, used small vocabularies padded with adjectives like “pretty” and “nice,” and lacked the intellectual rigor to sustain complex syntax. These caricatures were presented as linguistic facts and helped shape early approaches to language and gender. More than fifty years later, Robin Lakoff’s Language and Woman’s Place (Reference Lakoff1973) offered a decisive counterpoint. Lakoff argued that women’s speech was not linguistically deficient but socially constrained, reflecting the power dynamics that structure language use. She identified features such as hedges, tag questions, and intensifiers not as evidence of inferiority, but as strategies embedded in a broader system of gendered expectations. Her work helped establish gender and language as a legitimate field of study, shifting the conversation from moralizing stereotype to questions of power, ideology, and linguistic structure.
In the decades since, research on gender and language has become broader and more theoretically sophisticated, moving well beyond Jespersen’s caricatures. Yet a striking continuity remains: much of this work has focused on vocabulary, syntax, and discourse. Prosody—the rhythmic and melodic structure of speech—has remained at the margins, despite being a primary channel through which speakers convey emphasis, affect, and structure. If gender shapes not only what people say but how they say it, then prosody is a critical and historically understudied site of linguistic variation. Understanding how gender influences prosody is essential for developing a fuller account of how language encodes both social meaning and linguistic function.
This paper helps address that gap, focusing on the acoustic realization of stress. Stress plays a central role in signaling prominence, organizing information, and guiding real-time comprehension, yet gender-based variation in its acoustic realization remains largely unexplored.
Gender differences in speech
Before turning to the acoustic realization of prosodic stress, it is useful to outline broader patterns of gender-based differences in speech. For instance, research shows that men and women differ acoustically in speech. Some of these differences stem from physiology—for example, average F0, voice quality, voice onset time, vowel formants, and vowel space have been linked to anatomical differences (e.g., Munson, Reference Munson, Jefferson and McDonald2006; Robb et al., Reference Robb, Gilbert and Lerman2005; Simpson, Reference Simpson2009). However, these physiological factors tell only part of the story. Recent research also highlights the role of learned social and cultural factors in shaping gendered speech (e.g., Munson, Reference Munson2007; Wodak & Benke, Reference Wodak and Benke2017).
Early accounts like Jespersen’s framed women as linguistically ornamental rather than innovative, as speakers who filled silence with chatter rather than conveying thought. In sharp contrast, modern sociolinguists like Labov (Reference Labov1990) and subsequent sociolinguistic research portray women as leaders of linguistic change in society, while men more often maintain older or conservative forms. For example, women have led vowel shifts in a range of communities, including the raising of “aeh” and fronting of “aw” in New York City, and the Northern Cities Shift, whereas men have tended to retain pre-shift variants in these contexts (Labov, Reference Labov1966; Eckert, Reference Eckert1988). Slight differences in speech rate, with men speaking slightly faster than women, may also reflect social norms (Jacewicz et al., Reference Jacewicz, Fox and Wei2010; Yuan et al., Reference Yuan, Liberman and Cieri2006).
Gendered patterns are also evident in suprasegmental features such as intonation and boundary marking, including High Rising Terminals (HRT) or “uptalk,” which is more common among women. In competitive settings, women use uptalk more frequently as they gain success, possibly to soften perceptions of authority. Men’s use is more context-dependent—rising when correcting women but decreasing in all-male interactions (Linneman, Reference Linneman2013). Though often stereotyped as a sign of uncertainty, women use uptalk strategically in professional and social contexts to manage conversational flow, frame narratives, and negotiate epistemic control. Men tend to use uptalk for different discourse functions, especially in mixed-gender settings, where it highlights new or surprising information and fosters interactional alignment (Levon, Reference Levon2016). Uptalk illustrates how gendered social norms shape prosodic expression. More broadly, gender differences also appear in pitch patterns relevant to prosodic stress, the focus of the present study.
Research also suggests that while men and women do not differ significantly in overall pitch range (i.e., the span between the highest and lowest pitch in an utterance; Henton, Reference Henton1989; Simpson, Reference Simpson2009), they do exhibit differences in how pitch is used to signal prominence. Women tend to employ more dynamic pitch movements and wider excursions when producing stressed syllables, whereas men’s realizations are often characterized by more flat or level pitch contours (Daly & Warren, Reference Daly and Warren2001; Jiang, Reference Jiang2011; Munson & Babel, Reference Munson and Babel2007; Papeleu et al., Reference Papeleu, Leyns, Tomassen, T’Sjoen, Van Lierde and D’haeseleer2025; Schmid & Bradley, Reference Schmid and Bradley2019). These gender-based differences can interact with other prosodic cues and dialectal variation (Clopper & Smiljanic, Reference Clopper and Smiljanic2011).
Taken together, these findings suggest that gender shapes prosodic structure not only through physiological differences but also through interactional and pragmatic choices. While these effects are well documented at the discourse level, far less is known about whether they extend to prosodic stress. But what exactly are the acoustic building blocks of stress? Before examining gender-based differences, it is useful to establish how stress is acoustically realized in speech.
Prosodic stress
Prosodic stress is a fundamental feature of spoken language that contributes to the prominence of syllables and words in speech. Acoustically, stress is marked by increases in pitch or fundamental frequency (F0), amplitude, and duration (e.g., Bettagere, Reference Bettagere2010; Fry, Reference Fry1955; Kehoe et al., Reference Kehoe, Stoel-Gammon and Buder1995; Plag et al., Reference Plag, Kunter and Schramm2011).Footnote 1 Rather than relying on a single acoustic feature, stress emerges from a dynamic interaction among multiple cues, with their relative importance varying across contexts (McClean & Tiffany, Reference Mcclean and Tiffany1973). The term stress refers both to the prominence of a syllable relative to its neighbors and to the broader rhythmic structure of an utterance (Gimson, Reference Gimson1956). Although stress is processed as an abstract phonological representation, it remains closely linked to measurable acoustic cues that shape its production and perception (e.g., Broś et al., Reference Broś, Meyer, Kliesch and Dellwo2021; Moore-Cantwell et al., Reference Moore-Cantwell, Bosch, Kahn, Kim, Shoemaker and Kahn2024; Pierrehumbert, Reference Pierrehumbert1999).
Pitch and prosodic stress
Pitch has long been recognized as a key acoustic cue to linguistic stress, and decades of research have shown that pitch patterns play a significant role in signaling stress (Fry, Reference Fry1958; Morton & Jassem, Reference Morton and Jassem1965; Ladd, Reference Ladd2008). Two closely related aspects of pitch are often highlighted in acoustic production studies: pitch height and pitch difference (sometimes called pitch range). Pitch height refers to the F0 level at a syllable, often the peak or mean F0 of the stressed syllable (e.g., Kehoe et al., Reference Kehoe, Stoel-Gammon and Buder1995). Pitch difference captures the magnitude of local contrast in F0, such as the excursion between stressed and neighboring unstressed syllables (e.g., Morton & Jassem, Reference Morton and Jassem1965; Plag et al., Reference Plag, Kunter, Lappe and Braun2008). In acoustic analysis, these measures are often treated as separate, with height reflecting level and difference reflecting contrast.
In perception, however, this boundary is less clear. Listeners rarely judge pitch in isolation. Instead, they interpret height relative to the surrounding context, and prominence judgments often reflect some combination of level and excursion. For example, Jeon and Heinrich (Reference Jeon and Heinrich2022) showed that listeners required larger F0 excursions to judge two peaks as equally prominent, and some listeners relied on absolute height while others weighted contrast more. This suggests that pitch height and pitch difference are analytically separable, but perceptually intertwined, working together to shape the strength of prosodic stress.
A third, related dimension is pitch movement—the shape of the F0 contour over time (e.g., pitch slope)—provides further information on how prominence is realized (e.g., Cutler, Reference Cutler, Pisoni and Remez2005; Kunter, Reference Kunter2011; Ladd, Reference Ladd2008). Although stressed syllables often align with pitch movements, these shifts are shaped by intonation rather than stress itself (Arvaniti, Reference Arvaniti, Shattuck-Hufnagel and Barnes2020). Because pitch movement is shaped by intonation, measures like tonal center of gravity (TCoG) may not reliably indicate stress perception (Barnes et al., Reference Barnes, Veilleux, Brugos and Shattuck-Hufnagel2012). Instead, more traditional measures like pitch difference may provide clearer acoustic correlates of stress.
Amplitude and stress
Early research on amplitude’s role in stress began with Lehiste & Peterson (Reference Lehiste and Peterson1959) and was later expanded by Lieberman (Reference Lieberman1960), both of whom found that louder syllables are often perceived as stressed. Their studies measured amplitude in terms of height to assess its contribution to stress perception. Other studies have examined amplitude as a primary cue to stress, focusing on amplitude differences between stressed and unstressed syllables (e.g., Huss, Reference Huss1978; Morrill, Reference Morrill2012). In natural discourse, amplitude can be overshadowed by pitch and duration, particularly in environments with high background noise or speaker variability (Summers et al., Reference Summers, Pisoni, Bernacki, Pedlow and Stokes1988). Amplitude envelope modulations not only play a role in stress perception but also contribute to broader prosodic structuring, influencing speech rhythm and prominence patterns (Frota et al., Reference Frota, Vigário, Cruz, Hohl and Braun2022).
Duration as a marker of stress
In English, stressed syllables tend to be longer than their unstressed counterparts, which enhances their perceptual prominence (Turk & Sawsuch, Reference Turk and Sawusch1997; Wagner & Watson, Reference Wagner and Watson2010). Duration has been analyzed through measures of vowel duration (e.g., Beckman et al., Reference Beckman, Edwards and Keating1994; Fry, Reference Fry1958; Gay, Reference Gay1978; Klatt, Reference Klatt1976) as well as syllable or morpheme duration (e.g., Adams & Munro, Reference Adams and Munro1978; Bettagere, Reference Bettagere2010; Cole, Reference Cole2015). Early on, Fry (Reference Fry1958) identified duration as a dominant acoustic cue in English stress, and later work has highlighted its relative stability across languages (Gordon & Roettger, Reference Gordon and Roettger2017). This stability may make duration a particularly reliable cue under certain conditions, but its contribution is always shaped by other prosodic dimensions.
More broadly, stress emerges from the dynamic interplay of multiple acoustic cues. Pitch, amplitude, and duration jointly contribute to stress perception, and their relative weighting varies across languages and contexts. This supports the idea that stress is not a uniform acoustic feature but an emergent property shaped by language-specific phonetic and phonological patterns (Bruggeman et al., Reference Bruggeman, Włodarczak and Wagner2025; Gordon & Roettger, Reference Gordon and Roettger2017; Grice & Kügler, Reference Grice and Kügler2021). Even in well-studied languages like English, the relative weighting of these cues remains debated, reinforcing the view that stress arises from a complex interaction of multiple factors rather than any single acoustic property (e.g., Keyworth, Reference Keyworth2014; Wagner & Watson, Reference Wagner and Watson2010; Yuan et al., Reference Yuan, Isard and Liberman2008). These acoustic properties form the basis of stress, but their significance lies in how they are used to signal linguistic structure and meaning.
Linguistic functions of stress
While prosodic stress has an acoustically realized form, that is only part of the story. Equally important are the linguistic functions prosodic stress serves (Hirst, Reference Hirst2005; Järvinen-Pasley et al., Reference Järvinen-Pasley, Peppé, King-Smith and Heaton2008). In lexical stress, the placement of stress within a word can alter its meaning or grammatical category (e.g., INsert [noun] vs. inSERT [verb]; Beckman et al., Reference Beckman, Edwards and Keating1994; Cutler, Reference Cutler, Pisoni and Remez2005; De Jong, Reference De Jong1995; Fry, Reference Fry1958; Gay, Reference Gay1978; Huss, Reference Huss1978; Lehiste & Peterson, Reference Lehiste and Peterson1959; Liberman, Reference Lieberman1960; Shriberg et al., Reference Shriberg, Campbell, Karlsson, Brown, McSweeny and Nadler2003; Turk & Sawusch, Reference Turk and Sawusch1997; Van Kuijk & Boves, Reference Van Kuijk and Boves1999). At the phrasal level, stress helps mark syntactic or morphological boundaries, such as in distinguishing compound words from adjective-noun phrases (e.g., greenhouse vs. green house), a pattern that reflects how prosody supports the chunking and parsing of syntactic structure (Kunter, Reference Kunter2011; Morrill, Reference Morrill2012; Plag et al., Reference Plag, Kunter, Lappe and Braun2008; Vogel & Raimy, Reference Vogel and Raimy2002). Finally, contrastive stress highlights new or important information in discourse (e.g., I wanted the GREEN shirt, not the red one), making distinctions between given and new information and directing the listener’s attention to the salient elements (Baum, Reference Baum1998; Bettagere, Reference Bettagere2010; Bolinger, Reference Bolinger1961; Cooper et al., Reference Cooper, Eady and Mueller1985; Culicover & Rochemont, Reference Culicover and Rochemont1983; Erteschik-Shir & Lappin, Reference Erteschik-Shir and Lappin1983; Gussenhoven, Reference Gussenhoven2011).
Gender and the acoustic realization of stress
Gender differences in speech are well documented across segmental and suprasegmental levels, including pitch contouring, intonation patterns, and discourse-level prosody. Yet it remains unclear whether such differences extend to the acoustic realization of prosodic stress, a crucial component of functional prosody. Stress plays an important role in signaling which elements of an utterance are emphasized, contrasted, or grouped together (its function), and these functions are implemented through measurable patterns in pitch, amplitude, and duration (its form). If gendered speaking styles systematically affect how these cues are realized, such differences may have downstream consequences for speech processing, listener perception, and models of prosodic variation.
Despite extensive work on gender and prosody more broadly, very little research has directly examined how gender differences manifest specifically in the acoustic realization of stress.
In the few studies where gender is considered, it is typically incidental, addressed only for methodological reasons. This is the case in the only two papers we found that touch on gender and the acoustic realization of stress: Koffi and Mertz’s (Reference Koffi and Mertz2018) study of lexical stress and Plag’s (Reference Plag2006) study of compound stress. In addition to their very small sample sizes (five men and five women in Koffi and Mertz; six women and three men in Plag), both studies relied on relatively simple statistical approaches that were not well suited to modeling gender as a structured source of variation. Moreover, contrastive stress remains entirely unexamined with respect to gender, representing an especially important gap given its central role in the pragmatic use of prosodic prominence.
In light of these gaps, the present study explicitly and systematically examined how women and men who speak American English employ pitch, amplitude, and duration to realize lexical, phrasal, and contrastive stress. Understanding whether gender shapes the acoustic realization of stress is important for theories of prosody because it bears directly on how prominence is produced, perceived, and modeled, and because empirical evidence to date is extremely limited. Unlike previous work where gender surfaced only incidentally, here gender is a central analytic focus, allowing us to characterize how prosodic stress is realized across groups rather than averaged over them. Building on prior evidence that women use pitch more dynamically than men, we expected systematic gender differences in how pitch, amplitude, and duration cues are weighted across stress types, specifically stronger pitch-based marking among women than men. To test these predictions, we expanded the sample size and applied up-to-date statistical and machine learning methods to assess the relative importance of each acoustic cue by gender and stress type.
Method
Participants
Thirty-six native English-speaking college students from the mid-Atlantic U.S. participated. Eighteen self-identified as women and 18 self-identified as men. None reported any impairments in vision, hearing, spoken or written language, learning, or other neuropsychological disorders.
Stimuli
Participants’ prosody was evaluated using Online Profiling Elements of Prosody in Speech Communication (O-PEPS-C; Knutsen et al., Reference Knutsen, Peppe and Stromswold2023), an online adaptation of PEPS-C (Peppé & McCann, Reference Peppé and McCann2003). Both versions include 14 subtests assessing comprehension and production of prosodic features, each with eight minimal-pair items. For example, the lexical stress subtest includes INsert and inSERT. All stimuli were presented in pseudorandom order. This study focuses on participants’ production of lexical, phrase, and contrastive stress.
Lexical stress was assessed by having participants read aloud bisyllabic words presented in isolation, with visual cues indicating the stressed syllable. For example, for the noun INsert, a large red circle appeared above the stressed syllable, and a small blue circle above the unstressed one. Phrase stress was evaluated using adjective-noun and compound noun minimal pairs embedded in sentences (e.g., The green house/greenhouse spoils the view). Orthographic spacing distinguished adjective-noun phrases (e.g., green house) from compound words (e.g., greenhouse).
Contrastive stress was assessed using a correction task in which participants corrected an announcer’s errors in a soccer match commentary involving cows and sheep. The announcer consistently misstated either the color or the type of animal, requiring participants to correct and emphasize the relevant word. For example, in a color-correction trial, the announcer said, “The red cow has the ball,” while a black cow was displayed. To receive credit, participants had to correct the error and emphasize the corrected color (e.g., No, the BLACK cow has the ball). In an animal-correction trial, the announcer said, “The red cow has the ball” while a red sheep was displayed. Here, participants had to correct and emphasize the animal term (e.g., No, the red SHEEP has the ball).
Experimental procedure
The experiment was conducted online via the web-based platform FindingFive (FindingFive Team, 2023) using participants’ own computers and microphones. The study was self-paced and allowed participants to repeat words or sentences until satisfied. Only the final productions were analyzed.
Annotation of production responses
Trained research assistants transcribed participants’ productions and annotated audio files using Praat (version 6.3.09; Boersma & Weenink, Reference Boersma and Weenink2023). Each stress type was annotated by a dedicated research assistant: one RA annotated all lexical stress trials, a second annotated all phrase stress files, and a third annotated all contrastive stress trials. This ensured that each RA applied a consistent segmentation protocol within a given stress type.
Lexical stress was annotated at both the word and syllable levels, while phrase and contrastive stress were annotated at the sentence and morpheme levels. Interval boundaries were placed for all words (phrase and contrastive stress) and for all syllables (lexical stress). The right-hand boundary of each interval was anchored at the onset of the following consonant, providing a consistent and replicable acoustic cue for segmentation. For stop consonants, boundaries were marked immediately after a spectrographic gap to capture the full closure phase. For voiceless fricatives, boundaries were placed at the first zero crossing within a noisy, aperiodic waveform region. The first author rechecked a random subset of trials from each stress type to confirm consistency and adherence to the annotation protocol.
Analytic overview
To address our research questions, we conducted four complementary analyses on the annotated productions. First, we examined mean prosodic contours to characterize pitch and amplitude trajectories across time. Second, we extracted pitch, amplitude, and duration measures from predefined Regions of Interest (ROIs) and used Bayesian ANOVAs to assess how these cues differed across trial type, interval, and accuracy (correct vs. incorrect). Third, we applied Random Forest Classification (RFC) to estimate the relative importance of each cue for distinguishing stress types. Finally, we used Bayesian mixed-effects regression to model how acoustic cues predicted human coders’ accuracy scores. These analyses use the same dataset but employ distinct statistical and methodological approaches appropriate to each research question.
Results
Pitch contour analyses
Participants’ productions, including both correct and incorrect trials, were analyzed using Praat, with pitch ranges set from 80–450 Hz for women and 30–400 Hz for men. To account for individual differences in baseline pitch, F0 semitone values were centered by subtracting each participant’s mean F0 within each stress condition (lexical, phrasal, contrastive). Centering within each stress condition removes baseline differences across conditions so that contours reflect how pitch changes within an utterance rather than shifts in overall pitch across conditions. This normalization ensured analyses focused on within-utterance pitch movement rather than between-speaker differences in overall pitch level. Normalized values were then averaged at each time step—that is, at regular intervals sampled from the Praat pitch object (every 10 ms for lexical stress items and every 25 ms for phrase and contrastive stress items). Standard error was calculated at each time step to capture variability across speakers.
For each stress condition, a priori ROIs were identified where acoustic differences were expected between stimulus types. Figures 1–3 show mean-centered semitone contours, with error ribbons (±1 SE) and ROIs indicated by vertical lines and shading. Contour plots include both correct and incorrect trials.
Lexical stress prosodic contours.
Note: Panels A and B show mean-centered F0 contours (in semitones) for lexical stress productions by women (n = 18) and men (n = 18), respectively. Red lines represent initial-syllable stress items (INsert); blue lines represent final-syllable stress items (inSERT). Shaded ribbons depict ±1 standard error across speakers. Vertical lines and shaded areas denote the ROIs corresponding to the first and second syllables of the target word. Pitch values were centered within each stress condition for each speaker, and contours include both correct and incorrect trials.

Phrase stress prosodic contours.
Note: Panels A and B show mean-centered F0 contours (in semitones) for phrase stress productions by women (n = 18) and men (n = 18), respectively. Red lines represent compound nouns (e.g., greenhouse); blue lines represent adjective-noun phrases (e.g., green house). Shaded ribbons depict ±1 standard error across speakers. Vertical lines and shaded areas denote the ROIs corresponding to the first and second morphemes of each construction. Pitch values were centered within each stress condition for each speaker, and contours include both correct and incorrect trials. Differences in total duration reflect the faster articulation of compound nouns relative to adjective–noun phrases.

Contrastive stress prosodic contours.
Note: Panels A and B show mean-centered F0 contours (in semitones) for contrastive stress productions by women (n = 18) and men (n = 18), respectively. Blue lines represent trials in which contrastive stress fell on the color word; red lines represent trials in which contrastive stress fell on the animal word. Shaded ribbons depict ±1 standard error across speakers. Vertical lines and shaded regions denote the ROIs corresponding to the color and animal words in the utterance. Pitch values were centered within each stress condition for each speaker, and contours include both correct and incorrect trials.

Lexical stress
The ROIs for lexical stress were the first and second syllables of the target word (e.g., in- and -sert). In women’s initial-syllable stress trials (e.g., INsert, Figure 1A, red line), pitch began around 2.5 semitones and steadily declined through the first syllable and into the second, reaching a low of −3.5 semitones before gradually rising back to 0 semitones by word offset. In contrast, men’s initial-stress trials (Figure 1B, red line) showed a more sustained plateau at 2 semitones during the first syllable, followed by a sharper pitch drop across the second syllable, reaching −4 semitones. Overall, men’s INsert-type contours featured a more abrupt pitch transition between syllables, while women’s contours exhibited a gradual decline.
In final-syllable stress trials (e.g., inSERT), women’s pitch contours (Figure 1A, blue line) started near 1 semitone and fluctuated slightly (±1 semitone) before dropping 3 semitones in the final quarter of the word. Men’s final-stress trials (Figure 1B, blue line) followed a different pattern: pitch began slightly below 0 semitones, remained flat through the first syllable, then rose sharply during the second syllable, peaking at 2 semitones before dipping slightly and rising again toward word offset. Overall, men’s rising contour for inSERT-type items contrasted with women’s more stable pitch patterns for these words.
Phrase stress
Figure 2 shows pitch contours for full sentences containing adjective-noun and compound word constructions. The ROIs were the morphemes (e.g., green and house) in both structures. Both women (Figure 2A) and men (Figure 2B) produced compound words (e.g., greenhouse, red line) 40–60% faster than in their phrasal counterparts (e.g., green house, blue line). Total duration measurements included any inter-word interval between words in the adjective-noun condition, though such intervals were not coded or analyzed separately. After adjusting for these durational differences, pitch contours for compound and adjective-noun trials were largely similar for both genders, indicating that duration, rather than pitch, distinguished the two structures. However, men exhibited more pronounced pitch peaks on the first morpheme and less pronounced pitch declines on the second morpheme compared to women.
Contrastive stress
Figure 3 shows pitch contours for full contrastive stress utterances, with color and animal words serving as ROIs. In color-stressed trials, pitch contours differed notably by gender in both shape and magnitude. For women (Figure 3A, blue line), pitch started around 1 semitone, rose steadily to 2 semitones, plateaued briefly, and then gradually declined to −1 semitone by the end of the color ROI. This smooth rise and fall continued into the animal ROI, where pitch remained between 0 and −1 semitones. In contrast, men’s color-stressed trials (Figure 3B, blue line) featured sharper, more exaggerated pitch shifts. Pitch began at 1 semitone, rose rapidly to 3 semitones in the latter third of the color ROI, then dropped steeply to −2 semitones by the end of the animal ROI. This suggests that men employed more abrupt and extreme pitch shifts to mark contrastive stress in color-stressed items, while women’s contours were more modulated and sustained.
In animal-stressed trials, gender differences were equally pronounced. For women (Figure 3A, red line), pitch gently rose from 1 to 2 semitones during the color ROI, then gradually declined, reaching 0 semitones by the end of the animal ROI. Men’s animal-stressed trials (Figure 3B, red line) showed sharper inflections, with pitch starting at 0 semitones in the color ROI, peaking at 3 semitones early in the animal ROI, and then dropping sharply back to 0 semitones by its offset. This rapid rise-and-fall pattern suggests a more dynamic and abrupt prosodic strategy in men’s speech, contrasting with women’s more gradual, rounded pitch movements. In summary, women’s contrastive stress trials were approximately 20% longer, and their pitch contours exhibited more gradual peaks, whereas men’s trials featured sharper, more abrupt peaks.
Bayesian ANOVAs of pitch, amplitude, and duration in regions of interest
The prosodic contours in Figures 1–3 combine data from speakers with different speech rates and utterances that varied phonemically and lexically. Since only utterance onsets were aligned, contours became increasingly noisy over time. To address this, trained research assistants—blind to trial type—hand-marked syllable (lexical stress) and morpheme (phrase and contrastive stress) onsets and offsets in the ROIs. These boundaries were used to determine syllable and morpheme durations.
To capture fine-grained pitch and amplitude changes within ROIs, each syllable or morpheme was divided into three equal-duration intervals. For example, in contrastive stress trials (red cow), red and cow were each divided into three intervals, with Praat extracting mean pitch and amplitude for all six intervals.
We used Bayesian ANOVAs to examine acoustic cue differences across stress types while quantifying the strength of the evidence for each effect. Unlike conventional frequentist ANOVAs, which rely on null-hypothesis significance testing and impose a fixed p-value threshold, Bayesian ANOVAs yield Bayes Factors (BF) which provide a graded, interpretable measure of how strongly the data support one model over another. This is especially valuable here because prosodic data often show small but consistent cue differences across ROIs, and Bayesian ANOVA allows us to evaluate evidence for or against the presence of such effects.
We conducted Bayesian ANOVAs in JASP v. 0.17.2 (JASP Team, 2023) to examine the acoustic cues men and women used to mark lexical, phrase, and contrastive stress. All trials (both correct and incorrect) were included, and women’s and men’s data were analyzed separately. In all ANOVAs, the dependent variable was the acoustic measure, the fixed factors were trial type and ROI portion, and the random factors were participant and item. Note that gender was not included as a factor in these Bayesian ANOVAs. Our focus in this analysis was on cue use across stress types, and including gender here would require a high-order model that is difficult to interpret and would obscure the central effects of interest. For pitch and amplitude ANOVAs, the ROI portions were the six intervals described above, while for duration ANOVAs, the ROI portions corresponded to the two syllables or morphemes. JASP’s default priors were used, and BFs were computed for model comparisons. Following Jeffreys (Reference Jeffreys1961), Bayes Factors (BF) > 3 were considered meaningful, and all figures display 95% credible intervals.
Lexical stress
For pitch, trial type (1st vs. 2nd syllable stressed) × interval ANOVAs revealed that, in the best-fitting models for both women (BF10 = 5.9 × 1028) and men (BF10 = 1.0 × 10¹¹), there was decisive evidence of main effects for trial type and interval, and the interaction between the two factors (all BFincl > 1 × 10⁶). In initial-stress words, pitch patterns were similar for women (Figure 4A) and men (Figure 4B), with a drop at the end of the first syllable followed by a slight rebound at the end of the second. However, in final-stress words, men’s pitch rose during the second syllable, whereas women’s pitch declined slightly. ANOVAs of amplitude revealed that, in the best-fitting models for both women (BF10 = 7.5 × 10200) and men (BF10 = 3.30 × 10179), there was decisive evidence of main effects of trial type and interval, and the interaction between the two (all BFincl = ∞), with the pattern being similar for women (Figure 4C) and men (Figure 4D). Finally, for syllable duration, the best-fitting model for women (BF10 = 1.2 × 10130, Figure 4E) and men (BF10 = 7.52 × 1094, Figure 4F) again included trial type, syllable number, and their interaction as factors (all BFincl > 3200). However, women showed a slightly greater difference in syllable duration between initial- and final-stress conditions.
Acoustics of lexical stress regions of interest.
Note: Panels A–F show acoustic measures extracted from ROIs for lexical stress productions by women (n = 18) and men (n = 18). White circles represent initial-syllable stress (e.g., INsert); black circles represent final-syllable stress (e.g., inSERT). Panels A and B display mean pitch (in semitones) across three equal-duration intervals within each syllable; Panels c and d display mean amplitude (in dB) for the same intervals; Panels e and f display syllable durations (in seconds). Error bars represent 95% credible intervals.

Overall, both men and women used pitch, amplitude, and duration to distinguish lexical stress types. However, subtle gender differences emerged: men’s pitch rose during the second syllable of final-stress words, while women’s pitch declined slightly, and women exhibited greater syllable duration contrasts between initial and final stress.
Phrase stress
For women, a trial type (compound/adjective-noun) × interval ANOVA of pitch revealed that the best-fitting model (BF10 = 2.58 × 1050) included trial type (BFincl = ∞), interval (BFincl = 32.1), and the interaction between the two (BFincl = 144.6, Figure 5A). This interaction reflects how early pitch patterns were similar across conditions, but in the final interval, 1-word compounds (white circles) showed a slight upward shift, whereas 2-word adjective-noun phrases (black circles) continued to decline (Figure 5A). This suggests that phrase stress influences pitch movement differently in compounds vs. adjective-noun phrases, particularly toward the end of the word/phrase. In contrast, the best-fitting model of men’s pitch (BF10 = 1.61 × 1039, Figure 5B) included only interval as a factor (BFincl = 1.77 × 10¹⁴).
Acoustics of phrase stress regions of interest.
Note: Panels A–F show acoustic measures extracted from ROIs for phrase stress productions by women (n = 18) and men (n = 18). White circles represent one-word compound nouns (e.g., greenhouse); black circles represent two-word adjective-noun phrases (e.g., green house). Panels a and b display mean pitch (in semitones) across three equal-duration intervals within each morpheme; Panels c and d display mean amplitude (in dB) for the same intervals; Panels e and f display total duration (in seconds) from the onset of the first ROI to the offset of the second. Error bars represent 95% credible intervals.

For amplitude, the presence of an interaction was reversed across genders. For women, the best-fitting model (BF10 = 5.17 × 1081, Figure 5C) included only interval (BFincl = 1.88 × 10¹⁴). In contrast, for men, the best-fitting model (BF10 = 6.86 × 10121) included trial type (BFincl = 17.2), interval (BFincl = 6.39 × 10¹³), and their interaction (BFincl = 95.4, see Figure 5D). This interaction reflects that while overall amplitude patterns for 1-word and 2-word stimuli followed a similar trajectory, differences emerged at the end of each morpheme, with lower amplitude in 2-word stimuli (black circles) compared to 1-word stimuli (white circles).
Because pauses between ROIs were more frequent in adjective-noun trials for both women (χ 2 (1, N = 288) = 47.09, p < .00001) and men (χ 2 (1, N = 286) = 22.34, p < .00001) we analyzed total duration from the onset of the first ROI to the offset of the second ROI (e.g., Green + [space] + House). ANOVAs with trial type (compound vs. adjective-noun) as the sole factor showed that the best-fitting model included trial type for both women (BF10 = 8.12 × 10⁵, Figure 5E) and men (BF10 = 3.05 × 10⁶, Figure 5F).
Overall, these results suggest that women and men use different combinations of acoustic cues to distinguish compound nouns from adjective-noun phrases. Women relied on pitch and duration but not amplitude, whereas men relied on amplitude and duration but not pitch.
Contrastive Stress
For pitch, trial type (color vs. animal stressed) × interval ANOVAs revealed that the best-fitting models for both women (BF10 = 5.26 × 1040, Figure 6A) and men (BF10 = 5.34 × 1054, Figure 6B) included main effects for trial type and interval, and their interaction (all BFincl = ∞). In animal-stressed trials (white circles), pitch patterns were similar for women (Figure 6A) and men (Figure 6B): relatively flat during the color word, then rising in the animal word before gradually declining. However, in color-stressed trials (black circles), women’s pitch dropped at the end of the color ROI, whereas men’s pitch drop was delayed until the middle of the animal ROI (Figure 6B).
Acoustics of contrastive stress regions of interest.
Note: Panels A–F show acoustic measures extracted from ROIs for contrastive stress productions by women (n = 18) and men (n = 18). White circles represent animal-stressed trials (e.g., red COW); black circles represent color-stressed trials (e.g., BLACK cow). Panels A and B display mean pitch (in semitones) across three equal-duration intervals within each ROI; Panels c and d display mean amplitude (in dB) for the same intervals; Panels e and f display ROI durations (in seconds). Error bars represent 95% credible intervals.

For amplitude, the best-fitting models for both women (BF10 = 1.76 × 10151) and men (BF10 = 1.44 × 10150) included main effects for trial type and interval, and their interaction (all BFincl = ∞). The overall pattern was similar across genders (Figures 6C and 6D): in color-stressed trials (black circles), amplitude was higher during the color word and lower during the animal word, while in animal-stressed trials (white circles), amplitude was lower in the color word but peaked in the animal word before declining.
For duration, the best-fitting model for both women (BF10 = 7.21 × 1041) and men (BF10 = 2.80 × 1052) again included main effects for trial type and interval, as well as their interaction (all BFincl = ∞). The pattern was highly similar for women and men (Figures 6E and 6F): in color-stressed trials (black circles), the color word was lengthened relative to the animal word, whereas in animal-stressed trials (white circles), the animal word was lengthened relative to the color word.
In summary, women and men exhibited similar acoustic patterns for contrastive stress, particularly in amplitude and duration. Descriptively, gender differences in pitch contours were observed: women’s pitch dropped earlier in color-stressed trials, while men’s pitch drop was delayed until the subsequent ROI. However, these gender differences were not tested directly in the statistical models. These findings suggest that, while contrastive stress patterns were largely similar across genders, the timing of pitch adjustments differed slightly.
Random forest classification
While the ANOVAs establish whether pitch, amplitude, and duration each contributed to stress marking, they do not assess the relative importance of these cues. To estimate how strongly speakers weighted each feature, we applied RFC separately for each stress type and gender. This design allowed us to obtain interpretable feature importance scores (IS) within each group rather than conducting a global gender classification. RFC is well-suited to these data because it can capture nonlinear cue relationships and interactions among acoustic cues, and it provides direct estimates of feature importance. Unlike linear discriminant analysis or standard regression, RFC does not assume linear separability or homogeneity of variance, making it appropriate for the complexity of natural speech data. In each RFC, trials were labeled by trial type (e.g., color-stressed vs. animal-stressed) and included measures of pitch, amplitude, and duration designed to capture differences between conditions.
To reduce dimensionality, pitch and amplitude were represented as a single signed difference score between the first and second ROI (ROI1–ROI2), preserving both the magnitude and direction of the cue rather than collapsing across absolute values. For example, in a color-stressed trial, if the color ROI had a mean pitch of 2.5 semitones and the animal ROI had a mean pitch of −1.0 semitones, the resulting difference score was +3.5 semitones, indicating a higher pitch in the color ROI. Conversely, in an animal-stressed trial, if the color ROI had a mean pitch of 1 semitone and the animal ROI had a mean pitch of 2.5 semitones, the difference score was −1.5 semitones, reflecting a higher pitch in the animal ROI.
For lexical and contrastive stress trials, RFC duration was calculated similarly to pitch and amplitude (e.g., color ROI duration – animal ROI duration). However, for phrase stress trials, RFC duration was measured from the onset of the first morpheme to the offset of the second, including any pauses. This approach captured both word-level timing and phrase-level temporal patterns, ensuring a comprehensive assessment of prosodic timing.
RFC was conducted using R 4.4.2 using the package randomForest v4.7.1.2 (Liaw & Wiener, Reference Liaw and Wiener2002). Each model was trained and tested using an 80/20 split of the data, stratifying splits by trial type, and iterated 100 times to ensure robustness and mitigate variability. Models were grown with ntree = 500 and mtry set to the default value. Because class distributions were balanced across trial types, no weighting or resampling was applied. Feature importance was assessed via the Mean Decrease Accuracy method, which quantifies the reduction in model accuracy when each feature is permuted, highlighting its contribution to classification (Breiman, Reference Breiman2001). Model performance was evaluated by computing mean accuracy across iterations, while feature IS reflected the impact of each feature on classification accuracy.
For lexical stress, the RFC correctly classified 80.8% (SE = 0.5) of women’s words as having syllable-initial or -final stress, with amplitude being the most important feature for classification (IS = 42.2, SE = 0.39), followed by duration (IS = 26.8, SE = 0.34), and pitch (IS = 14.5, SE = 0.34). For men, the RFC correctly classified the stress pattern of 84.8% (SE = 0.4) of words. As was the case for women, amplitude was the most important feature (IS = 65.9, SE = 0.35), followed by duration (IS = 14.0, SE = 0.34), and pitch (IS = 6.1, SE = 0.31). In both groups, amplitude and duration emerged as the most influential cues when producing lexical stress, with amplitude showing a stronger relative contribution in men’s productions.
For phrase stress, the RFC correctly classified 84.3% (SE = 0.5) of women’s phrases as being compound words (e.g., greenhouse) or adjective-noun sequences (e.g., green house), with the total duration from the onset of the first morpheme to the offset of the second morpheme being by far the most important acoustic feature for classification (IS = 89.4, SE = 0.43), with amplitude (IS = 3.52, SE = 0.24) and pitch (IS = 2.22, SE = 0.25) contributing little. The RFC correctly classified 90.3% (SE = 0.3) of men’s phrase stress trials, and again, total duration was the most important acoustic feature (IS = 101.0, SE = 0.51), with pitch (IS = 3.24, SE = 0.22) and amplitude (IS = 2.01, SE = 0.22) contributing little. In both groups, duration ranked far above the other cues, with a larger relative contribution in men’s productions.
For contrastive stress, RFC correctly classified 82.4% (SE = 0.5) of women’s contrastive stress trials as being color- or animal-stressed trials, with duration (IS = 32.4, SE = 0.30) and pitch (IS = 30.6, SE = 0.33) being somewhat more important for classification than amplitude (IS = 23.9, SE = 0.285). For men, RFC correctly classified 85.5% (SE = 0.4) of the contrastive stress trials, again with duration (IS = 37.3, SE = 0.31) and pitch (IS = 36.6, SE = 0.30) contributing more than amplitude (IS = 23.3, SE = 0.32). In both groups, all three features contributed to classification, with amplitude showing lower relative importance compared to pitch and duration.
As summarized in Table 1, the relative importance of pitch, amplitude, and duration varied by stress type: amplitude ranked highest for lexical stress, duration for phrase stress, and all three contributed to contrastive stress. RFCs also classified men’s utterances more accurately than women’s. Feature importance rankings were more evenly distributed across cues in women’s productions, whereas men’s productions showed a more cue-specific weighting pattern. However, RFCs assume participants always produce the intended stress. To evaluate how accurately stress was conveyed—and whether gender affected that accuracy—we turn to judgments made by trained human coders.
RFC model accuracies and importance scores

Note: Table shows RFC performance for lexical, phrase, and contrastive stress, reported separately for women (n = 18) and men (n = 18). Accuracy values are mean classification accuracies across 100 train-test iterations. Feature importance scores reflect the Mean Decrease Accuracy for pitch, amplitude, and duration, indicating each feature’s relative contribution to classification.
Gender and accuracy rates
Having established that men and women differ in how they use acoustic cues to convey stress, we next examined whether they also differ in how accurately they produce intended stress patterns. This analysis matters for two reasons. First, RFCs assume participants produced the correct stress on each trial—but this may not always be the case. Second, understanding whether men and women differ in accuracy, or in how they signal stress when making errors, can clarify the source of gender-based prosodic differences.
To assess accuracy, four trained research assistants—all native English speakers and blind to trial-type labels—independently coded each trial. For example, they classified lexical stress trials as stress-initial, ambiguous, or stress-final. Each coder’s response was then compared to the actual trial type and scored as follows: 0 = incorrect, 0.5 = ambiguous (coder was unsure), and 1 = correct (coder matched the trial type).
Across all coders and trials, 89.7% of trials were coded as correct, 7.7% as incorrect, and 2.7% as ambiguous. Mean accuracy across all coders and trials was 91.0%. We used the R package irr (Gamer et al., Reference Gamer, Lemon and Singh2012) to calculate inter-rater reliability, which was high (Krippendorff’s alpha = 0.83), indicating consistent judgments across raters and suggesting that misclassifications were concentrated on the same items rather than distributed randomly. Mean coder accuracy was used in subsequent analyses. Lexical, phrase, and contrastive stress accuracy were analyzed separately using gender × trial type Bayesian ANOVAs with participant and item as random factors. For all three stress types, the null model fit best, indicating no effects of trial type, gender, or their interaction. Table 2 presents accuracy rates for human coders and RFCs.
Mean accuracy rates for human coders and random forest classification

Note: Table shows mean accuracy rates for trained human coders and RFC across lexical, phrase, and contrastive stress trials for women (n = 18) and men (n = 18). Human coder accuracy reflects the mean proportion of correct judgments across four trained raters. RFC accuracy reflects mean classification accuracy across 100 train-test iterations using pitch, amplitude, and duration features.
Overall, human coders outperformed RFCs across all conditions, likely because they heard the entire utterance, while RFCs relied on a limited set of acoustic features from predefined ROIs. Unlike RFCs, which analyzed only mean pitch, amplitude, and duration differences between ROIs, human coders had access to finer-grained phonetic and prosodic details. This suggests that machine learning models may need richer acoustic inputs to approximate human perception more closely. While RFC accuracy showed some numerical variation by gender, no gender effects were found for human coder accuracy, and no statistical comparison between human and RFC performance was conducted. These observations should therefore be interpreted as descriptive.
Acoustic characteristics of ROIs in correct and incorrect trials
Although human coders judged men and women to be equally accurate in producing stress, gender differences may still exist in the acoustic cues human coders used for classification. For the present analyses, trials with a mean coder classification accuracy of ≤0.5 were considered incorrect, while all others were classified as correct. This resulted in 91.7% of trials being labeled as correct and 8.3% as incorrect at the trial level. As in the previous ANOVAs, we retained all trials to preserve natural production variability. Here, however, coder-determined accuracy (correct vs. incorrect) was additionally included as a factor, allowing us to test whether acoustic cue trajectories differed between correctly and incorrectly produced tokens. Although misclassified trials were a minority, they nonetheless provided a sufficient number of data points to examine how acoustic patterns differ between correctly and incorrectly produced stress trials. To investigate this, we conducted a series of 2 (trial type) × interval × accuracy (correct/incorrect) Bayesian ANOVAs, with participant and item as random factors. We focus our discussion on important interactions (BF > 3) among trial type, interval, and accuracy, as these indicate that an acoustic feature was used differently in correct vs. incorrect trials, depending on trial type.
Lexical stress
Pitch. The best-fitting model for women’s pitch (BF10 = 5.6 × 1048) included trial type, interval, accuracy, and all two- and three-way interactions (all BFincl = ∞), indicating that pitch pattern affected whether coders correctly identified words as having initial- or final-stress. Inspection of Figure 7A suggests a reversal in pitch patterns for trials that human coders labeled correct (i.e., the coders’ classification matched the target stress pattern; Figure 7A, left panel) vs. those that they labeled as incorrect (i.e., their classification did not match the target stress pattern, or they marked the trial as ambiguous; Figure 7A, right panel). Consistent with this, there was a strong interval × trial type interaction for both correct trials (BFincl = ∞) and incorrect trials (BFincl = 5290.375). This indicates that if the pitch of the first syllable was higher than the second syllable, human coders said the word was stress-initial.
Pitch of ROIs in correct and incorrect lexical stress trials.
Note: Panels show mean pitch (in semitones) across three equal-duration intervals for lexical stress productions by women (n = 18) and men (n = 18), separated by coder-determined accuracy. White circles represent initial-stress trials (e.g., INsert); black circles represent final-stress trials (e.g., inSERT). Left panels display trials that human coders classified as correct; right panels display trials coded as incorrect. Error bars represent 95% credible intervals.

In contrast, for men, the best-fitting model (BF10 = 1.4 × 10 1 1 ) did not include accuracy as a factor, nor did accuracy interact with trial type or interval, indicating that pitch was not used to differentiate between correct and incorrect trials. However, for men’s lexical stress trials that human coders correctly labeled (Figure 7B, left panel), there was the expected two-way interaction between trial type and interval (BFincl = 2.45 × 101 3), with higher pitches in early intervals for initial-stress trials and higher pitches in later intervals for final-stress trials. For men’s incorrect trials (Figure 7B, right panel), there was no consistent relationship between interval pitch and trial type (BFincl = 0.0).
Amplitude. For lexical stress amplitude, the best-fitting model for both women (BF10 = 1.8 × 10208) and men (BF10 = 1.9 × 10191) included trial type, interval, accuracy, and all two- and three-way interactions (all BFincl > 3 × 10+8). For women’s correctly classified trials (Figure 8A, left panel), amplitude patterns were clearly distinct for initial- vs. final-stress trials, with amplitude being higher in the first syllable for initial-stress trials, and higher in the second syllable for final-stress trials. This is reflected in a significant trial type × interval interaction (BFincl = ∞). However, for women’s incorrect trials (Figure 8A, right panel), there was no such interaction: only a main effect of interval (BFincl = ∞) with amplitude gradually decreasing over time. This suggests that when women misproduce lexical stress, amplitude no longer provides systematic cues to stress placement.
Amplitude of ROIs in correct and incorrect lexical stress trials.
Note: Panels show mean amplitude (in dB) across three equal-duration intervals for lexical stress productions by women (n = 18) and men (n = 18), separated by coder-determined accuracy. White circles represent initial-stress trials (e.g., INsert); black circles represent final-stress trials (e.g., inSERT). Left panels display trials that human coders classified as correct; right panels display trials coded as incorrect. Error bars represent 95% credible intervals.

For men’s correct lexical stress trials (Figure 8B, left panel), a trial type × interval interaction was also observed (BFincl = ∞), confirming that amplitude contributed to distinguishing initial- and final-stress words. However, for their incorrect lexical stress trials (Figure 8B, right panel), amplitude did not interact with accuracy, but two separate effects emerged: (1) a trial type effect, where final-stress trials (e.g., inSERT) were louder overall than initial-stress trials (e.g., INsert; BFincl = 3.25), and (2) an interval effect, where amplitude declined toward the end of the word (BFincl = 9.42 × 10¹¹).
Duration. The best-fitting model for duration in women’s lexical stress trials (BF10 = 3.5 × 10132) included trial type, ROI, accuracy, and all two- and three-way interactions (three-way interaction: BFincl = 2060), indicating that duration contributed to distinguishing correct from incorrect lexical stress productions. Women’s correct lexical trials (Figure 9A, left panel) exhibited the expected trial type × ROI interaction (BFincl = ∞): The first syllable was longer in initial-stress than final-stress words, and the second syllable was longer in final-stress words than initial-stress words. However, in women’s incorrect trials (Figure 9A, right panel), this differentiation was absent, with only a main effect of interval (BFincl = 2.51 × 10⁷). This suggests that syllable duration systematically cued stress placement in women’s correct productions but was not reliably maintained in incorrect trials.
Duration of syllables in correct and incorrect lexical stress trials.
Note: Panels show syllable durations (in seconds) for lexical stress productions by women (n = 18) and men (n = 18), separated by coder-determined accuracy. White circles represent initial-stress trials (e.g., INsert); black circles represent final-stress trials (e.g., inSERT). Left panels display trials that human coders classified as correct; right panels display trials coded as incorrect. Error bars represent 95% credible intervals.

For men’s lexical stress trials, the best-fitting model (BF10 = 17.5 × 1094) only included trial type, ROI, and the trial type × ROI interaction. However, as was true for women, there was a trial type × ROI interaction for men’s correct lexical trials (BFincl = ∞; see Figure 9A, left panel), confirming that syllable duration differentiated initial- and final-stress words in correct lexical trials. However, in men’s incorrect trials (Figure 9B, right panel), syllable duration did not interact with ROI, but a marginal trial type effect was observed (BFincl = 2.9), where final-stress words (e.g., inSERT) were slightly longer overall than initial-stress words. This suggests that for men, duration patterns were consistent in correct trials but followed a different, less stress-specific pattern in incorrect trials.
In summary, both women and men produced the expected pitch pattern in correct lexical stress trials. In incorrect trials, however, women reversed the pitch pattern, while men showed no consistent pattern. For amplitude, both genders followed expected patterns in correct trials. In incorrect trials, women showed no amplitude differences between stress-initial and stress-final words, while men produced incorrect stress-final words louder than stress-initial ones. For duration, both groups showed the expected syllable contrast in correct trials. In incorrect trials, women lacked this contrast, instead lengthening only the second syllable regardless of stress type. Men’s incorrect trials showed a trial-type effect, with final-stress words slightly longer overall. These results suggest that when lexical stress was correctly identified, women and men produced similar acoustic patterns—but in misclassified trials, gender differences emerged in how those errors manifested acoustically.
Phrase stress
Pitch. The best-fitting model for women’s phrase stress trials (BF10 = 2.6 × 1050) included only trial type, interval, and their interaction. The trial type × interval interaction was strong for correct trials (BFincl = 24.8, Figure 10A, left panel), and marginal for incorrect trials (BFincl = 2.9, Figure 10A, right panel), where the pitch dropped in the second ROI of adjective-noun trials and remained high in compounds. For men’s phrase stress trials, the best-fitting model (BF10 = 1.6 × 1039) included only an interval effect, with no effect of accuracy or trial type, nor any interactions. Critically, there was no main effect or interaction with phrase stress type in either men’s correct (Figure 10B, left panel) or incorrect (Figure 10B, right panel) trials.
Pitch of ROIs in Correct and incorrect phrase stress trials.
Note: Panels show mean pitch (in semitones) across ROIs for phrase stress productions by women (n = 18) and men (n = 18), separated by coder-determined accuracy. White circles represent one-word compounds (e.g., greenhouse); black circles represent two-word adjective–noun phrases (e.g., green house). Left panels display trials classified as correct by human coders; right panels display trials coded as incorrect. Error bars represent 95% credible intervals.

Amplitude. For amplitude, the best-fitting model for women’s phrase stress trials (BF10 = 5.2 × 1081) only included interval (BFincl = 3.6 × 10¹⁴), with no effect of accuracy or trial type, nor any interactions. Whereas for women’s correct trials (Figure 11A, left panel) only interval affected amplitude (BFincl = ∞), there was a trial type × interval interaction for women’s incorrect trials (BFincl = 115.5, Figure 11A, right panel), suggesting a more complex amplitude pattern that varied between compounds and adjective-noun phrases. For men, the best-fitting model (BF10 = 7.2×10121) only included trial type, interval, and the trial type × interval interaction. However, the best-fitting model for men’s correct phrase stress trials included trial type, interval, and their interaction (BFincl = 214.5, Figure 11B, left panel), with compounds exhibiting greater amplitude in the middle and final intervals. In men’s incorrect trials (Figure 11B, right panel), only an interval effect was observed (BFincl = 2.8 × 10⁶), indicating that amplitude varied over time but was not systematically linked to phrase stress type.
Amplitude of total ROIs in correct and incorrect phrase stress trials.
Note: Panels show mean amplitude (in dB) across ROIs for phrase stress productions by women (n = 18) and men (n = 18), separated by coder-determined accuracy. White circles represent one-word compounds (e.g., greenhouse); black circles represent two-word adjective-noun phrases (e.g., green house). Left panels display trials classified as correct by human coders; right panels display trials coded as incorrect. Error bars represent 95% credible intervals.

Duration. For phrase stress duration, we analyzed the total duration from the onset of the first morpheme (e.g., green) to the offset of the second morpheme (e.g., house) using trial type (compound/adjective-noun) × accuracy ANOVAs. For women, the best-fitting model (BF10 = 1.9 × 10²²) included trial type and accuracy, and a significant interaction between the two (all BFincl = ∞). In correct trials (Figure 12A, left panel), women’s compounds were shorter than adjective-noun phrases (BF10 =2.5 × 10⁷), confirming that duration differentiated phrase stress. However, in women’s incorrect trials (Figure 12A, right panel), there was no effect of trial type (BFincl = 0.54), suggesting that when coders misclassified women’s phrase stress trials, duration did not reliably distinguish compounds from adjective-noun phrases.
Duration of total ROIs in correct and incorrect phrase stress trials.
Note: Panels show total duration (in seconds) from the onset of the first morpheme to the offset of the second morpheme for phrase stress productions by women (n = 18) and men (n = 18), separated by coder-determined accuracy. Black circles represent correct trials; white circles represent incorrect trials. Error bars represent 95% credible intervals.

The best-fitting model for men’s phrase stress trials (BF10 = 2.3 × 10¹⁶) included trial type and accuracy, with a significant interaction (BFincl = 1.9 × 10¹⁰). In men’s correct trials (Figure 12B, left panel), adjective-noun phrases were longer than compounds (BFincl = 6.3 × 10⁶), mirroring the pattern observed for women. However, in men’s incorrect trials (Figure 12B, right panel), no effect of trial type was observed (BFincl = 0.8), again suggesting that when coders misclassified phrase stress, duration did not reliably distinguish compounds from adjective-noun phrases.
In summary, for pitch, women showed a trial type × interval interaction in both correct and incorrect phrase stress trials: compounds remained high in pitch, while adjective-noun phrases dropped in later intervals. In contrast, men’s pitch varied by interval position but did not clearly distinguish phrase stress types in either condition. For amplitude, women’s correct trials were driven by interval effects, while incorrect trials showed a more complex trial type × interval interaction. For men, compounds were louder in the middle and final intervals in correct trials; incorrect trials showed only general amplitude variation. Lastly, duration was the primary cue for phrase stress classification in correct trials for both genders, with compound words shorter and adjective-noun sequences longer. In incorrect trials, however, duration did not distinguish phrase types for either group, suggesting that coders misclassified phrase stress trials when a reliable durational cue was absent.
Contrastive stress
Pitch. For contrastive stress, the best-fitting model for women’s pitch (BF10 = 2.0 × 1067) included trial type, interval, accuracy, and all two- and three-way interactions (all BFincl = ∞). In women’s correct contrastive stress trials (Figure 13A, left panel), as expected, there was a trial type × interval interaction (BFincl = ∞), with higher pitch in the stressed word. However, in women’s incorrect trials (Figure 13A, right panel), the trial type × interval interaction was reversed (BFincl = 1.1 × 10⁷), meaning that productions that should have been color-stressed exhibited pitch patterns more typical of animal-stressed trials, and vice versa.
Pitch of ROIs in correct and incorrect contrastive stress trials.
Note: Panels show mean pitch (in semitones) across three equal-duration intervals for contrastive stress productions by women (n = 18) and men (n = 18), separated by coder-determined accuracy. Black circles represent color-stressed trials; white circles represent animal-stressed trials. Left panels display correctly classified trials; right panels display misclassified trials. Error bars represent 95% credible intervals.

For men, the best-fitting model (BF10 = 5.6 × 1054) included only trial type, interval, and their interaction. However, for men’s productions that were correctly classified, there was a trial type × interval interaction (BFincl = ∞, Figure 13B, left panel), indicating that men used pitch to mark contrastive stress. However, for men’s incorrect productions (Figure 13B, right panel), there was no trial type × interval interaction (BFincl = 0.98), suggesting that pitch did not vary systematically in men’s misclassified contrastive stress trials.
Amplitude. The best-fitting model for women (BF10 = 1.4 × 10155) and men (BF10 = 3.0 × 10151) included trial type, interval, accuracy, and all two- and three-way interactions (three-way interaction: BFincl = 8.9 × 10⁴ for women and 266 for men), indicating that amplitude contributed to differentiating correct from incorrect contrastive stress productions for both genders.
For women’s correct trials, the expected trial type × interval interaction was observed (BFincl = ∞, Figure 14A, left panel), with amplitude being greater in the color ROI for color-stressed trials and amplitude being greater in the animal ROI for animal-stressed trials. In women’s incorrect trials (Figure 14A, right panel), there was a marginal trial type × interval interaction (BFincl = 2.9), with animal-stressed trials being louder than color-stressed trials in the color ROI. In men’s correct trials (Figure 14B, left panel), there was the same trial type × interval interaction (BFincl = ∞) that was observed for women’s correct trials. However, in men’s incorrect trials (Figure 14B, right panel), only an interval effect was observed (BFincl = 3.3 × 10⁶), with greater amplitude in the first two intervals across both stress conditions. This suggests that, unlike women, men’s incorrect trials did not retain any systematic loudness contrast between color- and animal-stressed trials.
Amplitude of ROIs in correct and incorrect contrastive stress trials.
Note: Panels show mean amplitude (in dB) across three equal-duration intervals for contrastive stress productions by women (n = 18) and men (n = 18), separated by coder-determined accuracy. Black circles represent color-stressed trials; white circles represent animal-stressed trials. Left panels display correctly classified trials; right panels display misclassified trials. Error bars represent 95% credible intervals.

Duration. For contrastive stress, the best-fitting model for both women (BF10 = 6.1 × 1047) and men (BF10 = 1.3 × 1059) included trial type, ROI, accuracy, and all two- and three-way interactions (three-way interaction: BFincl = 8.1 × 10⁶ for women, 5.3 × 10⁷ for men), indicating that duration systematically varied across conditions. For women’s correct contrastive stress trials (Figure 15A, left panel), the expected trial type × ROI interaction was observed (BFincl = ∞), with color-stressed trials exhibiting longer durations for the color word and animal-stressed trials exhibiting longer durations for the animal word, and for their incorrect trials, there was marginal evidence that this pattern was reversed (BFincl = 2.6, Figure 15A, right panel). For men’s correct trials (Figure 15B, left panel), the expected trial type × ROI was also observed (BFincl = ∞). However, in men’s incorrect trials (Figure 15B, right panel), only an ROI effect was observed (BFincl = 3.6), with the second word being longer, regardless of stress condition.
Duration of morphemes in correct and incorrect contrastive stress trials.
Note: Panels show mean durations (in seconds) for the two morphemes (color word, animal word) in contrastive stress productions by women (n = 18) and men (n = 18), separated by coder-determined accuracy. Black circles represent color-stressed trials; white circles represent animal-stressed trials. Left panels display correctly classified trials; right panels display misclassified trials. Error bars represent 95% credible intervals.

In summary, women systematically used pitch, amplitude, and duration in both correct and misclassified trials, with misclassified trials exhibiting the reversed pattern of correctly classified trials. In contrast, while men used these cues to signal contrastive stress in correctly classified trials, they did not systematically vary any acoustic feature in misclassified trials.
Bayesian mixed-effects regression analyses of accuracy
While ANOVAs allow us to examine how pitch, amplitude, and duration differ between correct and incorrect trials, they do not reveal the relative importance of these features in determining whether human coders correctly identified stress patterns. Bayesian mixed-effects regression provides a flexible framework for this analysis by modeling continuous accuracy scores, accommodating inter-speaker and inter-item variability, and estimating cue effects while accounting for uncertainty rather than relying on threshold-based significance tests.
All Bayesian mixed-effects regression models were fit in R 4.4.2 using brms v2.22.0 (Bürkner, Reference Bürkner2017). Informative priors were derived from coefficient estimates of a frequentist linear model fit to the same data. Two chains were run with 2,000 iterations each (1,000 warmup). Random intercepts were included for participant and item. BFs were computed with bayestestR v0.16.1. BF thresholds followed Jeffreys (Reference Jeffreys1961): BF > 3 indicates moderate evidence, BF > 10 strong evidence, and BF > 30 very strong evidence. Separate models were fit for women and men.
These regression models differed from the previous accuracy ANOVAs in two key ways. First, rather than binning accuracy scores into 0 (mean coder rating ≤ 0.5) or 1 (mean coder rating > 0.5), the regression models used the actual mean coder ratings. Second, rather than using the mean values for ROI intervals, the models incorporated the same difference measures of pitch, amplitude, and duration used in RFC analyses, with all values transformed into z-scores to ensure comparability across acoustic measures.
In the regression analyses (Table 3), a main effect of an acoustic feature indicates that the feature influenced accuracy ratings consistently across both trial types. For example, the main effect of pitch on women’s lexical stress accuracy means that lexical items produced at lower pitch were generally rated as less accurate, regardless of trial type. Conversely, an interaction between an acoustic feature and trial type means that the feature influenced accuracy differently depending on trial type. For example, the interaction between pitch and trial type for women’s lexical stress accuracy suggests that pitch had a different effect on accuracy for one trial type compared to the other. Given their relevance to stress perception across conditions, we focus our discussion on feature–trial type interactions with BF > 3, as these provide the most meaningful insights into how acoustic cues shaped coder judgments.
Bayesian mixed effects regression model of participants’ mean accuracy scores for trials

Note: Table displays results from Bayesian mixed-effects regression models predicting mean coder accuracy ratings for each trial. Separate models were fit for women (n = 18) and men (n = 18). An asterisk (*) indicates an interaction. NA indicates a predictor had a BF < 3. CI = 95% credible interval.
The R2 for women’s lexical stress was 0.51, meaning the model accounted for 51% of the variance in coders’ accuracy ratings. Pitch, amplitude, and duration all interacted with trial type, with amplitude and pitch playing a greater role than duration. In initial-stress lexical trials (e.g., INsert), the first syllable’s pitch, amplitude, and duration were higher than the second syllable’s, with greater differences in trials rated as highly accurate. In final-stress trials (e.g., inSERT), the pattern was reversed for all three acoustic features. For men’s lexical stress, the R 2 was 0.41, with amplitude–trial type and duration–trial type interactions similar to those seen in women’s speech, but no pitch–trial type interaction. These findings indicate that women use all three acoustic features to convey lexical stress, whereas men only use amplitude and duration.
For phrase stress, women’s R 2 was 0.26, and men’s R 2 was 0.15. For both genders, only duration interacted with trial type, with longer total durations being associated with higher accuracy scores for adjective-noun trials and lower accuracy scores for compounds.
The R 2 for women’s contrastive stress was 0.53. For women’s color-stressed trials, the color word’s pitch, amplitude, and duration were all generally higher than the animal word’s, with the difference being greater for trials with high accuracy ratings. For women’s animal-stressed lexical trials, the converse was true. While women used all three features to indicate what word was being contrasted, pitch was a particularly salient clue for contrastive stress. The R 2 for men’s contrastive stress was 0.43. Unlike women, who relied heavily on pitch, men did not use pitch to signal contrastive stress type. Instead, they relied solely on amplitude and duration, following the same pattern as women for those two features.
Overall, the Bayesian regression models better predicted accuracy for lexical and contrastive stress than for phrase stress. These models also showed that pitch contributed more to signaling lexical and contrastive stress for women than for men. Additionally, while the models predicted women’s accuracy slightly better than men’s, human coder accuracy (Table 2) showed a different pattern: coders classified phrase and contrastive stress trials more accurately than lexical ones, and men’s productions were classified slightly more accurately than women’s across all stress types.
Although ANOVA results showed no significant differences in overall accuracy by gender or stress type, both ANOVAs and regression analyses revealed gender differences in the acoustic features linked to correct classifications. This suggests that while men and women were similarly accurate overall, they may have used different prosodic strategies—differences that influenced both model predictions and human perception.
Discussion
The present study investigated how women and men who speak American English use pitch, amplitude, and duration to realize lexical, phrasal, and contrastive stress. We focused on two questions: First, how acoustically similar are different linguistic types of stress? Second, are there gender differences in how stress is acoustically realized? Overall, across analyses, stress emerged as a multidimensional phenomenon with speakers coordinating multiple acoustic cues, and gender differences reflecting how these cues were weighted rather than whether they were used.
The acoustic correlates of stress: distinct or overlapping?
For both men and women, the acoustic cues used to signal stress varied systematically by stress type. Consistent with prior work, all three acoustic cues—pitch, amplitude, and duration—contributed to lexical stress (e.g., Fry, Reference Fry1958; Huss, Reference Huss1978; Lieberman, Reference Lieberman1960; Sereno & Jongman, Reference Sereno and Jongman1995) and contrastive stress (e.g., Bolinger, Reference Bolinger1961; Breen et al., Reference Breen, Fedorenko, Wagner and Gibson2010; Cooper et al., Reference Cooper, Eady and Mueller1985; Katz & Selkirk, Reference Katz and Selkirk2011). Lexical stress relied most strongly on amplitude, followed by duration and pitch, whereas contrastive stress relied more heavily on duration and pitch, with amplitude contributing less. In contrast, phrase stress was overwhelmingly signaled by duration, with pitch and amplitude contributing only minimally. This pattern differs from that of Morrill (Reference Morrill2012), who reported amplitude as the primary cue for distinguishing compounds from phrases. The discrepancy likely reflects differences in prosodic context rather than true differences in cue use. Morrill embedded stimuli in four distinct intonational environments (subject position, clause-final, statement-final, and question-final), each of which introduces well-documented effects on intensity due to boundary tones, phrase-final lengthening, and accent placement. As a result, amplitude in Morrill’s study may reflect not only prominence but also environment-specific prosodic adjustments. By contrast, the present study used strict minimal pairs placed in a consistent sentence position, removing boundary and intonational confounds. Under these controlled conditions, duration emerged as the most reliable cue to phrase stress, suggesting that temporal patterning provides the primary signal to phrase-level prominence when prosodic environments are held constant.
Amplitude nonetheless played a central role in lexical and contrastive stress across genders. Even when duration and pitch provided strong information, amplitude reliably differentiated stressed from unstressed syllables, indicating that it supports prominence at both local and global levels. This aligns with accounts in which the amplitude envelope serves as a core suprasegmental carrier of prosodic structure: amplitude modulations track prosodic units and prominence relations across multiple timescales, from stressed syllables to prosodic words and phrasal domains (Frota et al., Reference Frota, Vigário, Cruz, Hohl and Braun2022). In this broader framework, amplitude contributes not merely as a localized intensity “boost” but as part of the hierarchical organization of prominence. The stability of amplitude across lexical and contrastive contexts in the present study is therefore consistent with proposals that amplitude envelopes reflect prosodic structure.
Gender differences and similarities in stress production
Prosody sits at the intersection of social meaning and linguistic structure, yet it remains underexamined in language and gender research, especially with respect to the acoustic realization of stress. Much foundational work on gendered language use, from Jespersen’s early deficit-based characterizations to Lakoff’s account of gendered linguistic constraint, focused primarily on lexical, syntactic, or discourse-level features, leaving prosody and prosodic stress largely unexamined.
In the present study, men and women produced stress with comparable overall accuracy, but they differed in the acoustic strategies that supported that accuracy. For lexical stress, both genders used amplitude and duration, but women additionally used pitch, consistent with broader findings that women employ pitch more dynamically. This contrasts with Koffi and Mertz’s (Reference Koffi and Mertz2018) original interpretation, which claimed that women relied primarily on amplitude and men on pitch. However, our reanalysis of their raw data shows a different pattern: both genders used all three cues to mark lexical stress, with amplitude carrying the greatest weight, and pitch and duration contributing to a similar degree for men and women alike.Footnote 2
For phrase stress, gender differences were minimal: both men and women relied primarily on duration to distinguish compounds from adjective-noun phrases, with only weak evidence for supplementary pitch or amplitude modulation. This pattern contrasts with findings from related prominence-marking domains. Plag (Reference Plag2006), for instance, reported that women produced larger pitch excursions than men when marking stress in noun-noun compounds. Although both studies examine prominence in structurally similar contexts, several methodological differences likely account for the disparity in gender effects.Footnote 3
Clearer gender contrasts emerged in contrastive stress. Although both groups used all three cues, women once again relied more heavily on pitch, while men favored amplitude and duration, a pattern consistent with sociolinguistic accounts in which women deploy pitch dynamically as part of broader expressive or interactional repertoires (Jiang, Reference Jiang2011; Munson & Babel, Reference Munson and Babel2007; Papeleu et al., Reference Papeleu, Leyns, Tomassen, T’Sjoen, Van Lierde and D’haeseleer2025; Schmid & Bradley, Reference Schmid and Bradley2019; Zimman, Reference Zimman2018).
Accuracy patterns also showed gendered cue integration differences. In correctly classified lexical and contrastive trials, women distinguished stress using coherent pitch and duration patterns, whereas men marked these contrasts primarily through amplitude and temporal adjustments. In misclassified trials, women showed systematic reversals in pitch and duration, while men’s pitch remained largely uninformative, yielding flatter and less differentiated patterns. Together, these results indicate that gender differences arise not from overall success in producing stress, but from distinct cue integration strategies for realizing prominence.
More broadly, these findings speak to long-standing debates about gendered speech. Historically, accounts of gender differences often framed women’s prosody in deficit terms (e.g., Jespersen), whereas later work—ranging from Lakoff’s analysis of gendered linguistic practice to sociolinguistic research demonstrating women’s leadership in sound change (e.g., Labov, Reference Labov1990)—emphasizes gendered variation as a resource for social meaning rather than a marker of deficiency. This view is reinforced by broader evidence that gendered speech patterns reflect learned interactional norms and culturally embedded styles rather than biological constraints (Munson, Reference Munson2007; Wodak & Benke, Reference Wodak and Benke2017). Thus, we would argue that our findings align with sociolinguistic accounts that frame gendered speech not as a deficit or divergence from a norm, but as structured variation in how linguistic and communicative resources are deployed.
Methodological contributions
This study advances prosodic stress research both through its experimental design and its analytic framework. By combining a larger sample of participants with reliable online speech production methods, we demonstrate that prosodic production can be studied effectively outside traditional laboratory settings. Our multimethod analytic approach, integrating Bayesian ANOVAs, Bayesian mixed-effects regression, and RFC, captures complementary aspects of cue weighting that would be difficult to detect with any single method. Together, these tools reveal prosodic prominence as a coordinated, multidimensional phenomenon, consistent with accounts emphasizing cue integration across temporal and spectral domains (e.g., Bruggeman et al., Reference Bruggeman, Włodarczak and Wagner2025; Grice & Kügler, Reference Grice and Kügler2021).
A further contribution comes from directly comparing computational models with human perceptual judgments. Human coders consistently outperformed Random Forest models across stress types. This likely reflects the fact that coders had access to full temporal and linguistic detail, whereas the RFC models were trained only on mean acoustic differences extracted from fixed ROIs. Coders could integrate finer-grained timing, adapt to speaker-specific patterns, and use lexical and phonological contexts, capacities central to human language processing but absent in our machine-learning approach. These contrasts highlight both the promise and limitations of computational models of prosody and underscore the importance of incorporating distributed, context-sensitive information into future models. They also speak to applied domains such as speech-to-text, language learning technologies, and text-to-speech voice design, where accurate modeling of prosodic prominence is essential.
Strengths, limitations, and future directions
A key strength of this study is the combination of a large, relatively homogeneous participant sample with tightly controlled minimal pair stimuli, which enabled precise comparisons across stress types. Using online speech production allowed us to collect reasonably high-quality acoustic data from a broader group of speakers than is typically feasible in laboratory prosody research. The viability of this approach, despite variability in participants’ recording setups, demonstrates the promise of remote, online designs for studying prosody at scale.
These same features introduce limitations. Minimal pairs isolate prosodic contrasts but may not capture the full variability of stress in spontaneous speech, where discourse context and pragmatics shape cue use. Likewise, while online recording increases accessibility and may promote more natural speech, it reduces control over acoustic precision, particularly for amplitude. Such trade-offs between ecological validity and experimental control are common in language research, and future work integrating laboratory and remote methods will help balance these competing demands.
A further limitation concerns production versus perception. Because human coders drew on far richer acoustic and linguistic information than was available to our machine-learning models, we cannot fully disentangle which cues speakers produced from those listeners relied on in making their judgments. Our analyses focused on pitch, amplitude, and duration, but other correlates such as vowel quality and spectral tilt also contribute to stress and may vary systematically across speakers. Future work incorporating a broader acoustic feature set, along with models trained on full acoustic detail (e.g., state-of-the-art speech-to-text models such as OpenAI’s Whisper), may help clarify how speakers distribute prosodic cues and how listeners interpret them. Expanding participant populations to include a wider range of gender identities, diverse linguistic backgrounds, and clinical groups will further illuminate how prosodic cue weighing is shaped by social, cognitive, and biological factors.
Beyond these methodological considerations, the present findings inform broader theories of gendered speech. The gendered cue-weighting patterns we observe align with sociolinguistic accounts in which gender functions as a stylistic and interactional resource rather than a biological constraint. This perspective also raises questions about how these patterns are perceived. Women’s more dynamic pitch use, for example, may contribute to stereotypes of “stridency,” whereas men’s lower reliance on pitch may align with expectations of neutrality or assertiveness (Daly & Warren, Reference Daly and Warren2001; Munson & Babel, Reference Munson and Babel2007; Papeleu et al., Reference Papeleu, Leyns, Tomassen, T’Sjoen, Van Lierde and D’haeseleer2025; Schmid & Bradley, Reference Schmid and Bradley2019). These perceptual biases also have implications for applied contexts such as gender-affirming voice training for transgender and gender-fluid speakers (e.g., Adessa et al., Reference Adessa, Weston, Ruthberg and Bryson2023; Leyns et al., Reference Leyns, Alighieri, De Wilde, Van Lierde, T’Sjoen and D’haeseleer2022; Södersten et al., Reference Södersten, Oates, Sand, Granqvist, Quinn, Dacakis and Nygren2024).
These gendered cue-weighting patterns also have practical implications for technologies that depend on accurate modeling of prosodic prominence. Recent work shows that automatic speech recognition (ASR) systems, such as Whisper, struggle with prosodic stress unless they are explicitly fine-tuned on stress-labeled data. Importantly, models trained separately for different speaker groups —including gender-specific models—achieve higher accuracy than generic models, although the black-box architecture of these systems limits our ability to determine which acoustic cues the model uses to achieve this improvement (Sohn et al., Reference Sohn, Knutsen and Stromswold2025a, Reference Sohn, Knutsen and Stromswold2025b). Incorporating gender-specific and stress-type-specific acoustic patterns into speech-to-text and text-to-speech systems may therefore improve both recognition accuracy and the naturalness of synthetic speech. These findings further speak to ESL pedagogy, where explicit instruction on the differing acoustic profiles of lexical, phrase, and contrastive stress may help learners acquire more native-like prosodic patterns across genders and language backgrounds.
Conclusion
Our results show that stress in American English is realized through coordinated variation in pitch, amplitude, and duration, and that gender shapes how these cues are balanced across lexical, phrasal, and contrastive contexts. The gendered cue-weighting patterns observed here—particularly women’s more dynamic pitch use—are consistent with sociolinguistic approaches that view gendered expression as a flexible stylistic resource rather than a categorical difference in prosodic ability. These findings extend existing work on gender and language by demonstrating that prosodic stress, like lexical, syntactic, and discourse-level features, participates in structured variation. By addressing an understudied area, particularly regarding contrastive stress, this study offers a more fine-grained picture of how speakers use prosody to construct meaning, identity, and communicative intent in real-world communication.
Acknowledgments
This material is based upon work supported by the National Science Foundation under Grant No. BCS-2324598. Additional support was provided by discretionary research funds from Rutgers University–New Brunswick. We thank the members of the Rutgers University Language Acquisition and Processing Lab for their assistance with data collection and coding.
Replication package
The analysis code, processed data, and derived acoustic measures used in this study are available via the Open Science Framework at the following link: https://osf.io/ty27m/.
Competing interests
The authors declare no conflicts of interest.

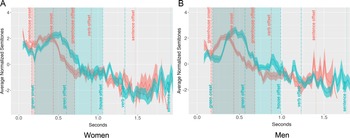
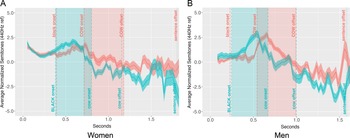
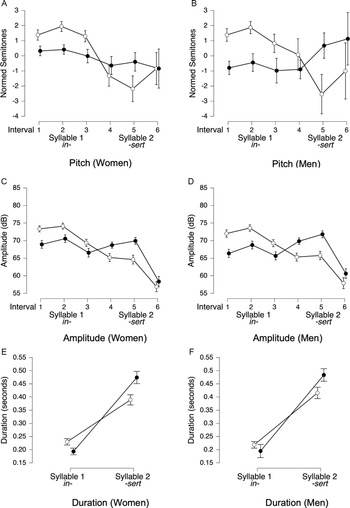

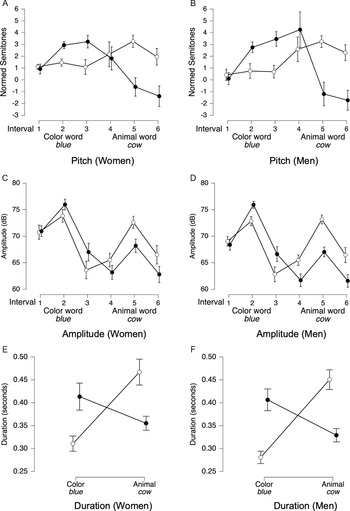
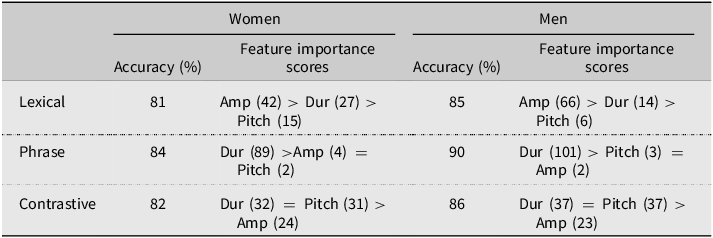
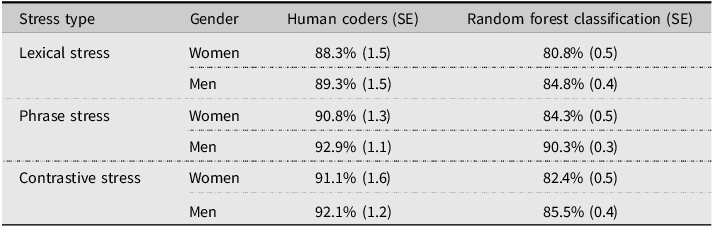
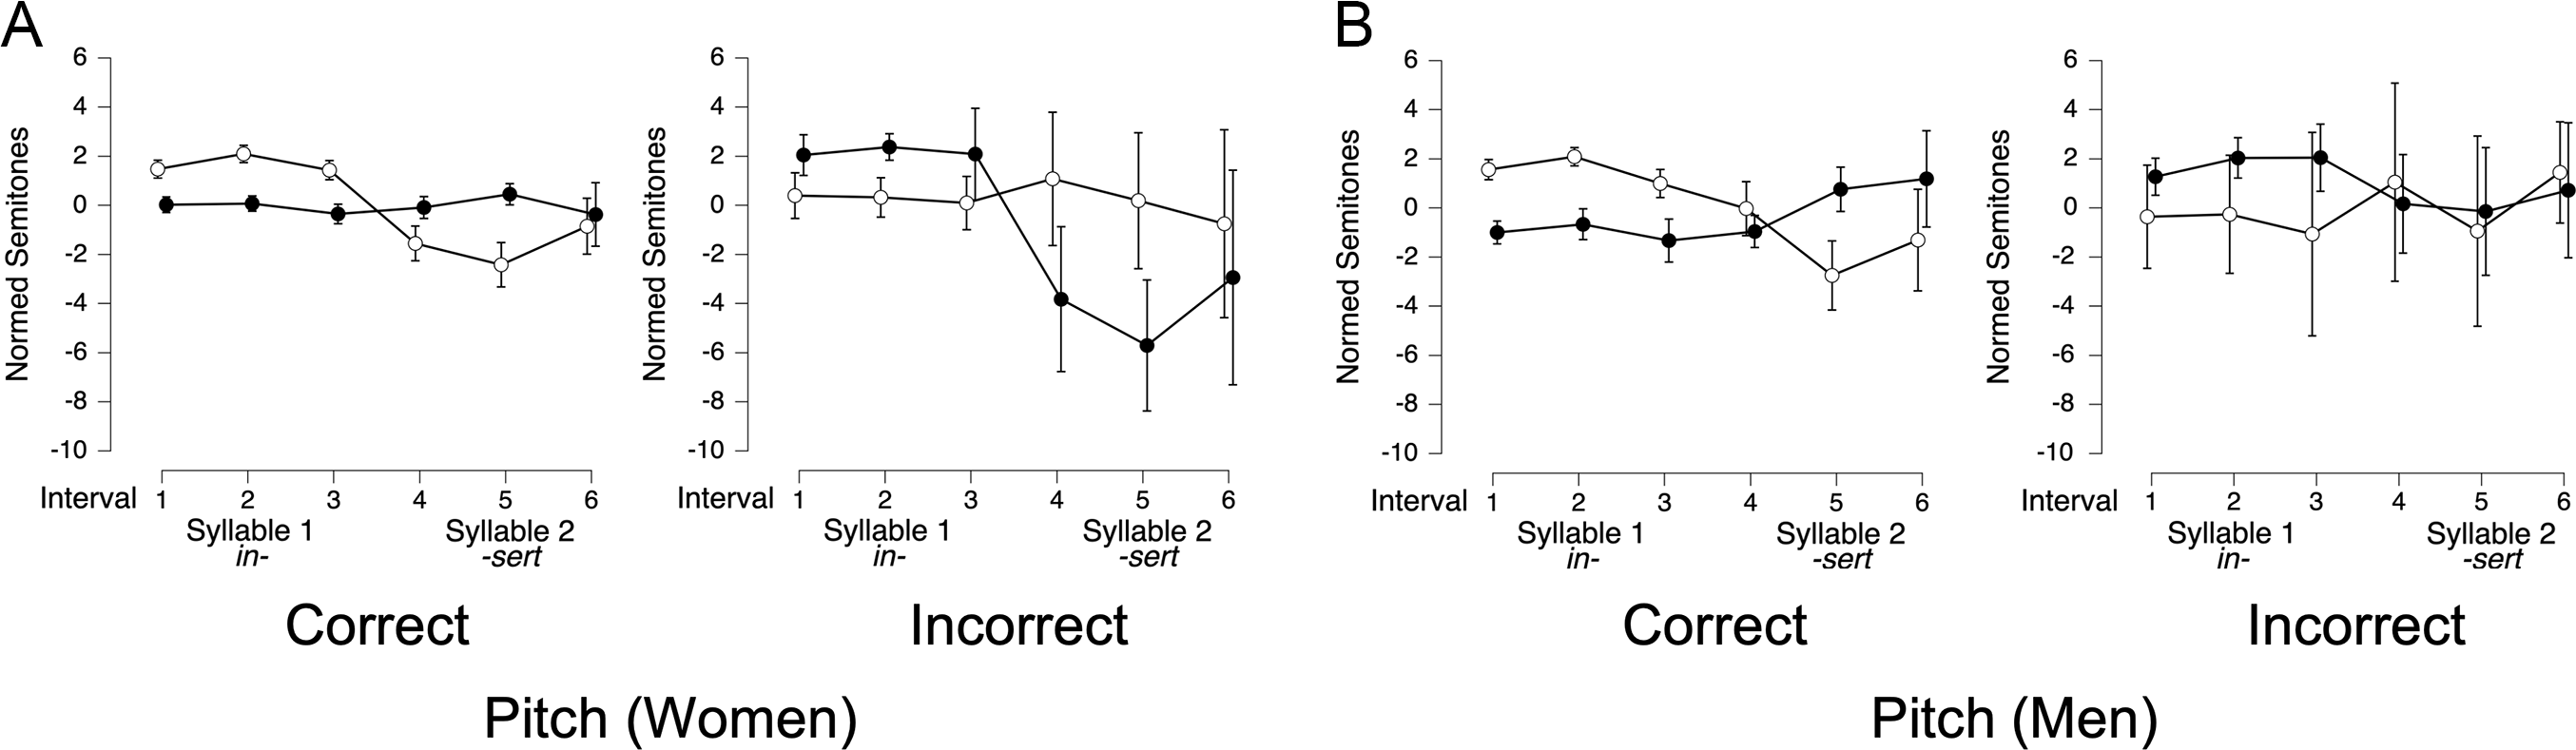
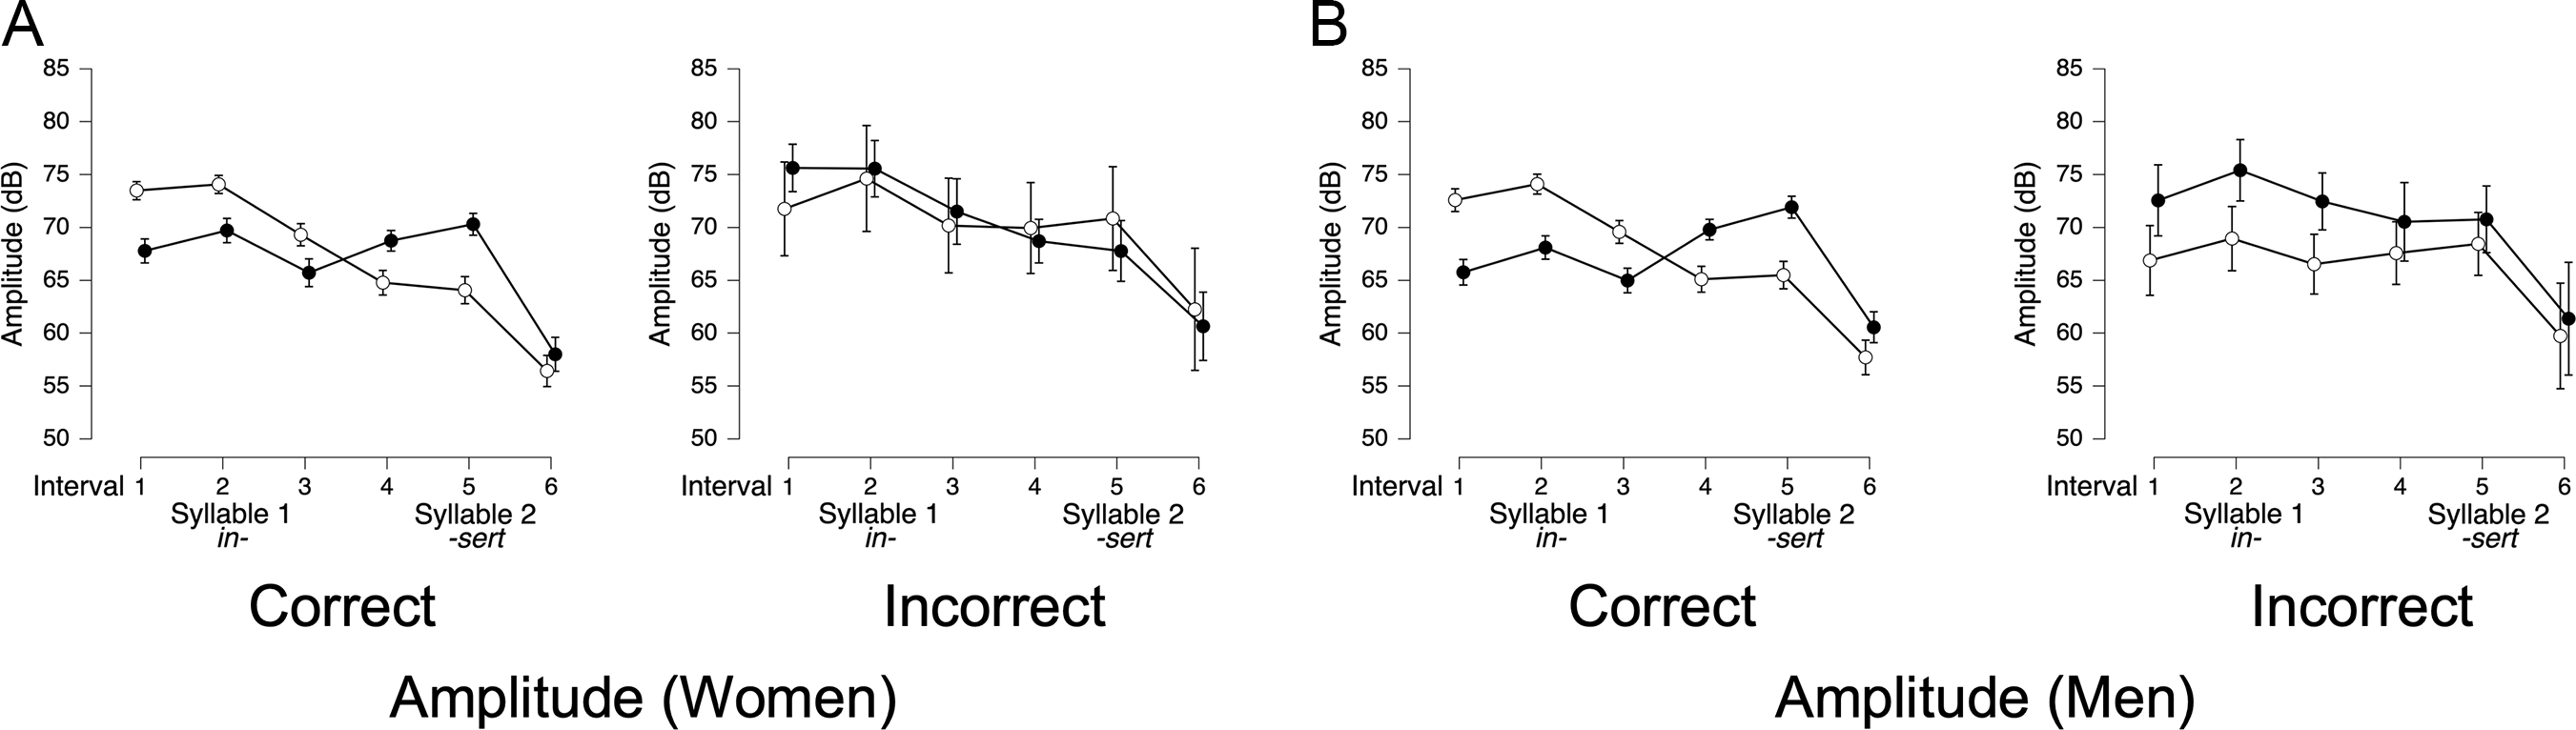
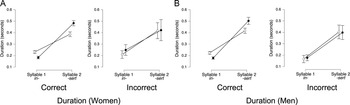
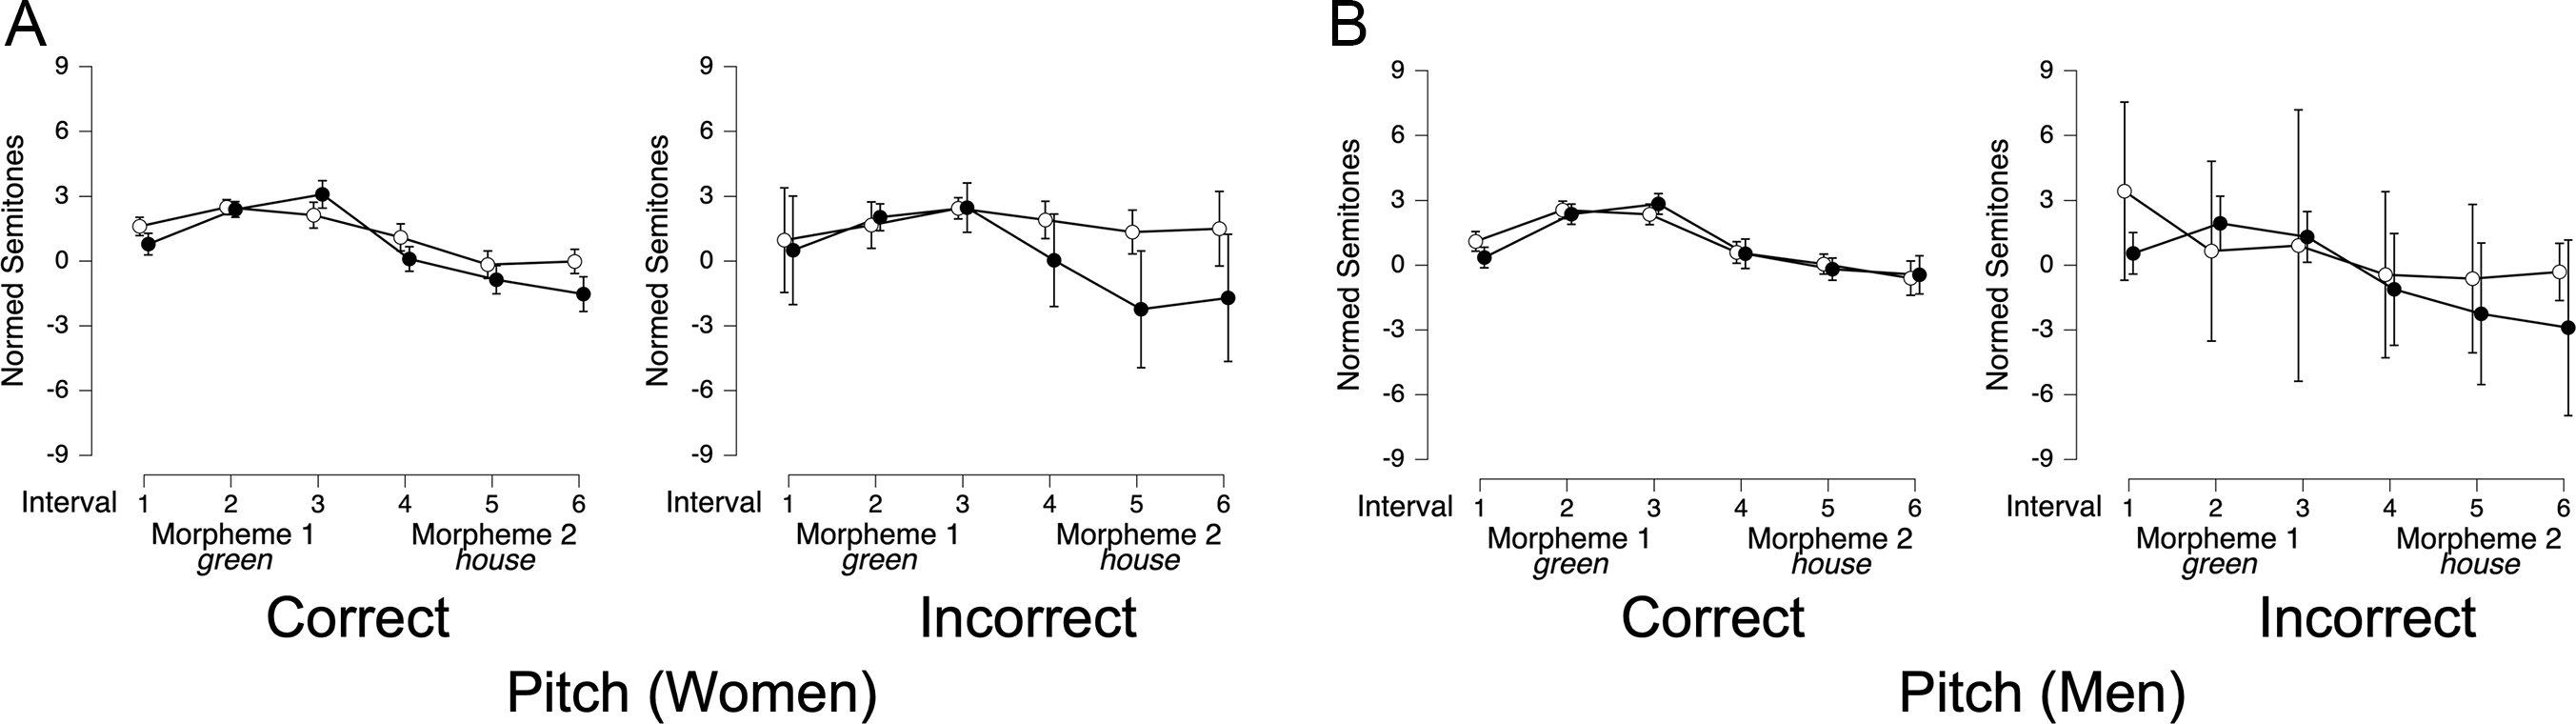
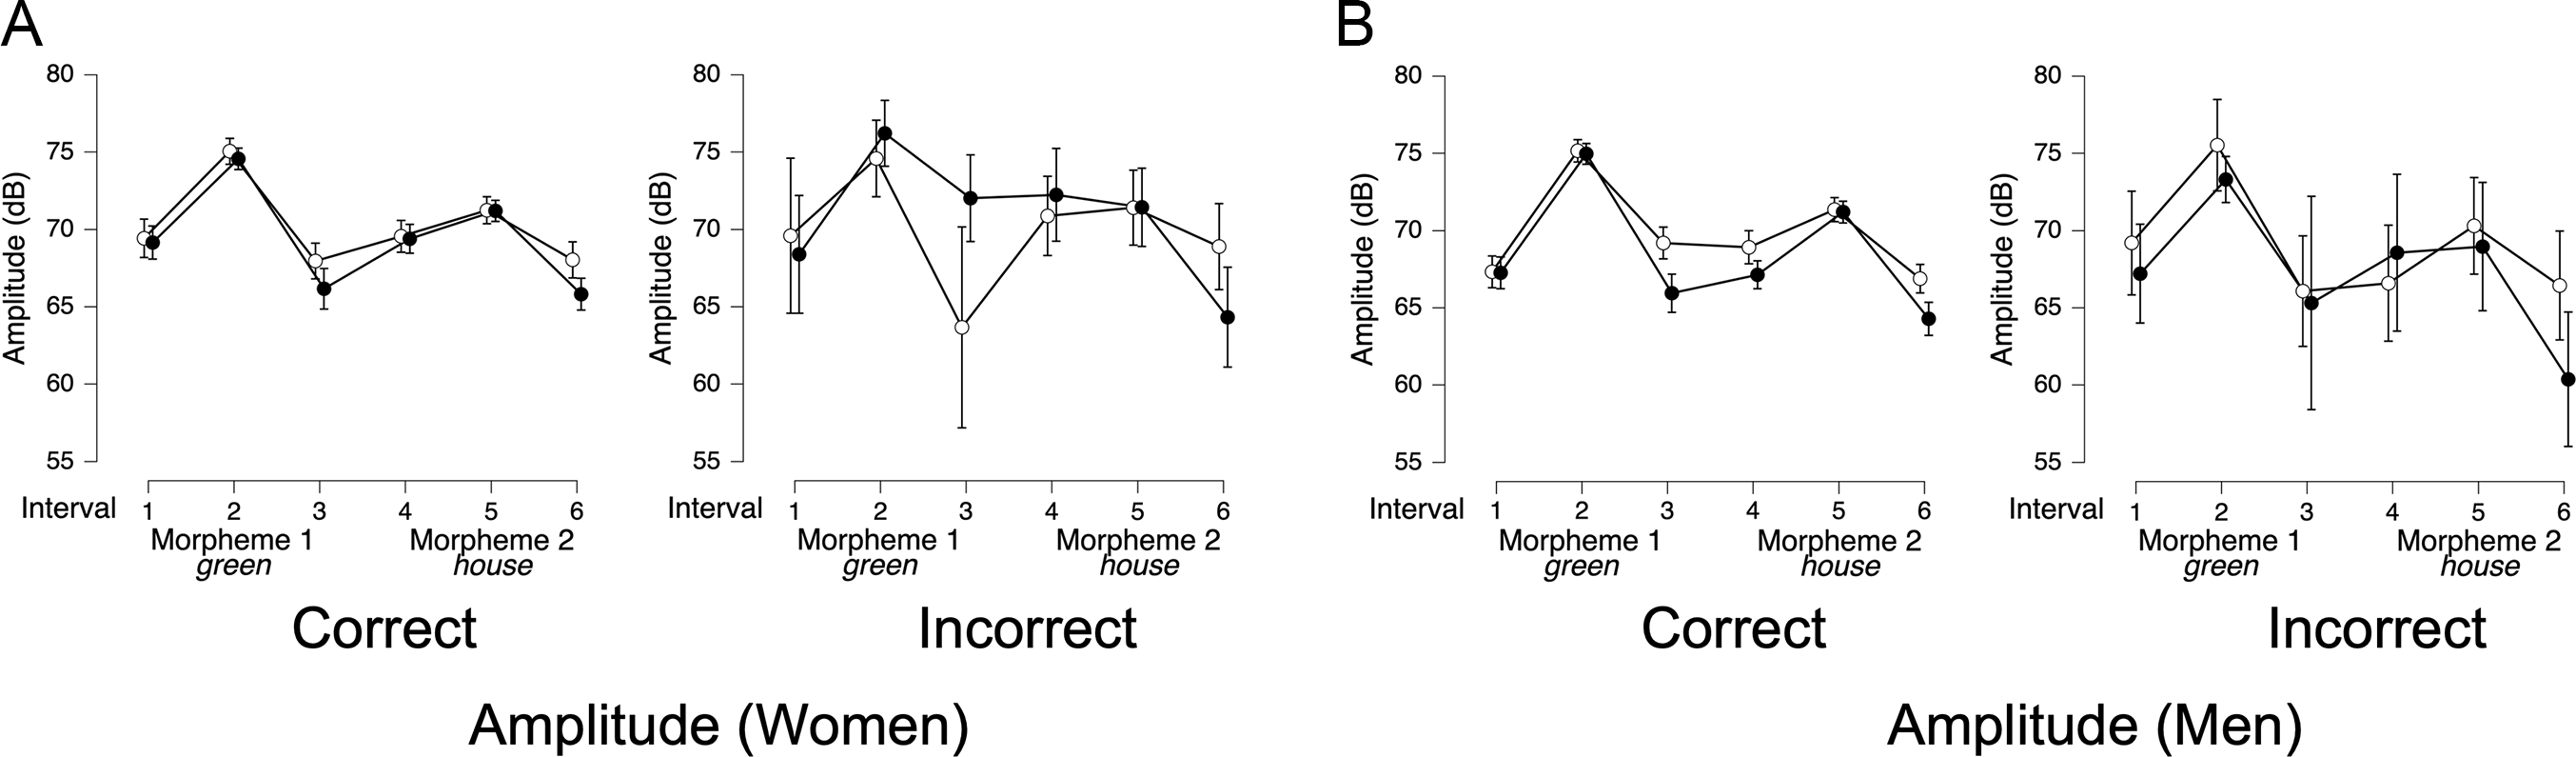
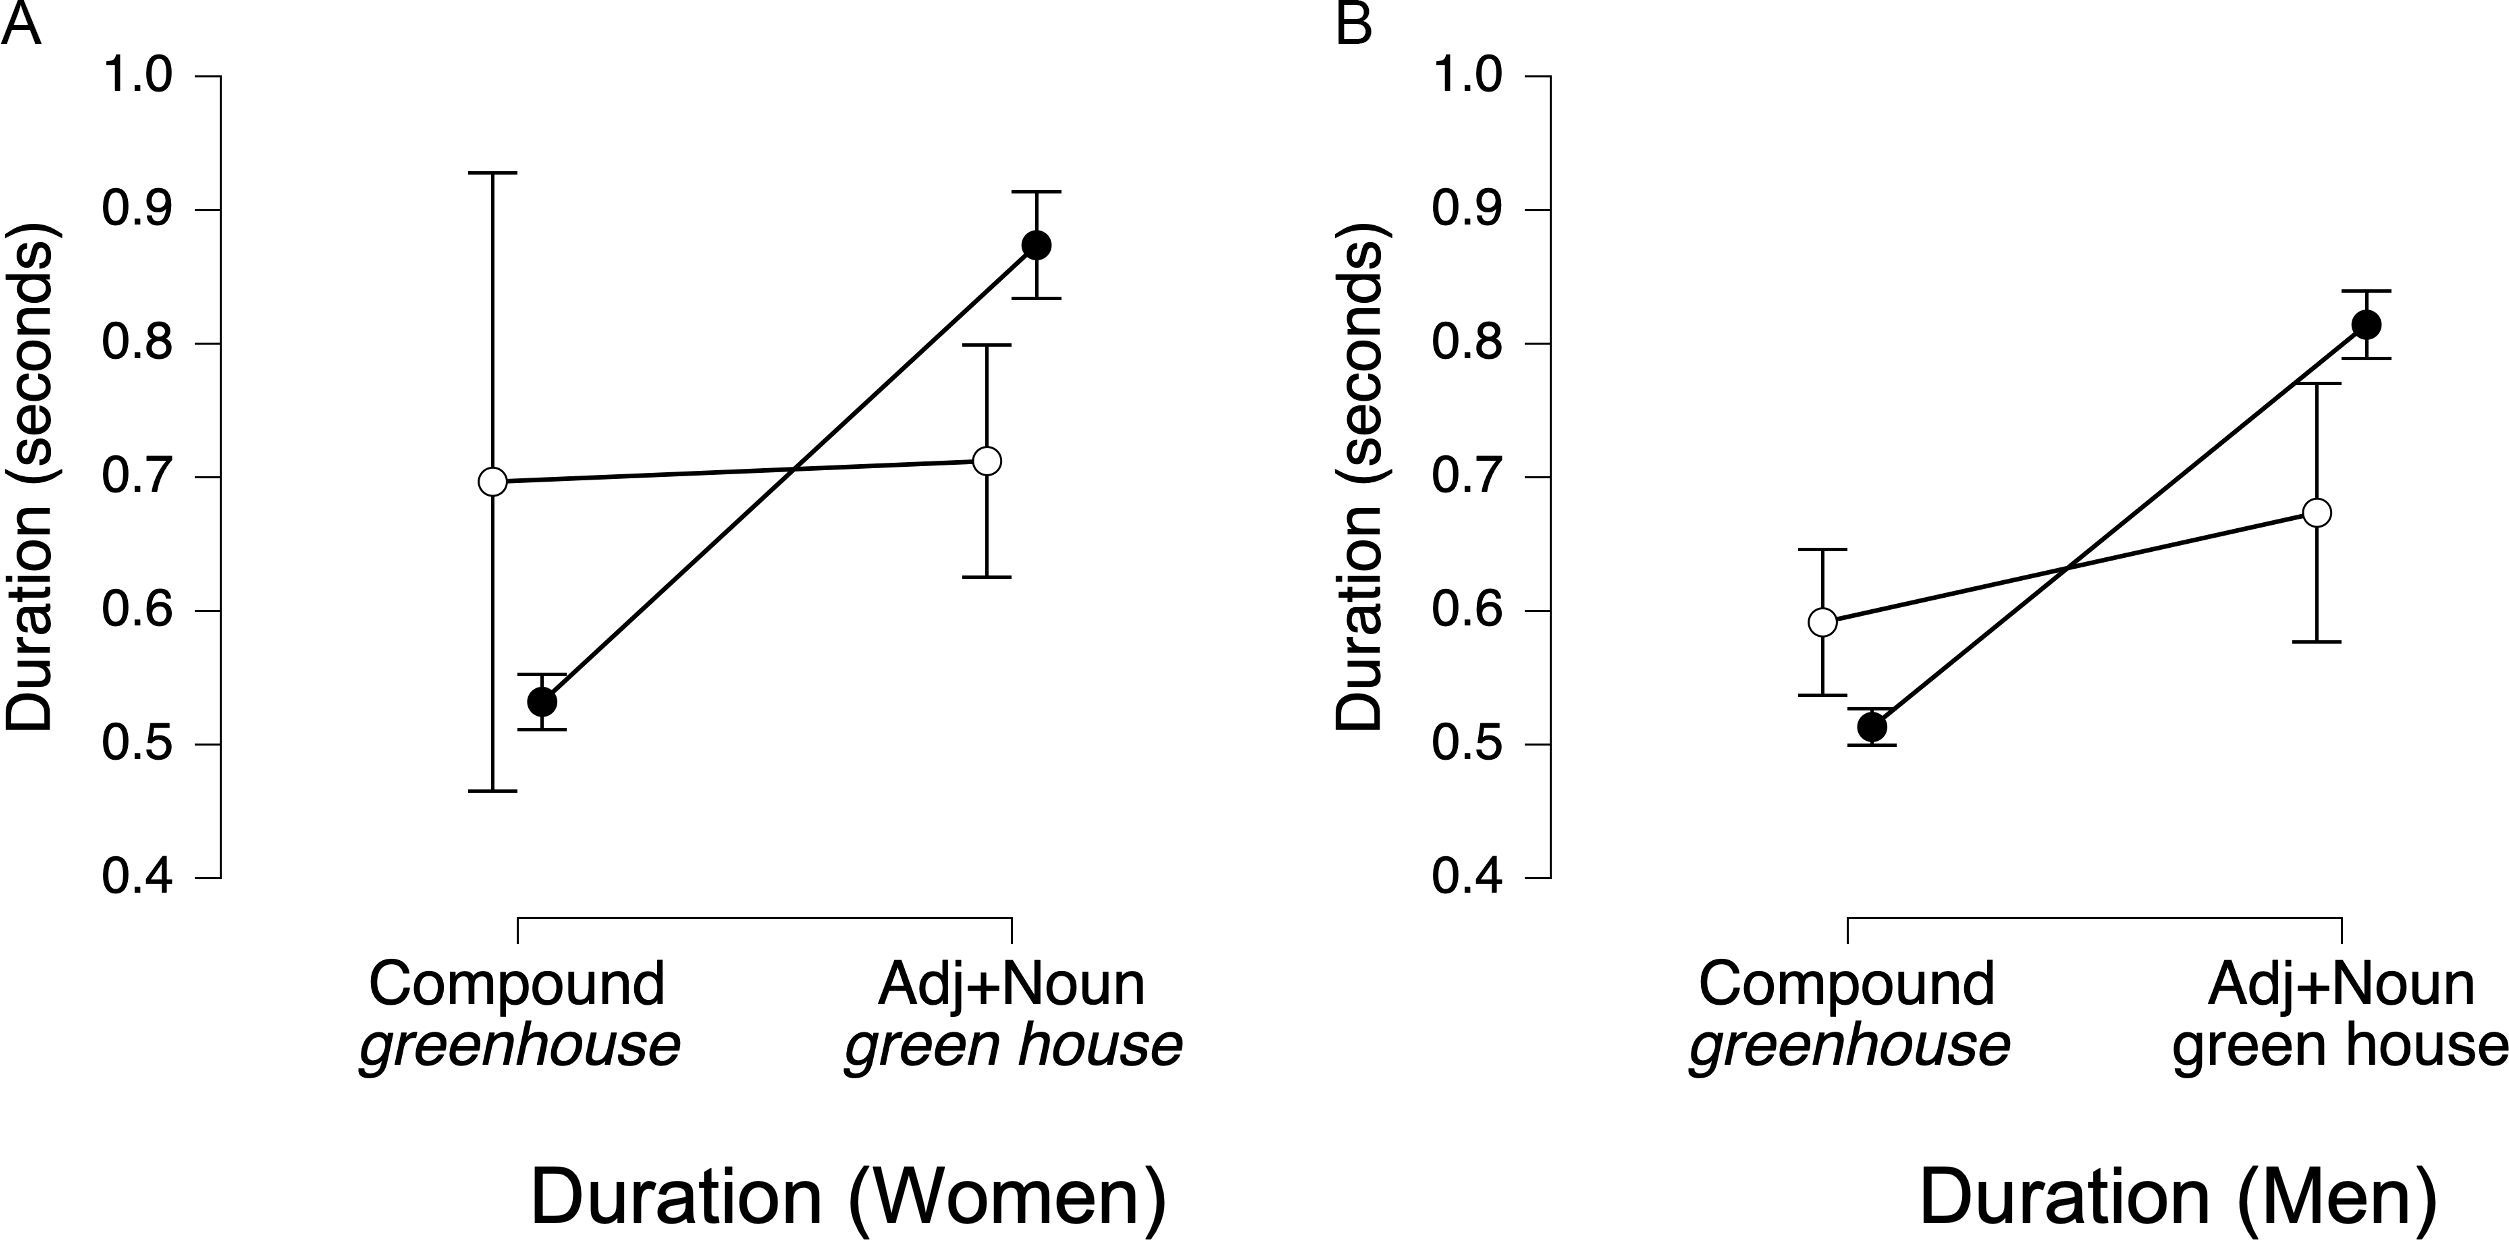
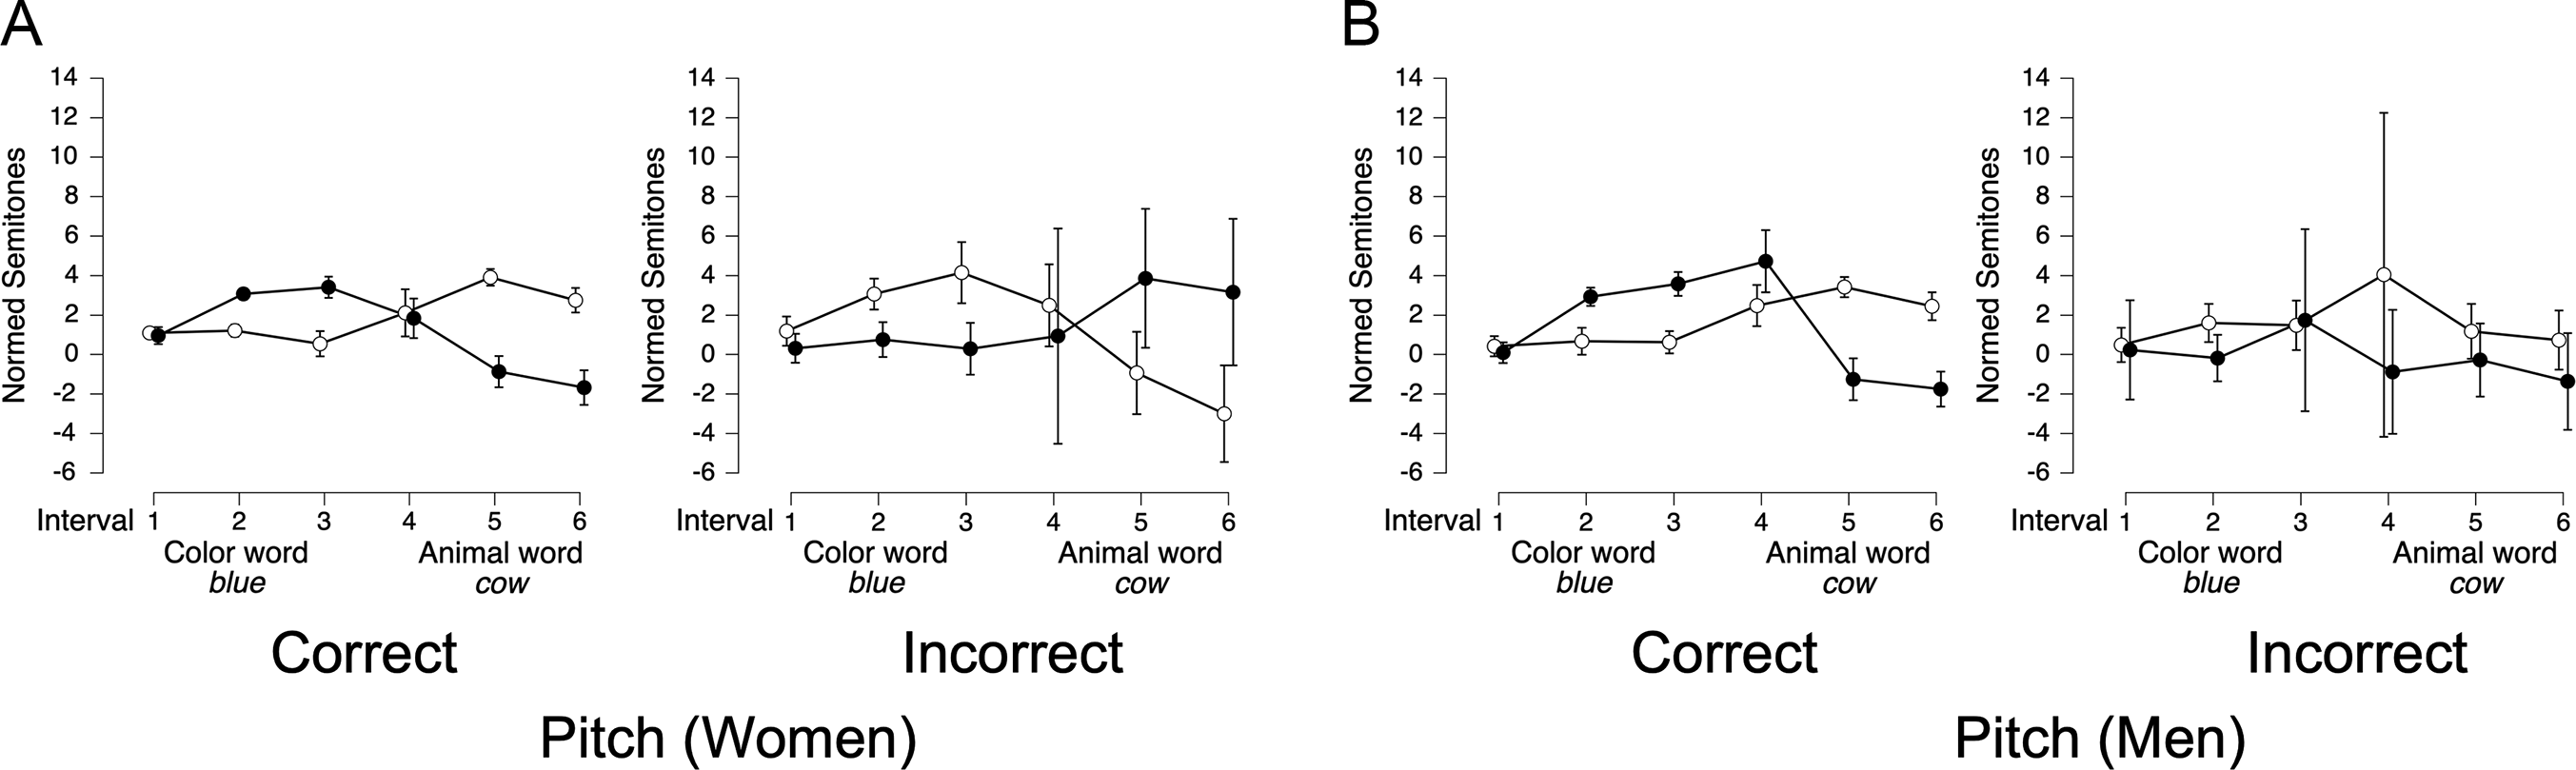
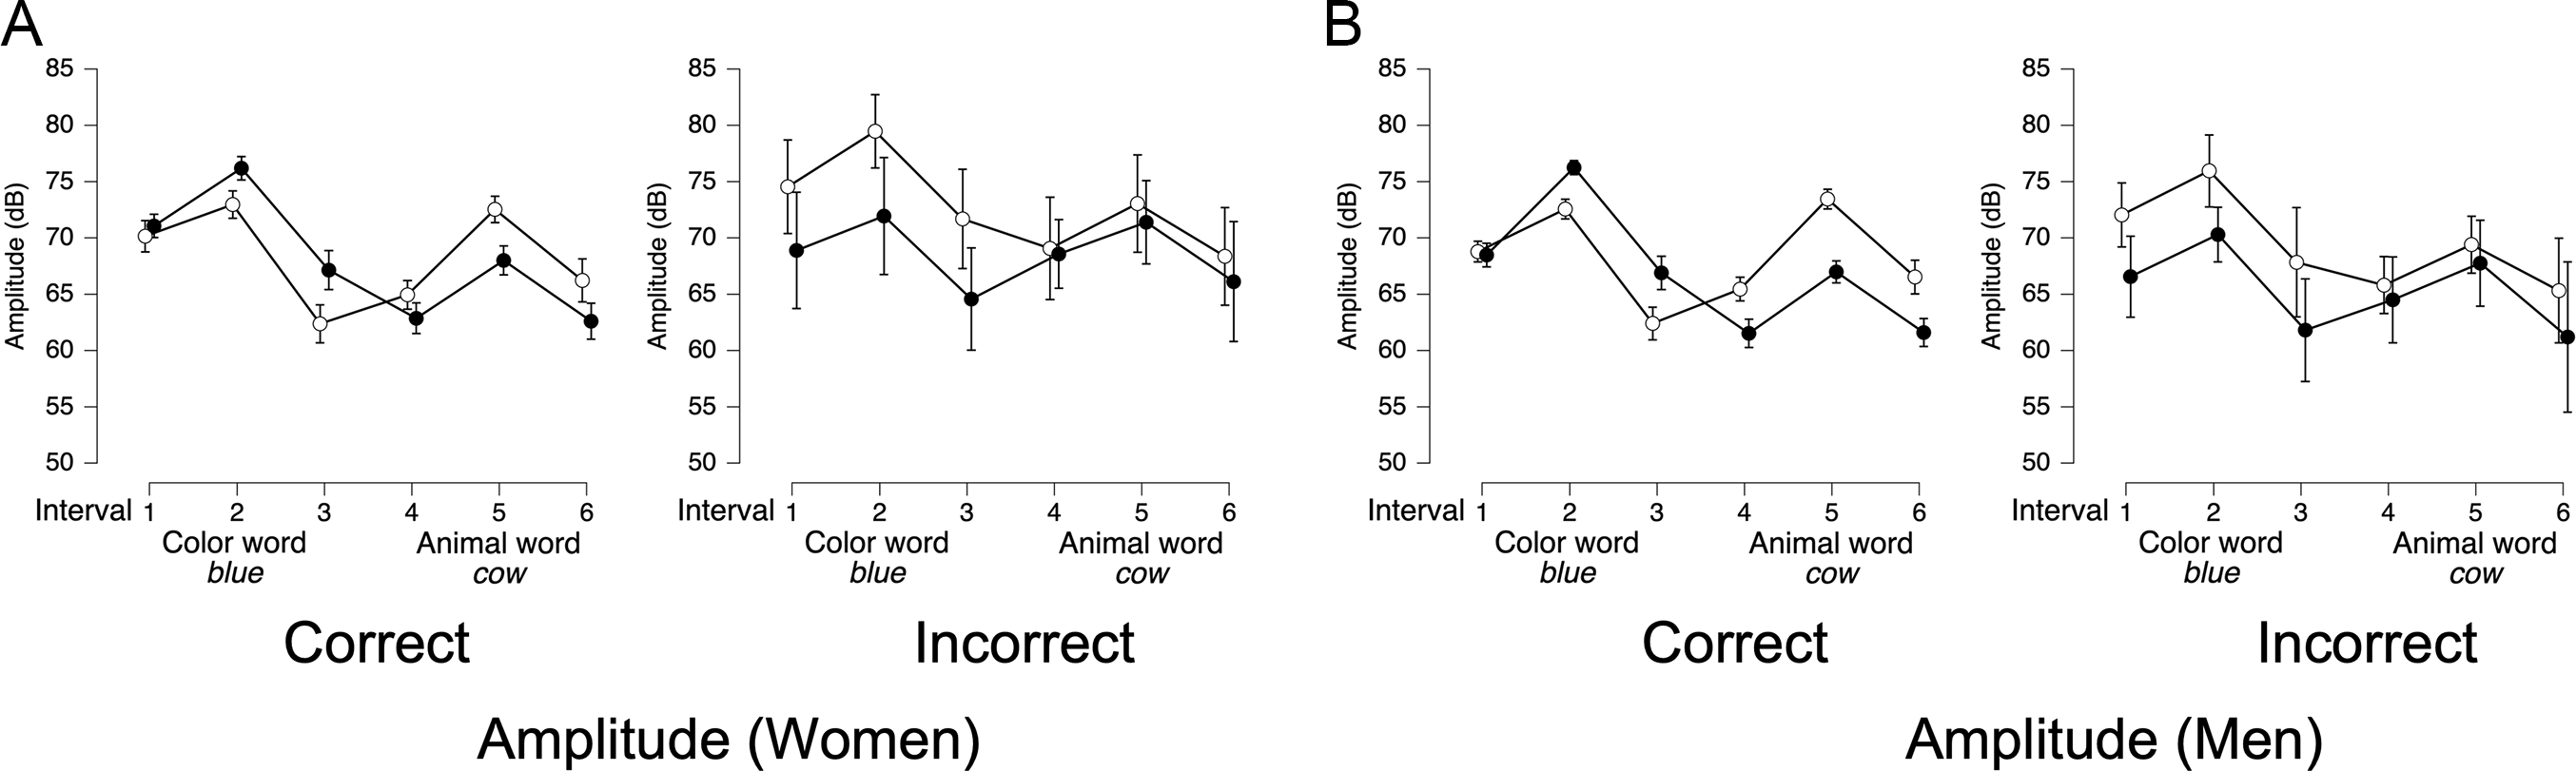
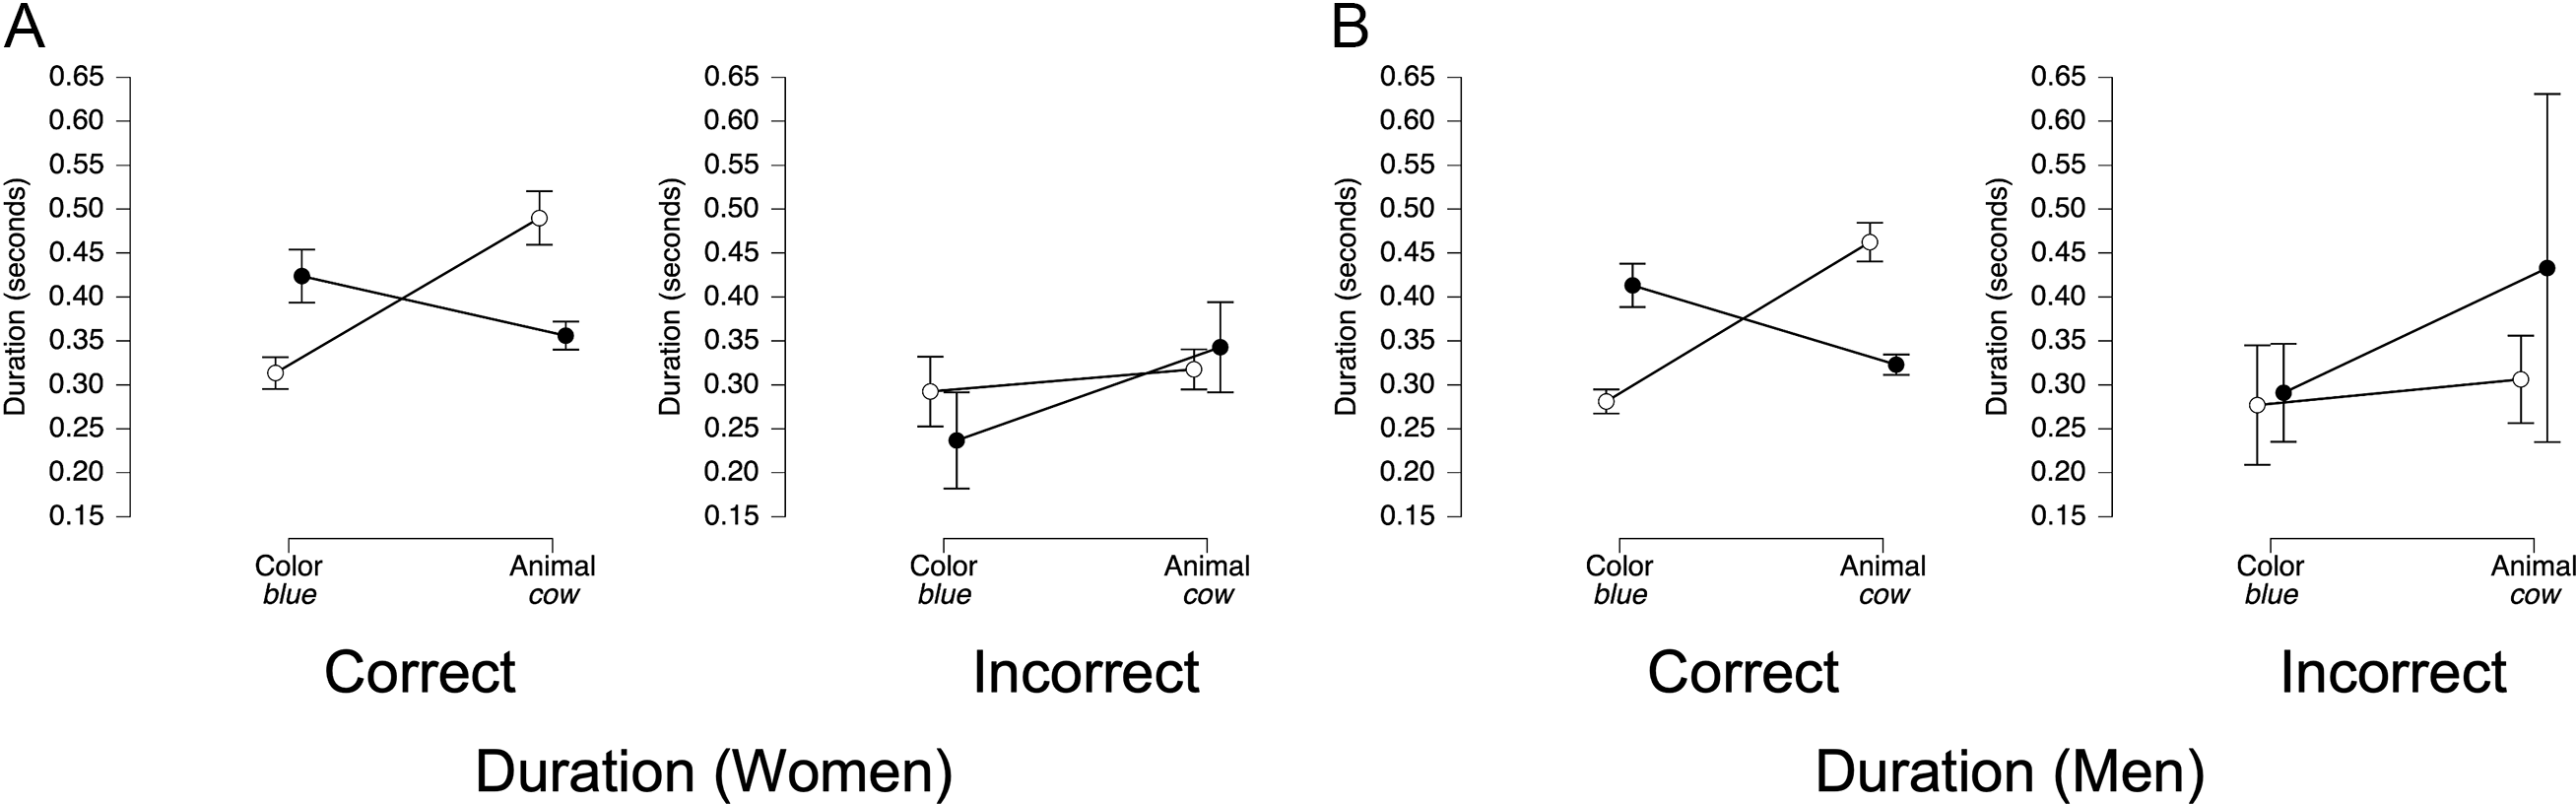
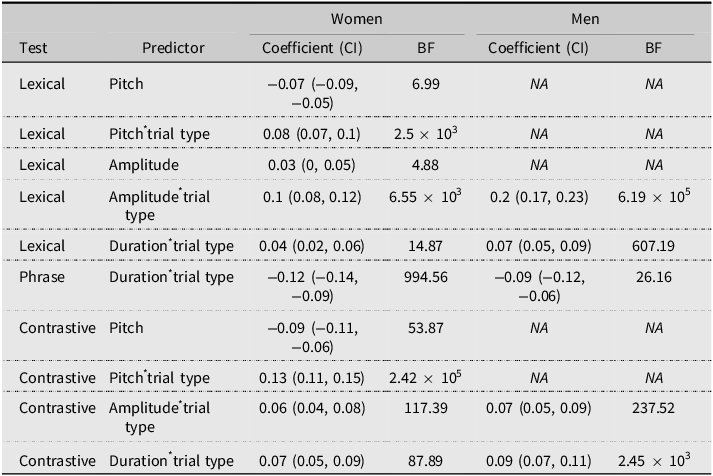

 Open access