


Nomenclature
- Abbreviation
-
Description
- AI
-
Artificial Intelligence
- ANN
-
Artificial Neural Network
- AP
-
Autopilot
- ATHR
-
Autothrottle Engagement
- BMU
-
Best Matching Unit
- CAS
-
Calibrated Airspeed
- DL
-
Deep Learning
- DT
-
Distance to Threshold
- EASA
-
European Union Aviation Safety Agency
- FDM
-
Flight Data Monitoring
- FD
-
Flight Director
- FPA
-
Flight Path Angle
- GS
-
Ground Speed
- HAT
-
Height Above Touchdown
- HWX
-
Headwind (computed from TAS -- GS)
- ICAO
-
International Civil Aviation Organization
- LIDAR
-
Light Detection and Ranging
- ML
-
Machine Learning
- METAR
-
Meteorological Aerodrome Report
- N1
-
Average Engine Rotational Speed (Low Pressure Compressor)
- QAR
-
Quick Access Recorder
- RNN
-
Recurrent Neural Network
- SD
-
Standard Deviation
- SIGMA
-
Neighbourhood Function Radius in SOM
- SMS
-
Safety Management System
- SOM
-
Self-Organising Map
- SRM
-
Safety Risk Management
- TAS
-
True Airspeed
- TDWR
-
Terminal Doppler Weather Radar
- Vapp
-
Computed Approach Speed
- Symbol
-
Definition
- $xjx_j$
-
Input vector (flight parameter vector)
-
$wi\mathbf{w}_i$
-
Weight vector of neuron ii
-
$\|xj-wi\| x_j - \mathbf{w}_i\|$
-
Euclidean distance between input and neuron weight
-
$a(i)a(i)$
-
Mean intra-cluster distance for sample ii
-
$b(i)b(i)$
-
Mean nearest-cluster distance for sample ii
-
$s(i)s(i)$
-
Silhouette score for sample ii
- QEQE
-
Quantization Error
- TETE
-
Topographical Error
- TT
-
Trustworthiness score
- NPNP
-
Neighbourhood Preservation score
- CC
-
Total number of neurons in SOM grid
- NN
-
Number of samples
-
$r(xi,xj)r(x_i, x_j)$
-
Rank of sample
$xjx_j$
relative to
$xix_i$
in input space -
$r'(xi,xj)r'(x_i, x_j)$
-
Rank of sample
$xjx_j$
relative to
$xix_i$
in output space -
$Uk(xi)Uk(x_i)$
-
Set of kk-nearest neighbors of
$xix_i$
in input space -
$Vk(xi)Vk(x_i)$
-
Set of kk-nearest neighbors of
$xix_i$
in output space


1.0 Introduction
The application of artificial intelligence (AI) in aviation has garnered increasing attention for its potential to enhance the detection of operational risks in flight operations. The European Union (EU) has developed a comprehensive strategy for AI at a global level, which is designed to ensure that AI is developed and used in a way that is human-centric, trustworthy and safe [1]. With the introduction of mandatory FDM programmes for aircraft operators over 27 tons as per the International Civil Aviation Organization (ICAO) regulations [2], airlines collect and process a high amount of flight data daily, which is collected by each aircraft’s quick access recorder (QAR). However, only a small portion of this data is used, as most analyses are exceedance-based, i.e. a flight is only analysed if it features an abnormal deviation from an accepted range within a specific set of parameters. This is due to the fact that only roughly 4% of all flights feature such a deviation [Reference Li, Nichanian, Lin and Braithwaite3]. Focusing on the other 96% can also lead to valuable insights from an aviation safety perspective.
Recent aviation safety trends are leading airlines to focus more on big data analysis beyond purely exceedance-based analyses [4]. Recent literature underscores the efficacy of various machine learning (ML) and deep learning (DL) models in identifying anomalies, predicting safety events and optimising flight performance. A DL model augments wind forecasts, increasing spatial and temporal accuracy, which is essential for route optimisation. Several studies have already been published, addressing the benefits of using ML algorithms and especially clustering techniques on flight data, allowing the system to proactively avoid turbulence and predict hazardous weather [Reference Gui, Zhang, Tang, Delahaye and Bao5–Reference Zhao, Xu and Wen8]. This study has collaborated with a European leisure airline to test the use of self-organising maps (SOM) on QAR data to detect and cluster changes in headwind (wind shear) during the final stages of an approach at Tenerife South Airport in Spain. Big data analytics with a DL approach has attracted increasing attention in avionics engineering, involving flight operations, maintenance, system design and safety management [Reference Ning, Sun, Liu and Yi9]. The main objective of this study was to assess the effectiveness of SOM in identifying and categorising relevant wind change patterns from an operational safety perspective to learn feature representations for multidimensional anomaly detection based on FDM. Overall, the key contribution is showing how unsupervised machine learning of SOM can augment traditional FDM by detecting subtler patterns and near-misses, thereby improving safety insights and guiding proactive interventions.
2.0 Related work
2.1 The limitations of the traditional FDM programme
Traditional FDM programmes rely solely on detecting threshold exceedances based on specific flight parameters beyond predetermined limits. While this method helps identify critical events (e.g. large deviations or hard landings), it tends to miss subtler patterns that might precede or lead to hazardous situations. In particular, near-misses or events that were successfully recovered by the flight crew often go unexamined because they never exceed thresholds. This gap in conventional FDM tools motivates using more flexible, data-driven methods that can capture complex relationships and patterns in large flight datasets without relying solely on exceedances. By applying SOM, the research demonstrates an unsupervised learning approach that groups flights according to similar patterns. By identifying flights where crews successfully managed wind shifts, the method offers insight into ‘what went well’, aligning with the Safety-II principle of studying successful recoveries. This represents a shift in FDM analysis, transitioning from a purely reactive focus on failures to examining the positive aspects of the crew’s resilient performance [Reference Li, Nichanian, Lin and Braithwaite3, Reference Provan, Woods, Dekker and Rae10]. The focus of an FDM programme is for an airline to monitor their operational safety performance. As data is collected during each flight, it is then used to analyse the safety performance of the flight [Reference Lager and Melin11]. The data analysis retrieved from the aircraft’s QAR is mostly exceedance-based, i.e. specific events can be flagged as they cause recorded parameters to deviate beyond a pre-set threshold [Reference Walker12].
The severity of each flagged event can then be assessed by safety analysts using a risk matrix or severity score and combined with possible air safety reports submitted by the pilots. It can also be combined with environmental data to get a broader overview of prevailing conditions during a flight. As such, it has become mandatory for operators of aircraft whose maximum certified take-off mass exceeds 27 tons [2, 13, 14] and is a key part of an airline’s safety management system (SMS) [Reference Verstraeten, Baren and Wever15]. It is therefore one of the many aspects that help maintain safety resilience within an airline, provided the airline features the ability to adapt to changes and disturbances [Reference Provan, Woods, Dekker and Rae10, Reference Woods16]. However, it leads to only about 5% of the data being analysed, as by far most flights remain within the acceptable parameters’ ranges, while the 95% are mostly not used [Reference Hollnagel17]; S. K. [Reference Jasra, Valentino, Muscat and Camilleri18]. Furthermore, it necessitates correctly setting the event detection threshold for each type of event. If the threshold is too narrow, it can lead to false negatives, while a threshold that is too wide could lead to too many false positives. Finally, it also presumes that a specific type of event can be recurring, but without taking into account the emergence of new event types, which do not necessarily follow the same underlying logic behind the previously known type of event [Reference Stogsdill, Baranzini and Ulfvengren19]. Recent studies and work have started to go beyond exceedance-driven analyses and focus on big data analyses to monitor trends and patterns within the data [4]. These methodologies are consistent with a safety-II approach to monitoring safety performance as they not only focus on deviations from accepted parameters but also on how everyday performance varies [Reference Hollnagel20]. Recent studies have also shifted from a broader data analysis of the whole operation to an analysis of specific types of events at a particular stage of flight or airport. For instance, Jarry et al. [Reference Jarry, Delahaye and Feron21] conducted a study to analyse atypical energy approaches at Charles De Gaulle airport, with the aim to assess the effects of the COVID-19 disruptions on approach stability.
2.2 The risks of wind changes on the final approach
Wind shear is a significant aviation hazard, especially during approach and departure. Traditional sources, such as pilot reports or hourly weather logs, are too coarse for capturing wind shear. Prior research for wind shear prediction has been conducted using the aerodromes’ Meteorological Aerodrome Report (METAR) data, laterally with a range of different detection devices such as Terminal Doppler Weather Radar (TDWR) and Doppler Light Detection and Ranging (LIDAR). Along with a network of anemometers located at different points near the runway, the studies created a database of metrological data for the purpose of training and testing models capable of predicting wind shear events at low levels near the runway threshold [Reference Huang, Ng and Chan22–Reference Ryan, Saputro and Sopaheluwakan25]. Low-level wind shears present a significant threat to operational safety in aviation. As per ICAO guidance, it is considered a rapid wind shift of more than 15kts within about 600 meters (2000ft) above ground level [Reference Haverdings and Chan26, 27]. These rapid changes lead to an equally rapid change of the aircraft’s energy at a stage of the flight where it is close to the ground, flying on the lower bands of the airspeed limits and with high drag. Several accidents have happened in the past decades where wind changes were a contributing factor (e.g., Delta flight 191 – 136 fatalities, American Airlines 625 – 37 fatalities). Overall, adverse weather conditions play a circumstantial role in controlled flight into terrain (CFIT) and runway excursion accidents, as shown by a 1999 Flight Safety Foundation study. It highlighted the fact that adverse wind conditions play a role in 67% of all runway excursion-related accidents [Reference Matthews, Waugh, Vogt, Richards, Plaugher and Kirby28].
Although the phenomenon is well understood scientifically, weather data has become more accurate, and pilots are specifically trained on the phenomenon, accidents or incidents such as hard landings still happen today due to the somewhat unpredictable nature of wind changes [Reference Ryan, Saputro and Sopaheluwakan25]. QAR data has, however, proven to be useful for analysing turbulence and wind change events in retrospect. As the subjective perception of turbulence and wind changes can differ from pilot to pilot, relying on QAR data to collect an objective database has become useful. The wind changes can then be computed as the difference between the true air speed (TAS) measured in air and GS (ground speed). Computing the wind changes during the approach can complement manual crew reports and allow an airline to determine airports featuring approaches with potential risks associated with events related to changes in wind speed and/or direction [Reference Bach and Parks29, Reference Bach and Wingrove30]. It could also allow airports and operators to quantify the given risks better and allow for more anticipation from the crew [Reference Haverdings and Chan26].
2.3 Applying SOM for FDM
AI has emerged as a pivotal catalyst for advancing FDM programmes and aviation safety. By leveraging state-of-the-art ML and DL techniques, researchers and industry professionals are uncovering novel insights into anomalous parameters, risk precursors and operational inefficiencies that conventional threshold-based methods often fail to detect. A key advantage of AI-driven approaches lies in their capacity to manage and interpret large-scale flight data streams recorded by QARs, enabling real-time or near-real-time assessments of operational risks under safety-critical situations in flight operations [Reference Li, Hansman, Palacios and Welsch31]. Many studies have demonstrated the benefits of using ML algorithms to enhance FDM data analyses. ML methods are vast but can be divided into two categories: supervised and unsupervised. A supervised ML algorithm aims to achieve a known outcome for a given dataset, whereas an unsupervised learning algorithm has no known optimal solution (S. K. [Reference Jasra, Valentino, Muscat and Camilleri18]). Clustering is part of the unsupervised machine-learning techniques in which the dataset is classified into subsets based on different similarity parameters. A common method for clustering is the k-means method(S. [Reference Jasra, Gauci, Muscat, Valentino, Zammit-Mangion and Camilleri32]). This method is a popular research topic with regard to flight data. For instance, Barry [Reference Barry33] used Bayesian Networks on FDM data in conjunction with meteorological data, while Jarry et al. [Reference Jarry, Delahaye and Feron34] used recurrent neural networks (RNNs). Different research aspects can be covered from k-means clustering, from 4D trajectory projections [Reference Tang, Gu, Shen and Chen35] to hard landings [Reference Qiao, Chang, Zhou and Lu36], and big data analysis [Reference Hu, Liu, Zhang and Fang37]. While many studies on data analysis methods exist, few airlines are using them during their day-to-day operations. Using artificial neural networks, which is a form of AI, has been a focus of study at European Union Aviation Safety Agency (EASA), which underlined its benefits regarding safety risk management in its AI roadmap 2.0 [1]. It highlights the AI opportunities to support the detection of emerging risks through modelling, identifying hidden correlations, anomaly detection and classifying occurrences. The main challenge of AI, according to EASA, remains the inherent difficulty of comprehending an AI algorithm and therefore predicting and explaining its behaviour. Hence, its trustworthiness is a key concern regarding its use. This is less the case for simpler machine-learning algorithms, such as SOMs, which feature a more predictable pattern.
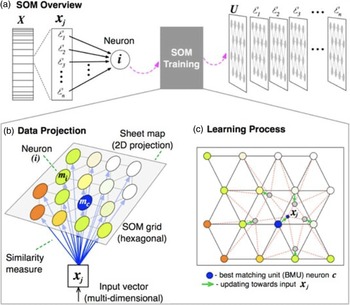
SOMs are a form of artificial neural network that belong to the unsupervised learning techniques. Unlike pattern clustering, SOMs map a data pattern from the original dataset (the input space) into a n-dimensional (usually two) output space. The neurons in the output layers are connected to the input layer’s neurons with different weight values. The training process is based on a ‘winner-takes-all’ rule, as a best-matching unit (BMU) is defined for each input vector. The BMU is the most similar neuron to the input pattern, which is the neuron with the shortest distance from the input layer. While doing so, it maintains the dataset’s topology by using a neighbourhood function. The learning algorithm can be divided into four steps: initialisation (the neurons’ weights are initialised), competition (search for the best matching unit across all neurons), cooperation (identifying the neighbourhood radius) and adaptation (shifting the weight values towards the input pattern). The SOM algorithm is identical to the k-means algorithm when the SOM’s neighbouring function’s radius is equal to zero [Reference Bação, Lobo and Painho38, Reference Kohonen39]. In summary, modern aircraft generate vast amounts of data across thousands of parameters in each flight. The interactions among these parameters can be complex and nonlinear, making it difficult for purely exceedance rule-based methods to uncover subtle patterns. The simple method of SOMs can group similar flight profiles based on the entire multidimensional dataset instead of using strict thresholds. By integrating SOM with traditional FDM, airlines can capture both exceedance-driven events and subtle anomalies. This offers a more comprehensive understanding of flight safety and performance. SOM implementations are well-suited to large volumes of flight data in modern commercial aircraft, allowing for continuous, real-time clustering as new data is available (Fig. 1).
Basic schematic overview of the SOM learning applied to a dataset X. (a) represents a 2D-SOM modelling an n-dimensional input vector xj into a lattice map of neurons with their associated weight vectors. (b) shows the projection of xj to all the weight-initialised neurons in the grid to determine the optimal BMU, and (c) the updating of BMU’s weight vectors and the neighbouring neurons recursively [Reference Vettigli40].

3.0 Method
3.1 Data collection
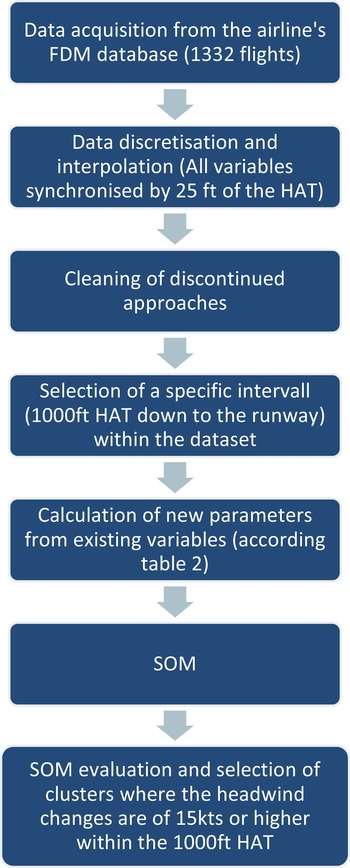
The data was collected from 1332 approaches into Tenerife South Airport (Spain) operated by an international commercial airline on the Airbus A320 between January 2018 and July 2022. The raw data was recorded from the aircraft’s QAR and collected through the airline’s FDM processing software in the form of a .csv file for each flight. The data features multivariate time series that vary in frequency depending on the recorded parameter. The wind direction and force at the runway threshold were obtained. The recorded parameters are shown in Table 1. The process of data collection, screening and analysis is highlighted in Fig. 2.
Selected flight parameters from the FDM dataset retrieved from the aircraft’s QARs

Flowchart of the data processing and clustering methodology.

Tenerife South airport is located in the popular holiday island of Tenerife in Spain, which features a single runway oriented at 073 resp. 253 degrees along the coast. The choice of this airport for this study ensured that enough flights were operated to this destination, although it is not the operator’s home base. In addition, it features a unique weather phenomenon due to the nearby volcano. When approaching runway 07, the headwind component on the last three nautical miles to the runway can increase rapidly, up to 40kts. This leads the aircraft’s energy to increase as it gains lift, thus destabilising its vertical approach trajectory and speed.
3.2 Data cleaning and pre-processing
For the purpose of this study, only the approaches flown into runway 07 were analysed to account for the wind changes. Since the recording frequency varies for each flight parameter, and in order to synchronise the datapoints for each flight, the data had to be cleaned and discretised. It was discretised and linearly interpolated for every 25ft relative to the height above touchdown (HAT). Finally, only the last 1000ft in HAT were used for the data analysis, as the wind shifts were known to occur during this segment. A handful of approaches led to go-arounds, which were removed from the dataset, but no flights. The headwind component during the approach was not recorded. However, it was later derived from the difference between the groundspeed and the true airspeed. To determine the stability of the approaches, two new parameters were calculated: the ‘CAS-Vapp’ variable, which indicates the magnitude of the speed deviation with regard to the computer approach speed, and the headwind change with regard to the headwind at the runway threshold. The total energy change accounts for the potential and kinetic energies. Since the aircraft mass can be approximated as a constant value during the final stages of the approach, it was removed for simplification purposes (Table 2).
Calculated flight parameters from the dataset

3.3 Clustering using SOM
The headwind change variable with regards to the HAT indexed by 25ft was clustered using SOM. The clustering was done using the Python MiniSom package [Reference Fortela, Crawford, DeLattre, Kowalski, Lissard and Fremin41]. SOMs belong to the artificial neural networks (ANN) family and convert nonlinear statistical relationships on higher dimensions into a low-dimensional, discretised representation map. Output neurons form the representation map, which is arranged in a two-dimensional grid and tries to preserve topological relations. The number of output neurons determines the maximum number of clusters that can be obtained. The Silhouette score, which is a measure of how similar an object is to its own cluster versus the other clusters, allows for the determination of the optimal number of clusters. The Silhouette score returns a value between −1 and 1, 1 being the best clustering. A variable optimisation algorithm was used for each clustering, which calculated the SOM σ and learning rate for the best Silhouette score over 100’000 iterations. For the size of the used dataset, the optimal grid dimension corresponds to a 4x4 grid, comprising 16 clusters. To determine the SOM performance, several metrics were used: the quantisation error, the topographical error, the trustworthiness and the neighbourhood preservation. The quantisation error represents the mean difference between the input samples and the winning neurons. The elbow method was used to determine the optimal k value. The calculations of the SOM parameters are shown in Table 3, and the optimal parameters are shown in Table 4. The clustering metrics were computed, and the number of flights affected by a wind change was compared to the results from the airline’s deviation-based FDM data analysis.
Calculations of the SOM parameters [Reference Vesanto and Alhoniemi42]

Optimal SOM parameters

4.0 Results
4.1 Dataset characteristics
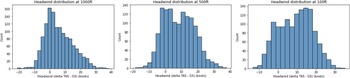
The sample comprises raw data from the aircraft’s QAR. One thousand three hundred thirty-two approaches flown into runway 07 at Tenerife South airport (Spain) operated by the Airbus A320 between January 2018 and July 2022 were obtained. The data is anonymised; therefore, the specific date of an individual flight is only known by the airline. In addition to the flight data, the airport’s meteorological aerodrome report (METAR) at the time of the approach was obtained. The headwind distribution at 1,000 feet (which corresponds to the gate at which the aircraft must be configured accordingly and the approach stable), 500 feet (stabilisation gate for flights in visual flight conditions according to EASA regulations) and 100 feet during the approach are shown in Table 5 and Fig. 3.
Overview of the mean, sd, median and mode for the headwind minus threshold headwind variable at 1000ft, 500ft and 100ft

Headwind distributions at 1000ft, 500ft and 100ft.

4.2 Clustering performance
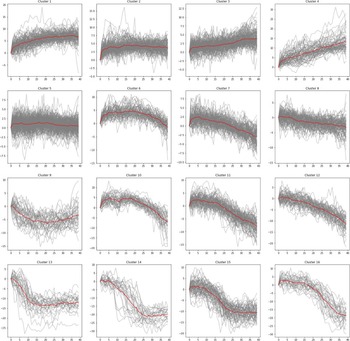
The results from the SOM clustering are shown in Fig. 4 along with the SOM performance metrics in Table 4. Different patterns emerged among the clusters. Most clusters feature a steady headwind component (clusters 2, 5 and 8), a slightly decreasing headwind component (clusters 1 and 4) or an increasing headwind component but a low magnitude (clusters 7, 8 and 9) or gradually over the 1000ft remaining (clusters 10, 11 and 12). Only clusters 13, 14 and 16 were kept to be compared with the airline’s data analysis. These clusters feature a positive wind shift of at least 15kts and also over a short change in altitude (about 250ft).
SOM clusters of the headwind change by HAT index (every 25ft). The red line represents the mean headwind.

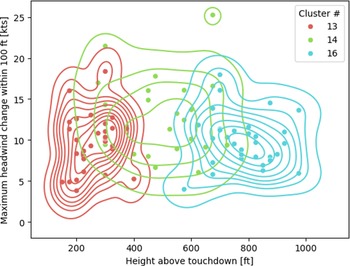
A comparison is made with the rolling difference in measured wind observed over 100ft height difference during the approach. To accommodate for short-term variation between each 25ft step, a rolling average with the neighbouring data point (window ±25ft) is first performed on the measured headwind. Figure 5 displays the location of the maximum observed headwind change over 100ft for the flights of the studied clusters.
Overview of the clusters by moving average and height above touchdown.

4.3 Overview of the flight parameters in clusters 13, 14 and 16
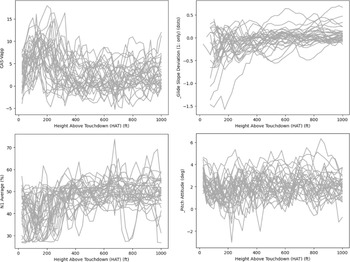
The overview of the flight parameters from clusters 13 to 16 by cluster is shown in Figs. 6 and 7. The flight parameters comprise the CAS-Vapp, the glide slope deviation, the N1 and the pitch attitude. Cluster 13 features flights affected by a very low height level increase in headwind. The flight parameters shown in Fig. 7 for cluster 14 display an increase in CAS-Vapp and the N1 being reduced to less than 30% (corresponding to idle thrust) from 200ft onwards consistently with the increase in headwind at the same height shown in Fig. 5.
Flight parameters for cluster 13.

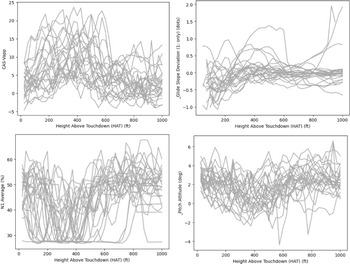
Flight parameters for cluster 14.

The flight parameters shown in Fig. 7 for cluster 14 display an increase in CAS-Vapp and the N1 being reduced to less than 30% (corresponding to idle) at around 500ft consistently with the increase in headwind at the same height shown in Fig. 5. Cluster 14 features flights affected by an increase in headwind at a comparatively mid height level.
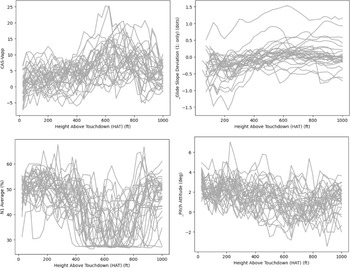
The flight parameters shown in Fig. 8 for cluster 16 display an increase in CAS-Vapp and the N1 being reduced to less than 30% (corresponding to idle) at around 700ft consistently with the increase in headwind at the same height shown in Fig. 5. Cluster 16 features flights affected by an increase in headwind at a comparatively higher height.
Flight parameters for cluster 16.

Table 7 displays the number of flights within the three clusters compared to the flights flagged through the airline’s FDM data analysis.
SOM performance metrics

Flights highlighted by SOM vs. exceedance-based data analysis

5.0 Discussion
5.1 Analysis of the SOM performance scores
Anomaly detection techniques can be used to detect significant events in FDM, as these usually correspond to unusual operational situations, such as go-around operations, runway excursions, conflict resolution manoeuvres and traffic rerouting are examples of significant events that could be identified by applying anomaly detection methods [Reference Olive and Basora43]. This study is a multidimensional anomaly detection, which refers to the tasks of identifying new or inconsistent patterns compared with big data in the FDM [Reference Pimentel, Clifton, Clifton and Tarassenko44]. We apply the SOM technique to extract key features from real-life flight operations data from a European airline and investigate the impact of these features on the performance of anomaly detection. Table 6 displays the SOM performance scores. Different scores were evaluated, namely the Silhouette score, the quantisation error, topographical error, trustworthiness and neighbourhood preservation. The Silhouette score is positive when the clusters are well separated and feature a high data density [Reference Rousseeuw45]. The present score indicates that the distance between clusters is not significant. As shown in Figs. 4 and 5, several clusters feature a similar data shape and/or feature changes in headwind at similar ranges in height above touchdown, even within the chosen clusters 13 to 16. The quantisation error indicates the average difference between the input data and its corresponding BMU [Reference Anh Tu46]. It was normalised with regard to the range of the FDM dataset. The result indicates that the BMU for each headwind datapoint is in average 25.5% away from the datapoint. It indicates the SOM is performing moderately well, considering the noisy structure of the headwind variable. However, it correlates with Fig. 5 indicating some overlapping between clusters. The topographic error indicates the number of samples within the data having the first BMU and the second BMU not being adjacent to each other [Reference Anh Tu46]. The low topographic error value indicates that the BMU and second BMU for most data points are adjacent, therefore the SOM is preserving the topological structure within the dataset. Thus, it features coherence within the clusters, although some clusters are somewhat similar in shape. Trustworthiness and neighbourhood preservation are two measures, which return an indication about the preservation nearby features in the SOM output space, compared to the input space [Reference Bauer and Pawelzik47, Reference Venna and Kaski48]. Two types of error are possible within the projection in the output space: new data could enter the neighbourhood of the data vector, or some data vectors could be projected further away in the output space compared to the input space. Venna and Kaski [Reference Venna and Kaski48] argue that this type of error is more serious since it reduces the trustworthiness of the neighbourhood relations, hence the ‘trustworthiness’ metric. The results of the neighbourhood preservation and trustworthiness indicate that both the nearby features within the output space are preserved, and proximities are even slightly better preserved.
5.2 Cluster evaluation
The SOM clustering returned 16 clusters with various patterns within the data, ranging from steady headwind to abrupt increases in headwind at the final stages of the approach. From an operational perspective, it is an airline’s interest to identify the flights affected by a wind change according to the ICAO commonly accepted definition of a wind shear. Therefore, for the purpose of this study, only the clusters featuring a rapid change of about 15kts of the calculated headwind within 600 meters of the ground (about 2000ft) will be considered [27, Reference Bach and Wingrove30]. Although some clusters (e.g. clusters 4 and 12) feature a wind change of more than 15kts, the change is almost linear over the last 1000ft, therefore they were discarded (see Fig. 4). Only the flights contained in clusters 13, 14 and 16 within the SOM clustering can be considered as being affected by a wind change according to the ICAO definition. While cluster 13 displays an increase in headwind at a very low height (about 250ft), clusters 14 displays a change in headwind at a height starting at about 500ft. Cluster 15 displays a mean increase of headwind of about 10kts, occurring not at a particular height above touchdown, but which is more scattered between 900ft and 200ft. For this reason, it was not kept among the final set of clusters. Cluster 16 features an increase of headwind at the ‘highest’ level, at about 750ft. As shown in Table 7, 88 flights are contained within these three clusters. These clusters are well-differentiated from the other clusters and can be used by the airline to perform a more detailed analysis of the recorded flight data, from a safety-II perspective [Reference Hollnagel20, Reference Hollnagel, Wears and Braithwaite49]. These results from the SOM clustering were compared to the analysis done within the airline, based on the traditional identification of exceedance events within the same 1332 approaches. The airline’s analysis, including the manual post-processing and analysis of the data by safety analysts, returned 27 flights affected by wind changes. Therefore, using an ML algorithm such as SOM can prove to be a huge benefit for airlines to complement their traditional exceedance-based analysis as it identifies many more flights affected by wind changes that would have been unnoticed otherwise.
5.3 Benefits of FDM data clustering within an SMS
An airline’s SMS is based on four components: safety policy, safety risk management (SRM), safety assurance and safety promotion [50]. FDM plays a key role in all four of these components, as it is based on monitoring of procedures, allows hazard identification and risk assessments, and contributes to a robust safety culture and awareness. The biggest component of FDM consists of SRM. SRM is divided into the following methods: reactive, proactive and predictive. FDM is usually categorised within the proactive method as it aims at monitoring potential safety issues before they increase in severity to the point of becoming an incident or even an accident [Reference Stolzer, Sumwalt and Goglia51]. Using the deviation-based risk identification method is, however, still a somewhat reactive approach, as it focuses on finding ‘incidents’, but on a lower-level scale. While it is still essential to continue using this method, there is room for improvement, in particular within the predictive method, where FDM can also play a key role, as highlighted by this study. A key message from this study is the benefit of finding additional flights affected by wind shifts through clustering, compared to the deviation-based methodology. As such, the results support the initial hypothesis that cluster-based analyses and analyses beyond exceedances can complement traditional methodologies and have safety benefits for the airlines’ safety departments (Table 7). The number of additional flights identified (88) does not represent an overwhelming increase either, so that it remains within the capacity of the FDM analysts to further analyse these patterns of data. By performing trend analyses, clustering and therefore identifying specific patterns within flight data, airline safety analysts can predict trends and not only focus on unwanted trends or outcomes but also on positive, i.e. desired trends. Clustering, among other data mining tools is what Stolzer et al. [Reference Stolzer, Sumwalt and Goglia51] refer to as a tool to model data. Data mining tools are effective at predicting the future and are robust to non-linear data, such as flight data. By focusing on clusters 13, 14 and 16, the safety data analysts could analyse how the change in headwind had an impact on the aircrafts vertical flight path and what the best techniques are to counteract this destabilisation. Performing tailored safety analyses using data mining would have the benefit of truly moving FDM from a status in-between safety-I and safety-II to a strong safety-II tool. It would greatly strengthen the airline’s SMS in terms of new SRM findings, which could be implemented into the flight training programmes internal safety communication.
5.4 Limitations
Several limitations are inherent to this study. The SOM algorithm requires some cleaning and pre-processing of the QAR data before it can be applied, which can be time-consuming for a data analyst and led to several flights being disregarded from the original dataset. Finally, the MiniSom package was used in Python, which is an introductory package into SOM. Using a more sophisticated SOM algorithm could return more precise results, although it would also increase the required computing power. FDM data mining has its drawbacks, though, especially as it needs to be tailored to what an analyst would like to look into and therefore can be difficult to reproduce or implement within the whole operation. As an example, performing the same data analysis for another airport less affected by wind changes would most probably lead to little results. Furthermore, it requires both a strong overall expertise among the safety analyst both in terms of safety data analysis tools and in terms of the particularities of the airline’s operations. It can also be time-costly compared to a traditional deviation-based analysis. For the purpose of this study, the authors were aware of the operational characteristics of the airport and approach (i.e. the increase in headwind). Thus, they knew what they were looking for. Performing a similar analysis for an approach with no previous operational experience may prove more difficult and may require a thorough overview of the different variables involved before deciding where to set a specific focus on.
6.0 Conclusion
Wind changes can often be difficult to identify within a QAR dataset, as they do not always lead to deviation from acceptable parameters if the pilots timely and adequately respond to the changes in aircraft energy. Therefore, they can be difficult to spot using traditional FDM data analysis methods. SOMs have shown to perform well and so can be a meaningful tool to cluster and analyse this type of flight data, complementing the traditional exceedance-based approach to flight data analysis. The analysis of the SOM clustering of the calculated headwind parameter according to the ICAO definition of a wind shear returned three clusters with wind changes of at least 10kts, most of them being around 15kts. Eighty-eight flights were identified as being concerned with wind changes, compared to the 27 flights identified by the airline through its FDM data analysis. These 88 flights within the QAR dataset provide valuable insights for the airline’s safety department, which would not have been identified through traditional exceedance-based methods. This allows airlines to take a step further towards a complementary safety-II based approach to QAR data analysis. The findings of these flights could then be used to create training scenarios for pilots and safety and operational recommendations among others. It highlights the benefits of using SOM and more generally clustering on flight data, as it provides additional insights into the dataset which would have been left unused otherwise.
Data availability statement
Due to commercial restrictions and a legally binding confidentiality agreement with the data provider, authors are not able to share the data publicly, so the supporting data is not available.
Competing interests
The authors declared that they have no commercial or associative interest that represents a conflict of interest in connection with the work submitted to the aeronautical journal.
Data source declaration
The dataset was provided by Edelweiss Air.


 Open access