


Introduction
Temperate grasslands have experienced some of the largest anthropogenic transformations in the world (Hannah et al. Reference Hannah, Carr and Lankerani1995, Samson & Knopf Reference Samson and Knopf1996, Hoekstra et al. Reference Hoekstra, Boucher, Ricketts and Roberts2005). These areas of predominantly non-woody herbaceous vegetation can be found across the globe in mid-latitude, semiarid regions. However, due to the deep, rich soils they frequently contain, nearly half of all original temperate grasslands have been converted to human use, primarily for cultivated agricultural production (Hoekstra et al. Reference Hoekstra, Boucher, Ricketts and Roberts2005). Remaining native grasslands, defined here as those that have never been cultivated or plowed and contain mostly non-invasive original plant communities, are thus at the highest level of risk for extinction among ecosystem types. For example, in the Tallgrass Prairie ecosystem of North America, native grasslands have nearly all been transformed into cropland, with less than 4% of their extent estimated to remain relative to pre-European settlement levels (Samson & Knopf Reference Samson and Knopf1996, Comer et al. Reference Comer, Hak, Kindscher, Muldavin and Singhurst2018).
Grasslands provide a number of benefits to society, including recreational use, forage for livestock, and water quality improvement services (Glaser Reference Glaser2014). Their high species carrying capacities, ability to mitigate floods, and substantial carbon sequestration benefits also make grasslands a significant landscape component for combating climate change. Native grasslands in particular are of elevated conservation value due to their rich biodiversity, millennia of stored soil carbon, and habitat quality that is superior to restored or planted grasslands (Bakker & Higgins Reference Bakker and Higgins2009). As such, protecting native grasslands has been deemed a conservation priority by governments and organizations across the globe (Glaser Reference Glaser2014).
Because of the rapid spike in demand for agricultural products over the last decade (Trostle Reference Trostle2010), there is growing concern that native grasslands in the USA (hereafter, prairie) may have experienced increased pressure to be converted to agriculture. In particular, high prices for crops like corn (Zea mays) and soybeans (Glycine max) can significantly enhance financial incentives to bring new land into cultivation, and this often tips land-use decisions towards converting grasslands to cropland (Rashford et al. Reference Rashford, Walker and Bastian2011, Claassen Reference Claassen2012, Miao et al. Reference Miao, Hennessy and Feng2013). Indeed, recent findings show widespread conversion of grassland to crop production, which suggests that prairies may also have come under increased risk of conversion (Lark et al. Reference Lark, Salmon and Gibbs2015).
Public ownership and permanent conservation easements, which are designed to prevent conversion of land to agriculture, are inadequate to protect prairie by themselves. For example, only 10% of the 3.3 million hectares (ha) identified as high priority in the Prairie Pothole region of the Dakotas has gained protection since 1998, and demands to create new conservation easements far exceed the funding available to support them (US Fish and Wildlife Service 2011, Walker et al. Reference Walker, Rotella, Loesch, Renner, Ringelman, Lindberg, Dell and Doherty2013). For most prairies that remain unprotected, two federal policies include provisions that could help curtail conversion, but have thus far been limited. First, the Renewable Fuels Standard (RFS) of the US Energy Independence and Security Act of 2007 aims to discourage conversion to biofuel row crops by making land converted from prairie ineligible for renewable feedstock production. However, spatially explicit monitoring for compliance with this RFS protection has not yet occurred (Wright et al. Reference Wright, Larson, Lark and Gibbs2017). Second, the 2014 Farm Bill included a regional Sodsaver provision that reduces insurance subsidies for crops grown on land converted from native sod or prairie (USDA Risk Management Agency 2014). The 2014 Sodsaver was limited to six states, however, and its potential impact remains uncertain due to the lack of adequate data for monitoring (Lark et al. Reference Lark, Salmon and Gibbs2015, Miao et al. Reference Miao, Hennessy and Feng2016).
The identification of prairie locations is essential to monitoring, but this is challenging. Unlike forested regions, where satellite remote sensing can provide insights into the age, species composition, and quality of forest stands, it is extremely difficult to differentiate native from non-native grasslands solely through satellite-derived data. This is largely due to the spectral similarity among grasslands, their limited area, and the extensive spatial, structural, and temporal diversity of their vegetation (Schuster et al. Reference Schuster, Schmidt, Conrad, Kleinschmit and Förster2015). For these reasons, no spatially explicit nationwide inventory of prairie exists.
Having recognized both the paucity of data and the threats to these lands, Minnesota undertook a comprehensive field and aerial survey in the late 1980s and early 1990s to assess the quality and extent of what remained of native prairie in the state (Minnesota Department of Natural Resources 1993, Horton Reference Horton2010). Of over 7 million ha recorded during the state’s early public land surveys (1847–1908), only 89 000 ha (1.2%) remained. In 2008, the Minnesota Department of Natural Resources (DNR) reassessed the status of many of those remaining prairie locations. As a result, Minnesota is currently the only state with both a comprehensive and recently evaluated inventory of prairie locations. These data provide a unique opportunity for continued assessment of ongoing conservation and policy.
We identify the Minnesota locations and rates of prairie-to-cropland conversion from 2008 to 2012 and compare our results to the rates and causes of prairie conversion from 1993 to 2008 (Horton Reference Horton2010). We delineate the types of crops planted on recently converted prairie and geographically characterize conversion in relation to conservation priority zones. To understand the current land conversion pressures facing prairies and all grasslands, we analyze broader land use trends across Minnesota, comparing lands within close proximity of prairies to all land state-wide. Lastly, we use our results to examine the potential effectiveness of recent policies that aim to improve prairie protection, and we identify opportunities to close gaps in their current implementation.
Methods
We used a two-stage methodology to identify and confirm the locations of native prairie that had been converted to cropland in Minnesota. First, we used satellite crop maps to screen for potential conversion to cropland from previously identified prairie locations. We then used aerial photographs to confirm conversion in the screened areas, and subsequently compared our results to historic conversion rates, conservation priority locations, and broader trends across the state.
Mapping Prairie Conversion
Our initial prairie locations were originally identified by the Minnesota Biological Survey (MBS) in the early 1990s using aerial photographs paired with field visits to most sites in order to confirm prairie extent and condition. In 2008, the DNR updated the MBS’s data to determine how much prairie remained intact and how much had since been lost, notably to developed land, agriculture, or degradation from encroachment by woody species (Horton Reference Horton2010). The updated DNR analysis, which served as our input dataset, reassessed over 32 000 ha of the 89 000 ha of prairie that had been mapped by the MBS by 1993 and for which good-quality aerial imagery was available in 2008.
We then used the US Department of Agriculture (USDA) Cropland Data Layer (CDL) to screen the DNR sample of remaining prairie sites for conversion after 2008. The CDL is a satellite-derived land cover map produced by the USDA National Agriculture Statistics Service, available annually for Minnesota since 2006 (Johnson & Mueller Reference Johnson and Mueller2010, USDA-NASS-RDD Spatial Analysis Research Section 2016). Tailored towards crop identification, the CDL provides field-level classification (30-m resolution) of major commodities such as corn, alfalfa, and soybeans, as well as non-crop covers such as herbaceous wetlands, deciduous forests, and developed land.
First, we used the CDL to remove areas from our prairie dataset that were labelled as cropland or developed land in 2008 to account for any discrepancies between the datasets and to remove areas of previous prairie conversion that may have been missed during the DNR assessment. We then identified sites of potential prairie-to-cropland conversion after 2008 by selecting locations labelled as crops in both the 2012 and 2013 CDL. Using 2 years of CDL data helped improve the accuracy of potential conversion locations. In addition, the 2013 CDL confidence layer was used to select only those areas mapped with classification certainty of at least 50%. This removed locations in which the remote sensing classifier had difficulty determining the specific land cover or discriminating among crop types. We further restricted our analysis to areas of potential change of at least 0.4 ha. This restriction increased the certainty of conversion identified by the CDL and follows recommended practices identified by producers and users of the CDL data (Lark et al. Reference Lark, Mueller, Johnson and Gibbs2017). Thus, only changes identified with high confidence were retained.
Next, we used aerial photographs from the USDA Farm Service Agency (FSA) National Agricultural Imagery Program (NAIP), as well as other high-resolution imagery from Google Earth® Pro, to confirm post-2008 conversion of prairie. The NAIP provides natural-colour aerial imagery during growing seasons across agricultural regions of the USA. (USDA Farm Service Agency n.d.). NAIP images are available at intervals of no more than every 5 years since 2003, every 3 years since 2009, and, in many instances, at 1- or 2-year intervals. The NAIP images were used to evaluate the CDL-identified conversions according to the guide in the Supplementary Material (Appendix S1, available online). Sites found to be in disagreement with the satellite assessment were subsequently removed. For the remaining sites of prairie that had been confirmed as converted to cropland, we used the CDL to identify the first crop planted upon conversion.
Subsequent Analyses
Many of Minnesota’s conservation partners recently collaborated to create a 25-year strategy for prairie conservation in the state (Minnesota Prairie Plan Working Group 2011). As part of this effort, the group identified 36 core areas with high concentrations of native prairie on which to focus conservation efforts, as well as key habitat corridors that connect the cores and facilitate species dispersal. We used these regions to assess the amount of conversion that occurred within each prairie core and corridor, as well as outside of the conservation zones, to situate prairie change locations and characterize the conservation challenges faced within and beyond the individual focus areas. Note that conservation core areas were identified based on their large concentrations of prairie and their retention of at least some of the features of a functioning prairie system. As such, they accounted for approximately 71% of the state’s remaining prairie locations (Minnesota Prairie Plan Working Group 2011).
We also used the National Land Cover Database (NLCD) to assess the broader land cover trends that surround prairies and occur across Minnesota. The NLCD classifies 20 land cover categories at 30-m resolution and includes a change analysis for 2006–2011 (Jin et al. Reference Jin, Yang, Danielson, Homer, Fry and Xian2013). We overlaid the NLCD 2006–2011 change product with the Minnesota Prairie Conservation Plan and our assessed prairie locations in order to identify changes that had occurred within the conservation zones, within a half mile of any assessed prairie site, and state-wide. We used the NLCD rather than the CDL for this application because the NLCD provided a consistent change product at sufficient thematic resolution and required fewer precautions than the CDL requires (Lark et al. Reference Lark, Mueller, Johnson and Gibbs2017).
Results
Area, Rates, and Current Uses of Converted Prairie
We screened 32 848 ha of prairie using our satellite change detection process and identified 721 ha of potential conversion distributed across 408 sites. During visual inspection of these sites using aerial photographs, we were able to confirm 167 ha of prairie conversion to cropland between 2008 and 2012. This represents 0.51% of the total prairie investigated in our dataset but should be considered a minimum value due to multiple methodological considerations (see below); total area and rates of conversion are likely to be higher.
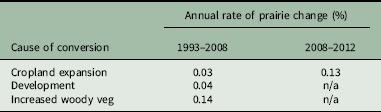
The average annual rate of confirmed prairie-to-cropland conversion was 0.13% – a rate more than four times greater than that found for the 1993–2008 period (0.03%; Table 1). The recent rate of prairie-to-cropland conversion also surpasses or matches the previous baselines for both conversion to developed land (0.04%) and increased woody vegetation (0.14%), which were previously responsible for higher average annual rates of prairie loss and degradation (Table 1). Conversion to development and increased woody vegetation were not reassessed here because they are difficult to detect through our satellite-based screening approach.
Annual average rates of prairie change before and after 2008. Rates calculated by dividing the percentage of assessed prairie that was converted to an alternative land cover during each period (1993–2008 and 2008–2012) by the number of years in each period. Rates for 1993–2008 derived from Minnesota Department of Natural Resources data (Horton Reference Horton2010). n/a = not assessed
The mean size of all visually assessed prairie patches was 1.8 ha (SD = 1.6), whereas the mean of only those confirmed as converted to cropland was 2.7 ha (SD = 4.1). From inspection of aerial photography, most identified conversion (97%) occurred via expansion of pre-existing crop fields into directly adjacent prairie (Fig. S1). Only four sites that changed from prairie to cropland were geospatially isolated from existing cropland.
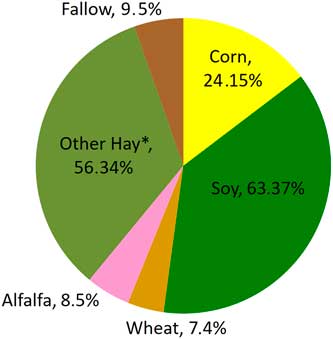
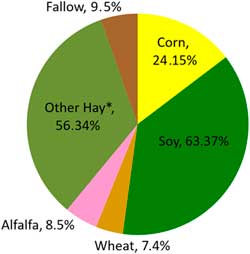
Of the converted prairie, 102 ha (61%) were immediately planted to row or closely grown crops, while 65 ha were first harvested for hay, planted to non-alfalfa hay, or tilled and left fallow for at least 1 year before conversion to an annual crop (Fig. 1). Among all of the breakout crops planted on newly converted land, soybeans were the most common.
Area and distribution of Minnesota native prairie converted to cropland, 2008–2012. Categories represent the breakout crop, or first crop planted on land converted from native prairie, from 2008 to 2012. The crop name, hectares, and percentages of total conversion are shown. *Other Hay includes planted non-alfalfa hay as well as land harvested for hay prior to planting to a row crop in a subsequent year.
Location of Converted Prairies in Relation to Conservation Zones
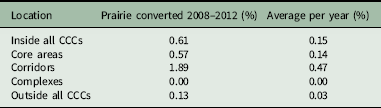
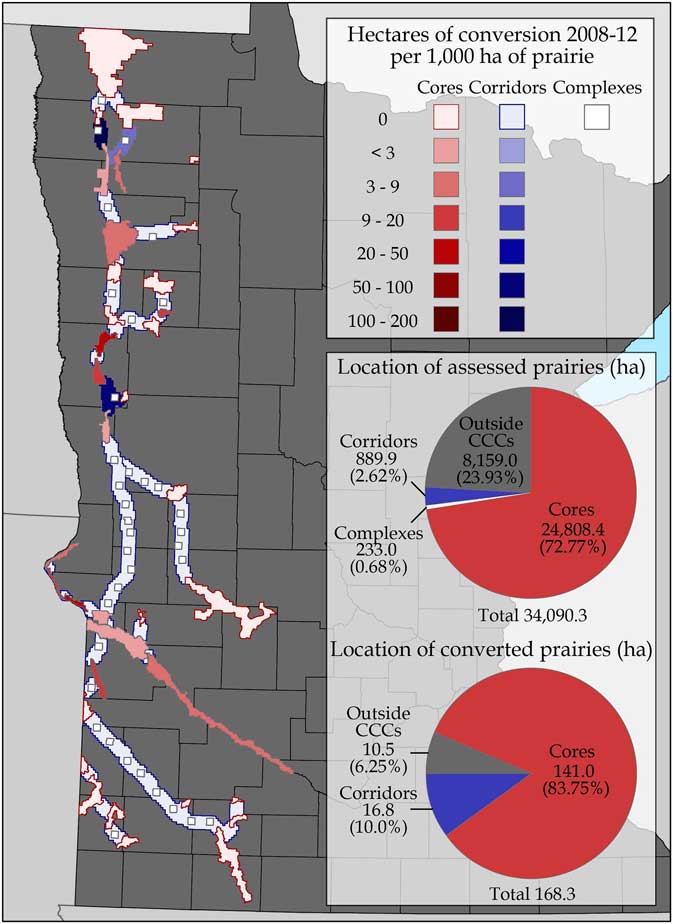
Overall, the areas within the Minnesota Prairie Conservation Plan’s core and corridor zones had substantially higher rates of conversion per hectare of assessed prairie than areas outside the plan’s zones (Table 2). A total of 73% of all prairie assessed in our study was located in conservation core areas, and 84% of all conversion occurred in them (Fig. 2). Corridor areas, identified as key connections between the higher-concentration core areas, contained just 2.6% of the assessed prairies, yet held 10% of all verified conversion. In particular, the corridors in the north-western portion of the state contained the highest conversion rates among all zones. Of the small parcels of prairie assessed within the 9-mile × 9-mile conservation complexes within corridors, no verified conversion was found.
Rate of conversion per hectare of assessed prairie within Minnesota Prairie Conservation Plan’s cores, corridors, and complexes (CCCs)
Map of conservation core and corridor areas and relative rate of prairie conversion within each. Zones are coloured according to number of hectares of prairie-to-crop conversion per 1000 ha of assessed prairie in that zone. Inset charts show the distribution of all assessed prairies and the subset of converted prairies in relation to conservation plan cores, corridors, and complexes (CCCs).
Surrounding Land-Use Pressures and Change
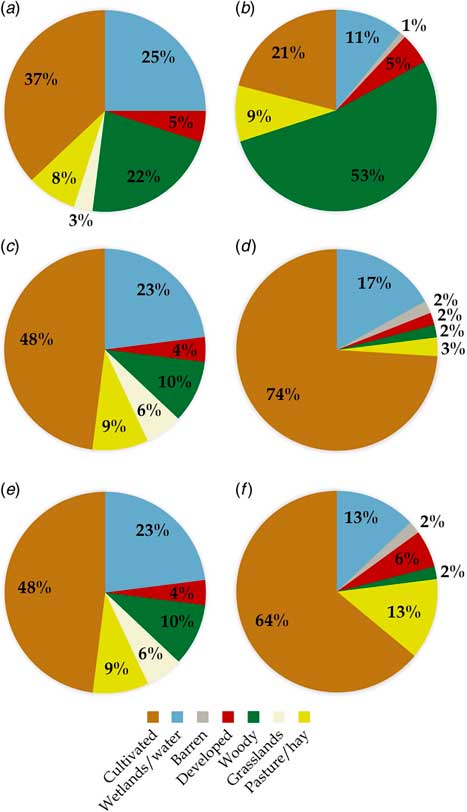
State-wide, Minnesota land cover is distributed almost equally among three broad groups: cultivated agriculture; wetlands and water; and managed and natural forests and grasslands (Fig. 3(a)). Within the conservation core areas and within half-mile radii of prairies, however, approximately half of all land is cultivated and woody cover is substantially less prominent (Figs 3(c) & 3(e)).
Distribution of 2006 land cover and causes of grassland loss, 2006–2011. Land cover in 2006 (a, c, e) and the 2011 land cover on grasslands lost between 2006 and 2011 (b, d, f) are each broken down by their distribution within the state of Minnesota (a and b), within conservation core areas (c and d), and within half-mile radii of all native prairie in the state (e and f).
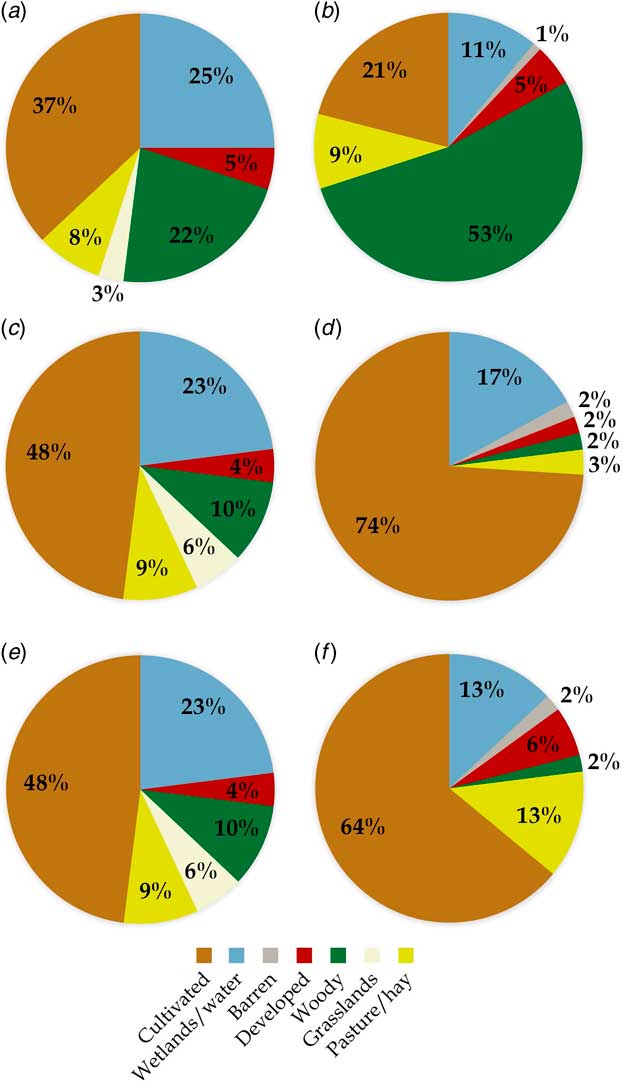
We looked specifically at changes in grasslands – including both prairie and non-native grasslands – to identify the broader pressures on these ecosystems both within the conservation zones and state-wide. Across all of Minnesota (Fig. 3(b)), growth of woody cover was the primary cause of grassland change and represented 53% of all grassland loss between 2006 and 2011. These incursions could represent, for example, the expansion of woody species into grassland areas where disturbances have been curtailed, or where forests regenerated on cleared lands that resembled grasslands. In contrast to this state-wide trend, conversion to cropland is the leading cause of grassland loss within prairie core areas (74%; Fig. 3(d)) and within 0.5 miles of all prairies state-wide (64%; Fig. 3(f)).
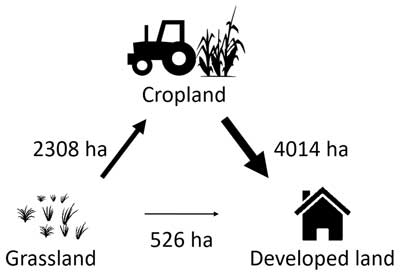
Development, or the growth of constructed materials, impervious surfaces, and built-up lands such as those used for housing, was not directly responsible for large areas of grassland loss but may have played an indirect role in amplifying pressure to convert grasslands and prairie to crops. State-wide from 2006 to 2011, ca. 2300 ha of grassland were converted to cropland (Fig. 4). At the same time, however, over 4000 ha of cropland were lost to development, thus supplanting previously productive land.
Net changes among grassland, cropland, and developed land in Minnesota, 2006–2011, in hectares. While more grassland was converted directly to cropland than to developed land, the large underlying conversion of cropland to developed land may exert additional pressure to convert grasslands to cropland in order to make up for the lost crop area. Arrow sizes are proportional to net area changes.
Discussion
Threats to Prairie Conservation in the Midwest
The annual conversion rate of prairie to cropland in Minnesota during 2008–2012 was over four times greater than during 1993–2008. This acceleration of conversion coincided with increasing prices for cropland rent and dramatic rises in prices for crops – both common indicators of the economic pressure to expand cropland area (Trostle Reference Trostle2010).
Soybeans were the most common crop planted following conversion, likely due in part to their agronomic suitability to new sod, including nitrogen use alignment, flexible planting period, and tolerance to herbicidal grass and weed control (Scharf et al. Reference Scharf, Quarles and Lory2000, McClure Reference McClure2011). The finding that soybeans and corn were the two most common annual crops planted on converted prairie also matches the findings of Lark et al. (Reference Lark, Salmon and Gibbs2015) for all types of land converted to cropland, as well as those of Morefield et al. (Reference Morefield, LeDuc, Clark and Iovanna2016) for the conversion of areas expiring from the Conservation Reserve Program (CRP). Taken collectively, these recent studies suggest that previous grassland vegetation type and use – whether native prairie, CRP, or other – does not substantially influence the selection and distribution of breakout crops, although additional analysis would be needed to confirm this. Regional location, on the other hand, does appear to influence breakout crop types (e.g., Lark et al. fig. 5, Morefield et al. fig. S2).
Our study primarily assessed small patches of prairie – characteristic of the remnant and pocket prairies found across agricultural landscapes of the Midwest – which contrast with the large swaths of native grasslands more typical of the western Great Plains. Most of the prairie-to-cropland conversion we observed occurred via incremental expansion of existing crop fields, rather than standalone conversion of entirely new fields. Ecologically, expansion of existing fields may have fewer impacts on wildlife than the conversion of standalone fields, which is more likely to induce new habitat fragmentation (Wimberly et al. Reference Wimberly, Narem, Bauman, Carlson and Ahlering2018). The incremental expansion pattern also suggests that parcels adjacent to current crops may be most vulnerable to conversion. Similarly, our finding that prairies within the conservation plan cores and corridors had higher per-hectare rates of conversion than non-plan parcels corroborates the critical importance of the priority zones identified in the plans.
Expansion of developed land was not the leading direct cause of grassland conversion, but it may pose a significant threat to grasslands and prairies by displacing existing croplands and thereby potentially elevating demand for new croplands in other locations (Greene & Stager Reference Greene and Stager2001, Livanis et al. Reference Livanis, Moss, Breneman and Nehring2006). Although a one-to-one replacement ratio between lost and new cropland does not exist due to variations and improvements in yields as well as broader economic and land response elasticities, the conversion of cropland to urban and developed land may create pressures for lost cropland area to be made up elsewhere through local activity, as well as by market-mediated influences (Coisnon et al. Reference Coisnon, Oueslati and Salanié2014, Emili & Greene, Reference Emili and Greene2014). However, more research is needed in order to better understand the potential indirect land-use change effects of development on grassland and prairie conversion. In terms of system dynamics, grasslands serve as a source of land for both new croplands and developed lands, and this puts the highly threatened grassland biome at elevated risk of destruction from multiple pathways.
Limitations, Bounding Estimates, and Improvements
Our estimate of prairie-to-cropland conversion area is highly conservative as it consists only of confirmed prairie locations that (1) were re-evaluated by the DNR in their 2008 rapid prairie assessment; (2) were identified as potential conversion through our CDL-based change detection algorithm; (3) were greater than 0.4 ha in size; and (4) had sufficient bookend aerial imagery to assess and confirm changes during 2008–2012. For example, 38 of 408 sites inspected during our photographic analysis did not contain sufficiently recent or clear imagery to confirm whether a change had occurred, thus reducing the total verifiable conversion. If the same rate of conversion occurred in these areas as in those with adequate imagery, we could then expect that another 6 ha had been converted. We can also estimate the amount of converted prairie that may have been missed during our screening stage. Using the known omission error rates for cropland identification in the Minnesota CDL – 0.021 and 0.018 for 2012 and 2013, respectively (Lark Reference Lark2017) – we estimate that as much as 1272 ha of potential prairie conversion could have been omitted from our aerial photograph assessment. If these unassessed regions had the same rate of photograph confirmation, this would suggest that up to an additional 252 ha of conversion may have been excluded. Together, these additional areas provide an upper bound estimate of 425 ha of prairie conversion, which would yield average annual conversion rates as high as 0.32% – 2.5 times greater than what we confidently identified and ten times the rate reported for 1993–2008.
Furthermore, we screened and assessed conversion on only the 32 848 ha of prairie in the DNR dataset of the 89 000 ha of total prairie estimated to remain in Minnesota. If the DNR data sample was representative of the total area, we could expect between 454 and 1152 ha of native prairie conversion state-wide. These estimates, as well as the conclusions about the locations of conversion, are dependent upon the DNR’s sample being representative of the state’s total population of prairie and our screening method being spatially unbiased. Nevertheless, in all cases, the rates and areas of prairie-to-cropland conversion reported in the results for 2008–2012 hold true as minimum values, while actual values may be much higher.
Indeed, other data also suggest that total area converted from prairie during 2008–2012 could be substantially higher than the visually confirmed area reported here. For example, the USDA FSA’s data on land brought into cultivation for the first time suggest that over 4000 ha of land were converted to cropland in Minnesota just in 2012 (USDA Farm Service Agency 2013). However, this account includes conversion of forests, wetlands, and other areas to cropland, whereas our assessment analyzed only prairies and only those locations that had been reconfirmed as such in 2008.
Future studies could, with improvements, include potential prairie conversion omitted from our study. To constrain the number of prairie sites selected for visual inspection, we used a high threshold for our satellite change detection algorithm. Given greater capacity for aerial photograph interpretation, a more inclusive algorithm that follows best practices for measuring change could be implemented during the screening stage (Lark et al. Reference Lark, Mueller, Johnson and Gibbs2017). Alternatively, object-oriented or machine learning-based methods could be used to assist both satellite and air photograph assessment, which would aid the conversion identification and confirmation processes (Blaschke Reference Blaschke2010, Rabia & Terribile Reference Rabia and Terribile2013). In addition, limitations in the accuracy and resolution of our remotely sensed data and change detection methodology precluded any assessment of native prairie conversion to developed or forested land under methods comparable to cropland. Ideally, assessment of these types of change would complement conversion to cropland in order to better understand the evolving and relative roles of each pressure.
Broader Implications
Crop prices are a major driver of land conversion to crops (Rashford et al. Reference Rashford, Walker and Bastian2011, Wang et al. Reference Wang, Luri, Janssen, Hennessy, Feng, Wimberly and Arora2017), but prices for corn, soybeans, and other major crops began to fall in 2014 and remain 20–60% lower today than their peak in 2012. Accordingly, the rate of prairie conversion may have decreased in recent years. However, conversion of land to cropland is not a fleeting decision, but rather a long-term economic investment based on relative prices and expected returns (Rashford et al. Reference Rashford, Walker and Bastian2011, Miao et al. Reference Miao, Hennessy and Feng2013). Thus, while conversion pressures may have receded from the peak era reported here, the overall threats to prairies are more enduring, and ongoing research into the conversion of grasslands to crops across the USA suggests only slight declines in conversion in the years following 2012 (Gage et al. Reference Gage, Olimb and Nelson2016). A potential benefit to the latest decrease in crop prices, however, is that any ensuing reductions in land prices and agricultural profits may enable more opportunities for conservation (Powell Reference Powell2015).
Our study was limited to Minnesota, but its findings may be relevant to other states, especially in areas with northern and central tallgrass prairie across the Midwest. During the 2008–2012 study period, most nationwide laws, regulations, and financial support for agriculture and the conversion of prairie to cropland were similar to those in Minnesota. Thus, we anticipate that the general trends we observed are wider ranging, though to different degrees. For example, we hypothesize that a much larger area of prairie conversion has occurred farther west, where native prairies constitute a greater proportion of the overall grassland area suitable for expanded crop production. States with less remaining prairie or more abundant alternative sources of cropland (e.g., planted pasture or former cropland exiting the CRP) may have experienced less conversion. However, because commodity crop prices are a major driver of prairie-to-cropland conversion and fluctuate rather synchronously across the USA, we expect the rates of conversion in all states, regardless of the extent of their remaining prairie, are likely to have increased relative to their previous baselines, barring local market factors or other influences.
The unique ground survey database of Minnesota prairie sites made our analysis possible. However, our two-stage approach of screening with satellite-based land cover products and confirming with high-resolution aerial photography provides a replicable strategy to combine automated and manual processes efficiently for applications where a high level of certainty is required. For example, a similar method could be used to measure conversion in other locations where state-level prairie mapping is underway (Bauman et al. Reference Bauman, Carlson and Butler2016). It may also be applicable to initial regional or nationwide inventories of intact lands and potential native prairie sites based on landscape modelling (Comer et al. Reference Comer, Hak, Kindscher, Muldavin and Singhurst2018), long-term satellite data (Lark et al. Reference Lark, Salmon and Gibbs2015) and/or Lidar (Fisher Reference Fisher2017). Combining such maps with our two-stage monitoring approach could produce geographic insights valuable for comparing the drivers of conversion and the effectiveness of conservation efforts and could potentially be accomplished with a concerted effort among state and regional agencies or the assistance of citizen science.
Policy Relevance and Recommendations
A number of policy actions may be appropriate to address the recent acceleration of prairie conversion. Initially, the ability to assess the status and conversion rate of native prairies would be enhanced if state and/or federal agencies were to develop, maintain, and make available improved data on prairies across the USA. Currently, Minnesota is the only state that has comprehensively mapped and evaluated its remaining prairie, although efforts are underway by other states as well (US Fish and Wildlife Service 2011). At the federal level, the FSA could immediately reinstate its monitoring and release of ‘new breakings’ data, which capture the conversion of all non-agricultural land to crop production. These data were released only once, in 2013, but could be reported annually without additional burden using data that the FSA already collects (USDA Farm Service Agency 2013).
Secondly, certain agencies may want to re-examine a range of policies that could be contributing to prairie conversion and counteracting federal conservation goals (Doherty et al. Reference Doherty, Ryba, Stemler, Niemuth and Meeks2013). For instance, the RFS seeks to protect native prairies by excluding their use for renewable feedstock production. However, the RFS land protections have not yet been explicitly monitored. Instead, they have been enforced through an aggregate compliance approach that deems all land eligible for feedstock production based on total nationwide cropland area estimates. When the rule was made, the US Environmental Protection Agency (EPA) posited that the amount of ineligible land that might be converted for feedstock production and permitted under aggregate compliance would occur at an acceptable, de minimis level (Federal Registrar 2010). However, the significant increase in observed prairie conversion rates appears to contradict the EPA’s presumption of a de minimis impact, which suggests a need to revisit renewable feedstock compliance mechanisms. As we show here, even seemingly small amounts of conversion represent multi-fold changes to the loss rates of the very limited remaining prairie.
The recent loss of prairie in Minnesota also demonstrates the rationale and need for Sodsaver, a provision that reduces federal crop insurance subsidies on converted native sod and prairie. However, our results reveal a potential shortcoming in the FSA’s current implementation of the native sod provisions. At present, converted prairie that is initially planted to alfalfa or other multiyear crops is exempt from Sodsaver’s protections, such that these areas can subsequently be planted to corn or other row crops without any decrease in crop insurance. Of the 167 visually confirmed hectares of prairie converted to crop production, as many as 39% were first planted to alfalfa or other hay. As it stands, these locations are still eligible for full crop insurance benefits, representing an implementation loophole that may undermine Sodsaver’s success. Including alfalfa and other forage crops under Sodsaver’s purview would more closely match the rule’s implementation to its legislative intent.
Although this analysis is limited to Minnesota, states other than the six currently included in the regional Sodsaver contain equal or greater extents of previously uncultivated grasslands at risk of conversion (Lark et al. Reference Lark, Salmon and Gibbs2015). Our finding of elevated prairie conversion rates suggests large areas of prairie loss may also be occurring in these other locations. Expanding Sodsaver to nationwide coverage, as proposed in the American Prairie Conservation Act (S. 1913/H.R. 3939) and certain Farm Bill discussions, would provide more equitable and comprehensive protection. More broadly, our finding that most converted prairies are planted to corn and soy – crops that are heavily subsidized through federal crop insurance – suggests that current farm support programmes and approaches may also be counteracting prairie conservation efforts (Claassen Reference Claassen2012).
In the ongoing evaluation of agriculture and development policies and associated conservation efforts, focused analyses such as our study and the prior rapid assessment by the Minnesota DNR can contribute timely information for decision-makers and policy-makers. Though limited in size and scope, the presence of actionable data from these studies – particularly in the absence of comprehensive monitoring or reporting – fills critical gaps in our knowledge and understanding. As the ongoing conversion of prairie continues, so too will the need to produce decision-ready science to support policy and conservation actions to protect these threatened native ecosystems.
Supplementary Material
For supplementary material accompanying this paper, visit www.cambridge.org/core/journals/environmental-conservation.
Acknowledgements
Thanks to George Allez and Alyssa Braun for editing this manuscript, to Daren Carlson from the Minnesota DNR and Steve Chaplin from The Nature Conservancy for their helpful comments on an early draft, and to the anonymous reviewers and the editors for their constructive feedback. Contributions: BL, TJL, HKG, and SB conceived the study; TJL and IS performed the analysis; TJL and BL wrote the paper; all authors revised and contributed feedback.
Financial Support
The authors were supported by the National Wildlife Federation and the Wisconsin Bioenergy Initiative at the time of this research.
Conflict of Interest
None.
Ethical Standards
None.


 Open access