


1. Introduction
In many economic and financial markets, rights to implement projects generating future cash flows are allocated through security-bid auctions, where payments depend on verifiable future revenues. These auctions feature securitized bids and long-term contracts that expose buyers to revenue uncertainty. The complexity and scale of these projects make participation costly, limiting the pool of buyers and prompting competition among sellers to attract scarce bidders.
These auctions typically use debt or equity securities to determine payments. In debt auctions, bidders submit a face value that acts as a payment cap—the seller receives either this amount or the project’s revenue, whichever is lower. In equity auctions, bidders offer a percentage share of the project’s revenue, so the seller’s payment varies proportionally with realized outcomes.Footnote 1
Because projects are scarce and buyers face high entry and due diligence costs, sellers often compete by tailoring security designs to attract participants. This competitive dynamic spans a range of settings. Real estate developers, for instance, compete for investors by offering equity stakes that share risks and returns (Chowdhry, Reference Chowdhry2022). Oil-lease auctions feature fixed-equity contracts offered by governments, where firms evaluate revenue shares against exploration costs and the insurance provided by equity (Bhattacharya et al., Reference Bhattacharya, Ordin and Roberts2022). Infrastructure agencies employ scaling auctions, which are mechanisms similar to security-bid auctions in which payments are linked to output and incorporate risk-sharing features absent in upfront cash auctions (Luo and Takahasi, Reference Luo and Takahasi2019; Bolotnyy and Vasserman, Reference Bolotnyy and Vasserman2023). In publishing, agents compete for editorial houses by typically varying security designs between debt and equity, with debt providing greater protection against downside risk (Skrzypacz, Reference Skrzypacz2013). Across these settings, sellers’ security choices influence who enters and how they bid, ultimately shaping competition over limited projects.
In this paper, we use an experimental approach to examine how seller competition affects both auction design and outcomes. Subjects act as sellers—choosing the security that will be used—and as buyers, bidding and, under competition, selecting which auction to enter. We compare monopolistic settings, with one seller and two buyers, to competitive settings—with two sellers and four buyers. Because competition is experimentally induced, and the economic fundamentals are directly observed, we can measure its effects and how they interact with participants’ choices.
Contrary to the theoretical predictions, we find that when given the option between entering an auction using debt or an auction using equity, buyers show a strong preference for equity. As a result, equity generates higher revenue under competition not directly because of its payoff structure, but because it attracts more buyers into the auction. This buyer entry effect creates stronger incentives for sellers to use equity bids under competition than when they are monopolists, since the value of attracting additional buyers overwhelms any differences in revenue conditional on entry. Despite these strong incentives, we find that sellers are not more likely to use equities under competition. Understanding why buyers systematically prefer equity remains an open question, but our data show that this preference, rather than the securities’ payoff structures per se, is what drives revenue differences under competition.
Background Each seller controls a project that generates either high or low stochastic revenue and seeks to allocate its rights via a second-price security-bid auction. Buyers, upon entering, privately learn their likelihood of receiving high revenue—i.e., their valuations follow an independent-private-values framework. Sellers operate either in isolation (monopoly) with two buyers or in competition with another seller for a pool of four buyers. In both cases, sellers must choose whether to use debt or equity as the auction’s security format.
In monopolistic settings, theory predicts that equity yields higher expected revenue than debt, as it more steeply ties payments to project revenue (DeMarzo et al., Reference DeMarzo, Kremer and Skrzypacz2005).Footnote 2 This stronger linkage makes equity more effective at extracting surplus, leading monopolistic sellers to prefer it. All auctions are predicted to be efficient, as equilibrium bids are monotonic in signals.
Under competition, the choice of security involves a trade-off. While equity still enhances revenue conditional on entry, it also deters entry by reducing bidder surplus, weakening buyer competition. This dampens the seller’s incentive to choose equity. Competition may also reduce efficiency if buyers fail to distribute evenly across auctions.
In turn, risk aversion strengthens the case for equity. Since it requires lower payments when revenue is low and higher payments when revenue is high, equity offers greater insurance to risk-averse buyers, encouraging entry and more aggressive bidding (Fioriti and Hernandez-Chanto, Reference Fioriti and Hernandez-Chanto2022; Carrasco and Hernandez-Chanto, Reference Carrasco and Hernandez-Chanto2022).
Experimental design We construct the simplest environment in which we can investigate the implications of different market structures on auction design, revenue, and efficiency. In the monopolistic setting, three subjects participate in each auction. One subject acts as the seller, choosing either debt or equity as their security design, and two subjects act as buyers, bidding for the rights to implement a risky project. Meanwhile, in the competitive setting, six subjects participate in each market. Two subjects act as sellers, whereas the other four subjects take on the role of buyers. Sellers compete for buyers using their choice of security design, while buyers need to decide which of the two auctions to join after observing sellers’ choices of equity or debt. Once they join an auction, they must submit a bid using the family of securities chosen by the seller. Subjects’ roles as sellers or buyers are chosen randomly at the beginning of each round.
In all auctions, buyers receive their private signals (drawn from a uniform distribution on the unit interval) and make bids using the security design chosen for their auction. Buyers are given an endowment, but the winner of the auction must invest that endowment in the project.Footnote 3 The project then generates either high or low revenue. Buyers’ signals indicate the likelihood that the project generates high revenue. The endowment, the project’s revenue, and all payments are made with experimental points.
Subjects participate in 30 rounds of auctions. All subjects act as buyers in rounds 1-10, where half of the auctions are run using equity and the other half are run using debt. These auctions, which are incentivized, allow subjects to gain experience with the structure of security-bid auctions and the two securities used in the experiment. We refer to these rounds as the Automated treatment, because a computer acts as the seller (similar to the formal auction treatments found in Breig et al. (Reference Breig, Hernández-Chanto and Hunt2022)). In rounds 11-30, subjects alternate between the Monopolistic and Competitive treatments, which affect the market structure as described above. At the end of each round, all subjects involved in the auction are informed of who won and all bids that were made in their auction. Subjects complete the experiment with a short survey. The ordering of the securities used in the first 10 rounds and the market structure used in rounds 11-30 were varied at the session level to balance any order effects.
Findings Our findings partially confirm theoretical predictions while also revealing unexpected patterns for monopolistic and competitive auctions. Contrary to theory, security design has little impact on sellers’ revenue in Automated and Monopolistic auctions. However, in Competitive auctions, equity increases revenue by over 50%, primarily because it attracts more buyers—a pattern partially consistent with Gorbenko and Malenko (Reference Gorbenko and Malenko2011) and Carrasco and Hernandez-Chanto (Reference Carrasco and Hernandez-Chanto2022), who emphasize security design’s role in encouraging entry under competition. Yet, while Gorbenko and Malenko (Reference Gorbenko and Malenko2011) predicts that debt should attract more bidders, our data show the opposite. Despite stronger incentives to use equity under competition, sellers run equity auctions at similar rates across treatments.
Although security design does not affect revenue when buyers cannot choose auctions, it does influence bidding behavior. Buyers overbid relative to the risk-neutral Nash equilibrium under debt for all signals and under equity for extreme signals, with no evidence that competition intensity alters bidding aggression. These results align with theoretical predictions for second-price auctions and rule out competition-induced cognitive bias.
Finally, because subjects act as both buyers and sellers, we examine correlations between their security choices. Contrary to theory, some subjects who favor equity as sellers also tend to enter equity auctions as buyers—a counterintuitive pattern, since a security that benefits sellers would typically reduce buyers’ payoffs or increase their risk.
Relevance of the experimental approach Empirical evidence on the influence of competition on auction and security design is limited. Because the level of competition is likely to be correlated with other characteristics that affect the optimal structure of these auctions, identifying the causal effects of competition on auction design is difficult. For this reason, controlled laboratory experiments are ideal to measure these effects. Existing work often finds that the behavior of experienced professionals is similar to that of standard laboratory subjects (Frechette, Reference Frechette, Fréchette and Schotter2015). Laboratory experiments have been used as a testing ground for auction design in complicated and high-value settings such as the FCC’s spectrum auctions (Goeree and Holt, Reference Goeree and Holt2010; Roth, Reference Roth2016). We expect our experiments to complement theoretical work and empirical approaches using field data.
2. Related literature
An increasing literature analyzes security-bid auctions due to their growing role in allocating complex projects and assets. Building on Hansen (Reference Hansen1985), which showed equity auctions yield higher revenue than cash auctions due to stronger linkage, later works (Riley, Reference Riley1988; Rhodes-Kropf and Viswanathan, Reference Rhodes-Kropf and Viswanathan2000) extended this to auctions combining cash and equity payments. DeMarzo et al. (Reference DeMarzo, Kremer and Skrzypacz2005) then generalized this finding to a large class of securities, showing that steeper securities generate higher revenue. Some studies challenge this revenue advantage under adverse selection, moral hazard, or negative externalities (Che and Kim, Reference Che and Kim2010; Kogan and Morgan, Reference Kogan and Morgan2010; Hernandez-Chanto and Fioriti, Reference Hernandez-Chanto and Fioriti2019), while others find that factors like endogenous entry or risk-averse buyers reinforce the beneficial role of steepness (Sogo et al., Reference Sogo, Bernhardt and Liu2016; Fioriti and Hernandez-Chanto, Reference Fioriti and Hernandez-Chanto2022).
Although most of the literature focuses on monopolistic auctions, real applications often involve multiple sellers competing for limited buyers, as noted in the introduction. To address this, Gorbenko and Malenko (Reference Gorbenko and Malenko2011) extended DeMarzo et al. (Reference DeMarzo, Kremer and Skrzypacz2005) to multiple sellers competing for a set of buyers. They analyzed symmetric equilibria, showing that any security can be part of an equilibrium by inducing adequate levels of participation. In large markets, the unique equilibrium involves pure cash, and binding reserve prices never occur unless the security is a call option.
Security-bid auctions have unique features that complicate sellers’ strategies compared to standard second-price auctions, where sellers compete by setting reserve prices and bidders focus on winning probabilities (McAfee, Reference McAfee1993; Peters, Reference Peters1997; Burguet and Sákovics, Reference Burguet and Sákovics1999; Hernando-Veciana, Reference Hernando-Veciana2005; Damianov, Reference Damianov2012). Extending this framework, Carrasco and Hernandez-Chanto (Reference Carrasco and Hernandez-Chanto2022) analyzed security-bid auctions under competition with risk-averse bidders. They showed that with two sellers, equilibria are symmetric when bidders have homogeneous risk aversion, but with heterogeneous risk aversion, sellers differentiate securities to attract different bidder types, driven by the greater insurance value that steeper securities provide (Fioriti and Hernandez-Chanto, Reference Fioriti and Hernandez-Chanto2022). This paper experimentally studies the effects of competition using the frameworks developed by Gorbenko and Malenko (Reference Gorbenko and Malenko2011) and Carrasco and Hernandez-Chanto (Reference Carrasco and Hernandez-Chanto2022).
Empirically testing many theoretical results is challenging due to limited data.Footnote 4 Buyers must conduct due diligence before bidding, and bids are usually private to protect sensitive information. Thus, an experimental approach is natural, allowing researchers to control auction mechanisms and market structures, directly observe decisions and private information, and rule out issues like project complementarities, common values, and repeated-game effects.
Following this methodology, Kogan and Morgan Reference Kogan and Morgan(2010) analyzed two entrepreneurs competing for investor funds in an English auction using equity or debt. The winning entrepreneur exerts costly effort to increase project value, with returns realized only upon success, creating a moral hazard setting. Their study highlights the extraction-incentives trade-off: equity extracts more surplus but reduces effort, while debt extracts less surplus but encourages effort. In contrast, our model abstracts from moral hazard and focuses on sellers competing through security designs, with primary concern on buyers’ pre-auction entry decisions rather than post-auction effort.
Breig et al. (Reference Breig, Hernández-Chanto and Hunt2022) studied buyer and seller behavior in formal and informal security-bid auctions. In formal auctions, the format combines either a first- or second-price rule with a debt or equity security. In informal auctions, buyers choose between equity or debt bids, and sellers are unconstrained in selecting the winner, requiring them to form beliefs about bid values. Contrary to theory, debt auctions raised more revenue than equity, mainly due to overbidding. Second-price equity auctions slightly outperformed other formats in terms of surplus, and noisy bidding had format-dependent effects. Buyers relied on equity more often than predicted, and sellers frequently selected dominant bids despite complex decision problems. Similarly, a contemporaneous study by Bajoori et al. (Reference Bajoori, Peeters and Wolk2024) found that equity auctions outperformed cash auctions in first-price settings, though equity underperformed relative to theoretical benchmarks. Consistent with Breig et al. (Reference Breig, Hernández-Chanto and Hunt2022), first-price auctions generated more revenue than second-price auctions regardless of the payment form.
We build on the framework of Breig et al. (Reference Breig, Hernández-Chanto and Hunt2022) to study second-price auctions in both monopolistic and competitive environments. Unlike their setup, sellers in our experiment choose a security design. In monopolistic settings, this choice only affects bid and payment structure, but under competition, it also influences bidder entry and bidding behavior. This allows us to examine buyer and seller decisions in a richer environment with endogenous entry and simultaneous seller competition.
Our results relate to experimental studies where subjects act as sellers. Greenleaf (Reference Greenleaf2004) and Davis et al. (Reference Davis, Katok and Kwasnica2011) analyze reserve price choices by auctioneers. Shachat and Tan (Reference Shachat and Tan2015) study buyers making take-it-or-leave-it offers after reverse auctions—interpreted as “ex post reserve prices”—further examined in Shachat and Tan (Reference Shachat and Tan2023). Breig et al. (Reference Breig, Hernández-Chanto and Hunt2022) includes a treatment where sellers choose among bids with different securities. While common in practice, our sellers’ security design choice is novel experimentally.
More broadly, we also contribute to the experimental literature on competition among principals offering differentiated contracts. For example, Cabrales et al. (Reference Cabrales, Miniaci, Piovesan and Ponti2010) studied a multi-stage game where principals offer fixed menus and agents select contracts, leading to effort-based production. In turn, Cabrales et al. (Reference Cabrales, Charness and Villeval2011) examined how bargaining power affects contract choice when agents have hidden information. Unlike these studies, we abstract from moral hazard, use auctions instead of bargaining, and allow contracts with securities rather than cash.
3. Theoretical framework and hypotheses
In this section, we discuss the theoretical results that are relevant to our experimental design. We present the simplest possible environment that captures the main features of sellers’ competition for bidders through their security-design choices.
A set of sellers  $\mathcal{S}=\{1,\dots,n_s\}$ have one indivisible project each and seek to individually allocate the
  $n_s$ ex-ante identical projects among a set of interested buyers
  $\mathcal{B}=\{1,\ldots,n_b\}$. Each seller uses a second-price auction to allocate his project. Although the format is predetermined, sellers have the flexibility to choose the security design between the equity and debt families to run their auctions.
Conditional on winning the auction, any buyer  $i \in \mathcal{B}$ must make a non-contractible investment of
  $\kappa_i\equiv \kappa=2000$ to implement any project. This investment can be interpreted as the cost of foregoing other investment opportunities due to the allocation of funds from buyers’ portfolios and is common knowledge to all buyers (Che and Kim, Reference Che and Kim2010). If buyer
  $i$ acquires a project and makes the required investment, the project yields a stochastic and contractible revenue of
  $Z_i \in \mathcal{Z} \triangleq \{z_L,z_H\}$, where
  $z_L=2000$ refers to the revenue that the project yields in the low state of the world and
  $z_H=6000$ refers to the revenue in the high state. A project has no value if it is retained by any seller.
Buyers observe sellers’ choices of security designs before deciding which auction to join. After selecting an auction, each buyer  $i$ receives a private signal
  $p_i \in [0,1]$ that corresponds to the probability of being in the high state. Hence, the distribution of
  $Z_i$ conditional on the buyer’s signal is Bernoulli with parameter
  $p_i$. Bidders learn their signals after entering their chosen auction since due diligence is costly.Footnote 5 Signals are drawn independently from a uniform distribution on the unit interval. All probability mass (density) functions are commonly known by all sellers and buyers.
Securities Bids are expressed as derivative securities, where the underlying asset is the project’s revenue  $Z$. A security is a function
  $S: \mathcal{Z} \times [s_L,s_H] \to \mathbb{R}$, where
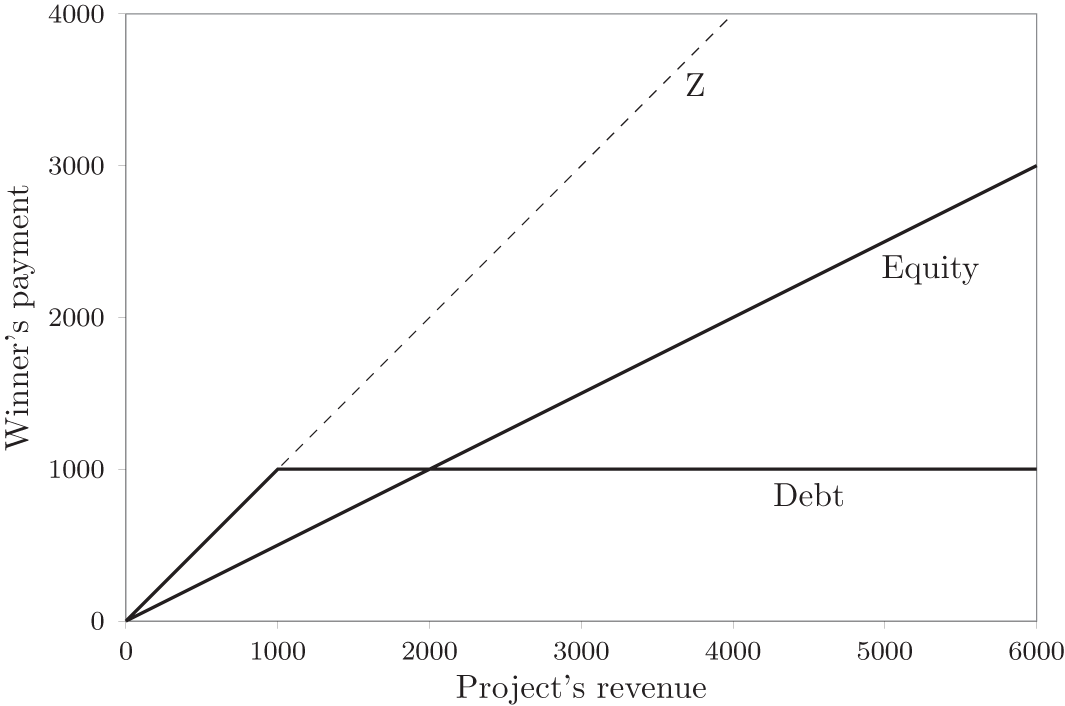
  $[s_L,s_H]$ denotes a generic index set over which securities could be defined. In this paper, we focus on two specific securities: debt and equity, depicted in Figure 1. In the case of equity, the security function is
  $S(z,e) = e z$, where
  $e \in [0,1]$ represents the equity share and
  $z$ the realized revenue. In the case of debt, the security function is
  $S(d,z) = \min\{0, z-d\}$, where
  $d \in {\mathbb{R}}_+$ is the face value of the debt (i.e., the payment cap) and
  $z$ the realized revenue.
Market structure We consider two market structures that vary in the competition faced by sellers. The first one corresponds to monopolistic auctions, in which one seller seeks to sell one project among the set of buyers  $\mathcal{B}=\{1,2\}$. The second one corresponds to competitive auctions. Here, two sellers
  $\mathcal{S}=\{1,2\}$ compete to allocate their ex-ante identical indivisible project among
  $\mathcal{B}=\{1,2,3,4\}$ buyers by means of their choices of security designs.
Example mapping of project revenue to payments from the winner to the seller for debt and equity

Competition creates a trade-off in sellers’ security design: with risk-neutral bidders, flatter securities (like debt) attract more bidders but yield less revenue per bidder, while steeper securities (like equity) attract fewer bidders but generate higher revenue per entry. Additionally, Fioriti and Hernandez-Chanto (Reference Fioriti and Hernandez-Chanto2022) shows that with risk-averse bidders, the insurance each security provides affects bidder entry and seller revenue, further complicating the seller’s choice.
Auction format We focus on formal second-price auctions, in which the winner is the buyer who submits the highest bid, and the final price paid corresponds to the second-highest bid.
Equilibrium We follow Gorbenko and Malenko (Reference Gorbenko and Malenko2011) to focus on symmetric Bayes-Nash equilibria, and we require that buyers’ strategies are sequentially rational. That is, buyers use their weakly dominant bidding strategy and, in the competitive scenario, their entry strategy maximizes expected payoffs for all combinations of sellers’ security choices. We compute equilibrium strategies using backward induction.
Timing In the competitive setting, sellers begin by selecting a security design—either equity or debt—for use in their second-price auctions. Once these choices are made, bidders observe the selected security designs and decide whether to enter a given auction. Upon entry, buyers receive a signal about the project’s revenue, after which they observe the number of competing entrants and submit their bids. Finally, the auction outcomes are determined, revenues are realized, and payments to the seller are made.
3.1. Buyer behavior
3.1.1. Bidding strategies
DeMarzo et al. (Reference DeMarzo, Kremer and Skrzypacz2005) and Fioriti and Hernandez-Chanto (Reference Fioriti and Hernandez-Chanto2022) show that in second-price auctions with debt or equity, the unique symmetric equilibrium involves buyers bidding to be indifferent between winning and losing at their bid. For equity, the symmetric strategy is given by a bidding function  $e: [0,1] \to [0,1]$, where
  $e(p)$ denotes the share of revenue a buyer with signal
  $p$ offers to the seller. A risk-neutral buyer with signal
  $p$ chooses
  $e^{*}(p)$ to solve:
 \begin{equation}
0 = (1 - e(p))[p z_H + (1 - p) z_L] - \kappa,
\end{equation}
\begin{equation}
0 = (1 - e(p))[p z_H + (1 - p) z_L] - \kappa,
\end{equation} where  $z_H$ and
  $z_L$ are the project’s high and low payoffs, respectively, and
  $\kappa$ is the buyer’s cost of implementing the project. This bidding rule constitutes a weakly dominant strategy: it makes the buyer indifferent at the margin and does not depend on beliefs about other bidders.
The left-hand side of equation (1) reflects that any buyer receives a payoff of zero if they lose the auction, while the right-hand side gives the expected payoff from winning at price  $e^*(p)$.
The equilibrium bidding function for second-price debt auctions can be derived analogously. Let  $d: [0,1] \to {\mathbb{R}}_+$ denote the debt bid submitted by a buyer with signal
  $p$, where
  $d(p)$ represents the face value of the debt promised to the seller. A risk-neutral buyer with signal
  $p$ chooses
  $d^*(p)$ to solve:
 \begin{equation}
0 = p \max\{ z_H - d(p), 0\} + (1 - p) \max\{z_L - d(p), 0\} - \kappa
\end{equation}
\begin{equation}
0 = p \max\{ z_H - d(p), 0\} + (1 - p) \max\{z_L - d(p), 0\} - \kappa
\end{equation}Unlike equity, the payoff structure induced by debt is nonlinear in the project’s realization, due to truncation at the promised face value. This nonlinearity introduces kinks in the expected payoff function. Nevertheless, the strategy in (2) remains weakly dominant, as the bid equates the buyer’s utility from winning and losing and is independent of beliefs about other bidders.
Full derivations of both bidding functions are provided in Appendix A. These characterizations underpin the behavioral predictions tested in our experimental design.
Hypothesis 1.
In second-price auctions using debt, buyers will bid according to
 \begin{equation}
d^*(p)=\begin{cases}4000p \text{ if } p\le \frac{1}{2} \\ 6000-\frac{2000}{p} \text{ otherwise} \text,\end{cases}
\end{equation}
\begin{equation}
d^*(p)=\begin{cases}4000p \text{ if } p\le \frac{1}{2} \\ 6000-\frac{2000}{p} \text{ otherwise} \text,\end{cases}
\end{equation}while in second-price auctions using equity, buyers will bid according to
 \begin{equation}
e^*(p)=\frac{2p}{2p+1}.
\end{equation}
\begin{equation}
e^*(p)=\frac{2p}{2p+1}.
\end{equation}Importantly, submitting a bid that induces an expected payoff equal to the buyer’s outside option is a dominant strategy regardless of the number of opponents in the auction.Footnote 6
The theoretical results from the security-bid auction literature also provide strong predictions about the relative efficiency of the auction formats. In the equilibria described above, bidding strategies are increasing in the buyers’ private signals so the project is always assigned to the participant buyer with the highest chance of generating high revenue.
Hypothesis 2.
Conditional on the set of buyers in the auction, all auctions are efficient. That is, the buyer with the highest signal in the auction wins.
3.1.2. Auction entry
Toward determining the ex-ante entry probabilities for each auction, we first need to compute buyers’ interim and ex-ante utilities of joining each particular auction for each possible number of participants in the auction. It is worth highlighting that bidders’ interim utilities can be computed at two stages conditional on their entry decision to an auction run under  ${S} \in \{D,E\}$: (i) when bidders only know the number of opponents in the auction,
  $U(k \mid {S})$; and (ii) when bidders know both the number of opponents in the auction and their signal,
  $U(k,p_i\mid {S})$.
Because the auction format is a second-price, if there is only one entrant, the winning buyer obtains the rights to the project at a price of zero. That is, if there is only one buyer in an auction then their expected payoffs are the revenue generated from the project, so  $U(1,p_i \mid D)=U(1,p_i \mid E)=6000p_i+2000(1-p_i)-2000=4000p_i$. Conversely, when competition is present, the bidder’s payment depends on the first-order statistic of the signals from the
  $k-1$ opponents, which has density
 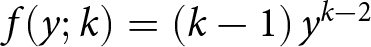 $f(y; k) = (k-1) \, y^{k-2}$. Hence, when there are
  $k \geq 2$ buyers in the auction, bidder
  $i$ with signal
  $p_i$ has interim utility in a debt auction given by:
 \begin{align*}
U(k,p_i \mid D)=\int\limits_0^{p_i} \left[p_i(6000-d^{*}(y))+(1-p_i)\max\{2000-d^{*}(y),0\}-2000\right]f(y;k)dy\text{.}
\end{align*}
\begin{align*}
U(k,p_i \mid D)=\int\limits_0^{p_i} \left[p_i(6000-d^{*}(y))+(1-p_i)\max\{2000-d^{*}(y),0\}-2000\right]f(y;k)dy\text{.}
\end{align*}Similarly, for equity we have
 \begin{align*}
U(k,p_i \mid E)=\int\limits_0^{p_i} \left[(1-e^*(y))[6000p_i+2000(1-p_i)]-2000\right] f(y;k)dy\text{.}
\end{align*}
\begin{align*}
U(k,p_i \mid E)=\int\limits_0^{p_i} \left[(1-e^*(y))[6000p_i+2000(1-p_i)]-2000\right] f(y;k)dy\text{.}
\end{align*} We then compute bidders  $i$’s interim expected utility conditional on the number of entrants as
 \begin{align*}
U(k\mid S)=\int\limits_0^1 U(k,p_i\mid S)f(p_i)dp_i
\end{align*}
\begin{align*}
U(k\mid S)=\int\limits_0^1 U(k,p_i\mid S)f(p_i)dp_i
\end{align*} for any  $S \in \{D,E\}$. Computing interim utility conditional on the number of entrants is key to determining equilibrium entry strategies, as buyers learn their signals only after entry due to costly due diligence.Footnote 7
Given the security choices made by the sellers,  $S_1$,
  $S_2\in \{D,E\}$, we label the probability that the buyer enters the
  $S_1$-auction as
  $q(S_1,S_2)$. In equilibrium, buyers will enter whichever auction offers them weakly higher payoffs in expectation. These payoffs depend on the security that is chosen for the auction and the probability that other buyers will enter the auction. Since we focus on symmetric equilibria, a buyer’s ex-ante utility of entering the
  $S_1$-auction is
 \begin{align*}
\mathcal{U}(S_1)=\sum_{k=1}^{4} \binom{3}{k-1}q(S_1,S_2)^{k-1} [1-q(S_1,S_2)]^{4-k} {U}(k\mid S_1),
\end{align*}
\begin{align*}
\mathcal{U}(S_1)=\sum_{k=1}^{4} \binom{3}{k-1}q(S_1,S_2)^{k-1} [1-q(S_1,S_2)]^{4-k} {U}(k\mid S_1),
\end{align*} with the symmetric equation holding for the derivation of  $\mathcal{U}(S_2)$.
Hence, the equilibrium entry probability  $q^{*}(S_1,S_2)$ must satisfy:
 \begin{align*}
&\sum_{k=1}^{4} \binom{3}{k-1} q(S_1, S_2)^{k-1} [1 - q(S_1, S_2)]^{4-k} U(k \mid S_1)\\
=& \sum_{k=1}^{4} \binom{3}{k-1} [1 - q(S_1, S_2)]^{k-1} q(S_1, S_2)^{4-k} U(k \mid S_2)
\end{align*}
\begin{align*}
&\sum_{k=1}^{4} \binom{3}{k-1} q(S_1, S_2)^{k-1} [1 - q(S_1, S_2)]^{4-k} U(k \mid S_1)\\
=& \sum_{k=1}^{4} \binom{3}{k-1} [1 - q(S_1, S_2)]^{k-1} q(S_1, S_2)^{4-k} U(k \mid S_2)
\end{align*} When both sellers choose the same type of security, the unique equilibrium entry probabilities are 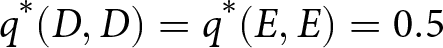 $q^*(D,D) = q^*(E,E) = 0.5$. When the sellers choose different securities, the unique equilibrium probability is
 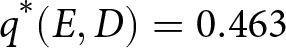 $q^*(E,D) = 0.463$. In both scenarios, these probabilities are such that the expected utilities from entering each auction are equalized.Footnote 8
Hypothesis 3.
In any symmetric equilibrium, the buyers’ entry strategy  $q^*$ is such that:
(i) If buyers are risk-neutral or homogeneously risk-averse then
 $q^{*}(D,D)=q^{*}(E,E)=0.5$.
(ii) If buyers are risk-neutral
$q^{*}(E,D)=1-q^*(D,E)\approx 0.463$.


3.2. Seller behavior and payoffs
Most of the literature on security-bid auctions has focused on monopolistic settings. Seminal contributions by Hansen (Reference Hansen1985), Riley (Reference Riley1988), and Rhodes-Kropf and Viswanathan (Reference Rhodes-Kropf and Viswanathan2000) show that equity auctions yield higher revenue than cash auctions. DeMarzo et al. (Reference DeMarzo, Kremer and Skrzypacz2005) generalizes this result to a broad class of standard securities (e.g., debt, equity, call options) that satisfy two-sided limited liability, showing that the steeper the security, the higher the expected revenue for the seller.
In our setting, under the assumption that both sellers and bidders are risk neutral, the seller’s interim expected revenue, conditional on the number of buyers entering the auction, can be expressed as
 \begin{align*}
V(k\mid S)=\int\limits_{0}^1 [4000p](kp^{k-1})dp -kU(k\mid S).
\end{align*}
\begin{align*}
V(k\mid S)=\int\limits_{0}^1 [4000p](kp^{k-1})dp -kU(k\mid S).
\end{align*} That is, because the mechanism is anonymous, agents are risk-neutral, and auctions are efficient, the seller’s expected revenue can be expressed as the total surplus generated by the project when  $k$ bidders participate minus the corresponding buyers’ expected surplus. These computations are carried out explicitly in Appendix A.
While our model’s parametric nature allows precise revenue predictions, the ranking it implies is more broadly applicable. Following DeMarzo et al. (Reference DeMarzo, Kremer and Skrzypacz2005), securities are ranked by steepness—where a steeper security yields a higher expected payment slope starting from equal expected payments. Figure 1 shows equity is steeper than debt, and under general conditions, steeper securities generate higher revenue for a fixed number of bidders.Footnote 9
Hypothesis 4.
Conditional on the number of buyers, a second-price equity auction generates a higher expected revenue than a second-price debt auction.
This hypothesis has immediate implications for the behavior of monopolistic sellers: they should always run their auctions using equity because the number of buyers in their auction will not depend on their choice. The dominance of equity persists with risk-averse buyers, as equity offers more insurance, prompting more aggressive bidding (Fioriti and Hernandez-Chanto, Reference Fioriti and Hernandez-Chanto2022). However, the result may not hold with risk-averse sellers, who may prefer the insurance provided by debt.
While the seller’s optimal choice is straightforward in monopoly, competition complicates it by adding the challenge of attracting buyers. Steeper securities extract more surplus and yield higher revenue for a fixed number of buyers, but deter entry. Since seller revenue grows with more buyers, equilibrium involves balancing attracting bidders and extracting surplus, given other sellers’ choices.
To determine the equilibrium security choice for sellers, we take the equilibrium behavior of buyers (including bidding behavior and auction entry decisions specified in Hypotheses 1 and 3) as given. The payoff for Seller  $i$ of choosing security
  $S_i$ while seller
  $j$ chooses
  $S_j$ can be written as
 \begin{equation}
\mathcal{V}(S_i\mid S_j)=\sum_{k=0}^4 {4 \choose k} q(S_i,S_j)^k[1-q(S_i,S_j)]^{4-k}V(k\mid S_i).
\end{equation}
\begin{equation}
\mathcal{V}(S_i\mid S_j)=\sum_{k=0}^4 {4 \choose k} q(S_i,S_j)^k[1-q(S_i,S_j)]^{4-k}V(k\mid S_i).
\end{equation} Equation 5 makes the seller’s trade-off clear. Running the auction using equity bids increases the profits for a given number of sellers, i.e., 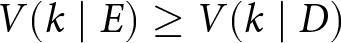 $V(k\mid E)\ge V(k\mid D)$ for all
  $k$, but lowers the likelihood that buyers enter the auction, i.e.,
 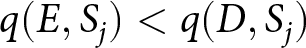 $q(E,S_j) \lt q(D,S_j)$ for any
  $S_j$. We compute
  $\mathcal{V}(S_i\mid S_j)$ for
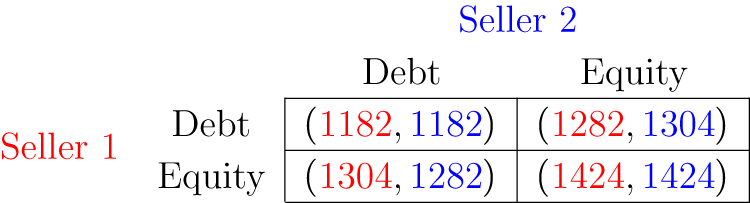
  $S_i,S_j\in\{D,E\}$ and use it to create the normal form of the security choice game shown in Figure 2.
Theoretically predicted security choice game for sellers

Examining the game in Figure 2, it is clear that a unique dominant-strategy equilibrium exists where sellers run auctions using equity bids—making equity the optimal choice regardless of the competitor’s security. Consequently, we expect sellers in the experiment to favor equity, leading to the second part of Hypothesis 5. While our analysis focuses on symmetric equilibria for convenience, this assumption is justified: Carrasco and Hernandez-Chanto (Reference Carrasco and Hernandez-Chanto2022) shows that with two sellers and homogeneously risk-averse bidders, all equilibria are symmetric.
Hypothesis 5.
Sellers will choose to run their auction using equity under both monopoly and competition.
While the prediction under equilibrium is that sellers will always choose equity, this expectation is tempered by a comparison of the payoff calculations under competition versus those under monopoly. In the unique equilibrium under competition, switching from debt to equity increases expected payoffs by 100-120, or less than 10%. On the other hand, switching from debt to equity as a monopolist increases expected payoffs by over 350, which is more than 25%. Thus, we may expect that sellers would be more likely to select debt under competition. This is consistent with the intuition presented in Gorbenko and Malenko (Reference Gorbenko and Malenko2011), which argues that larger markets (holding the ratio of buyers to sellers constant) should be associated with sellers using flatter securities.
Finally, we discuss the ex-ante expected distribution of payoffs under competition and relate them to the ex-ante expected distribution of payoffs under monopoly. Because each competitive setting has two projects that can be implemented, in making comparisons we divide the total surplus of the competitive setting by two.Footnote 10 Hypothesis 2, which states that auctions are efficient conditional on entrants, is expected to hold regardless of whether sellers are competitive or monopolistic. Thus, any differences in efficiency are due to the allocation of buyers across auctions.
Hypothesis 6.
As compared to Monopolistic auctions, Competitive auctions will generate less revenue, more buyer surplus, and less total surplus.
The shift in surplus distribution from Monopolistic to Competitive auctions stems mainly from random buyer selection, not changes in sellers’ choices of securities, since equity is optimal in both settings. It reflects the concavity (convexity) of seller (buyer) payoffs in the number of entrants. Adding a second buyer greatly boosts seller payoffs and reduces buyer payoffs, but further entrants yield diminishing changes. Hence, auctions with only one buyer notably reduce seller payoffs and increase those of buyers. Similarly, total surplus is lower under competition because the expected highest signal is a concave function of entry (David, Reference David1997), and equilibrium entry is more variable under competition than under monopoly.
The formal hypotheses that we discuss in this section follow directly from the theoretical predictions. However, it is reasonable to consider alternative hypotheses. Breig et al. (Reference Breig, Hernández-Chanto and Hunt2022) show that buyers systematically overbid in security-bid auctions and that a small amount of surplus is lost due to noisy bidding. Auction entry (for buyers) and auction design (for sellers) may also be affected by intrinsic preferences for one security over another, or by novelty effects (e.g., equity may initially seem more attractive than bidding in points, with such novelty diminishing over time). Any of these deviations from theoretical benchmarks could alter the distribution of surplus, perhaps differentially across competitive environments. Our approach is therefore not to treat the formal hypotheses as the only reasonable predictions, but rather as a benchmark against which to compare the empirical results.
4. Experimental design
The experiment consisted of four sessions conducted at the University of Queensland Behavioural and Economic Sciences Cluster (BESC) during the months of September and October of 2022. Subjects were recruited using Sona Systems, and a total of 126 individuals took part in the study. Demographic summary statistics are available in Appendix Table B.1. Each subject appeared in only one session, which was completed in person via computer terminals. The experiments were coded using oTree (Chen et al., Reference Chen, Schonger and Wickens2016). All rounds involved stranger matching. Screenshots of the experiment are provided in Appendix D.
We designed the experiment to allow for within-subject analyses of how market structure and the security used for bidding affect behavior.Footnote 11 Each auction was carried out under one of three market structures—Automated, Monopolistic, or Competitive—which we refer to as the “Seller Treatment.” The first ten auctions each subject participated in were Automated, while auctions 11–30 alternated between Monopolistic and Competitive formats. In Automated auctions, a computer acted as the seller and two subjects as buyers. In Monopolistic auctions—called “3-player auctions”—one subject acted as the seller and two as buyers. In Competitive auctions—called “6-player auctions”—each group consisted of two sellers and four buyers. Groups and roles were randomized between each round.
All sessions followed a standard procedure. Upon arrival, subjects received an information sheet and consent form. After consent was obtained, an experimenter read instructions for the first 10 rounds aloud. Participants then reviewed the rules, were shown examples, and completed a comprehension quiz. They proceeded with 10 rounds of Automated auctions. Next, instructions for the final 20 rounds (Monopolistic and Competitive auctions) were read aloud, followed by another quiz. Participants then completed rounds 11–30. Finally, they filled out a short survey and were paid based on a randomly selected auction.
Aside from the treatments noted above, the economic fundamentals of each auction were the same and matched those described in Section 3. Payoffs were in points, with 100 points corresponding to one Australian dollar. At the beginning of each auction, both buyers and sellers were endowed with 2000 points.
Automated auctions In Automated auctions, subjects learn their probability of winning high revenue and are reminded of the auction’s security design—equity bids called “percentage bids” and debt bids called “point bids.” The bidding page includes an interactive slider to explore possible payoffs,Footnote 12 with examples shown in Figure 3.
Bid page for an equity-bid auction in the Automated treatment

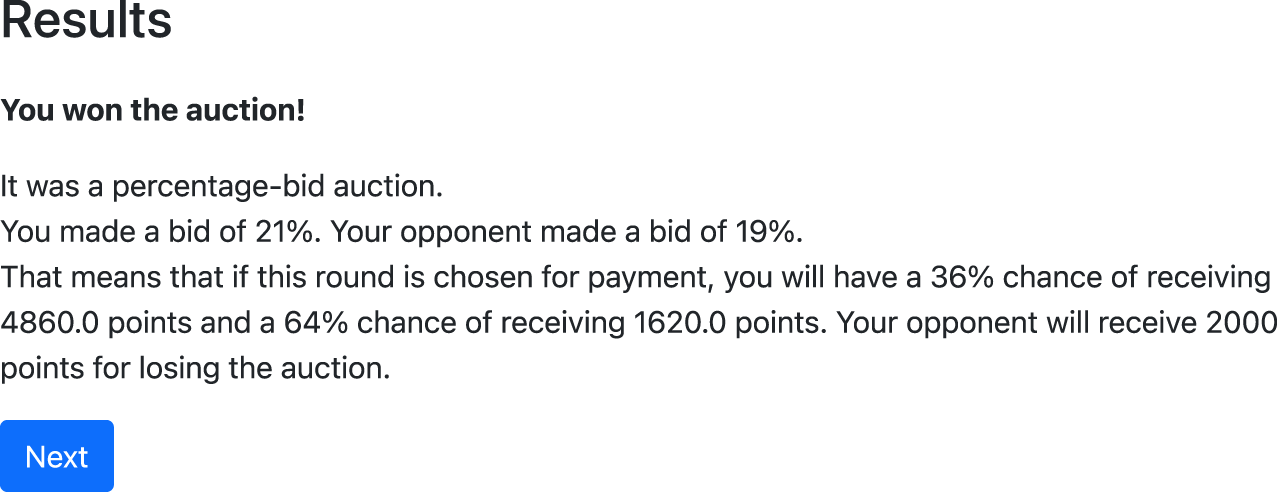
After placing their bid (an integer between 0 and 6000 points in debt-bid auctions or an integer between 0 and 100% in equity-bid auctions), subjects were displayed with the auction’s result. The winner of the auction was informed of her potential high and low payoffs and the probabilities of receiving them. She was also informed about the losing bid. Meanwhile, the loser was informed of their payoffs and their opponent’s bid. Neither buyer was informed of the revenue realization or their opponent’s signal. An example of a winning buyer’s results page can be found in Figure 4.
Results page for winner of a percentage-bid auction

Monopolistic auctions In Monopolistic auctions, the subject assigned the role of the seller moved first, determining whether their auction would be run using either debt bids or equity bids. The security-choice page provided the sellers with an interactive feature that displayed their payments for each security conditional on the realized price and revenue level. An example of the security choice page for a seller can be found in Figure 5.
Seller’s security design page for a Monopolistic auction

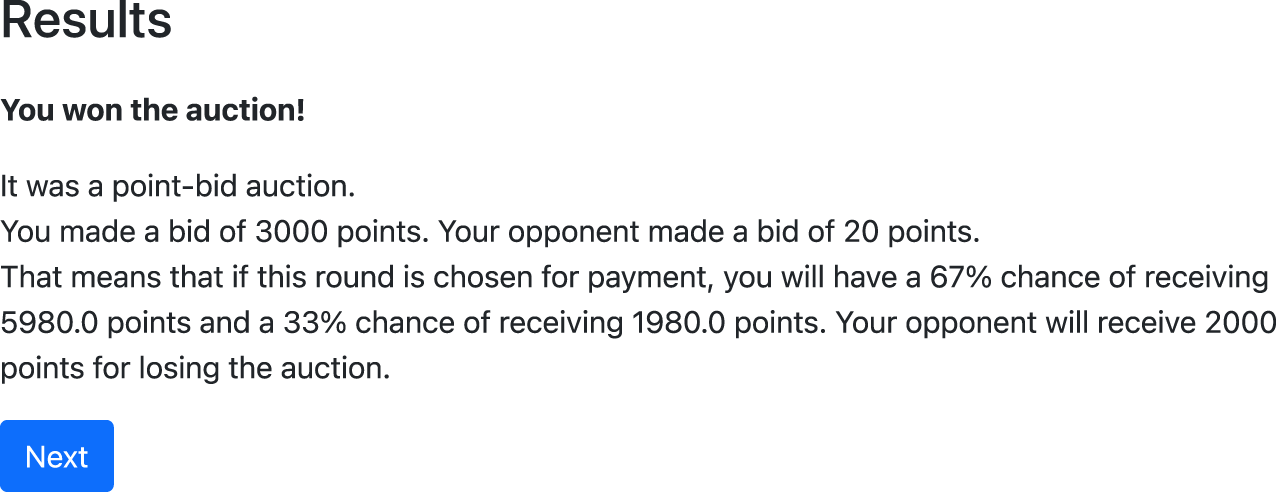
After the seller chose a security, buyers received a bidding page similar to Automated auctions and were informed of the chosen design. Once both bids were submitted, results were shown to both the seller and the buyers. Buyers saw the same info as in Automated auctions. The seller was reminded of their chosen design, shown both bids, and their potential payoffs, but not the revenue realization or bidders’ signals. An example of the results page for a Monopolistic debt-bid auction can be found in Figure 6.
Results page for the winner of a Monopolistic point-bid auction

Competitive auctions In Competitive auctions, subjects assigned the role of the seller were given the option to choose between debt and equity for their auction. They were provided with the same interactive feature as was provided in Monopolistic auctions, showing payments to the seller conditional on security, realized price, and realized revenue.
After both of the sellers had chosen their security design, the four buyers were informed of the sellers’ choices and given the option to choose which auction to enter. When making this decision, buyers had access to an interactive feature that allowed them to compute their payoffs conditional on the security used and the realized price. Consistent with the theoretical model, buyers made their choice simultaneously and did not know the number of other buyers entering either auction. Figure D.19 in the Appendix shows an example of the auction-choice page for a buyer.
After selecting which auction to enter, buyers moved to the bidding page.Footnote 13 Each buyer is informed about the number of opponents in the auction and makes a bid. Otherwise, the bidding page was similar to those in the Automated and Monopolistic auctions.
After all bids were made, each subject saw the results: number of buyers in their auction, the winning and second-highest bids, and potential payoffs. Only the winner learned their chances of receiving these payoffs. If a subject was the sole entrant, they were told they won by default.
Payoffs and Survey After finishing all thirty auction rounds, the computer randomly chose one round to determine payments. The subjects were informed of the chosen round and the potential outcomes with their respective probabilities. They were also informed of any randomizations that occurred and their total payments. Subsequently, they completed a demographic survey and a cognitive reflection rest (Frederick, Reference Frederick2005). Subjects were asked to provide feedback on the experiment as well as their level of understanding of the experiment and their level of confidence in their strategy.
In addition to any earnings from the round selected for payment, all subjects were paid  $\$1$ for each quiz question they answered correctly and
  $\$20$ for completing the experiment (this is the lab’s required minimum payment for a two-hour experiment). Sessions lasted two hours. Total payments (including the completion fee, quiz payments, and payments from one round selected at random) ranged from
  $\$24$ to
  $\$99$ with an average total payment of
  $\$56.42$.
5. Results
5.1. Buyer behavior and payoffs
We begin by analyzing how subjects bid relative to the equilibrium predictions.Footnote 14 Across both debt and equity auctions, we observe systematic deviations from optimal bidding. At the same time, we find that the number of competitors has no discernible effect on bidding behavior. The following result summarizes these patterns:
Result 1.
Subjects systematically overbid relative to the risk-neutral Nash equilibrium: overbidding occurs across all signals in debt auctions and for low and high signals in equity auctions. Bidding behavior does not vary with the level of seller competition or the number of competitors in the auction.
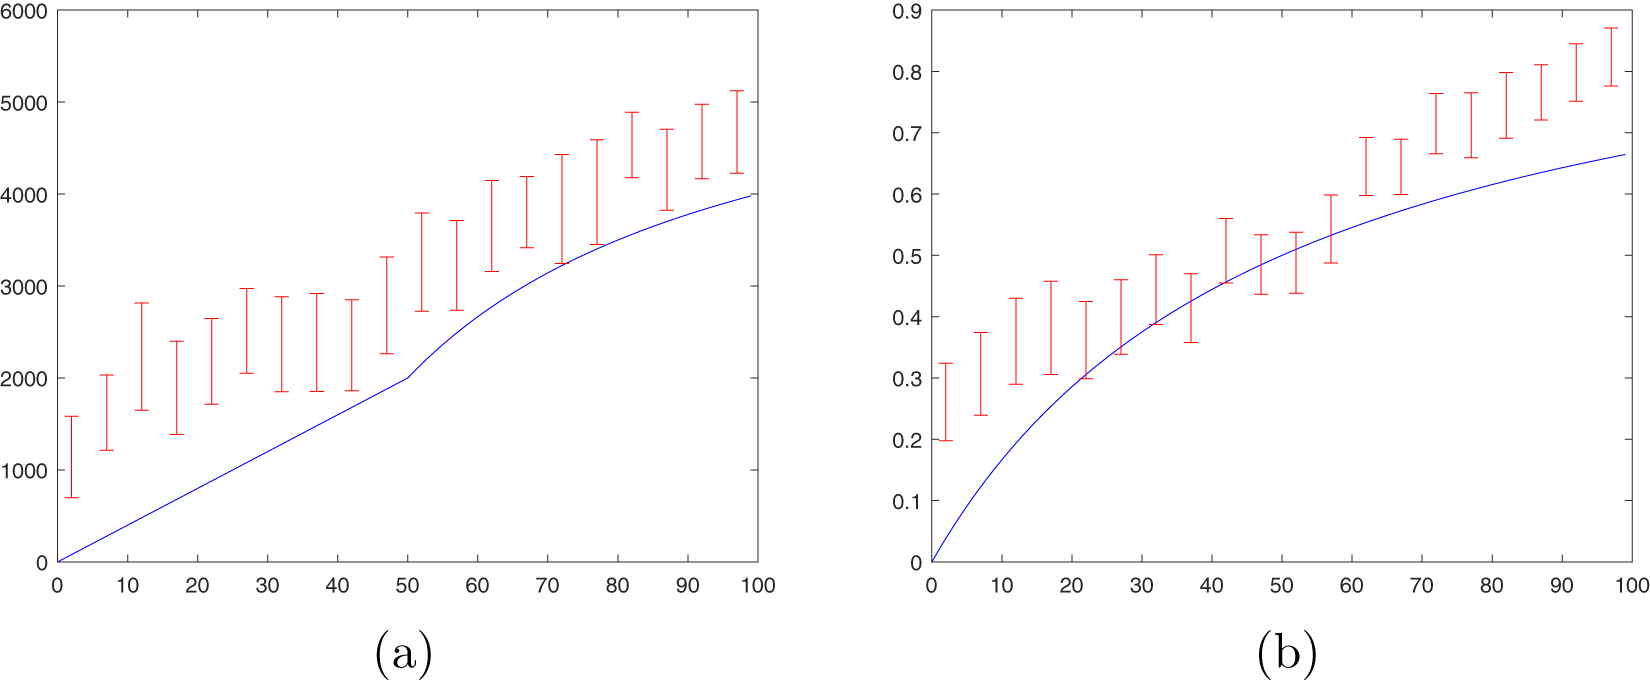
Average bidding behavior as a function of the buyer’s signal can be found in Figure 7, with debt-bid auctions summarized in panel (a) and equity-bid auctions summarized in panel (b). The Nash equilibrium bids provided in Hypothesis 1 are shown in blue. Bids from the experiment are pooled in windows of 5 signals (0-4, 5-9, etc. until 95-100) for comparison purposes. We then compute 95% confidence intervals for the average bid conditional on the signal being within the window and plot them in red. The figure indicates that subjects overbid for all signals in debt-bid auctions and for extreme signals in equity-bid auctions. Thus, we can reject Hypothesis 1.
Average bids with 95% confidence interval conditional on signals falling within windows of 5. Panel (a) refers to second-price debt and panel (b) to second-price equity

The empirical average bidding functions we find closely match those in Breig et al. (Reference Breig, Hernández-Chanto and Hunt2022), who extensively explored their determinants (see Appendix Figure B.1). They ruled out explanations like risk aversion, alternative equilibria, and non-standard preferences for overbidding. Since we replicate these functions with a within-subject design, the original results are unlikely to be statistical anomalies.
The effect on bids of changes in the level of seller competition and the number of entrants into the auction can be found in Table 1.Footnote 15 The table presents coefficients from a fixed-effects regression of the level of overbidding (the subject’s bid minus the RNNE bid) on the treatment variables and round, which is a proxy for experience. Columns (1), (3), and (5) restrict attention to debt-bid auctions while columns (2), (4), and (6) restrict attention to equity-bid auctions. When not restricting to data from the competitive treatment, the constant is positive and statistically significant, reflecting the overbidding apparent in Figure 7.
Overbidding levels by treatment and number of bidders

***,**,* Notes: Linear regression with subject-level fixed-effects and standard errors clustered at the subject level. Within R-Sqd reports the R2 from the subject fixed-effects estimator, based on variation within subjects over rounds after removing buyer fixed effects. Significance indicated by: p $ \lt $0.01, p
 $ \lt $0.05, p
 $ \lt $0.1.
The results show that the level of bidding is not significantly affected by either the level of seller competition or the number of buyers. The coefficients on Monopolistic and Competitive are not statistically significantly different in any specification (no  $p$-value is less than 0.2).Footnote 16 Coefficients on indicator variables for the number of bidders in the auction are also not significantly different from zero (no
  $p$-value from an
  $F$-test for joint significance is less than 0.5).
We next evaluate the efficiency of these auctions conditional on the buyers that entered them.
Result 2.
Approximately 10–15% of potential surplus is lost due to misallocation. The majority of this loss is attributable to idiosyncratic bidding noise rather than to mismatches arising from heterogeneity in bidders’ average bidding behavior.
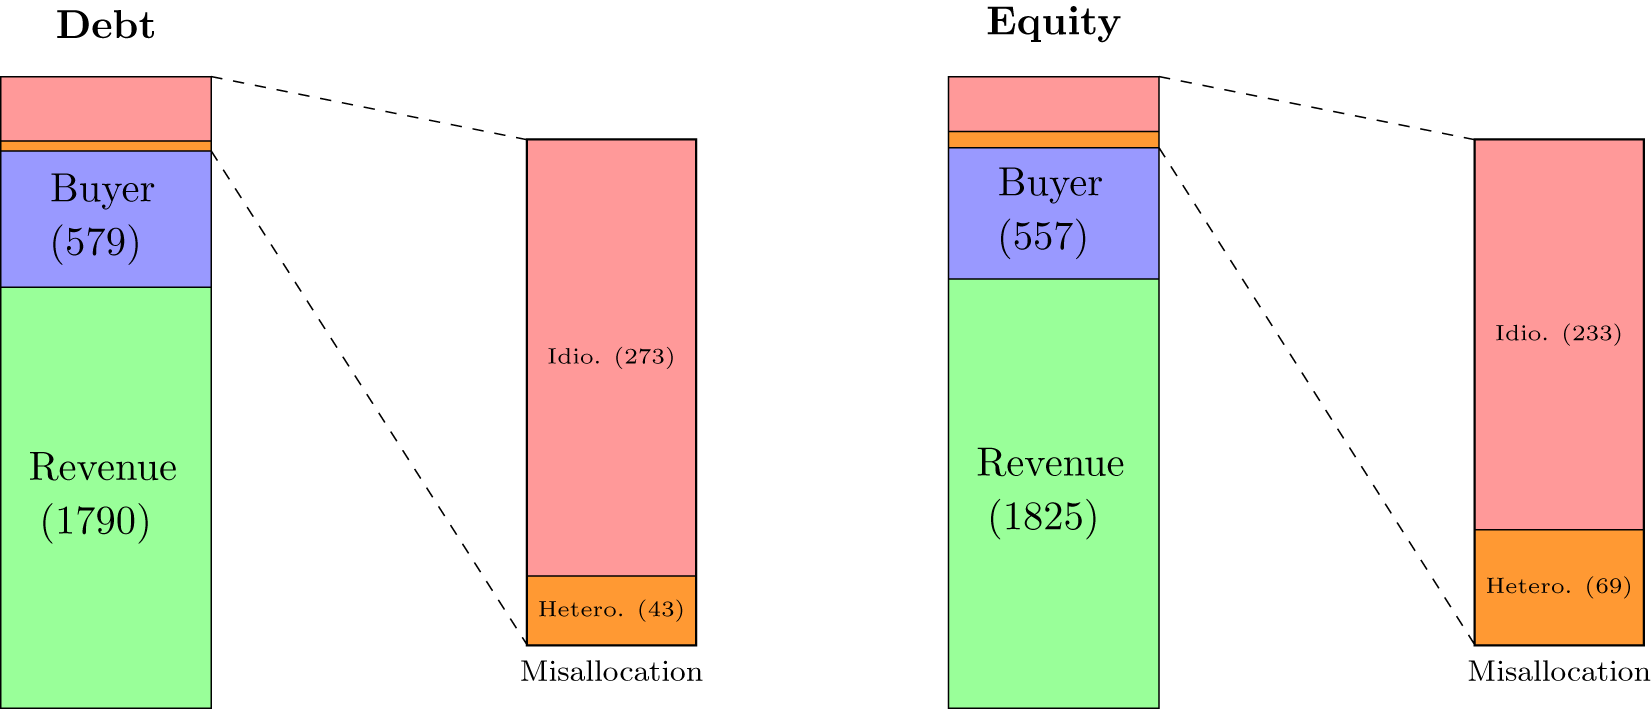
The evidence supporting Result 2 is presented in Figure 8, which illustrates how total potential surplus (defined as the expected total surplus that would be realized if the buyer with the highest signal always won the auction) is allocated. Roughly 90% of this surplus is realized in practice, with the majority accruing to the seller.
Surplus distribution conditional on entry

By definition, misallocation occurs when a buyer with a lower signal wins the auction. Conceptually, this can arise through two channels. First, some bidders may systematically submit higher bids than others. When such an “overbidding type” is matched with a bidder who bids closer to equilibrium, the former may win the auction despite receiving a lower signal. Second, bidders’ behavior may exhibit idiosyncratic noise—i.e., round-level deviations from their typical bidding pattern—which can also lead to inefficient allocation.
To assess the relative importance of these two sources of misallocation, we conduct the following decomposition. For each bidder and each security type, we compute the average amount by which their bids exceed the Nash Equilibrium prediction. We then construct “adjusted bids” by subtracting this average overbidding amount, effectively normalizing each bidder’s average overbidding level to zero. We recalculate misallocation using these adjusted bids. This procedure reduces misallocation by 43 points in debt-bid auctions and 69 points in equity-bid auctions. We attribute these reductions to misallocation caused by heterogeneity in bidding behavior. The remaining misallocation (273 points in debt-bid auctions and 233 points in equity-bid auctions) is attributed to idiosyncratic noise.
We now evaluate how buyers make entry choices in competitive auctions. The theoretical prediction is that buyers will balance the likelihood of being in an auction with fewer bidders with the properties of the security used in those auctions.
Result 3.
Buyers’ auction entry decisions reveal systematic patterns across conditions.
(i) When presented with two auctions using the same security, buyers are slightly more likely to enter the one labeled Auction 1.
(ii) When presented with two auctions using different securities, buyers choose to enter equity auctions approximately 60% of the time.
(iii) Entry into equity-bid auctions is positively correlated with quiz scores, negatively correlated with subjects’ self-reported understanding of rules, and uncorrelated with other demographics.
(iv) Buyers earn higher and more variable payoffs when entering debt auctions compared to equity auctions.
Columns (1) and (2) of Table 2 estimate the likelihood of entering the auction labeled as 1 under different combinations of seller securities. The independent variables indicate the ordering of securities across the two auctions: for example, ED refers to cases where Auction 1 uses equity and Auction 2 uses debt. When both auctions use the same security (i.e., DD or EE), the auction label is the only distinguishing feature. Under Hypothesis 3(i), entry should be equally likely across the two auctions, implying a choice probability of 0.5. However, the estimated average rates of choosing Auction 1 (computed as the constant plus the relevant coefficients) are greater than 0.5 in both cases. An  $F$-test rejects the null that these averages equal 0.5 (
 $p = 0.0001$), leading us to reject Hypothesis 3(i) and providing evidence for Result 3(i).
Buyer security choice

***,**,* Notes: Linear regression with subject-level fixed-effects and standard errors clustered at the subject level. Within R-Sqd reports the R2 from the subject fixed-effects estimator, based on variation within subjects over rounds after removing buyer fixed effects. Significance indicated by: p $ \lt $0.01, p
 $ \lt $0.05, p
 $ \lt $0.1.
Columns (3) and (4) of Table 2 report the rate of selecting to enter the equity-bid auction when both types of security are available to the buyer. The regression shows that the rate of choosing to enter equity-bid auctions is roughly 60%, which is significantly higher than the predicted value of 46.3%. This is the evidence for Result 3(ii) and allows us to reject Hypothesis 3(ii). In column (4), we control for Round (which, for competitive auctions, spans the range from 11 to 30) to proxy for experience. While there is some evidence that subjects are less likely to choose to enter equity-bid auctions as they become more experienced, the relationship is not significant and not large enough to approach the equilibrium prediction. In contrast to the case when both securities are the same, in these auctions there appears to be no preference for the first listed auction.
Result 3(iii) discusses the subject-level correlates of choosing to enter equity-bid auctions. The evidence for these results can be found in Appendix Table B.4, and a histogram of rates of equity at the subject level can be found in Appendix Figure B.3. The results show that none of the demographic measures we collected were significantly correlated with choosing to enter equity-bid auctions. The regressions also show that overbidding rates in Automated auctions and buyers’ experiences in Competitive auctions are not statistically significantly related to the choice of security as a buyer.Footnote 17 However, the choice of security as a seller is highly correlated with entry choices as a buyer. This final point will be explored further in Section 5.2.
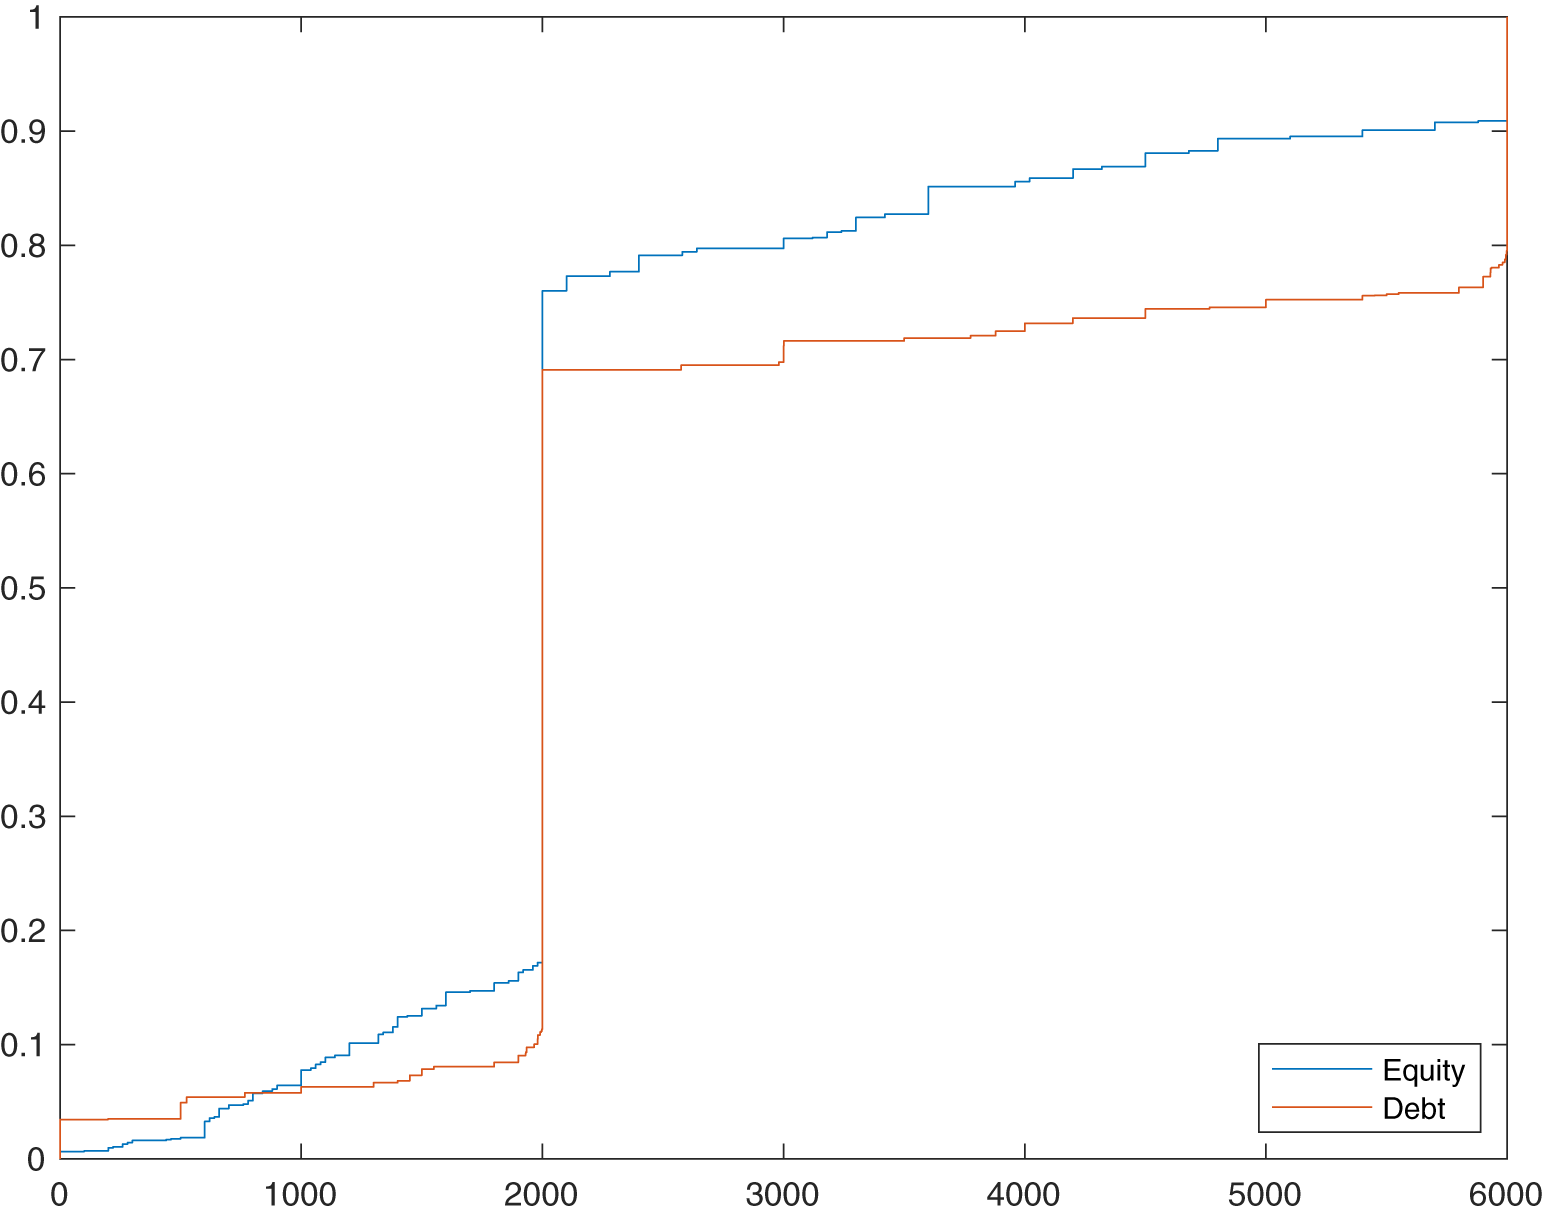
Finally, Figure 9 provides the full distributions of buyer payoffs under the two securities and is the evidence for Result 3(iv). Because buyers are more likely to enter equity-bid auctions than debt-bid auctions when given the chance, they face more competition and receive lower payoffs on average (2971 in debt-bid auctions as compared to 2453 in equity-bid auctions). However, the higher payoffs come at a cost of higher variance. This is partially due to the insurance effect provided by equities and described in more detail in Fioriti and Hernandez-Chanto (Reference Fioriti and Hernandez-Chanto2022) and Carrasco and Hernandez-Chanto (Reference Carrasco and Hernandez-Chanto2022).
Distribution of buyer payoffs by security choice

5.2. Seller behavior and payoffs
We now examine sellers’ payoffs across treatments and security choices.
Result 4.
Seller revenue patterns differ across auction environments:
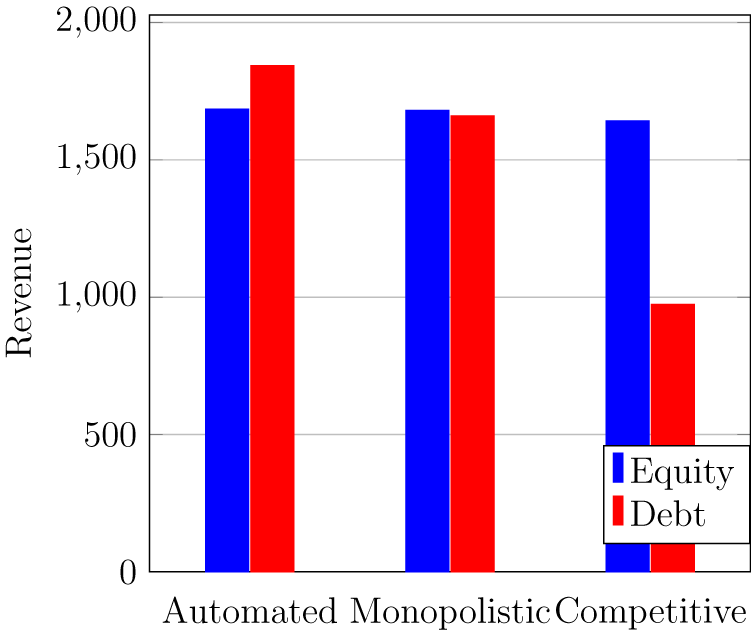
(i) In Automated and Monopolistic auctions, the security used for bidding does not have a statistically significant effect on revenue.
(ii) In Competitive auctions, equity emerges as the empirically dominant strategy: average payoffs of choosing equity are higher regardless of what security is chosen by the other seller, and the distribution of revenue under equity first-order stochastically dominates the distribution of revenue under debt. This is driven primarily by buyers’ greater propensity to select equity auctions.
Figure 10 shows average auction revenue by security and treatment.Footnote 18 The figure shows that the security used has only a minor effect on seller payoffs for Automated and Monopolistic auctions, and these differences are not statistically significant.Footnote 19 We can reject the null hypothesis that equities generate revenue that is 359 points higher on average (two-sided tests generate  $p$-values of less than 0.01 for Automated auctions and equal to 0.02 for Monopolistic auctions). Thus, this is evidence against Hypothesis 4.
Average revenue by treatment and security

Figure 10 also shows debt auctions earn much less than equity auctions under competition. Table 3 reveals that a seller’s revenue increases when they choose equity but decreases when their competitor chooses equity. However, controlling for buyer entry reduces these effects by more than half and renders them statistically insignificant, indicating that security choice influences revenue mainly by affecting buyer entry.
Revenue by opponent security (competitive auctions only)

***,**,* Notes: Linear regression with session- and round-level fixed-effects. Standard errors are clustered at the market level, so each pair of competitive auctions belongs to its own cluster. Significance indicated by: p $ \lt $0.01, p
 $ \lt $0.05, p
 $ \lt $0.1.
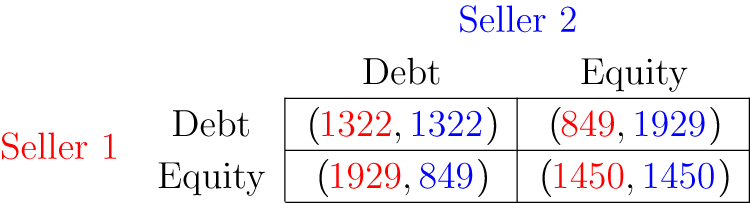
We use the calculated payoffs from column (2) of Table 3 as payoffs to generate the normal-form game in Figure 11, which can be compared to its theoretically predicted counterpart in Figure 2. In both the theoretical prediction and the empirical realization, choosing equity is a dominant strategy for the sellers. Indeed, as can be seen in Appendix Figure B.2, the revenue generated by choosing to run the auction using equity first-order stochastically dominates the revenue generated by choosing debt. However, this relationship appears more strongly empirically than it does theoretically. The RNNE predicts that switching from debt to equity increases revenues by a maximum of 142, but empirically the minimum increase is 601.
Empirically realized (average) security choice game for sellers

Next, we analyze the security choices of sellers.
Result 5.
Sellers’ security choices exhibit the following patterns:
(i) Sellers choose equity roughly two-thirds of the time, regardless of competition levels.
(ii) Demographic characteristics are only weakly correlated with the choice of security; however, subjects who prefer to enter equity-bid auctions as buyers are more likely to choose equity when selling. Sellers’ likelihood of choosing a security increases with the profits generated from its most recent use.
Table 4 reports the results of fixed-effects regressions of security choice on the level of competition and experience. Column (1) shows no significant difference in equity choice rates between Monopolistic and Competitive treatments, providing the evidence for Result 5(i). Column (2) adds experience (round) and its interaction with treatment, revealing that experience increases equity choice in Monopolistic auctions but not in Competitive ones. Controlling for experience, the Competitive treatment shows a positive, though insignificant, effect on equity choice, leading to similar predicted equity rates across treatments by the experiment’s end. Overall, we reject Hypothesis 5. Notably, theory predicts greater gains from equity in monopolistic auctions, but empirically, the opposite occurs—yet sellers choose equity at similar rates in both settings.
Security choice by seller

***,**,* Notes: Linear regression with seller-level fixed-effects and standard errors clustered at the seller level. Within R-Sqd reports the R2 from the subject fixed-effects estimator, based on variation within subjects over rounds after removing seller fixed effects. Significance indicated by: p $ \lt $0.01, p
 $ \lt $0.05, p
 $ \lt $0.1.
Figure 10 shows that while security choice has a negligible effect on revenue generation in Monopolistic auctions, using equities in an auction substantially increases revenue in Competitive auctions. Despite this, sellers only choose to run their auctions using equities about two-thirds of the time regardless of the treatment. This suggests the question: why don’t sellers use equities for their auctions more often? To address this, we investigate the predictors of sellers’ choices.
The evidence for Result 5(ii) can be found in Appendix Table B.6, and a histogram of rates of choosing equity at the subject level can be found in Appendix Figure B.4. We find that the score on the cognitive reflection test is negatively correlated with choosing equity ( $p \lt 0.05$) and reporting to have understood the rules is positively correlated with choosing equity (
 $p \lt 0.10$), but no other collected demographics are significantly correlated with security choice. When regressing sellers’ current choices on their previous experiences as a seller, we find the intuitive relationship that sellers are more likely to use each security if they have recently earned high revenues from using that security. We also find that overbidding rates from the Automated auctions are not significantly correlated with security choices.
The tendency to enter equity auctions as a buyer is a strong predictor of a seller’s choice to run an auction using equity bids. This is surprising, because if sellers see a security as better at extracting surplus, they should be less likely to choose it as buyers.Footnote 20 This contradiction is especially clear in Monopolistic auctions, where sellers don’t benefit from inducing more buyer participation. Additionally, risk aversion should create a negative correlation: equity bids provide buyers with more insurance but increase risk for sellers, so risk-averse subjects preferring equity as buyers would tend to prefer debt as sellers. This inverse extraction-insurance relationship is strongest for debt, which acts like call options for sellers—steep, extracting more surplus, and offering less insurance.
Finally, we consider the effect of the three seller treatments on the distribution of surplus.
Result 6.
On average, Competitive auctions have lower total surplus, lower total revenue, and higher buyer surplus than Monopolistic Auctions.
The evidence for Result 6 can be found in Table 5. As compared to the Automated treatment, the Monopolistic treatment has slightly lower revenue, slightly higher buyer surplus, and slightly higher overall surplus. However, none of these differences are significant even at the 10% level.Footnote 21 On the other hand, Competitive auctions have a substantially and significantly different distribution of surplus than Automated auctions. The differences between Monopolistic and Competitive auctions are significant for revenue and total surplus ( $p \lt 0.01$ and
  $p \lt 0.05$ respectively) while the differences in buyer surplus are not significant (
 $p\approx0.23$). The empirically estimated differences between Monopolistic and Competitive auctions in terms of revenue, buyer surplus, and total surplus (266.5, -111.6, and 154.8, respectively) are close to and not statistically distinguishable from their theoretical counterparts (298.9, -82.2, and 216.7, respectively). Thus, consistent with Hypothesis 6, competition decreases overall efficiency and shifts surplus towards buyers.
Effect of seller treatment on surplus distribution

***,**,* Notes: Linear regression with session-level fixed-effects. Standard errors are clustered at the market level, so each pair of competitive auctions belongs to its own cluster. Significance indicated by: p $ \lt $0.01, p
 $ \lt $0.05, p
 $ \lt $0.1.
6. Concluding remarks
This paper presents a unified experimental framework to study formal security-bid auctions with and without competition. These auctions, common in financial markets, allocate complex projects where sellers verify ex-post revenue to securitize payments. Often, multiple sellers compete for few bidders by choosing security designs, while bidders face costly due diligence. We empirically disentangle how security design and market structure affect (i) auction revenue and efficiency, (ii) sellers’ security choices, (iii) buyers’ entry and bidding, and (iv) correlations between subjects’ buyer and seller decisions.
We differentiate three “seller treatments” that are related to the market structure under which the project is auctioned. In the first treatment, sellers are mechanical and bidders submit their bids in the corresponding security designs, allowing subjects to gain experience using different securities. In the second treatment, a subject plays the role of a seller and must choose whether the two buyers in their auction will make bids using debt or equity. Finally, in the last treatment, two subjects play the role of sellers who must compete for four buyers by means of their security designs. Buyers choose which auctions to enter after observing sellers’ choices but before learning their signals about the potential revenue of the project.
While all auctions suffer inefficiencies from not always awarding the project to the highest-signal bidder, security designs do not affect these inefficiencies differently. Most of the surplus loss from misallocation arises from idiosyncratic bidding noise, with only a smaller portion attributable to mismatches due to systematic differences in bidders’ average bidding behavior.
Buyers overbid in debt auctions across all signals but only overbid on extreme signals in equity auctions. Despite greater overbidding in debt, it does not significantly affect sellers’ revenue. Additionally, bids are insensitive to the number of opponents, consistent with second-price auction theory and ruling out competition-driven aggressive bidding biases.
Finally, we examined subjects’ understanding of the role of security designs for sellers and buyers—an aspect novel to auction literature. We find a moderate correlation between sellers’ security choices and buyers’ entry strategies, contradicting theory, as surplus-extracting securities benefit sellers but harm buyers. This echoes the common overuse of equity in practice, such as in takeovers and venture capital (Kaplan and Strömberg, Reference Kaplan and Strömberg2003; Eckbo et al., Reference Eckbo, Malenko and Thorburn2020). Linear contracts prevail even when complex incentives are optimal (Carroll, Reference Carroll2015). Our results suggest decision makers may have an inherent preference for equity over non-linear securities like debt.
There are some challenges in the interpretation of our results. When observed choices align with theoretical predictions, such as sellers tending to use equity in their auction designs, it is difficult to know whether this reflects optimal responses or an intrinsic preference for equity. In addition, bidding behavior in our data muted differences between securities in monopolistic settings, weakening the prediction that sellers should choose to use equity when there is no competition.
One notable feature of our design is that many elements of the auctions, such as bidding strategies, entry decisions, and security choices, were determined endogenously by subjects. This contrasts with much of the experimental literature, where aside from a single decision margin, other aspects of the environment are fixed at theoretical benchmarks (e.g., Greenleaf (Reference Greenleaf2004) and Davis et al. (Reference Davis, Katok and Kwasnica2011) fix buyer behavior at the theoretical prediction and observe how sellers set reserve prices). Our approach offers greater realism, as decision-makers in practice must respond to potentially biased or non-equilibrium behavior by others, and it allows us to uncover novel patterns such as correlations in security choices across roles. The trade-off is that results are interpreted conditional on behavior in other parts of the market, rather than in isolation. Future work could complement our approach by holding some dimensions fixed at theoretical predictions to further disentangle mechanisms.
Supplementary material
The supplementary material for this article can be found at https://doi.org/10.1017/eec.2025.10034.
Replication material
The replciation package for this article can be found at https://doi.org/10.17605/OSF.IO/X2AR.
Acknowledgements
The data from this experiment was previously presented as part of Hiller’s honours thesis at the University of Queensland, which was supervised by the first two authors. We thank Max Grossmann for sharing excellent code for generating sliders in oTree. The experiment discussed in this paper received ethical approval from UQ’s BEL LNR review panel (project number 2022/HE001555).


 Open access