





Introduction
The rapid expansion of mobile internet technology and massively multiplayer online games (MMOGs) has dramatically reshaped the social and cognitive landscapes of young people. In response to growing concern, the World Health Organization included Gaming Disorder (GD) in the 11th revision of the International Classification of Diseases (ICD-11) as a distinct diagnosis (WHO, 2019), highlighting GD as an emerging public health challenge (Oka et al., Reference Oka, Hamamura, Miyake, Kobayashi, Honjo, Kawato and Chiba2021). Recent large-scale longitudinal cohort studies of Chinese adolescents further indicate that elevated or escalating Internet gaming disorder symptoms prospectively predict a range of adverse mental health outcomes, including increased depression, anxiety, sleep disturbances, and behavioral problems, as well as the onset, persistence and worsening of depressive symptoms, and suicidal ideation (Peng et al., Reference Peng, Chen, Ren, He, Li, Liao and Tang2025a, Reference Peng, Chen, Ren, He, Li, Liao and Liao2025b).
Among the most overlooked yet significant features of GD are impairments in social functioning, including increased social withdrawal, reduced empathy, heightened loneliness, and deteriorating peer relationships (Shoshani, Braverman, & Meirow, Reference Shoshani, Braverman and Meirow2021; Yen, Lin, Wu, & Ko, Reference Yen, Lin, Wu and Ko2022). These difficulties have been linked to both the development and persistence of problematic gaming (Mihara & Higuchi, Reference Mihara and Higuchi2017; Sioni, Burleson, & Bekerian, Reference Sioni, Burleson and Bekerian2017). However, the neurobiological mechanisms that underlie disrupted social interaction in GD, particularly in real-time interpersonal contexts, remain insufficiently understood (Zheng et al., Reference Zheng, Zhang, Tang, Wang, Lin, Bao and Lu2025). Accordingly, clarifying these neurobiological processes is essential for gaining a clearer understanding of GD-related social difficulties.
Neuroimaging studies have identified the prefrontal cortex (PFC) and temporoparietal junction (TPJ) as key regions supporting the social and regulatory processes required for successful interaction (Feng et al., Reference Feng, Eickhoff, Li, Wang, Becker, Camilleri and Luo2021). The TPJ, particularly in the right hemisphere, is a key region of the mentalizing network and supports inferring others’ beliefs and intentions, embodied perspective-taking, and prosocial decision-making, thereby enabling flexible adaptation to social partners (Bitsch et al., Reference Bitsch, Berger, Nagels, Falkenberg and Straube2018; Martin et al., Reference Martin, Kessler, Cooke, Huang and Meinzer2020; Wang et al., Reference Wang, Callaghan, Gooding-Williams, McAllister and Kessler2016). The medial PFC (mPFC) contributes to mentalizing by integrating self-referential processing with self-other distinction, which is essential for interpreting complex interpersonal cues and maintaining coherent representations of social relationships (Finlayson-Short, Davey, & Harrison, Reference Finlayson-Short, Davey and Harrison2020; Smallwood et al., Reference Smallwood, Bernhardt, Leech, Bzdok, Jefferies and Margulies2021). Lateral PFC regions, including the dorsolateral (dlPFC) and ventrolateral (vlPFC) PFC, implement cognitive control operations such as goal maintenance, response inhibition, and top-down emotion regulation that allow behavior to be adjusted to social demands (Berboth & Morawetz, Reference Berboth and Morawetz2021; Mo et al., Reference Mo, Li, Cheng, Li, Xu and Zhang2023; Zhao et al., Reference Zhao, Mo, Bi, He, Chen, Xu and Zhang2021). Consistent with these roles, individuals with gaming disorder show structural and functional abnormalities within the TPJ and these prefrontal subregions, including altered activation and connectivity patterns linked to impulsivity, emotional dysregulation, and biased processing of social and game-related cues (Huang et al., Reference Huang, Guo, Sun, Lu, Shan, Du and Zhao2024; Shin, Kim, Kim, & Kim, Reference Shin, Kim, Kim and Kim2021; Zhang et al., Reference Zhang, Dong, Zhao, Chen, Jiang, Du and Dong2020), suggesting that disruption of PFC–TPJ circuits may play a central role in the social dysfunction observed in GD.
Informed by prior evidence, the present study focuses on the PFC–TPJ circuitry to characterize neural dynamics during social interaction in GD. To capture interactive demands central to online gaming, we employed cooperative and competitive tasks, two fundamental modes of social engagement (Kingsbury & Hong, Reference Kingsbury and Hong2020). During cooperation, individuals coordinate their actions toward shared goals and continuously monitor a partner’s behavior to achieve joint outcomes, whereas during competition, they pursue conflicting goals, attempt to outperform an opponent, and evaluate their status relative to a rival (Qiao et al., Reference Qiao, Li, Huang, Hong, Li, Li and Zhang2025). Both interaction modes require inferring other’s intentions, anticipating behavior, and regulating one’s own responses in light of social feedback, engaging mentalizing, socio-emotional processing of success and failure, and higher-order cognitive control (Lee, Ahn, Kwon, & Kim, Reference Lee, Ahn, Kwon and Kim2018). Compared with nonsocial paradigms that focus on isolated inhibition or reward processing, cooperation and competition more closely resemble the team-based play, rivalry, and social evaluation that characterize online gaming (Verheijen, Stoltz, van den Berg, & Cillessen, Reference Verheijen, Stoltz, van den Berg and Cillessen2019). They, therefore, offer higher ecological validity for probing social dysfunction in GD. Given evidence that GD is also associated with broader cognitive difficulties, assessing cognitive performance alongside neural activity may help clarify individual differences that shape behavior in these interaction contexts (Wang et al., Reference Wang, Yang, Zheng, Li, Wei, Li and Liu2021).
Despite substantial progress in neuroimaging research on GD, several important gaps remain. Most studies have relied on MRI or fMRI methodologies, which restrict natural movement and are susceptible to motion artifacts, limiting the study of neural dynamics during realistic face-to-face interaction (Balachandrasekaran et al., Reference Balachandrasekaran, Cohen, Afacan, Warfield and Gholipour2021; Ciric et al., Reference Ciric, Rosen, Erus, Cieslak, Adebimpe, Cook and Satterthwaite2018). Additionally, task-based research has predominantly focused on reward processing and cue reactivity, with limited exploration of social dimensions (Li et al., Reference Li, Wang, Yang, Dai, Zheng, Sun and Liu2020; Zheng et al., Reference Zheng, Zhang, Tang, Wang, Lin, Bao and Lu2025). Notably, existing literature frequently contrasts GD individuals solely with healthy controls (Chen et al., Reference Chen, Li, Wang, Du and Dong2020; Yan, Li, Yu, & Zhao, Reference Yan, Li, Yu and Zhao2021), neglecting individuals engaged in Hazardous Gaming (HG), who may be on these moderate-risk trajectories and already exhibit emerging psychological and neural vulnerabilities (Griffiths, Reference Griffiths2010; Peng et al., Reference Peng, Chen, Ren, He, Li, Liao and Liao2025c). Including an HG group enables early characterization of neural dysfunction, enhancing potential for early detection and intervention.
To address these gaps, the present study employed functional near-infrared spectroscopy (fNIRS), a neuroimaging technique characterized by high temporal resolution and ecological validity (Pinti et al., Reference Pinti, Tachtsidis, Hamilton, Hirsch, Aichelburg, Gilbert and Burgess2020; Pu et al., Reference Pu, Huang, Li, Li, Shen, Du and Cui2025), to examine cortical activation, functional connectivity, and brain network topology of PFC and TPJ regions, while adolescents and young adults with GD, HG, and healthy controls engaged in cooperative and competitive interaction. We hypothesized that (1) individuals with GD would show poorer performance in cooperation and competition tasks compared to healthy controls, with intermediate impairments observed in HG individuals; (2) during social interaction, GD would show decreased activation and functional connectivity in executive control regions (dlPFC, vlPFC), and increased activation and connectivity in social cognitive regions (TPJ, mPFC); and (3) GD would exhibit disrupted brain network topology, characterized by altered global and local connectivity metrics. Clarifying these mechanisms may improve understanding of social dysfunction in GD and inform the development of targeted early interventions.
Methods
Participants
From 1st November to 24th December, 2023, we recruited 175 subjects through online and offline advertisements in Zhuzhou, Hunan Province, China. All participants included were as follows: (1) right-handed, (2) age ≥12 years old, and (3) hearing/visual acuity or corrected-hearing/visual acuity in the normal range. Exclusion criteria were as follows: (1) diagnosed with other mental disorders under ICD-11 by senior psychiatrists or other diseases that affected cognitive function, such as a history of head trauma, cerebrovascular disease, and epilepsy; (2) use of cognitive-promoting drugs in the last 6 months; and (3) intellectual impairment, IQ < 70.
All participants who met the inclusion criteria and did not meet any exclusion criteria were subsequently evaluated by licensed psychiatrists. Based on clinical interviews and diagnostic assessments conducted in accordance with ICD-11 criteria, participants were classified into one of three groups: Gaming Disorder (GD), Hazardous Gaming (HG), or Healthy Controls (HC) (see Supplementary Methods, S1). The study was approved by the Ethics Committee of the Shanghai Mental Health Center (File number: 2023-63). All procedures complied with the Declaration of Helsinki. Written informed consent was obtained from all adult participants. For participants younger than 18 years, written informed consent was obtained from a parent or legal guardian, and assent was obtained from the adolescent participants.
Scales and cognitive measurement
Scales
Assessment measures included demographic characteristics (e.g., age, gender), gaming-related behaviors (e.g., years of gaming experience, average daily gaming, game genre), gaming screening scales, emotion-related scales, social-related scales, and others.
Gaming disorder was screened using the Chinese version of the Gaming Disorder Screening Scale (GDSS; Lyu et al., Reference Lyu, Chen, Wang, Lu, Ma, Tan and Zhao2022), and diagnoses were confirmed by qualified psychiatrists through structured clinical interviews based on the diagnostic criteria of the ICD-11. Emotional functioning was assessed using the Patient Health Questionnaire-9 (PHQ-9) for depressive symptoms (Costantini et al., Reference Costantini, Pasquarella, Odone, Colucci, Costanza, Serafini and Amerio2021) and the Generalized Anxiety Disorder-7 (GAD-7) for anxiety symptoms (Kim & Lee, Reference Kim and Lee2021). Relational self-esteem was measured with the Relational Self-Esteem Scale (RSES) (Winch, Reference Winch1965), and impulsivity was assessed using the Barratt Impulsiveness Scale (BIS), including its cognitive, motor, and nonplanning subscales (Patton, Stanford, & Barratt, Reference Patton, Stanford and Barratt1995). Social functioning was assessed with the UCLA Loneliness Scale-8 (ULS-8) for loneliness (Hays & DiMatteo, Reference Hays and DiMatteo1987), the Perceived Social Support Scale (PSSS) for perceived support (Zimet, Dahlem, Zimet, & Farley, Reference Zimet, Dahlem, Zimet and Farley1987), the Lubben Social Network Scale-Revised (LSNS-R) for social network size and closeness (Lubben & Gironda, Reference Lubben and Gironda2003), and the Social Interaction Anxiety Scale-6 (SIAS-6) for social anxiety (Mattick & Clarke, Reference Mattick and Clarke1998) (see Supplementary Methods, S2).
Cognitive tasks
Participants completed computerized cognitive assessments via Cogstate (Mielke et al., Reference Mielke, Weigand, Wiste, Vemuri, Machulda, Knopman and Petersen2014). In the present study, four tasks were selected to evaluate specific cognitive domains: Groton Maze Learning Test (GMLT) to assess spatial problem-solving ability, the Two-Back Test (TWB) to assess working memory, the Continuous Paired Associate Learning Task (CPAL) to assess spatial working memory, and the Social-Emotional Cognition Test (SECT) to assess emotion recognition (see Supplementary Methods, S3).
Task design
We used two independent, computer-based behavioral tasks, cooperation, and competition tasks, adapted from Cui, Bryant, and Reiss (Reference Cui, Bryant and Reiss2012) into a Chinese version (Figure 1a). Participants completed both tasks in dyads (pairs), while fNIRS signals were recorded. Each task comprised two blocks separated by a 30-s rest, and each block contained 20 trials. All analyses were conducted at the single-participant level (Cui, Bryant, & Reiss, Reference Cui, Bryant and Reiss2012) (see Supplementary Methods, S4).
Task procedure and fNIRS optode configuration. (a) The procedure of each trial of the cooperation and competition tasks. (b) fNIRS optode layout. Red circles are sources, blue circles are detectors, and gray lines represent constructed channels between them. [All 3-D brain figures edited based on BrainNet Viewer (Xia, Wang, & He, Reference Xia, Wang and He2013)]. 4 ROIs: medial prefrontal cortex: Ch6, Ch7, Ch8, Ch9, Ch12; left ventral lateral prefrontal cortex: Ch2, Ch3, Ch4, Ch5; left dorsolateral prefrontal cortex: Ch1, Ch10, Ch11; and right TPJ: Ch13, Ch14, Ch15, Ch16, Ch17, Ch18, Ch19.

Figure 1. Long description
Panel A contains two horizontal sequences. The top sequence shows a hollow green circle, then a filled green circle labeled PRESS, followed by two black screens labeled WIN plus one plus one and FAIL minus one minus one, each displayed for four thousand milliseconds. The bottom sequence starts with the same hollow and filled green circles, then PRESS, followed by two screens labeled A WIN plus one minus one and B WIN minus one plus one, also for four thousand milliseconds. Both sequences have time intervals of six hundred to fifteen hundred milliseconds before PRESS. Panel B displays two three-dimensional brain renderings. The left brain shows red circles labeled as sources and blue circles as detectors, connected by gray lines labeled Ch1, Ch2, Ch3, Ch4, Ch5, Ch10, Ch11. The right brain shows additional channels Ch6, Ch7, Ch8, Ch9, Ch12, Ch13, Ch14, Ch15, Ch16, Ch17, Ch18, Ch19. Four regions of interest are indicated: medial prefrontal cortex (Ch6, Ch7, Ch8, Ch9, Ch12), left ventral lateral prefrontal cortex (Ch2, Ch3, Ch4, Ch5), left dorsolateral prefrontal cortex (Ch1, Ch10, Ch11), and right T P J (Ch13 to Ch19). All brain renderings are based on BrainNet Viewer.
fNIRS data acquisition
Task-related oxygenated hemoglobin (HbO) and deoxygenated hemoglobin (HbR) changes were measured using NIRSport2 (NIRx, Germany). The fNIRS system recorded at wavelengths of 760 nm and 850 nm, with a sampling rate of 10.1725 Hz. Sixteen optodes (8 sources × 8 detectors) formed 19 channels across four regions of interest (ROIs): medial prefrontal cortex (mPFC), left ventral lateral prefrontal cortex (LvlPFC), left dorsolateral prefrontal cortex (LdlPFC), and right temporoparietal junction (TPJ; Figure 1b).
Data processing
Data preprocessing
Preprocessing utilized Homer2 in MATLAB (v2020b; Huppert, Diamond, Franceschini, & Boas, Reference Huppert, Diamond, Franceschini and Boas2009). Raw data were converted to optical density, corrected for motion artifacts using MARA, and converted to HbO and HbR concentration changes via the modified Beer–Lambert law (PPF = 6.0). Motion artifacts were detected at the channel level using the Homer 2 function hmrMotionArtifactByChannel (tMotion = 1.0, tMask = 1.0, STDEVthresh = 20.0, AMPthresh = 5.0) (Cooper et al., Reference Cooper, Selb, Gagnon, Phillip, Schytz, Iversen and Boas2012; Huang et al., Reference Huang, Guo, Sun, Lu, Shan, Du and Zhao2024; Lu, Wang, Zhan, & Lu, Reference Lu, Wang, Zhan and Lu2025). To reduce the effect of high-frequency systemic physiological noise, such as respiration and heartbeat, and artifacts related to the very low frequency drift, we bandpass filtered signals in 0.01- to 0.09-Hz frequency band (Pinti et al., Reference Pinti, Scholkmann, Hamilton, Burgess and Tachtsidis2019). Supplementary material Table S1 reports, by group, the final N for behavioral and imaging analyses and the group-level average percentage of bad channels. HbO signals were analyzed due to their higher sensitivity and reliability compared to HbR (Fishburn, Norr, Medvedev, & Vaidya, Reference Fishburn, Norr, Medvedev and Vaidya2014).
Brain areas activation
Mean baseline-corrected HbO activation (ΔHbO) was computed per channel during cooperation and competition tasks, relative to resting-state baselines.
Functional connectivity analysis
Pairwise functional connectivity was assessed using Pearson’s correlation coefficients calculated between filtered HbO time series, producing 19 × 19 matrices per participant per task. Values were Fisher Z-transformed to achieve normality (Fisher, Reference Fisher1915).
Construction of networks and graph theoretical analysis
Graph theoretical Network Analysis (GRETNA) toolbox was used for graph theory analysis (Wang et al., Reference Wang, Wang, Xia, Liao, Evans and He2015). The nodes of the graph were defined as fNIRS measurement channels and the edges represented functional connection (Friston, Reference Friston1994). Unweighted and undirected networks were constructed based on correlation (Vecchio et al., Reference Vecchio, Tomino, Miraglia, Iodice, Erra, Di Iorio and Rossini2019). To ensure robustness, graph metrics were integrated across sparsity thresholds (0.1–0.4, step 0.1) using the area under curve (AUC) method (Liu et al., Reference Liu, Li, Zhang, Wang, Wei, Liu and Ding2016; Gregorich, Simpson & Heinze, Reference Gregorich, Simpson and Heinze2024).
We examined the topological properties of functional brain networks using four global and four nodal-level metrics. The global metrics included clustering coefficient (Cp) and characteristic path length (Lp), as well as global efficiency and local efficiency, which reflect the overall topological organization of the brain network. The nodal metrics were used to assess regional network characteristics and included nodal clustering coefficient, nodal efficiency, degree centrality, and betweenness centrality (Rubinov & Sporns, Reference Rubinov and Sporns2010).
Statistical analysis
Statistical analyses employed Python. Demographic and behavioral group differences were examined using ANOVA after verifying normality (Shapiro–Wilk test) and homogeneity of variance (Levene’s test). Pearson correlation analyses explored relationships between behavioral and fNIRS measures. ANOVA compared brain activation, connectivity, and network metrics across groups, with post hoc analyses using Tukey’s HSD tests. We controlled for multiple comparisons using the false discovery rate (FDR), with statistical significance defined as p FDR < 0.05.
Results
Descriptive and behavioral results
All participants were male, with no significant differences in age among the three groups. Participants’ game-genre endorsements were recorded and are summarized by group as counts and percentages in Supplementary material Table S2. Compared to the HG and HC groups, individuals with GD showed significantly higher scores on the SIAS, PHQ-9, GAD-7, ULS, and RSES, as well as significantly lower scores in LSNS (p < 0.05), indicating more severe social anxiety, depression, generalized anxiety, loneliness, lower relational self-esteem, and poorer social interaction. No significant group differences were observed in BIS and PSSS scales (see Table 1).
Demographic and clinical characteristics of GD, HG and HC

Table 1. Long description
From top to bottom, the table lists variables in the first column: Age, GDSS, Gaming year, Gaming days per week, Gaming hours per day, BIS, PSSS, LSNS, SAS, PHQ, GAD, ULS, and RESE. For each variable, the next three columns show mean and standard deviation for GD (N equals 42), HG (N equals 67), and HC (N equals 52). The following columns display F statistic, P value, and eta squared. For Age, means are 18.67 (0.93), 18.85 (1.00), and 18.79 (0.99) with F sub 2,158 equals 0.45, P equals 0.64, eta squared equals 0.01. For GDSS, means are 53.10 (7.67), 39.79 (3.60), 20.23 (3.83), F sub 2,158 equals 512.20, P less than 0.001, eta squared equals 0.87. Gaming year: 9.25 (3.37), 7.51 (2.45), 5.44 (3.33), F sub 2,158 equals 18.93, P less than 0.001, eta squared equals 0.19. Gaming days per week: 6.25 (1.55), 5.25 (2.11), 2.92 (2.15), F sub 2,158 equals 35.94, P less than 0.001, eta squared equals 0.31. Gaming hours per day: 5.07 (2.92), 3.34 (1.69), 2.22 (1.54), F sub 2,158 equals 22.54, P less than 0.001, eta squared equals 0.22. BIS: 83.62 (15.48), 85.88 (10.62), 82.77 (14.61), F sub 2,158 equals 0.87, P equals 0.42, eta squared equals 0.01. PSSS: 57.33 (14.81), 61.12 (10.51), 59.48 (10.95), F sub 2,158 equals 1.17, P equals 0.32, eta squared equals 0.02. LSNS: 26.26 (12.58), 33.08 (9.90), 29.34 (8.95), F sub 2,158 equals 5.17, P equals 0.01, eta squared equals 0.06. SAS: 14.05 (5.14), 9.44 (4.06), 13.04 (4.41), F sub 2,158 equals 14.44, P less than 0.001, eta squared equals 0.15. PHQ: 11.83 (5.76), 2.00 (3.36), 6.87 (4.66), F sub 2,158 equals 52.91, P less than 0.001, eta squared equals 0.40. GAD: 8.21 (5.56), 0.67 (2.02), 4.12 (3.78), F sub 2,158 equals 43.15, P less than 0.001, eta squared equals 0.35. ULS: 20.38 (3.99), 13.42 (4.21), 17.66 (3.69), F sub 2,158 equals 37.78, P less than 0.001, eta squared equals 0.32. RESE: 25.64 (4.25), 31.67 (4.48), 28.63 (4.43), F sub 2,158 equals 21.93, P less than 0.001, eta squared equals 0.22. Notes define all abbreviations: GDSS is Gaming Disorder Screen Scale, BIS is Barratt Impulsiveness Scale, PSSS is Perceived Social Support Scale, LSNS is Abbreviated Lubben Social Network Scale, SAS is Social Anxiety Scale, PHQ is Patient Health Questionnaire, GAD is Generalized Anxiety Disorder, ULS is U C L A Loneliness Scale, RESE is Rosenberg Self-esteem Scale.
Note: GDSS = Gaming Disorder Screen Scale, BIS = Barratt Impulsiveness Scale, PSSS = Perceived Social Support Scale, LSNS = the Abbreviated Lubben Social Network Scale, SAS = Social Anxiety Scale, PHQ = Patient Health Questionnaire, GAD = Generalized Anxiety Disorder, ULS = UCLA Loneliness Scale, RSES = Rosenberg Self-esteem Scale.
Behavioral performance during the cooperation and competition tasks in the fNIRS paradigm was also analyzed. In the competition task, a significant main effect of group was observed for the mean reaction time difference (F (2,169) = 3.80, p = 0.02, η 2 = 0.04), with post hoc analysis revealing a significant difference between the GD group (120.09 ± 105.89 ms) and the HC group (84.50 ± 45.25 ms). No other behavioral measures showed significant group differences (ps > 0.05, see Supplementary material Tables S3 and S4).
Behavioral performance on the Cogstate tasks is summarized in Supplementary material Table S5. A one-way ANOVA revealed a significant main effect of group for legal errors on the GMLT (GMLT_LER) (F (2,145) = 4.04, p = 0.02, η 2 = 0.05). Post hoc comparisons indicated that the HG group (53.45 ± 12.94) made significantly more legal errors than the HC group (46.64 ± 15.26). No significant group differences were observed for performance on the TWB, CPAL, or SECT tasks (see Supplementary material Table S5).
fNIRS results
Cortical activation
In the cooperation task, a significant main effect of group was observed in RTPJ (F (2,165) = 4.34, p FDR = 0.02, η 2 = 0.05). Post hoc Tukey HSD analysis revealed that the GD group (0.68 ± 1.74) exhibited significantly greater activation compared to the HG group (−0.87 ± 3.22, p FDR = 0.01) (see Figure 2a).
Significant group differences in brain activation among GD, HG, and HC groups. (a) Region in the RTPJ shows significant activation differences among the three groups during the cooperation task. (b) Region in the mPFC and RTPJ shows significant activation differences among the three groups in competition task. L, left hemisphere; R, right hemisphere. The color bar denoted the F value of contrast.

Figure 2. Long description
Panel A on the left displays six views of a 3D-rendered brain, with L and R labels marking left and right hemispheres. The top row shows lateral views, the middle row shows medial views, and the bottom row shows dorsal views. Orange to yellow overlays highlight regions in the right temporoparietal junction and left hemisphere, indicating significant activation differences among groups during the cooperation task. Below, a horizontal color bar ranges from negative four point three four (dark red) to positive four point three four (yellow-white), labeled F value of contrast. Panel B on the right mirrors the arrangement, with overlays in the medial prefrontal cortex and right temporoparietal junction during the competition task. Its color bar ranges from negative five point eight one to positive five point eight one. Both panels use identical spatial orientation and color mapping to compare activation patterns across tasks and groups.
In the competition task, a significant main effect of group was found in mPFC (F (2,157) = 3.64, p FDR = 0.03, η 2 = 0.04). Post hoc comparisons indicated that the HG group (0.46 ± 1.77) exhibited significantly greater activation than the HC group (−0.34 ± 1.76, p FDR = 0.03). Furthermore, a significant group effect was observed in RTPJ (F (2,172) = 5.81, p FDR = 0.004, η 2 = 0.06). Post hoc analyses revealed that the GD group (−0.58 ± 2.19) displayed significantly lower activation compared to both the HG group (0.65 ± 1.51, p FDR = 0.003) and the HC group (0.44 ± 2.08, p FDR = 0.02) (see Figure 2b).
Functional connectivity analysis
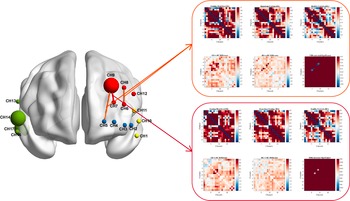
The inter-group correlation matrices for channel connectivity are presented in Figure 3. In the cooperation task, a significant main effect of group was observed for functional connectivity between Channels 6 and 8 (F (2, 103) = 12.25, p FDR < 0.001, η 2 = 0.19). Post hoc Tukey HSD tests revealed that both the GD group (0.96 ± 0.42) and the HG group (0.98 ± 0.48) exhibited significantly stronger connectivity than the HC group (0.48 ± 0.54, p FDR < 0.001). No significant difference was found between the GD and HG groups (p FDR > 0.05).
Group-level functional connectivity and intergroup differences during cooperation and competition tasks. The 3D brain rendering displays channels with significant activation (larger spheres) and significant functional connections (edges). Orange lines indicate significant connections during the cooperative task, while red lines represent those during the competitive task. The right panels show group-level functional connectivity (FC) matrices for the GD, HG, and HC groups, separately for cooperation (top) and competition (bottom) tasks. Corresponding group differences (GD vs. HC, HG vs. HC) and FDR-corrected significance maps (p < 0.05) are also displayed.

Figure 3. Long description
At the center, a 3D rendering of a brain displays spheres labeled C H 1 to C H 17. Spheres vary in size and color: large red spheres at C H 8 and C H 9, green at C H 13 and C H 14, blue at C H 3 to C H 5, and yellow at C H 1, C H 10, and C H 11. Orange lines connect red spheres, indicating significant connections during cooperation, while a red line links C H 8 to C H 10 for competition. Two orange arrows extend rightward to two rectangular panels. The upper panel contains six square matrices: the top row shows group-level functional connectivity for Giving Disorder (G D), Hoarding (H G), and Healthy Controls (H C) during cooperation, each matrix labeled on the top edge, with axes labeled Channels and color bars indicating connectivity strength. The bottom row shows G D versus H C difference, H G versus H C difference, and F D R-corrected significance, with the last matrix highlighting significant channel pairs. The lower panel repeats this structure for the competition task, with corresponding group matrices and difference maps. Each matrix uses a red-blue color scale, with red for higher connectivity and blue for lower. The spatial arrangement emphasizes the mapping between brain regions and connectivity patterns across groups and tasks.
Similarly, a significant main effect of group was identified for functional connectivity between Channels 5 and 9 (F (2, 137) = 9.68, p FDR = 0.001, η 2 = 0.12). Post hoc Tukey HSD tests indicated that both the GD group (0.75 ± 0.47) and the HG group (0.66 ± 0.55) showed significantly greater connectivity compared to the HC group (0.33 ± 0.46, p FDR < 0.01). No significant difference was found between the GD and HG groups (p FDR > 0.05).
In the competition task, a significant main effect of group was observed for functional connectivity between channels 7 and 9 (F (2, 142) = 9.20, p FDR < 0.001, η 2 = 0.11]. Post hoc Tukey HSD tests revealed that the GD group (1.16 ± 0.53) exhibited significantly stronger connectivity than both the HC group (0.63 ± 0.65) and the HG group (0.70 ± 0.59, p FDR < 0.01). No significant difference was found between the HG and HC groups (p FDR > 0.05) (see Figure 3).
Graph theory analysis
Global network metrics. One-way ANOVA revealed no significant main effect of group on the average clustering coefficient (Cp) in either the cooperation task (F (2, 123) = 1.19, p FDR = 0.31, η 2 = 0.02) or the competition task (F (2, 123) = 1.20, p FDR = 0.30, η 2 = 0.02). Characteristic path length (Lp) showed a significant main effect only during cooperation task (F (2, 123) = 6.01, p FDR = 0.003, η 2 = 0.09). Post hoc Tukey HSD tests indicated that the HC group had significantly shorter path lengths compared to the HG group (MD = −0.11, p FDR = 0.04) and the GD group (MD = −0.15, p FDR = 0.002). The group effect was not significant in competition task (F (2, 123) = 1.95, p FDR = 0.15, η 2 = 0.03).
Regarding network efficiency, the main effect of group was not statistically significant for either global efficiency (E glob) or local efficiency (E loc) in both tasks. For the cooperation task, F (2, 123) = 1.70, p FDR = 0.19, η 2 = 0.03 for E glob, and F (2, 123) = 1.33, p FDR = 0.27, η 2 = 0.02 for E loc. For the competition task, F (2, 123) = 1.20, p FDR = 0.31, η 2 = 0.02 for E glob, and F (2, 123) = 1.49, p FDR = 0.23, η 2 = 0.02 for E loc, indicating no statistically significant differences among the three groups.
Nodal network metrics. During the cooperation task, the nodal clustering coefficient (NCp) at channel 13 showed a significant main effect of group (F (2, 123) = 3.79, p FDR = 0.03, η 2 = 0.06), with the HC group exhibiting significantly higher clustering coefficients compared to both the HG group (MD = 0.04, p FDR = 0.05) and the GD group (MD = 0.04, p FDR = 0.05). Nodal efficiency (e) at channel 4 also showed a significant group effect (F (2, 123) = 3.78, p FDR = 0.03, η 2 = 0.06), with the HC group demonstrating significantly higher efficiency than the GD group (MD = 0.03, p FDR = 0.03). Furthermore, at channel 5 (F (2, 123) = 3.65, p FDR = 0.03, η 2 = 0.06), the HC group exhibited significantly higher efficiency than the HG group (MD = 0.03, p FDR = 0.03). Regarding betweenness centrality (b), channel 4 showed a significant main effect of group (F (2, 123) = 4.40, p FDR = 0.01, η 2 = 0.07), with the HC group demonstrating significantly higher centrality than the GD group (MD = 1.42, p FDR = 0.01). Degree centrality (k) followed the similar pattern (F (2, 123) = 3.77, p FDR = 0.03, η 2 = 0.06), with the HC group exhibiting significantly higher values than the GD group (MD = 0.42, p FDR = 0.03) (see Figure 4a).
Group differences in global and nodal network metrics during cooperation and competition tasks. (a) Metrics during cooperation tasks. (b) Metrics during competition tasks. Global metrics: Cp, clustering coefficients; Lp, characteristic path length; E glob, global efficiency; E loc, local efficiency. Nodal metrics: NCp, nodal clustering coefficient; e, nodal efficiency; b, betweenness centrality; k, degree centrality. *p < 0.05, **p < 0.01. The error bars indicate bootstrapped 95% confidence intervals.

Figure 4. Long description
Panel A on the left shows nine bar graphs for cooperation tasks. The top row displays C sub p, L sub p, and E glob, with L sub p and E glob showing significant differences between groups, indicated by single and double asterisks. The middle row shows E loc, N C sub p for Channel 13, and e for Channel 5, with N C sub p and e showing significant group differences. The bottom row shows e, b, and k for Channel 4, with e and b showing significant differences. Panel B on the right shows nine bar graphs for competition tasks. The top row displays C sub p, L sub p, and E glob, with no significant differences. The middle row shows E loc, N C sub p for Channel 8, and N C sub p for Channel 9, with N C sub p for Channel 9 showing a significant difference. The bottom row shows e, b, and k for Channel 4, with b showing a significant difference. All y-axes range from 0 to 1. GD bars are pink, HG bars are orange, and HC bars are blue. Error bars represent bootstrapped 95 percent confidence intervals. Statistical significance is indicated by a single asterisk for p less than 0.05 and double asterisks for p less than 0.01.
During the competition task, the nodal clustering coefficient (NCp) at channel 8 revealed a significant main effect of group (F (2, 123) = 3.27, p FDR = 0.04, η 2 = 0.05). At channel 9, a significant group effect was also found (F (2, 123) = 3.10, p FDR = 0.04, η 2 = 0.05), with post hoc comparisons indicating that the GD group had significantly higher clustering coefficients than the HG group (MD = 0.05, p FDR = 0.04). Nodal efficiency (e) at channel 4 showed a significant effect (F (2, 123) = 3.29, p FDR = 0.04, η 2 = 0.05), with the HC group again demonstrating significantly higher efficiency than the GD group (MD = 0.03, p FDR = 0.04). For betweenness centrality (b), channel 4 showed a significant main effect of group (F (2, 123) = 6.21, p FDR = 0.002, η 2 = 0.09), with the HC group showing significantly higher centrality than both the GD group (MD = 1.36, p FDR = 0.004) and the HG group (MD = 1.23, p FDR = 0.01). Degree centrality (k) at channel 4 also showed a significant group effect (F (2, 123) = 3.59, p FDR = 0.03, η 2 = 0.06), with the HC group exhibiting significantly higher values than the GD group (MD = 0.42, p FDR = 0.04) (see Figure 4b). No significant task effects were observed at the neural level (see Supplementary material Tables S6 and S7).
Correlation analysis
Correlation analysis between cortical activation, functional connectivity, and behavioral scale scores revealed that in the GD group, activation at channel 14 showed significant negative correlations with depressive symptoms (r = −0.62, p FDR < 0.05). In the HG group, functional connectivity between channels 6 and 8 was positively correlated with gaming frequency (r = 0.46, p FDR < 0.05) and with depressive symptoms (r = 0.52, p FDR < 0.05) (see Supplementary material Figure S1).
Discussion
To our knowledge, this study was the first to use fNIRS to uncover neural alterations during social interaction tasks in GD and HG individuals. Key findings revealed changes in cortical activation, functional connectivity, and network topology, particularly in the PFC and TPJ.
Clinically, individuals with GD scored significantly higher than HC on measures of social anxiety, loneliness, depression, and generalized anxiety and significantly lower on overall social interaction scores. These findings align with prior research indicating impaired social-emotional functioning and interpersonal relationships in individuals with GD (González-Bueso et al., Reference González-Bueso, Santamaría, Fernández, Merino, Montero and Ribas2018; Teng et al., Reference Teng, Pontes, Nie, Griffiths and Guo2021; Wang & Cheng, Reference Wang and Cheng2021). Behaviorally, the results provided partial support for Hypothesis 1. Specifically, the GD group exhibited significantly longer reaction time difference during competition, which may reflect impaired executive control, heightened emotional reactivity, or inefficient social-cognitive processing (Luijten et al., Reference Luijten, Schellekens, Kühn, Machielse and Sescousse2017; Shin, Kim, Kim, & Kim, Reference Shin, Kim, Kim and Kim2021). However, no significant group differences were found in other behavioral measures, potentially due to task brevity and limited complexity (Choi et al., Reference Choi, Choi, Jung, Lee, Lee, Park and Kim2024).
At the neural level, the GD group exhibited heightened RTPJ activation during cooperation compared to HG, a pattern that was consistent with Hypothesis 2. Given the TPJ’s role in mentalizing and empathy, this hyperactivation likely represents compensatory engagement under excessive social cognitive demands (Ding et al., Reference Ding, Ou, Yao, Wu, Chen, Shen and Xu2024; Tholen et al., Reference Tholen, Trautwein, Böckler, Singer and Kanske2020; Zhang et al., Reference Zhang, Hu, Li, Zheng, Xiang, Wang and Dong2020). Contrary to expectation, during competition, GD participants showed significantly lower TPJ activation compared to both the HG and HC. Competitive contexts typically involve greater social threat and higher demands on perspective-taking, emotion regulation, and impulse control and, therefore, engage social-cognitive resources differently from cooperative contexts (Lee, Ahn, Kwon, & Kim, Reference Lee, Ahn, Kwon and Kim2018; Lei & Rau, Reference Lei and Rau2023). Within this framework, reduced RTPJ activation in GD may index impaired adaptive mentalizing, diminished sensitivity to others’ intentions, and a lack of motivation for adaptive social strategy adjustments (Ahmad et al., Reference Ahmad, Zorns, Chavarria, Brenya, Janowska and Keenan2021; Zhang et al., Reference Zhang, Liu, Pelowski, Jia and Yu2017). Overall, the transition from TPJ hyperactivation in individuals with HG to TPJ hypoactivation in those with GD may represent a neurofunctional alteration that serves as a potential biomarker of progression along the gaming-related clinical continuum. Notably, decreased TPJ activation was associated with more severe depressive symptoms, suggesting that TPJ hypoactivation may capture cognitive-affective deficits central to pathological gaming behaviors.
Participants in the HG group demonstrated elevated medial prefrontal cortex (mPFC) activation during competition relative to HC. Hyperactivation in mPFC has previously been linked to craving, impulsivity, maladaptive reward evaluation, and disrupted cognitive control across various addictive disorders (Clark, Boileau, & Zack, Reference Clark, Boileau and Zack2019; Kim et al., Reference Kim, Kim, Shin, Kim, Kwon and Kim2021; Zhang et al., Reference Zhang, Liu, Pelowski, Jia and Yu2017). Enhanced mPFC activation under competitive pressure in HG individuals may reflect intensified self-focus, heightened reward sensitivity, and amplified socio-emotional reactivity, indicative of elevated cognitive load from social evaluative processes (Christian et al., Reference Christian, Kaiser, Taylor, George, Schütz-Bosbach and Soutschek2024; DiMenichi & Tricomi, Reference DiMenichi and Tricomi2017).
Functional connectivity analyses provided additional insights into neural alterations underpinning social dysfunction in GD and HG. During cooperation, both the GD and HG groups exhibited stronger intra-mPFC connectivity than the HC group. Additionally, increased connectivity was observed between the vlPFC and mPFC. The mPFC is integral to self-referential processing, mentalizing, and decision-making (De Pisapia, Barchiesi, Jovicich, & Cattaneo, Reference De Pisapia, Barchiesi, Jovicich and Cattaneo2019; Meyer & Lieberman, Reference Meyer and Lieberman2018), while the vlPFC supports inhibitory control and emotion regulation (Yu et al., Reference Yu, Li, Cao, Mo, Chen and Zhang2023). The heightened connectivity within these prefrontal regions likely reflects compensatory recruitment to manage the cognitive demands of social interaction, indicating inefficient resource allocation (Han et al., Reference Han, Kim, Bae, Renshaw and Anderson2017). Typically, the default mode network (centered around mPFC) and executive control network (involving vlPFC) are negatively correlated (Geng et al., Reference Geng, Xu, Aleman, Qin and Luo2024). Hyperconnectivity between these networks has been documented in various neurodevelopmental and neuropsychiatric conditions, including autism (Anderson et al., Reference Anderson, Nielsen, Froehlich, DuBray, Druzgal, Cariello and Lainhart2011), Down syndrome (Anderson et al., Reference Anderson, Nielsen, Ferguson, Burback, Cox, Dai and Korenberg2013), and schizophrenia (Whitfield-Gabrieli et al., Reference Whitfield-Gabrieli, Thermenos, Milanovic, Tsuang, Faraone, McCarley and Seidman2009). Overall, these connectivity patterns partially supported Hypothesis 2. In line with this, stronger prefrontal network connectivity in the HG group was correlated with higher gaming frequency and greater depressive symptomatology.
During competitive interactions, GD individuals also displayed stronger intra-mPFC connectivity compared to HG and HC groups, potentially reflecting intensified self-referential cognition, increased immersion in gaming roles, heightened reward craving, and maladaptive cognitive control under competitive pressure (Gerfo et al., Reference Gerfo, Gallucci, Morese, Vergallito, Ottone, Ponzano and Lauro2019; Zhang et al., Reference Zhang, Chen, Jiang, Dong, Zhao, Du and Dong2021). Prior studies have consistently associated excessive mPFC connectivity with craving, impulsivity, and distorted reward processing in addictive disorders (Kim et al., Reference Kim, Kim, Shin, Kim, Kwon and Kim2021; Yang et al., Reference Yang, Wang, Shao, Yang, Tang, Luo and Yuan2021). Thus, these findings underscore mPFC dysfunction as a crucial factor driving social maladaptation and compulsive gaming behaviors.
From a network-analytic perspective, characteristic path length differed across groups during the cooperation condition, indicating diminished network integration efficiency under socially collaborative demands in GD and HG (Park et al., Reference Park, Chun, Cho, Jung, Choi and Kim2017; Zhai et al., Reference Zhai, Luo, Qiu, Kang, Liu, Yu and Yuan2017). In contrast, the clustering coefficient and global and local efficiency showed no significant group differences. This pattern aligns with findings in other addictive disorders and may indicate that functional network alterations in GD are relatively subtle (Sjoerds et al., Reference Sjoerds, Stufflebeam, Veltman, Van den Brink, Penninx and Douw2017; Wee et al., Reference Wee, Zhao, Yap, Wu, Shi, Price and Shen2014). Regionally, the RTPJ in the GD group displayed decreased nodal clustering coefficients, indicating impaired local specialization and efficiency potentially underlying social-cognitive deficits (Bitsch et al., Reference Bitsch, Berger, Nagels, Falkenberg and Straube2021). Furthermore, vlPFC demonstrated reduced nodal efficiency, betweenness centrality, and degree centrality, pointing to diminished emotional and social regulation (Chen et al., Reference Chen, Cao, Mao, Sun, Song and Mao2022). Taken together, these findings provided support for Hypothesis 3. Accordingly, targeted interventions addressing these specific neural alterations could be pivotal for early prevention and treatment.
Several limitations warrant consideration. First, fNIRS cannot access deep cortical or subcortical regions crucial for social cognition, necessitating future studies employing imaging modalities with higher spatial resolution. Second, given the higher prevalence of GD in males (Mihara & Higuchi, Reference Mihara and Higuchi2017), only male participants were included, which may limit the generalizability of the results. Future research should incorporate gender-diverse samples to elucidate sex-specific neural mechanisms in GD (Grace et al., Reference Grace, Rossetti, Allen, Batalla, Bellani, Brambilla and Lorenzetti2021). Moreover, although all self-report scales showed acceptable internal consistency in our adolescent and young adult sample, most were originally developed for adults and age-related differences in measurement properties cannot be excluded. Finally, the cross-sectional design precludes causal inference regarding PFC and TPJ alterations in the development of GD (Zhou et al., Reference Zhou, Montag, Sariyska, Lachmann, Reuter, Weber and Becker2019). Longitudinal studies are warranted to elucidate the causal pathways underlying these neural changes and their impact on the progression of GD.
Conclusion
This study systematically investigated brain activation, functional connectivity, and network topology during social interaction in individuals with GD and HG using fNIRS, a method with high ecological validity. Results revealed abnormalities in activation and functional connectivity in key brain regions associated with executive control and mentalizing processes (PFC, TPJ), along with disrupted network topology. These neural abnormalities were significantly associated with indices of impaired social functioning, thereby delineating a clinically meaningful neurofunctional profile of social dysfunction in gaming-related populations. Task-evoked PFC–TPJ activation patterns and functional connectivity may represent candidate neural features. With further longitudinal and clinical validation, these fNIRS-derived indices could serve as auxiliary neurobiological markers that complement conventional clinical assessments when integrated with behavioral measures of social functioning. Such multimodal information may help clinicians conduct more fine-grained risk stratification, support early identification of individuals at elevated risk along the gaming-related clinical continuum, and provide objective, quantifiable endpoints for monitoring treatment response in GD and HG. Within this diagnostic and monitoring framework, the observed neurofunctional profiles also point to potential intervention directions. For example, social-cognitive and executive-control training, as well as noninvasive neuromodulatory approaches designed to strengthen functional integration between the PFC and TPJ, may be explored as individualized targets to reduce social-cognitive difficulties and improve everyday social functioning in individuals with problematic gaming.
Supplementary material
The supplementary material for this article can be found at http://doi.org/10.1017/S0033291726104176.
Data availability statement
The data that support the findings of this study are available from the corresponding author upon reasonable request.
Acknowledgments
We thank all participants.
Author contribution
Zipan Wang: conceptualization, data curation, formal analysis, investigation, methodology, resources, software, writing – original draft, and writing – review and editing. Chuanning Huang: conceptualization, data curation, formal analysis, investigation, methodology, resources, software, writing – original draft, and writing – review and editing. Haidi Shan: conceptualization, investigation, methodology, software, validation, and writing – review and editing. Yue Wang: investigation, methodology, software, validation, and writing – review and editing. Shuo Li: investigation, methodology, validation, and writing – review and editing. Lei Guo: data curation, methodology, validation, and writing – review and editing. Xuechan Lyu: data curation, investigation, software, and writing – review and editing. Yifu Chen: investigation, resources, and writing – review and editing. Yuhui Zeng: investigation, resources, and writing – review and editing. Hang Su: project administration, resources, supervision, and writing – review and editing. Tianzhen Chen: project administration, resources, supervision, and writing – review and editing. Jiang Du: project administration, resources, supervision, and writing – review and editing. Haifeng Jiang: project administration, resources, and supervision. Mengqiao Deng: investigation and resources. Xifeng Wen: investigation and resources. Min Zhao: conceptualization, funding acquisition, project administration, resources, supervision, and writing – review and editing. Na Zhong: conceptualization, funding acquisition, project administration, resources, supervision, and writing – review and editing.
Funding statement
This work was supported by STI2030-major projects (2022ZD0211100), National Nature Science Foundation (82171485, 82130041), Shanghai Clinical Research Center for Mental Health (19MC1911100), and Shanghai Municipal Health Commission Talent Project (GWVI-11.2-XD26).
Ethical standard
All procedures performed in the study involving human participants were in accordance with the ethical standards of the institutional research committee and with the 1964 Helsinki Declaration and its later amendments or comparable ethical standards. This study was approved by the Ethics Committee of Shanghai Mental Health Center (File number: 2023-63). We confirmed that all methods were carried out in accordance with relevant guidelines and regulations.
Declarations of interests
The authors have no relevant financial or nonfinancial interests to disclose.
Consent to participate
Informed consent was obtained from all individual participants included in the study.
Consent to publish
Participants signed informed consent regarding publishing their data.




 Open access

